mission possible - north carolina general assembly · mission possible . guilford county schools...
TRANSCRIPT

MISSION POSSIBLE GUILFORD COUNTY SCHOOLS
February 25, 2014
Guilford County Schools
Dr. Amy Holcombe Executive Director of Talent Development Mission Possible GCS Alternative
Certification Track (in-house licensure)
Recruitment and Selection

Program Purpose
Recruit, reward and retain effective teachers in highly impacted schools for the purpose of increasing student achievement.
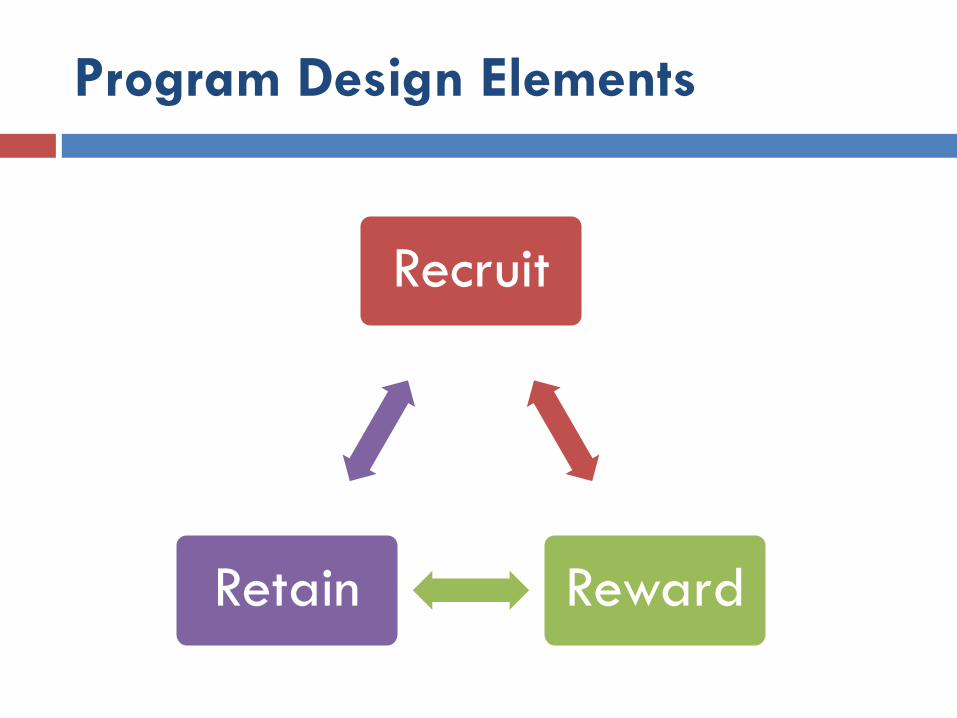
Recruit
Reward Retain
Program Design Elements

Recruitment Activities
Historically High Value Added Data Recruitment Spot Bonus of $5,000
Hard-to-Staff Position Incentives of $2,500 to $5,000 each year
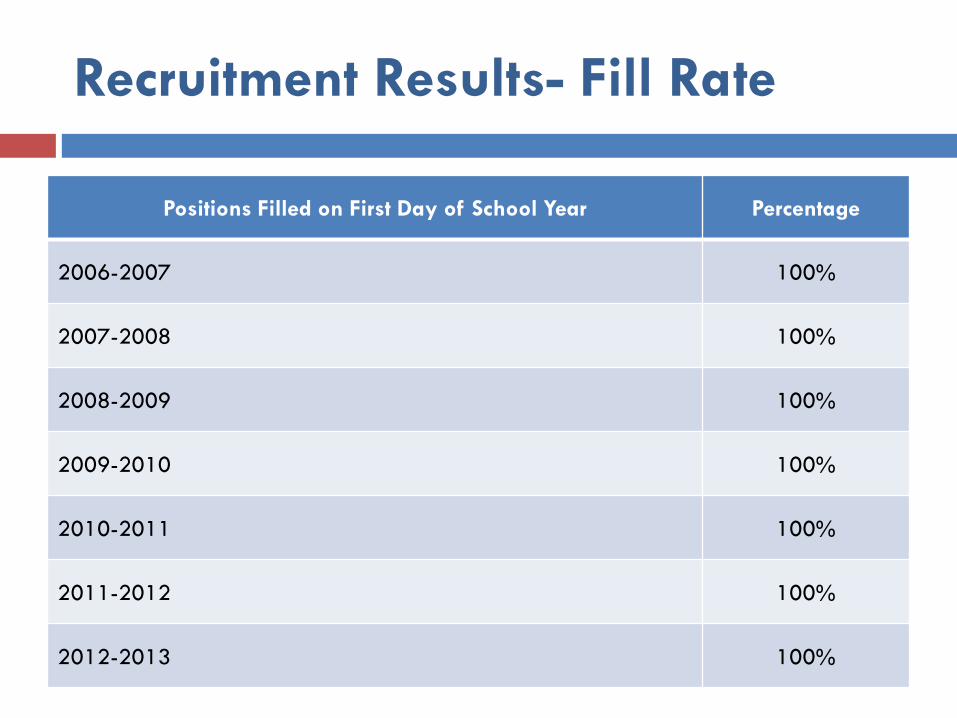
Recruitment Results- Fill Rate
Positions Filled on First Day of School Year Percentage
2006-2007 100%
2007-2008 100%
2008-2009 100%
2009-2010 100%
2010-2011 100%
2011-2012 100%
2012-2013 100%
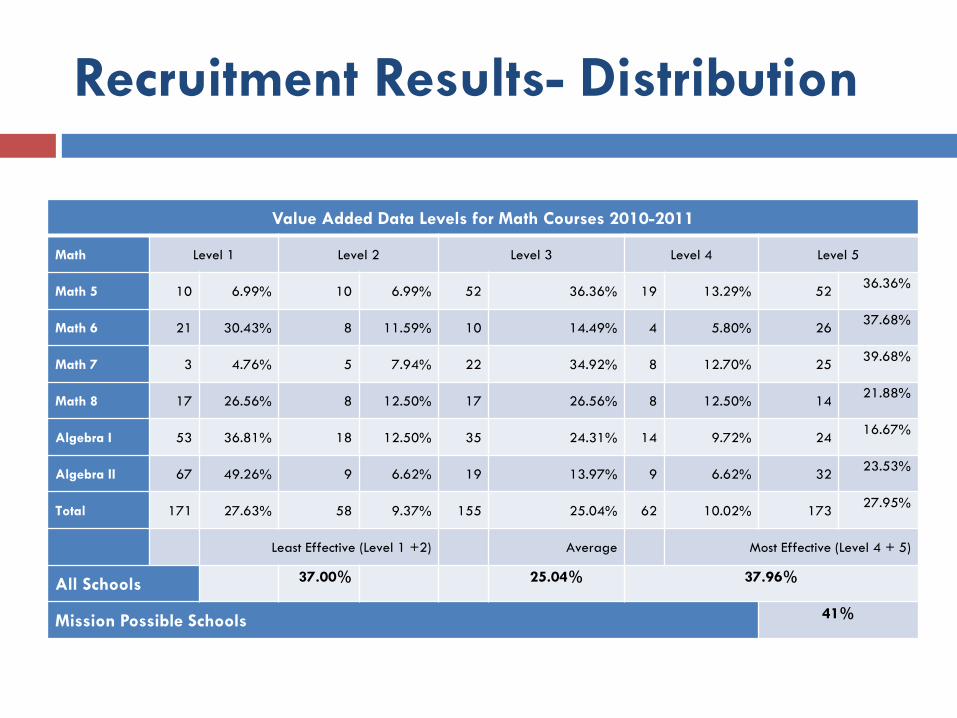
Recruitment Results- Distribution
Value Added Data Levels for Math Courses 2010-2011
Math Level 1 Level 2 Level 3 Level 4 Level 5
Math 5 10 6.99% 10 6.99% 52 36.36% 19 13.29% 52 36.36%
Math 6 21 30.43% 8 11.59% 10 14.49% 4 5.80% 26 37.68%
Math 7 3 4.76% 5 7.94% 22 34.92% 8 12.70% 25 39.68%
Math 8 17 26.56% 8 12.50% 17 26.56% 8 12.50% 14 21.88%
Algebra I 53 36.81% 18 12.50% 35 24.31% 14 9.72% 24 16.67%
Algebra II 67 49.26% 9 6.62% 19 13.97% 9 6.62% 32 23.53%
Total 171 27.63% 58 9.37% 155 25.04% 62 10.02% 173 27.95%
Least Effective (Level 1 +2) Average Most Effective (Level 4 + 5)
All Schools 37.00% 25.04% 37.96%
Mission Possible Schools 41%

Recruitment Results- Distribution
Value Added Data Levels for Reading and English Courses 2010-2011
ELA Level 1 Level 2 Level 3 Level 4 Level 5
Reading 5 2 1.43% 16 11.43% 92 65.71% 19 13.57% 11 7.86%
Reading 6 1 1.45% 4 5.80% 32 46.38% 12 17.39% 20 28.99%
Reading 7 1 1.59% 3 4.76% 29 46.03% 18 28.57% 12 19.05%
Reading 8 5 7.58% 7 10.61% 45 68.18% 7 10.61% 2 3.03%
English I 3 3.57% 3 3.57% 46 54.76% 17 20.24% 15 17.86%
Total 12 2.84% 33 7.82% 244 57.82% 73 17.30% 60 14.22%
Least Effective (Level 1 +2) Average Most Effective (Level 4 + 5)
All Schools 10.7% 57.8% 31.5%
Mission Possible Schools 39.0%

Rewarding Activities
Individual performance incentives from $2,000 to $15,000 based upon VAD
School-wide performance incentives from $750 to $1,500 based upon VAD

Rewarding Results- Elementary
PERCENT PROFICIENT ON READING, MATH AND SCIENCE Elementary School 07-08 08-09 09-10 10-11 11-12 Growth Bessemer Elementary 35.8 50.8 53.2 60.6 56.3 20.5 Ceasar Cone Elementary 40.9 53.7 55.7 54.3 45.7 4.8 Fairview Elementary 45.1 40.9 49.6 56.2 58.3 13.2 Gillespie Park Elementary 35.3 45 59.2 66.8 63.8 28.5 Julius I Foust Elementary 42 46.2 50 56.2 50.9 8.9 Kirkman Park Elementary 34.2 50 59.7 63 69.7 35.5 Oak Hill Elementary 24.9 29.7 45.8 65.2 70.2 45.3 Parkview Village Elementary 40.1 37.9 44.5 40.8 47.6 7.5 Union Hill Elementary 51.6 55.7 44.9 54.2 53.2 1.6 W M Hampton Elementary 31.5 41.3 52.9 61.3 55.4 23.9 Waldo C Falkener 43.1 51.8 57.8 59.7 66.9 23.8 Washington Montessori School 49 54.6 55.7 64.6 67.2 18.2 Wiley Elementary 38.5 39.3 41.4 52 70.7 32.2 Average Growth 18.2
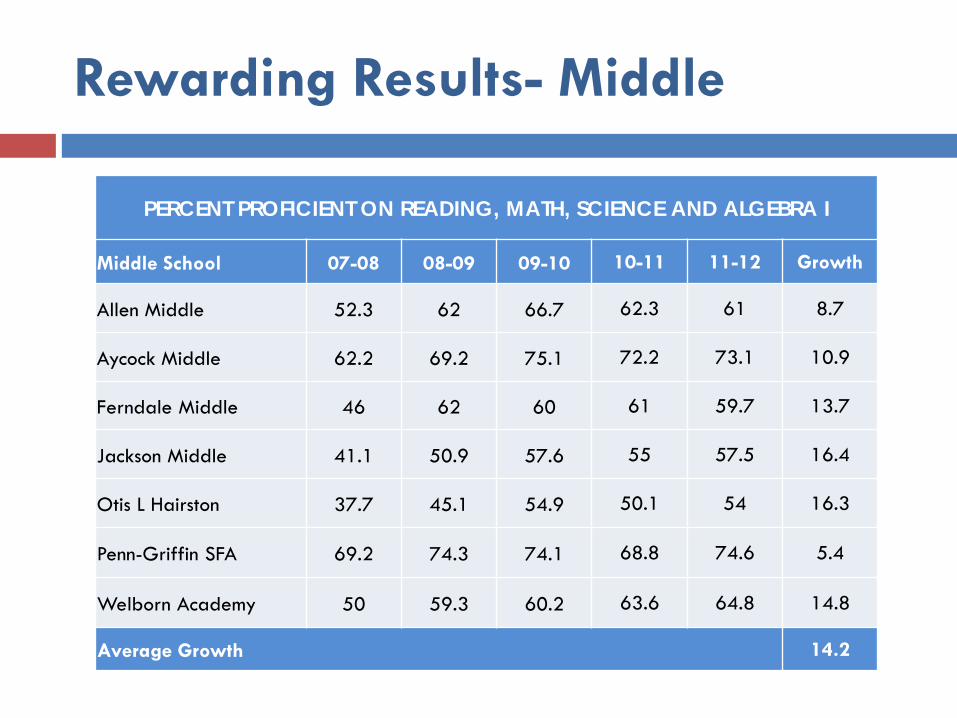
Rewarding Results- Middle
PERCENT PROFICIENT ON READING, MATH, SCIENCE AND ALGEBRA I
Middle School 07-08 08-09 09-10 10-11 11-12 Growth
Allen Middle 52.3 62 66.7 62.3 61 8.7
Aycock Middle 62.2 69.2 75.1 72.2 73.1 10.9
Ferndale Middle 46 62 60 61 59.7 13.7
Jackson Middle 41.1 50.9 57.6 55 57.5 16.4
Otis L Hairston 37.7 45.1 54.9 50.1 54 16.3
Penn-Griffin SFA 69.2 74.3 74.1 68.8 74.6 5.4
Welborn Academy 50 59.3 60.2 63.6 64.8 14.8
Average Growth 14.2
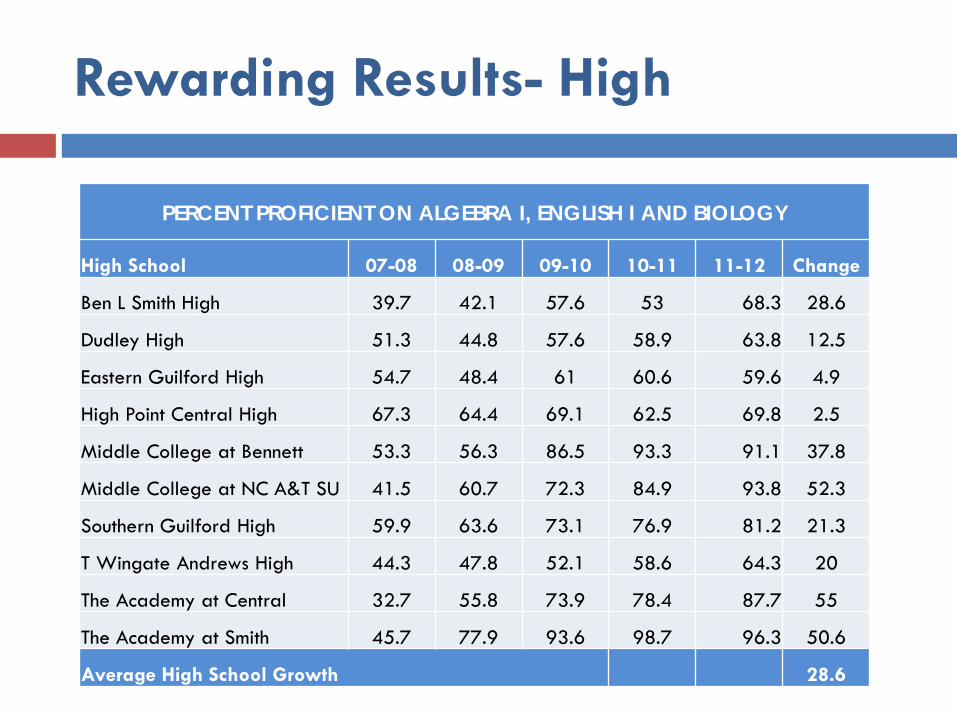
Rewarding Results- High
PERCENT PROFICIENT ON ALGEBRA I, ENGLISH I AND BIOLOGY
High School 07-08 08-09 09-10 10-11 11-12 Change Ben L Smith High 39.7 42.1 57.6 53 68.3 28.6 Dudley High 51.3 44.8 57.6 58.9 63.8 12.5 Eastern Guilford High 54.7 48.4 61 60.6 59.6 4.9 High Point Central High 67.3 64.4 69.1 62.5 69.8 2.5 Middle College at Bennett 53.3 56.3 86.5 93.3 91.1 37.8 Middle College at NC A&T SU 41.5 60.7 72.3 84.9 93.8 52.3 Southern Guilford High 59.9 63.6 73.1 76.9 81.2 21.3 T Wingate Andrews High 44.3 47.8 52.1 58.6 64.3 20 The Academy at Central 32.7 55.8 73.9 78.4 87.7 55 The Academy at Smith 45.7 77.9 93.6 98.7 96.3 50.6 Average High School Growth 28.6

Rewarding Results- Graduation Rates
74.0%
79.7% 79.7% 79.9% 80.7%
83.1% 84.5%
86.2%
2006 2007 2008 2009 2010 2011 2012 201366.0%68.0%70.0%72.0%74.0%76.0%78.0%80.0%82.0%84.0%86.0%88.0%
Retention Activities
Individual and school-wide need targeted professional development
Teacher Leader Roles, $2,000 - Model Classroom - EVAAS Experts - Peer Evaluators - Professional Developers
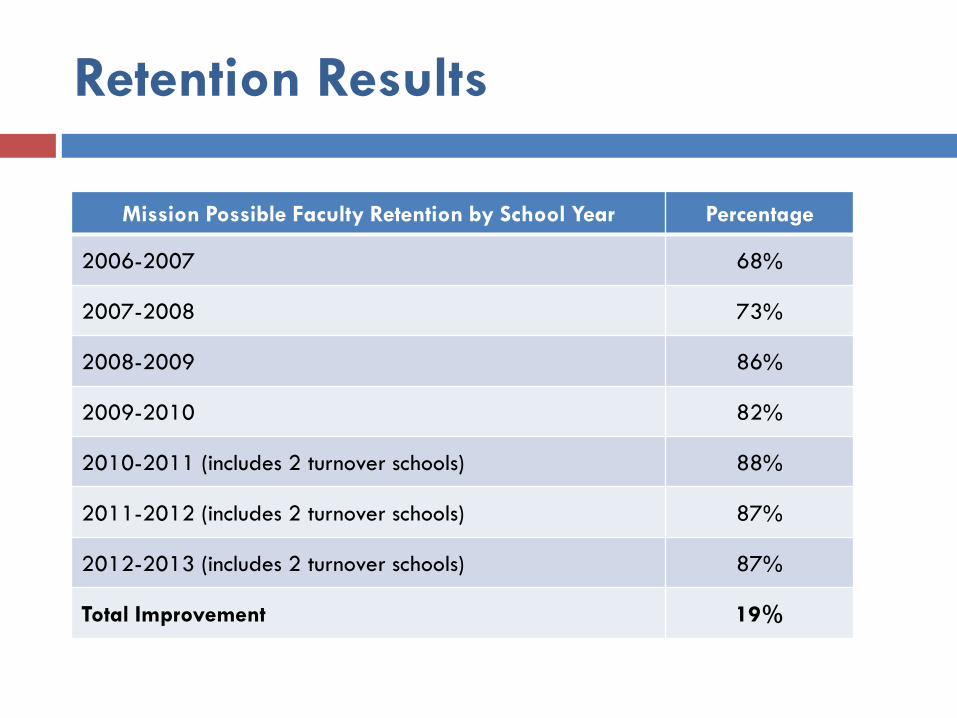
Retention Results
Mission Possible Faculty Retention by School Year Percentage
2006-2007 68%
2007-2008 73%
2008-2009 86%
2009-2010 82%
2010-2011 (includes 2 turnover schools) 88%
2011-2012 (includes 2 turnover schools) 87%
2012-2013 (includes 2 turnover schools) 87%
Total Improvement 19%

Questions and Discussion