missouri farm land values opinion survey – 2017 -...
TRANSCRIPT
Missouri Farm Land Values Opinion Survey – 2017 Ray Massey and Hannah McClure
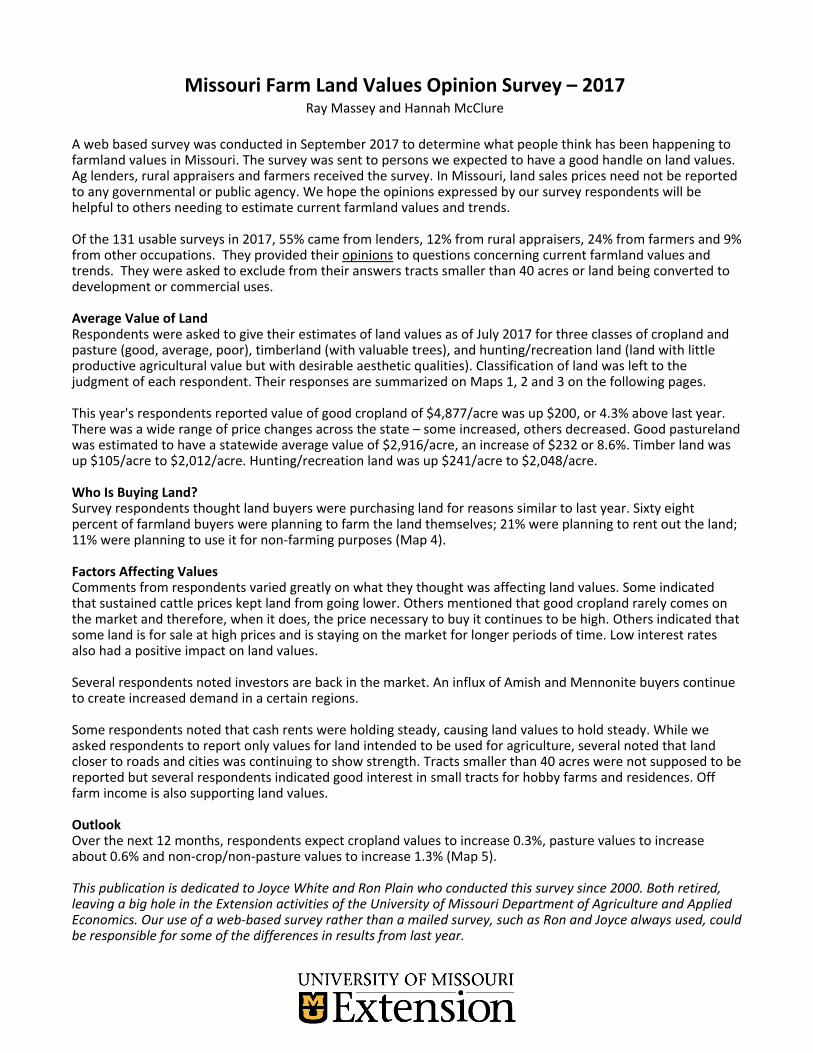
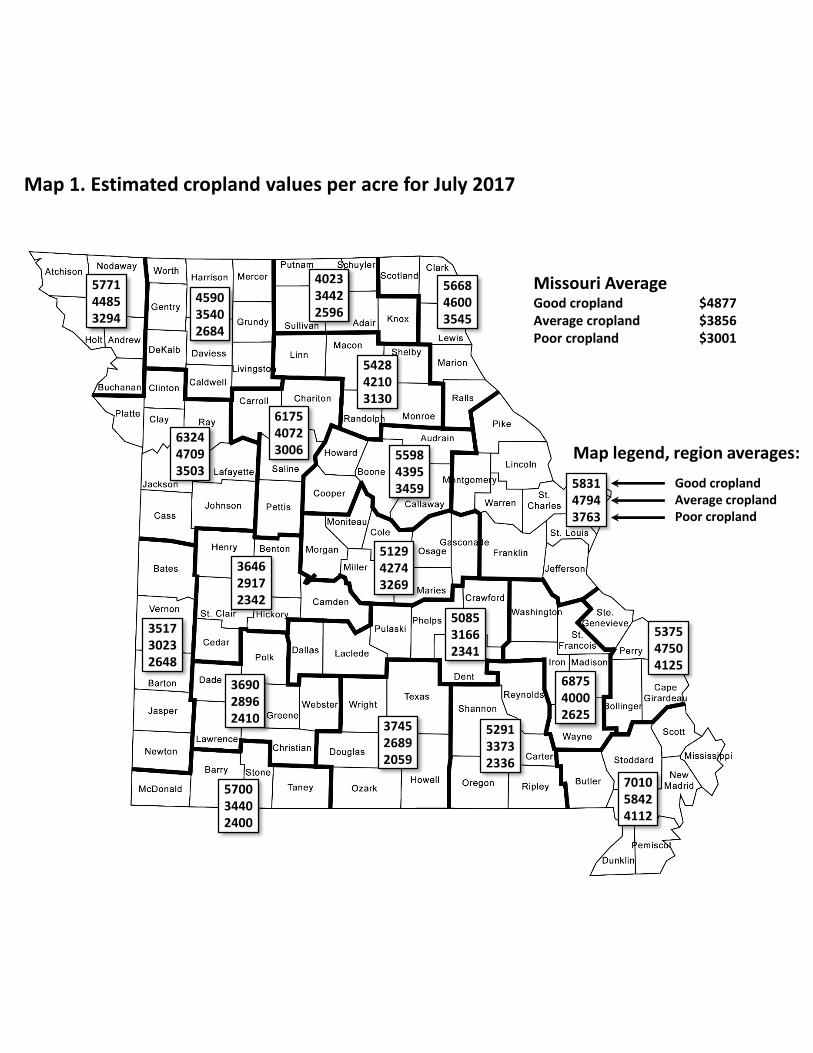
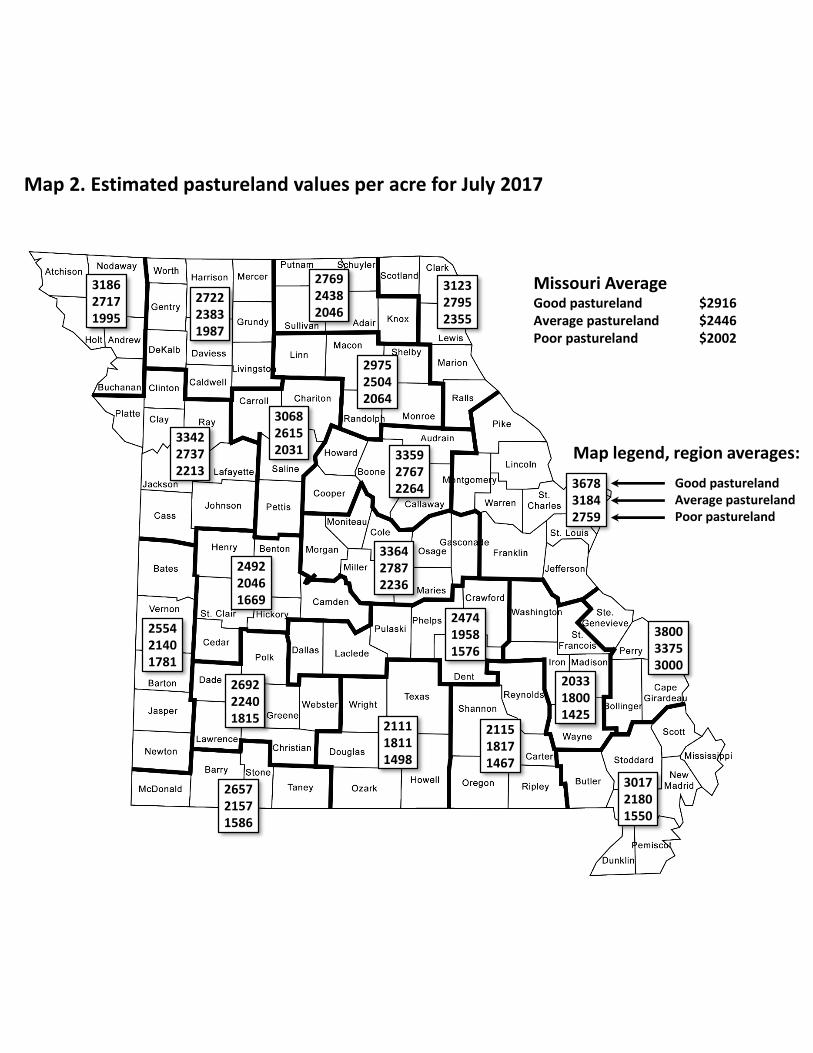
A web based survey was conducted in September 2017 to determine what people think has been happening to farmland values in Missouri. The survey was sent to persons we expected to have a good handle on land values. Ag lenders, rural appraisers and farmers received the survey. In Missouri, land sales prices need not be reported to any governmental or public agency. We hope the opinions expressed by our survey respondents will be helpful to others needing to estimate current farmland values and trends. Of the 131 usable surveys in 2017, 55% came from lenders, 12% from rural appraisers, 24% from farmers and 9% from other occupations. They provided their opinions to questions concerning current farmland values and trends. They were asked to exclude from their answers tracts smaller than 40 acres or land being converted to development or commercial uses. Average Value of Land Respondents were asked to give their estimates of land values as of July 2017 for three classes of cropland and pasture (good, average, poor), timberland (with valuable trees), and hunting/recreation land (land with little productive agricultural value but with desirable aesthetic qualities). Classification of land was left to the judgment of each respondent. Their responses are summarized on Maps 1, 2 and 3 on the following pages. This year's respondents reported value of good cropland of $4,877/acre was up $200, or 4.3% above last year. There was a wide range of price changes across the state – some increased, others decreased. Good pastureland was estimated to have a statewide average value of $2,916/acre, an increase of $232 or 8.6%. Timber land was up $105/acre to $2,012/acre. Hunting/recreation land was up $241/acre to $2,048/acre. Who Is Buying Land? Survey respondents thought land buyers were purchasing land for reasons similar to last year. Sixty eight percent of farmland buyers were planning to farm the land themselves; 21% were planning to rent out the land; 11% were planning to use it for non-farming purposes (Map 4). Factors Affecting Values Comments from respondents varied greatly on what they thought was affecting land values. Some indicated that sustained cattle prices kept land from going lower. Others mentioned that good cropland rarely comes on the market and therefore, when it does, the price necessary to buy it continues to be high. Others indicated that some land is for sale at high prices and is staying on the market for longer periods of time. Low interest rates also had a positive impact on land values. Several respondents noted investors are back in the market. An influx of Amish and Mennonite buyers continue to create increased demand in a certain regions. Some respondents noted that cash rents were holding steady, causing land values to hold steady. While we asked respondents to report only values for land intended to be used for agriculture, several noted that land closer to roads and cities was continuing to show strength. Tracts smaller than 40 acres were not supposed to be reported but several respondents indicated good interest in small tracts for hobby farms and residences. Off farm income is also supporting land values. Outlook Over the next 12 months, respondents expect cropland values to increase 0.3%, pasture values to increase about 0.6% and non-crop/non-pasture values to increase 1.3% (Map 5). This publication is dedicated to Joyce White and Ron Plain who conducted this survey since 2000. Both retired, leaving a big hole in the Extension activities of the University of Missouri Department of Agriculture and Applied Economics. Our use of a web-based survey rather than a mailed survey, such as Ron and Joyce always used, could be responsible for some of the differences in results from last year.
577144853294
542842103130
402334422596
566846003545
632447093503
617540723006 5598
43953459
512942743269
364629172342
351730232648
570034402400
374526892059
Good croplandAverage croplandPoor cropland
529133732336
583147943763
687540002625
537547504125
701058424112
459035402684
508531662341
Map legend, region averages:
Missouri AverageGood cropland $4877Average cropland $3856Poor cropland $3001
369028962410
Map 1. Estimated cropland values per acre for July 2017
318627171995
297525042064
276924382046
312327952355
334227372213
306826152031 3359
27672264
336427872236
249220461669
255421401781
265721571586
211118111498
Good pasturelandAverage pasturelandPoor pastureland
211518171467
367831842759
203318001425
380033753000
301721801550
272223831987
247419581576
Map legend, region averages:
Missouri AverageGood pastureland $2916Average pastureland $2446Poor pastureland $2002
269222401815
Map 2. Estimated pastureland values per acre for July 2017

20022269
25582285
20152050
25232291
22212114
21901977
25802426
186119381427
1427
17601947
18791793
13611300
Timber landHunting/recreation land
14311196
24133137
1367892
23753450
13581531
20532009
14501459
Map legend, region averages:
Missouri AverageTimber land $2012Hunting/recreation land $2048
17601742
Map 3. Estimated timber and hunting/recreation land values per acre for July 2017
63%27%10%
67%24%9%
68%28%5%
66%31%3%
63%27%10%
66%26%8% 56%
34%10%
76%12%12%
72%15%13%
78%17%5%
82%3%
15%
80%3%
17%
Operate farm themselvesRent it outNot use for ag production
67%10%23%
52%39%9%
44%10%46%
53%28%20%
73%25%2%
62%30%7%
69%9%
22%
Map legend, region averages:
Missouri AverageOperate farm themselves 68%Rent it out 21%Not use for ag production 11%
76%10%14%
Map 4. Use to be made of farmland purchased in 2017

-1.9%-1.5%-0.4%
-1.3%-0.5%+1.2%
+1.4%-0.1%+0.5%
-2.5%-4.1%+0.2%
-0.7%-1.1%+1.6%
-0.1%-1.1%+0.2% -0.8%
+0.4%+1.4%
-0.6%+2.6%+1.7%
+3.4%+1.5%+0.5%
+0.8%+0.6%+1.7%
+2.9%+2.9%+2.4%
+2.3%+2.9%+2.4%
CroplandPasturelandNon-crop/non-pasture
+2.4%+3.5%+2.8%
-2.4%-1.1%+0.1%
+4.7%+2.8%+4.0%
-1.0%+1.5%+2.5%
+0.4%+0.2%+0.0%
-0.5%+0.6%+0.3%
+2.9%+4.2%+3.9%
Map legend, region averages:
Missouri Average ChangeCropland +0.3%Pastureland +0.6%Non-crop/non-pasture +1.3%
+1.6%+2.1%+2.6%
Map 5. Forecasted percent change in Missouri farmland values between July 2017 and July 2018
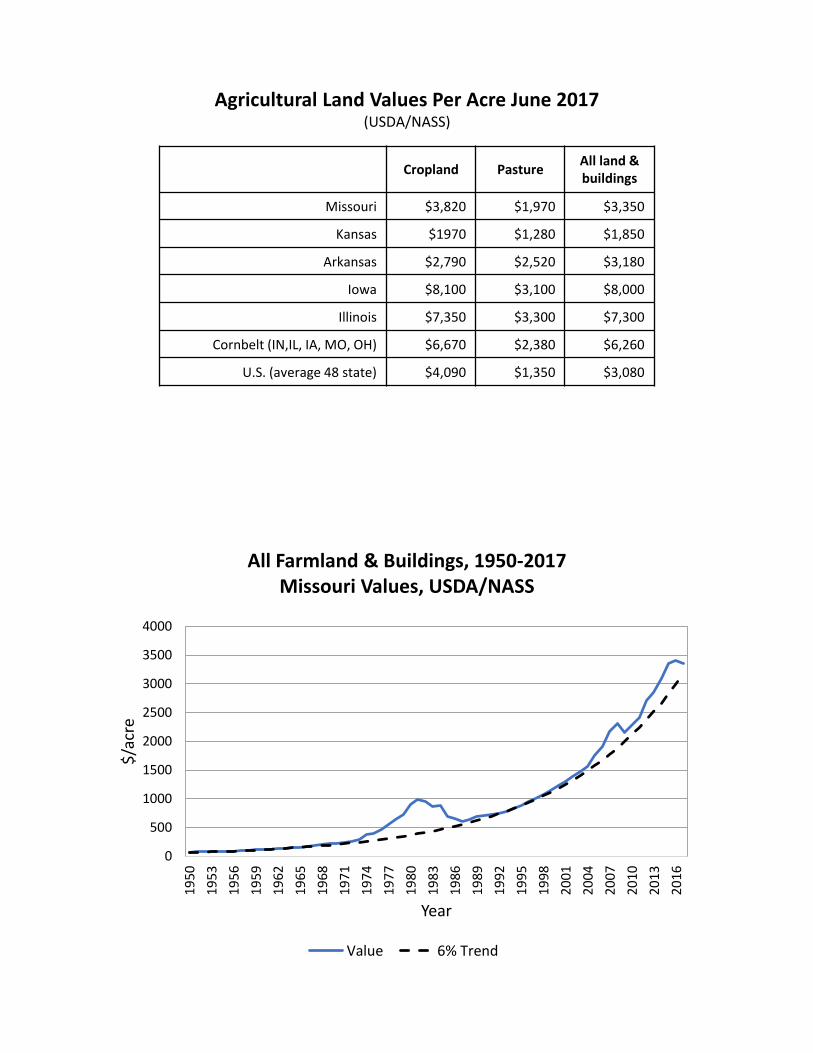
Cropland PastureAll land & buildings
Missouri $3,820 $1,970 $3,350
Kansas $1970 $1,280 $1,850
Arkansas $2,790 $2,520 $3,180
Iowa $8,100 $3,100 $8,000
Illinois $7,350 $3,300 $7,300
Cornbelt (IN,IL, IA, MO, OH) $6,670 $2,380 $6,260
U.S. (average 48 state) $4,090 $1,350 $3,080
Agricultural Land Values Per Acre June 2017(USDA/NASS)
All Farmland & Buildings, 1950-2017Missouri Values, USDA/NASS
0
500
1000
1500
2000
2500
3000
3500
4000
1950
1953
195
6
1959
1962
1965
1968
1971
1974
1977
1980
1983
1986
1989
1992
199
5
1998
2001
2004
2007
2010
2013
2016
$/a
cre
Year
Value 6% Trend