missouri primary care needs assessment -...
TRANSCRIPT

Missouri Primary Care Needs Assessment
2015
Prepared by The Missouri Department of Health and Senior Services
Office of Primary Care and Rural Health
Assisted by The Missouri Department of Health and Senior Services Bureau of Health Care Analysis and Data Dissemination

THIS PAGE INTENTIONALLY LEFT BLANK
Missouri Primary Care Needs Assessment 2015
A Report by the Missouri Department of Health and Senior Services
For more information, please contact:
Missouri Primary Care Office
Office of Primary Care and Rural Health
Missouri Department of Health and Senior Services
www.health.mo.gov/living/families/primarycare/
This report is also accessible via the internet at:
http://health.mo.gov/living/families/primarycare/publications.php
Suggested Citation:
Missouri Department of Health and Senior Services (2015). Missouri Primary Care Needs Assessment
2015.

The following Missouri Department of Health and Senior Services staff contributed to this report:
Office of Primary Care and Rural Health
Lisa Eastman
Joyce Alexander
Ben Harvey
Amy Kelsey
Bureau of Health Care Analysis and Data Dissemination
Andrew Hunter
Becca Mickels
Whitney Coffey
David Kelly
Office of Epidemiology
Shumei Yun
Arthur Pashi

Table of Contents Executive Summary ....................................................................................................................................... 1
Introduction .................................................................................................................................................. 5
Missouri Primary Care Office .................................................................................................................... 5
Purpose of the Primary Care Needs Assessment ...................................................................................... 6
Health Indicators ........................................................................................................................................... 7
Indicator Selection .................................................................................................................................... 7
Ranking Methodology ............................................................................................................................... 9
Health Status Rankings ........................................................................................................................... 10
Health Care Access Rankings .................................................................................................................. 14
Overall Primary Care Needs Rankings ..................................................................................................... 18
Findings ................................................................................................................................................... 22
APPENDIX A ................................................................................................................................................. 27
Health Status and Health Care Access Indicators ................................................................................... 27
APPENDIX B ................................................................................................................................................. 85
Glossary ................................................................................................................................................... 85
APPENDIX C ................................................................................................................................................. 90
The MICA (Missouri Information for Community Assessment) System ................................................. 90
Endnotes ..................................................................................................................................................... 93

THIS PAGE INTENTIONALLY LEFT BLANK

Missouri Primary Care Needs Assessment 2015 1
Executive Summary
The Missouri Department of Health and Senior Services, Office of Primary Care and Rural Health, Primary Care Office (PCO) conducted a Needs Assessment to identify Missouri communities with the greatest unmet health care needs, disparities, and health workforce shortages and to identify the key barriers to accessing primary health care. The Missouri PCO Needs Assessment examines 32 primary care health indicators, which are subdivided into two groups: health status and health care access.
The health status category examines the current state of health in Missouri by incorporating indicators of:
general population health, such as life expectancy and years of potential life lost;
health-promoting practices such as breastfeeding;
the prevalence of several notable diseases/health conditions; and
mortality rates for the total population, infants, and several leading causes of death. The health care access category examines Missouri residents’ access to various health care services by considering:
socioeconomic factors such as poverty and lack of health insurance;
measures that may indicate a lack of access to preventive health services, such as dental-related emergency room (ER) visits and low birth weight;
the usage of various types of health screenings; and
the availability of several types of health care providers.
The health status and health care access indicators provide information about the relative health of each county and are used to determine where additional health resources may be necessary to meet the needs of high risk populations. Racial disparities are not included since data by race were not available for all indicators.
In order to better assess the need for additional health care resources in each county, the health status and health care access indicators were used to compare jurisdictions, ranking them on all the indicators. For each indicator, counties and the City of St. Louis were assigned a ranking from 1-115 based on their rates. For some indicators, such as life expectancy, the highest rate is the best rate. For others, such as infant mortality, the lowest rate is the best rate. This report is structured so that a rank of 1 always indicates the best rate, regardless of whether the best rate is the highest or lowest value, while 115 always indicates the worst rate. Tied counties were all assigned the better rank.
After the basic ranks were determined, quintile points were assigned to each indicator. Quintile points were summed across indicators to create the category rankings for health status and health care access. Please note that quintile points were assigned based on rank order of the counties and do not necessarily indicate any significant difference between counties.
Finally, the ranks from the health status and health care access categories were summed for each county, and these summed ranks were used to create overall primary care needs rankings.

Missouri Primary Care Needs Assessment 2015 2
Findings
The areas of highest overall need are primarily clustered in the southern part of the state, particularly in the southeast and south central areas. In fact, 22 of the 23 counties in the highest needs quintile are located south of the Missouri River; only one county (Sullivan) is located north of the Missouri River.
The following counties demonstrated the greatest need for improvement in their health status indicators:
Pemiscot
Butler, Ripley
New Madrid
Dunklin
Mississippi
Washington
Iron, Wayne
St. Francois
Reynolds
Carter
The following counties demonstrated the greatest challenges with health care access:
Ripley
Iron
Morgan
Oregon
Shannon
Wayne
Carter
Texas
Washington
Dunklin
St. Clair
McDonald
Pemiscot
Barton
Benton
Dent
Bates
Crawford
Hickory
Ozark
Wright
Barry
Dallas
Reynolds

Missouri Primary Care Needs Assessment 2015 3
While many of the high-need counties listed above have a health professional shortage area designation, medically underserved area or population, and/or federally qualified health center, most of the shortage designations either do not encompass the whole county or are established only for specific populations (e.g., Medicaid or low-income populations).
The counties with the highest primary care needs, based on the overall rankings are:
County Health Status Rank
Health Care Access Rank
Combined Rank
Scores
Overall Primary Care Needs
Rank
BRFSS Region (See Appendix B
for Map)
Ripley 113 115 228 115 Southeast
Iron 107 114 221 114 Southeast
Pemiscot 115 103 218 113 Southeast
Wayne 107 110 217 112 Southeast
Dunklin 111 105 216 110 Southeast
Washington 109 107 216 110 St. Louis Metro
Carter 104 107 211 109 Southeast
Dent 99 100 199 107 Central
New Madrid 112 87 199 107 Southeast
Mississippi 110 87 197 105 Southeast
Reynolds 105 92 197 105 Southeast
Most of these counties are located in or near the Bootheel† area. All of these counties are predominantly rural, although Washington County is part of a Census-designated Metropolitan Statistical Area (MSA) due primarily to its residents’ commuting patterns.
In the Rural Policy Research Institute’s (RUPRI) 2014 paper, Access to Rural Health Care – A Literature Review and New Synthesis, it was made clear that to design and develop a high performance rural health system, policy makers, providers, and the public need to understand clearly the concept of access to care. A synthesis of frameworks that includes the four dimensions of access (people, place, provider, and payment) serves as a basis for health care policy assessment. When designing or evaluating health care policy, policy makers should specifically consider each of the four access dimensions. How does the policy affect each of these dimensions, and how does the policy change the dynamic between the dimensions?
As the current health care delivery system begins to respond to increasing demands for quality improvement and cost control, access to health care services may be at risk for many Missourians. Health services researchers and policy makers should refocus on understanding health care access and designing access measures and systems that improve policies related to rural health care.
†Various definitions of the Bootheel exist. This report defines the Bootheel as five counties (Dunklin, Mississippi,
New Madrid, Pemiscot, and Scott) located in the extreme southeast corner of Missouri.

Missouri Primary Care Needs Assessment 2015 4
THIS PAGE INTENTIONALLY LEFT BLANK

Missouri Primary Care Needs Assessment 2015 5
Introduction
Missouri Primary Care Office
The Missouri Primary Care Office (PCO), located within the Missouri Department of Health and Senior Services, Office of Primary Care and Rural Health, works with federal programs, state programs, communities, private entities, health care facilities, and providers to assess, develop, and expand comprehensive, community-based primary health care services. The PCO administers programs that serve and support communities, health care providers, critical access hospitals, federally qualified health centers, rural health clinics, and small rural hospitals.
As a critical part of its work, the PCO submits applications for the designation of Health Professional Shortage Areas (HPSAs). HPSAs are areas designated by the U.S. Department of Health and Human Services, Health Resources and Services Administration (HRSA) as having shortages of primary medical, dental, or mental health care providers. HPSAs can occur in urban or rural settings and are classified as:
geographic (a county or service area),
demographic (specific population group), or
institutional (federally qualified health centers or other defined facilities).
Each health professional discipline (medical, dental, and mental) and each HPSA type (geographic, demographic, or institutional) has its own unique eligibility criteria and specific requirements.
Missouri currently has 210 Health Professional Shortage Areas designated by HRSA for Primary Medical Care. Of these 210 HPSAs, 28 are Comprehensive Health Centers (CHC), 1 is a Correctional Facility, 2 are Federally Qualified Health Center (FQHC) Look-a-Likes, 28 are Geographic, 2 are Geographic High Needs, 79 are Population HPSAs, 1 is a Native American Tribal Population, 67 are Rural Health Clinics (RHC), and 2 are Other Facilities.
There are 104 Mental Health HPSA designations in Missouri. Twenty (20) of these are Correctional Facilities, 28 are CHCs, 2 are FQHC Look-a-Likes, 8 are Geographic, 2 are Geographic High Needs, 8 are Population HPSAs, 1 is a Native American Tribal Population, 32 are Rural Health Clinics (RHC), and 3 are Other Facilities.
One hundred four (104) Dental Health HPSAs are currently designated in Missouri. Of these 104 HPSAs, 25 are Geographic, 2 are Geographic High Needs, and 74 are Population HPSAs.
The PCO recognizes that assessing access to healthcare services is complex and influenced by more than just the number of people and the number of providers in a particular area. Healthcare needs and service requirements can vary considerably depending on population characteristics, such as age, income, environmental factors, and behaviors. At the same time, physician availability is not uniform in rural or urban areas due to financial, racial, and cultural barriers. As such, a more thorough and nuanced analysis is warranted for communities/areas in Missouri.

Missouri Primary Care Needs Assessment 2015 6
Purpose of the Primary Care Needs Assessment
The purpose of the PCO Needs Assessment is to identify communities with the greatest unmet health care needs, disparities, and health workforce shortages within the state of Missouri and to identify the key barriers to accessing primary healthcare.
Primary healthcare resources are key elements in the maintenance of health and the prevention and treatment of disease. Basic access to primary care physicians, dentists, and mental health practitioners improves overall health and contributes significantly to an area’s economic vitality. Unfortunately, in Missouri these resources are limited, even for those who have health insurance and have no financial difficulty.
In preparing this Primary Care Needs Assessment report, the Missouri PCO utilized the 2010 Maryland Primary Care Needs Assessment published by the Maryland Mental Health and Hygiene’s Primary Care Office as a source of inspiration.

Missouri Primary Care Needs Assessment 2015 7
Health Indicators
Indicator Selection
Multiple data sources and health indicators were considered for inclusion in this assessment. Those that were selected were assigned to one of two overarching primary care categories, health status and health care access, that were used to structure these rankings.
The health status category attempts to measure the current state of health in Missouri by incorporating indicators of:
general population health, such as life expectancy and years of potential life lost;
health-promoting practices such as breastfeeding;
the prevalence of several notable diseases/health conditions; and
mortality rates for the total population, infants, and several leading causes of death. The health care access category examines Missouri residents’ access to various health care services by considering:
socioeconomic factors such as poverty and lack of health insurance;
measures that may indicate a lack of access to preventive health services, such as dental-related emergency room (ER) visits and low birth weight;
the usage of various types of health screenings; and
the availability of several types of health care providers.
Health Status Indicators Health Care Access Indicators
Life Expectancy Population Living in Poverty
Years of Potential Life Lost Uninsured
Ever Breastfed Medicaid Enrollment
Self-Reported Health Status Medicare Enrollment
Obesity Inadequate Prenatal Care
Hypertension Low Birth Weight
High Cholesterol Mammogram Screenings
Smoking Pap Smear Screenings
Diabetes Sigmoidoscopy and Colonoscopy Screenings
Asthma Preventable Hospitalizations
Depressive Disorders Dental Visit in the Past Year
HIV/AIDS Dental ER Visits
Total Mortality Population to Primary Care Provider Ratio
Infant Mortality Population to Mental Health Care Provider Ratio
Heart Disease Mortality Population to Dentist Ratio
Cancer Mortality
Chronic Lower Respiratory Disease (CLRD)
Mortality
Stroke Mortality

Missouri Primary Care Needs Assessment 2015 8
County-level rates for each indicator included in these rankings are provided in Appendix A, along with a brief discussion of the importance of each indicator. Data sources and data years are also provided in Appendix A. Data years vary by indicator because the most recent data available from each source were utilized in these rankings, and the frequency of updates varies by source. When appropriate, multiple years of data were combined for indicators with unstable rates for a large number of counties. An unstable rate is defined as a rate based on fewer than 20 cases. Age-adjusted rates were used rather than crude rates for indicators that are heavily influenced by the age structure of a population. These include deaths, hospitalizations, and ER visits, among others. For additional information on the statistical terms and concepts utilized in this report, please refer to the Glossary in Appendix B.

Missouri Primary Care Needs Assessment 2015 9
Ranking Methodology
The State of Missouri is composed of 114 counties and the City of St. Louis, which is an independent city that functions as its own county. (Throughout this report, the City of St. Louis will be specified as “St. Louis City.” St. Louis County will be noted as simply “St. Louis.”) For each indicator included in this assessment, the counties and the City of St. Louis were assigned a ranking from 1-115 based on their rates. For some indicators, such as life expectancy, the highest rate is the best rate. For others, such as infant mortality, the lowest rate is the best rate. This report is structured so that a rank of 1 always indicates the best rate, regardless of whether the best rate is the highest or lowest value, while 115 always indicates the worst rate. Tied counties were all assigned the better rank. After the basic ranks were determined, quintile points were assigned to each indicator based on the table in Figure 1.
Figure 1: Initial Ranks and Corresponding Quintile Points
Initial Ranks
Quintile Points
1-23 1 24-46 2 47-69 3 70-92 4
93-115 5
Quintile points were summed across indicators to create the category rankings for health status and health care access. Quintile points by county and indicator are shown in Tables 1 and 2. Please note that quintile points were assigned based on the rank order of the counties and do not necessarily indicate any significant difference between counties.
Finally, the ranks from the health status and health care access categories were summed for each county, and these summed ranks were used to create overall primary care needs rankings, as shown in Table 3.

Missouri Primary Care Needs Assessment 2015 10
Health Status Rankings
Table 1: Health Status Quintile Points and Rankings by County
County Lif
e E
xpe
ctan
cy
Ye
ars
of
Po
ten
tial
Lif
e L
ost
Eve
r B
reas
tfe
d
Se
lf-R
ep
ort
ed
He
alth
Sta
tus
Ob
esi
ty
Hyp
ert
ensi
on
Hig
h C
ho
lest
ero
l
Sm
oki
ng
Dia
be
tes
Ast
hm
a
De
pre
ssiv
e D
iso
rde
rs
HIV
/AID
S
To
tal M
ort
alit
y
In
fan
t M
ort
alit
y
He
art
Dis
eas
e M
ort
alit
y
Can
cer
Mo
rtal
ity
CLR
D M
ort
alit
y†
Str
oke
Mo
rtal
ity
TO
TAL
QU
INTI
LE P
OIN
TS
HEA
LTH
STA
TUS
RA
NK
Adair 2 1 3 2 3 1 3 2 4 3 4 3 2 4 2 2 3 4 48 40
Andrew 2 2 1 1 5 1 3 4 1 5 1 1 1 4 2 1 3 3 41 23
Atchison 1 3 1 1 2 2 2 2 3 2 2 1 2 1 1 2 5 5 38 17
Audrain 2 3 4 4 5 5 3 3 2 1 4 3 3 1 1 4 5 3 56 64
Barry 4 4 2 2 2 2 4 4 5 3 5 3 4 3 5 3 2 5 62 84
Barton 2 3 3 2 2 4 5 1 5 2 2 1 2 3 1 1 1 4 44 33
Bates 3 5 4 4 2 4 1 1 3 2 3 5 3 1 3 4 3 4 55 62
Benton 4 5 3 4 2 1 1 3 3 2 1 4 4 3 3 5 5 4 57 68
Bollinger 4 4 3 5 5 3 4 3 5 4 3 1 4 4 5 4 3 2 66 94
Boone 1 1 2 1 2 2 4 2 3 3 4 5 1 2 1 1 1 2 38 17
Buchanan 4 3 4 3 3 4 2 4 4 2 5 5 4 4 3 4 5 5 68 96
Butler 5 4 4 5 4 5 5 5 5 5 5 5 5 5 4 5 5 5 86 113
Caldwell 4 5 4 2 1 2 3 4 3 2 4 4 3 5 2 3 2 1 54 59
Callaway 3 3 2 3 3 1 4 3 4 2 2 3 2 5 2 2 4 2 50 45
Camden 1 2 1 2 1 4 3 5 2 1 4 1 1 1 3 1 2 2 37 16
Cape Girardeau 1 1 4 1 1 4 3 2 3 2 3 4 2 3 2 1 1 3 41 23
Carroll 4 5 3 4 5 3 2 1 3 4 1 1 4 3 5 1 2 2 53 55
Carter 5 5 5 5 5 3 4 3 5 3 4 1 5 5 3 5 5 4 75 104
Cass 2 1 2 1 3 2 3 2 4 5 4 4 2 1 1 2 3 3 45 34
Cedar 4 4 4 5 4 3 2 2 1 5 4 2 4 5 3 4 4 4 64 92
Chariton 2 1 2 2 5 5 5 3 2 5 3 1 1 4 2 3 1 1 48 40
Christian 1 1 1 2 1 1 2 1 1 2 3 4 1 1 1 1 1 3 28 3
Clark 3 2 5 4 3 1 1 3 5 1 2 2 3 2 4 5 5 5 56 64
Clay 1 1 2 2 2 2 3 1 3 4 3 5 1 1 1 2 4 1 39 20
Clinton 4 4 2 1 1 1 3 2 2 1 1 2 5 3 2 4 5 5 48 40
Cole 1 2 3 1 1 1 1 1 2 1 1 5 1 3 1 2 3 1 31 4
Cooper 2 3 1 3 1 2 2 3 3 5 2 3 2 3 4 1 2 3 45 34
Crawford 4 3 3 4 3 5 5 5 5 4 3 3 4 1 5 4 2 3 66 94
†CLRD refers to Chronic Lower Respiratory Disease.

Missouri Primary Care Needs Assessment 2015 11
Table 1: Health Status Quintile Points and Rankings by County (continued)
County Lif
e E
xpe
ctan
cy
Ye
ars
of
Po
ten
tial
Lif
e L
ost
Eve
r B
reas
tfe
d
Se
lf-R
ep
ort
ed
He
alth
Sta
tus
Ob
esi
ty
Hyp
ert
ensi
on
Hig
h C
ho
lest
ero
l
Sm
oki
ng
Dia
be
tes
Ast
hm
a
De
pre
ssiv
e D
iso
rde
rs
HIV
/AID
S
To
tal M
ort
alit
y
In
fan
t M
ort
alit
y
He
art
Dis
eas
e M
ort
alit
y
Can
cer
Mo
rtal
ity
CLR
D M
ort
alit
y
Str
oke
Mo
rtal
ity
TO
TAL
QU
INTI
LE P
OIN
TS
HEA
LTH
STA
TUS
RA
NK
Dade 4 3 3 1 4 3 1 5 1 3 1 4 5 2 2 5 3 3 53 55
Dallas 3 2 5 4 5 5 2 3 4 3 1 3 3 3 1 3 3 1 54 59
Daviess 2 1 1 4 5 3 5 2 1 4 3 2 2 3 3 3 2 5 51 51
DeKalb 2 4 1 3 2 4 1 1 1 2 1 2 2 2 4 1 4 4 41 23
Dent 5 4 4 5 3 4 4 5 4 4 5 1 4 3 3 3 4 5 70 99
Douglas 2 3 2 2 4 1 5 1 3 4 4 4 2 1 1 3 5 2 49 44
Dunklin 5 5 5 5 3 5 5 4 5 4 4 4 5 5 5 5 5 5 84 111
Franklin 3 3 4 2 2 4 2 3 1 3 3 3 4 2 3 3 2 3 50 45
Gasconade 3 4 3 1 4 1 1 1 1 1 1 3 3 4 3 3 1 4 42 29
Gentry 1 1 4 2 4 1 3 4 2 3 5 1 1 1 4 1 1 4 43 31
Greene 2 2 1 2 1 2 3 2 2 2 4 5 2 2 2 2 2 2 40 21
Grundy 2 3 4 1 1 3 2 5 1 4 5 2 2 2 2 4 3 4 50 45
Harrison 2 5 2 2 4 4 1 4 5 4 5 2 2 4 4 1 2 1 54 59
Henry 5 5 3 4 5 2 4 3 3 2 4 3 5 4 4 5 3 5 69 98
Hickory 3 5 5 3 3 3 1 5 2 3 2 3 2 4 1 3 2 3 53 55
Holt 1 1 4 1 4 2 2 5 1 1 4 1 1 2 1 1 4 2 38 17
Howard 1 1 5 1 4 2 1 1 1 1 1 3 2 3 2 2 1 4 36 13
Howell 5 4 2 3 1 2 1 4 3 1 5 4 5 3 3 4 5 5 60 77
Iron 5 5 5 5 3 4 4 5 5 1 5 4 5 4 5 5 5 5 80 107
Jackson 3 3 2 2 2 3 2 3 3 5 3 5 3 3 1 3 2 3 51 51
Jasper 4 3 3 2 4 5 2 2 4 2 3 5 4 1 5 2 5 2 58 70
Jefferson 4 3 4 1 3 3 3 2 2 4 2 4 5 2 4 5 4 4 59 74
Johnson 2 1 1 3 3 4 4 3 5 3 2 4 2 2 2 3 2 4 50 45
Knox 3 3 1 3 2 2 2 1 1 2 3 2 3 1 2 5 4 1 41 23
Laclede 4 3 2 3 1 3 4 2 4 3 4 4 4 5 5 3 3 5 62 84
Lafayette 2 2 2 3 5 5 3 1 2 2 4 4 3 2 4 3 3 2 52 53
Lawrence 3 2 1 1 3 2 1 3 1 1 2 2 3 4 1 2 4 5 41 23
Lewis 2 2 2 1 4 3 1 2 1 3 1 3 2 2 4 3 1 5 42 29
Lincoln 3 1 4 2 3 2 4 2 1 3 4 2 4 2 4 4 1 4 50 45

Missouri Primary Care Needs Assessment 2015 12
Table 1: Health Status Quintile Points and Rankings by County (continued)
County Lif
e E
xpe
ctan
cy
Ye
ars
of
Po
ten
tial
Lif
e L
ost
Eve
r B
reas
tfe
d
Se
lf-R
ep
ort
ed
He
alth
Sta
tus
Ob
esi
ty
Hyp
ert
ensi
on
Hig
h C
ho
lest
ero
l
Sm
oki
ng
Dia
be
tes
Ast
hm
a
De
pre
ssiv
e D
iso
rde
rs
HIV
/AID
S
To
tal M
ort
alit
y
In
fan
t M
ort
alit
y
He
art
Dis
eas
e M
ort
alit
y
Can
cer
Mo
rtal
ity
CLR
D M
ort
alit
y
Str
oke
Mo
rtal
ity
TO
TAL
QU
INTI
LE P
OIN
TS
HEA
LTH
STA
TUS
RA
NK
Linn 3 4 4 2 5 2 5 3 3 1 2 5 3 2 5 2 4 3 58 70
Livingston 3 2 3 3 4 1 4 2 4 2 2 1 2 2 4 3 3 2 47 37
McDonald 5 5 3 3 2 1 4 4 2 2 3 4 5 4 3 4 3 2 59 74
Macon 3 4 3 3 2 3 4 3 2 4 2 4 3 1 3 2 1 3 50 45
Madison 5 5 5 5 1 4 3 4 5 4 4 3 5 4 5 5 5 1 73 102
Maries 2 2 3 3 5 2 4 3 2 1 4 1 3 1 5 3 1 2 47 37
Marion 3 1 3 3 5 2 2 4 4 3 3 3 4 3 3 4 5 3 58 70
Mercer 2 2 5 3 5 2 5 5 2 5 3 1 1 5 1 2 2 1 52 53
Miller 4 3 3 4 3 4 4 2 3 1 2 3 4 2 5 4 3 2 56 64
Mississippi 5 5 5 4 3 5 5 5 3 4 5 5 5 4 5 5 4 5 82 110
Moniteau 2 1 4 3 3 1 1 1 1 5 2 1 2 1 2 1 3 1 35 9
Monroe 1 1 1 3 2 1 2 3 4 4 2 2 1 1 3 1 2 1 35 9
Montgomery 4 2 3 2 5 4 5 5 2 1 3 4 4 4 4 5 4 1 62 84
Morgan 4 4 2 4 2 4 3 2 1 4 2 2 5 4 3 4 3 3 56 64
New Madrid 5 5 5 5 5 5 5 2 5 5 5 5 5 5 5 5 5 3 85 112
Newton 3 2 1 3 4 2 1 1 4 3 5 3 3 3 3 2 2 3 48 40
Nodaway 1 1 1 1 1 4 1 1 1 1 1 2 1 2 2 1 1 2 25 1
Oregon 4 4 5 4 3 3 4 4 2 2 5 3 3 2 5 2 1 1 57 68
Osage 1 4 3 2 1 1 3 1 1 3 1 1 1 3 4 1 1 1 33 7
Ozark 5 5 1 5 3 2 4 5 4 5 2 5 4 1 2 4 2 4 63 91
Pemiscot 5 5 5 5 4 5 5 5 5 5 5 5 5 5 5 5 5 4 88 115
Perry 1 1 5 1 1 3 1 3 1 1 1 2 1 1 3 2 1 2 31 4
Pettis 2 2 2 3 2 3 1 2 3 3 4 4 2 2 2 4 2 4 47 37
Phelps 3 4 2 4 5 5 1 4 4 4 4 2 3 3 2 1 4 5 60 77
Pike 3 2 5 4 3 5 3 2 4 4 3 2 3 5 5 3 4 2 62 84
Platte 1 1 1 1 2 1 4 3 2 1 2 5 1 1 1 1 2 1 31 4
Polk 4 2 1 3 4 4 5 4 5 4 5 2 4 1 1 2 4 5 60 77
Pulaski 4 2 2 1 2 5 3 1 3 4 1 5 5 4 4 4 4 5 59 74
Putnam 3 5 3 5 3 3 5 4 2 5 5 1 3 5 4 4 4 1 65 93

Missouri Primary Care Needs Assessment 2015 13
Table 1: Health Status Quintile Points and Rankings by County (continued)
County Lif
e E
xpe
ctan
cy
Ye
ars
of
Po
ten
tial
Lif
e L
ost
Eve
r B
reas
tfe
d
Se
lf-R
ep
ort
ed
He
alth
Sta
tus
Ob
esi
ty
Hyp
ert
ensi
on
Hig
h C
ho
lest
ero
l
Sm
oki
ng
Dia
be
tes
Ast
hm
a
De
pre
ssiv
e D
iso
rde
rs
HIV
/AID
S
To
tal M
ort
alit
y
In
fan
t M
ort
alit
y
He
art
Dis
eas
e M
ort
alit
y
Can
cer
Mo
rtal
ity
CLR
D M
ort
alit
y
Str
oke
Mo
rtal
ity
TO
TAL
QU
INTI
LE P
OIN
TS
HEA
LTH
STA
TUS
RA
NK
Ralls 1 2 4 2 4 4 2 1 3 2 3 1 1 5 1 2 2 1 41 23
Randolph 3 3 3 4 3 3 4 3 4 2 5 3 4 2 2 5 3 2 58 70
Ray 4 4 5 3 4 4 4 3 2 5 1 3 4 2 4 4 4 1 61 83
Reynolds 5 5 4 5 5 5 5 5 4 5 3 1 5 5 4 4 5 2 77 105
Ripley 5 4 5 5 5 5 5 5 5 5 5 2 5 5 5 5 5 5 86 113
St. Charles 1 1 2 1 1 1 3 1 1 2 2 4 1 2 1 1 1 1 27 2
St. Clair 4 5 4 5 1 2 2 5 4 5 5 2 3 1 4 3 3 4 62 84
St. Francois 5 5 4 5 4 5 3 4 5 4 4 5 5 3 5 5 5 3 79 106
St. Louis 1 1 4 1 2 3 1 1 2 3 2 5 1 3 2 1 1 2 36 13
St. Louis City 5 5 5 3 2 4 2 4 4 4 3 5 5 5 5 5 1 4 71 100
Ste. Genevieve 1 3 3 2 1 2 3 2 3 2 1 4 1 1 3 1 1 1 35 9
Saline 3 2 1 2 5 3 3 5 3 3 3 4 3 5 4 5 2 4 60 77
Schuyler 3 3 2 4 4 1 1 1 3 4 1 2 2 5 1 2 4 3 46 36
Scotland 1 2 5 1 1 1 2 1 1 1 1 1 2 4 1 3 3 2 33 7
Scott 5 5 5 5 1 4 2 5 5 5 1 5 4 5 4 4 5 4 74 103
Shannon 5 4 2 5 1 4 3 4 2 1 2 3 4 5 4 4 4 5 62 84
Shelby 2 4 1 4 5 5 5 1 2 5 2 1 2 3 3 3 3 4 55 62
Stoddard 4 5 5 5 2 5 5 4 5 2 3 2 4 4 2 5 5 5 72 101
Stone 1 3 1 4 1 5 1 4 1 1 1 3 1 4 1 1 1 1 35 9
Sullivan 3 3 4 4 4 5 5 4 5 5 4 5 3 3 3 2 4 2 68 96
Taney 2 2 1 4 2 1 1 5 4 1 5 5 1 2 2 3 1 1 43 31
Texas 4 4 2 5 4 4 2 5 4 3 4 2 3 5 3 2 3 3 62 84
Vernon 5 3 5 4 3 3 2 3 4 2 2 4 4 4 5 3 2 2 60 77
Warren 1 1 2 1 4 3 3 2 4 3 2 2 1 1 2 2 1 1 36 13
Washington 5 4 5 5 5 5 5 5 5 5 5 5 5 3 5 5 2 2 81 109
Wayne 5 4 3 5 4 5 5 5 5 5 5 1 5 5 3 5 5 5 80 107
Webster 2 2 1 5 1 1 5 2 2 3 5 4 3 4 4 1 4 4 53 55
Worth 1 1 1 2 5 3 1 4 1 1 1 3 1 5 1 2 4 3 40 21
Wright 5 4 3 3 1 1 4 4 4 5 1 1 5 4 5 4 3 3 60 77

Missouri Primary Care Needs Assessment 2015 14
Health Care Access Rankings
Table 2: Health Care Access Quintile Points and Rankings by County
County Po
vert
y
Un
insu
red
Me
dic
aid
En
rollm
ent
Me
dic
are
En
rollm
ent
In
ade
qu
ate
Pre
nat
al C
are
Lo
w B
irth
We
igh
t
Mam
mo
gram
Scr
een
ings
Pap
Sm
ear
Scr
een
ings
Sig
mo
ido
sco
py
and
Co
lon
osc
op
y S
cree
nin
gs
Pre
ven
tab
le H
osp
ital
izat
ion
s
De
nta
l Vis
it in
th
e P
ast
Ye
ar
De
nta
l ER
Vis
its
Po
pu
lati
on
to
PC
Pro
vid
er R
atio†
Po
pu
lati
on
to
Me
nta
l He
alth
Car
e
Pro
vid
er
Rat
io
Po
pu
lati
on
to
De
nti
st R
atio
TO
TAL
QU
INTI
LE P
OIN
TS
HEA
LTH
CA
RE
AC
CES
S R
AN
K
Adair 5 3 2 1 1 5 3 3 2 4 2 2 1 1 1 36 25
Andrew 1 1 1 1 1 1 1 1 3 1 2 1 5 4 4 28 11
Atchison 1 2 1 5 1 1 3 2 2 2 2 1 5 3 1 32 18
Audrain 3 3 2 2 5 3 1 1 1 2 4 4 1 1 3 36 25
Barry 4 5 4 3 4 3 4 4 5 2 4 5 2 4 3 56 92
Barton 3 3 4 4 5 3 3 4 5 5 3 5 3 3 5 58 100
Bates 4 4 3 3 2 4 5 4 2 5 2 5 5 4 5 57 95
Benton 5 4 4 5 3 3 2 5 4 3 5 4 3 4 4 58 100
Bollinger 3 3 5 3 1 2 3 3 2 2 3 2 5 3 5 45 52
Boone 4 1 1 1 2 3 1 1 1 2 1 2 1 1 1 23 3
Buchanan 3 2 3 2 2 3 3 3 4 5 3 3 1 1 1 39 34
Butler 4 2 5 4 4 5 1 2 3 5 3 4 1 1 1 45 52
Caldwell 2 2 2 3 1 5 1 4 3 4 2 2 5 5 5 46 60
Callaway 1 1 2 1 3 5 2 2 1 3 2 5 3 1 4 36 25
Camden 3 4 2 5 1 2 4 1 3 1 3 4 1 2 1 37 30
Cape Girardeau 2 1 2 1 2 4 2 2 1 2 1 4 1 1 1 27 7
Carroll 3 2 3 4 3 3 5 4 4 5 1 3 4 5 2 51 76
Carter 5 5 5 5 5 5 1 3 4 5 4 2 5 2 5 61 107
Cass 1 1 1 1 2 2 3 1 1 1 1 3 4 3 3 28 11
Cedar 5 4 5 5 3 1 4 4 2 4 5 4 3 2 3 54 85
Chariton 2 2 2 4 1 1 5 1 3 2 4 3 3 5 2 40 35
Christian 1 1 1 1 1 2 3 2 1 1 2 2 3 3 3 27 7
Clark 2 4 3 3 2 1 2 5 3 4 2 1 3 4 3 42 44
Clay 1 1 1 1 2 2 1 2 1 3 1 2 2 2 1 23 3
Clinton 1 1 1 1 1 2 3 5 1 4 1 2 2 5 1 31 16
Cole 1 1 2 1 3 4 1 2 1 2 1 4 1 1 1 26 6
Cooper 2 2 2 2 5 5 5 4 2 2 2 4 3 2 3 45 52
Crawford 4 3 4 3 2 4 4 4 3 3 5 4 5 4 5 57 95
†PC Provider refers to primary care providers.

Missouri Primary Care Needs Assessment 2015 15
Table 2: Health Care Access Quintile Points and Rankings by County (continued)
County Po
vert
y
Un
insu
red
Me
dic
aid
En
rollm
ent
Me
dic
are
En
rollm
ent
In
ade
qu
ate
Pre
nat
al C
are
Lo
w B
irth
We
igh
t
Mam
mo
gram
Scr
een
ings
Pap
Sm
ear
Scr
een
ings
Sig
mo
ido
sco
py
and
Co
lon
osc
op
y S
cree
nin
gs
Pre
ven
tab
le H
osp
ital
izat
ion
s
De
nta
l Vis
it in
th
e P
ast
Ye
ar
De
nta
l ER
Vis
its
Po
pu
lati
on
to
PC
Pro
vid
er R
atio
Po
pu
lati
on
to
Me
nta
l He
alth
Car
e
Pro
vid
er
Rat
io
Po
pu
lati
on
to
De
nti
st R
atio
TO
TAL
QU
INTI
LE P
OIN
TS
HEA
LTH
CA
RE
AC
CES
S R
AN
K
Dade 3 4 3 5 2 1 1 5 3 2 5 3 2 2 5 46 60
Dallas 4 4 4 4 3 2 4 5 5 1 4 3 5 4 4 56 92
Daviess 3 5 2 3 5 2 3 5 5 2 4 1 5 5 4 54 85
DeKalb 2 2 1 1 1 3 4 4 4 2 4 1 4 4 5 42 44
Dent 5 4 5 4 3 4 4 5 5 3 5 5 3 2 1 58 100
Douglas 5 5 5 4 2 5 5 4 4 1 5 1 4 3 2 55 87
Dunklin 5 3 5 4 4 5 5 2 4 5 5 5 2 3 3 60 105
Franklin 1 1 1 2 1 3 1 1 1 4 2 5 1 3 2 29 14
Gasconade 2 3 2 4 2 4 2 2 2 3 2 3 3 3 4 41 39
Gentry 2 4 2 5 3 1 4 2 5 4 3 2 3 4 2 46 60
Greene 4 3 3 2 2 2 1 3 1 2 1 5 1 1 1 32 18
Grundy 4 3 3 4 5 2 3 5 5 4 3 2 2 2 2 49 69
Harrison 3 4 4 4 4 1 5 4 3 4 5 2 2 1 2 48 66
Henry 3 2 4 5 4 3 4 5 3 5 3 4 2 1 2 50 72
Hickory 5 5 3 5 4 1 4 5 4 1 4 3 5 3 5 57 95
Holt 1 3 1 4 1 5 4 4 2 1 3 1 3 3 4 40 35
Howard 2 2 3 2 2 4 3 5 3 1 3 3 4 4 2 43 47
Howell 5 3 5 4 2 4 5 4 5 3 3 4 1 2 2 52 79
Iron 4 3 5 5 4 4 5 4 4 4 5 5 5 2 5 64 114
Jackson 2 3 3 1 5 4 1 1 1 4 1 4 1 1 1 33 21
Jasper 3 4 4 2 5 2 2 2 5 4 4 5 1 1 1 45 52
Jefferson 1 1 1 1 1 3 2 1 1 3 1 1 4 3 3 27 7
Johnson 3 1 1 1 4 2 4 3 2 3 1 2 3 2 2 34 22
Knox 4 5 2 4 5 4 2 5 3 2 4 1 1 4 4 50 72
Laclede 4 4 4 3 3 2 5 4 3 2 4 5 2 2 3 50 72
Lafayette 1 1 3 3 3 2 1 1 2 4 2 4 4 3 3 37 30
Lawrence 3 4 3 3 3 3 4 5 4 2 3 5 2 1 2 47 64
Lewis 2 2 1 2 5 1 2 3 3 1 2 1 4 2 5 36 25
Lincoln 1 1 2 1 1 2 4 3 2 3 2 5 5 4 5 41 39

Missouri Primary Care Needs Assessment 2015 16
Table 2: Health Care Access Quintile Points and Rankings by County (continued)
County Po
vert
y
Un
insu
red
Me
dic
aid
En
rollm
ent
Me
dic
are
En
rollm
ent
In
ade
qu
ate
Pre
nat
al C
are
Lo
w B
irth
We
igh
t
Mam
mo
gram
Scr
een
ings
Pap
Sm
ear
Scr
een
ings
Sig
mo
ido
sco
py
and
Co
lon
osc
op
y S
cree
nin
gs
Pre
ven
tab
le H
osp
ital
izat
ion
s
De
nta
l Vis
it in
th
e P
ast
Ye
ar
De
nta
l ER
Vis
its
Po
pu
lati
on
to
PC
Pro
vid
er R
atio
Po
pu
lati
on
to
Me
nta
l He
alth
Car
e
Pro
vid
er
Rat
io
Po
pu
lati
on
to
De
nti
st R
atio
TO
TAL
QU
INTI
LE P
OIN
TS
HEA
LTH
CA
RE
AC
CES
S R
AN
K
Linn 3 2 3 5 3 2 4 4 4 4 2 2 2 4 5 49 69
Livingston 2 2 2 3 2 2 3 3 3 2 1 3 1 4 1 34 22
McDonald 4 5 4 1 5 4 5 5 5 3 3 2 5 5 3 59 103
Macon 3 3 3 4 4 3 2 4 1 3 5 2 4 3 2 46 60
Madison 4 3 5 4 3 3 1 2 2 4 4 5 4 2 2 48 66
Maries 2 3 2 3 2 1 3 1 2 1 4 1 5 4 2 36 25
Marion 2 2 4 3 4 3 2 3 4 4 4 3 1 1 1 41 39
Mercer 3 4 2 4 5 5 3 4 4 4 5 1 4 4 3 55 87
Miller 4 4 4 2 2 2 4 2 3 2 4 4 4 5 4 50 72
Mississippi 5 3 5 3 5 5 3 2 2 5 2 1 4 5 5 55 87
Moniteau 1 3 1 1 3 1 4 2 3 1 3 2 4 5 3 37 30
Monroe 2 4 3 4 4 5 3 1 2 1 1 3 3 4 4 44 50
Montgomery 2 3 4 3 2 3 1 1 1 3 3 4 4 3 4 41 39
Morgan 4 5 4 5 4 1 5 5 3 3 5 4 5 5 5 63 112
New Madrid 5 2 5 3 4 5 2 3 2 5 4 1 5 5 4 55 87
Newton 2 5 3 2 5 2 1 2 4 3 4 5 4 5 4 51 76
Nodaway 3 1 1 1 1 1 2 2 4 1 1 1 2 2 4 27 7
Oregon 5 5 5 5 3 5 4 3 5 3 4 2 5 5 4 63 112
Osage 1 1 1 1 1 3 1 2 1 1 1 2 5 5 4 30 15
Ozark 5 5 4 5 4 1 4 5 5 2 5 1 4 3 4 57 95
Pemiscot 5 1 5 3 5 5 2 1 4 5 5 4 4 5 5 59 103
Perry 1 1 2 2 1 4 2 1 4 1 1 4 3 3 2 32 18
Pettis 4 4 4 2 4 3 3 2 3 3 2 4 3 2 2 45 52
Phelps 2 3 3 2 2 3 2 3 2 3 2 4 1 1 2 35 24
Pike 4 4 3 2 5 4 5 2 3 3 3 3 4 5 3 53 82
Platte 1 1 1 1 2 2 1 1 1 1 1 1 1 2 1 18 1
Polk 4 3 4 2 1 2 2 5 5 2 3 3 2 1 3 42 44
Pulaski 2 2 1 1 3 4 2 3 1 1 1 1 4 1 1 28 11
Putnam 3 5 2 5 3 1 4 1 5 5 4 1 2 4 2 47 64

Missouri Primary Care Needs Assessment 2015 17
Table 2: Health Care Access Quintile Points and Rankings by County (continued)
County Po
vert
y
Un
insu
red
Me
dic
aid
En
rollm
ent
Me
dic
are
En
rollm
ent
In
ade
qu
ate
Pre
nat
al C
are
Lo
w B
irth
We
igh
t
Mam
mo
gram
Scr
een
ings
Pap
Sm
ear
Scr
een
ings
Sig
mo
ido
sco
py
and
Co
lon
osc
op
y S
cree
nin
gs
Pre
ven
tab
le H
osp
ital
izat
ion
s
De
nta
l Vis
it in
th
e P
ast
Ye
ar
De
nta
l ER
Vis
its
Po
pu
lati
on
to
PC
Pro
vid
er R
atio
Po
pu
lati
on
to
Me
nta
l He
alth
Car
e
Pro
vid
er
Rat
io
Po
pu
lati
on
to
De
nti
st R
atio
TO
TAL
QU
INTI
LE P
OIN
TS
HEA
LTH
CA
RE
AC
CES
S R
AN
K
Ralls 1 2 1 3 4 4 1 1 1 1 2 1 5 5 5 37 30
Randolph 4 2 4 2 3 2 2 3 2 5 4 5 2 3 2 45 52
Ray 1 1 2 2 3 4 5 5 3 4 3 3 3 5 5 49 69
Reynolds 5 4 5 5 5 1 4 3 5 5 5 5 2 1 1 56 92
Ripley 5 5 5 5 5 5 5 5 3 5 5 5 5 5 5 73 115
St. Charles 1 1 1 1 1 3 1 1 1 1 1 1 2 2 1 19 2
St. Clair 5 4 4 5 4 3 2 5 5 5 4 3 2 5 4 60 105
St. Francois 4 2 4 3 3 4 2 4 2 5 3 5 1 1 2 45 52
St. Louis 1 1 1 2 1 5 1 1 1 3 1 2 1 1 1 23 3
St. Louis City 5 4 5 1 5 5 1 1 2 5 2 3 1 1 2 43 47
Ste. Genevieve 1 1 1 3 1 3 2 1 2 2 2 3 3 3 3 31 16
Saline 3 2 4 2 1 4 1 1 2 5 5 3 2 2 3 40 35
Schuyler 4 5 3 4 5 1 3 3 5 4 2 1 3 4 4 51 76
Scotland 3 5 2 2 5 1 5 5 5 4 3 2 1 5 4 52 79
Scott 3 2 5 4 3 5 2 3 3 5 1 3 2 2 1 44 50
Shannon 5 5 5 4 2 2 5 4 5 2 5 5 5 4 4 62 110
Shelby 2 3 3 4 4 5 3 3 3 1 4 1 3 3 3 45 52
Stoddard 2 2 5 5 4 5 4 3 4 5 3 3 2 4 4 55 87
Stone 2 5 2 5 4 4 2 2 1 1 3 4 4 4 5 48 66
Sullivan 2 5 3 4 2 4 5 4 5 5 2 2 2 3 5 53 82
Taney 3 5 3 3 4 4 5 4 4 4 1 5 1 3 3 52 79
Texas 5 5 4 3 2 3 4 4 5 3 5 5 3 5 5 61 107
Vernon 4 4 4 3 5 1 5 3 5 4 4 4 3 1 3 53 82
Warren 1 2 2 2 1 1 3 5 1 3 1 4 5 5 4 40 35
Washington 5 3 5 2 4 5 3 4 4 5 5 5 5 3 3 61 107
Wayne 5 4 5 5 4 5 4 2 4 4 5 3 3 4 5 62 110
Webster 3 4 3 2 5 1 3 2 2 1 3 3 4 2 3 41 39
Worth 2 4 1 5 3 1 5 3 5 2 5 2 2 2 1 43 47
Wright 5 5 5 5 3 4 5 3 4 3 5 2 4 2 2 57 95

Missouri Primary Care Needs Assessment 2015 18
Overall Primary Care Needs Rankings
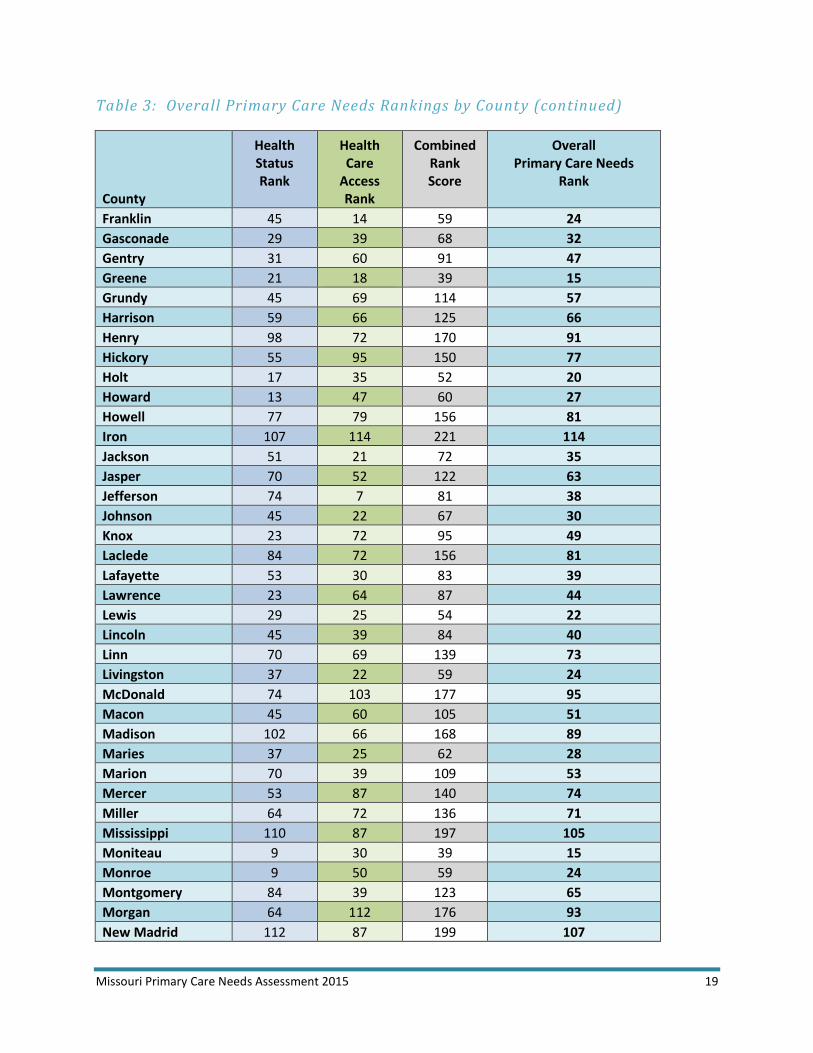
Table 3: Overall Primary Care Needs Rankings by County
County
Health Status Rank
Health Care
Access Rank
Combined Rank Score
Overall Primary Care Needs
Rank
Adair 40 25 65 29
Andrew 23 11 34 13
Atchison 17 18 35 14
Audrain 64 25 89 45
Barry 84 92 176 93
Barton 33 100 133 70
Bates 62 95 157 83
Benton 68 100 168 89
Bollinger 94 52 146 75
Boone 17 3 20 7
Buchanan 96 34 130 67
Butler 113 52 165 87
Caldwell 59 60 119 61
Callaway 45 25 70 34
Camden 16 30 46 18
Cape Girardeau 23 7 30 12
Carroll 55 76 131 68
Carter 104 107 211 109
Cass 34 11 45 17
Cedar 92 85 177 95
Chariton 40 35 75 36
Christian 3 7 10 4
Clark 64 44 108 52
Clay 20 3 23 10
Clinton 40 16 56 23
Cole 4 6 10 4
Cooper 34 52 86 42
Crawford 94 95 189 101
Dade 55 60 115 59
Dallas 59 92 151 78
Daviess 51 85 136 71
DeKalb 23 44 67 30
Dent 99 100 199 107
Douglas 44 87 131 68
Dunklin 111 105 216 110
Missouri Primary Care Needs Assessment 2015 19
Table 3: Overall Primary Care Needs Rankings by Count y (continued)
County
Health Status Rank
Health Care
Access Rank
Combined Rank Score
Overall Primary Care Needs
Rank
Franklin 45 14 59 24
Gasconade 29 39 68 32
Gentry 31 60 91 47
Greene 21 18 39 15
Grundy 45 69 114 57
Harrison 59 66 125 66
Henry 98 72 170 91
Hickory 55 95 150 77
Holt 17 35 52 20
Howard 13 47 60 27
Howell 77 79 156 81
Iron 107 114 221 114
Jackson 51 21 72 35
Jasper 70 52 122 63
Jefferson 74 7 81 38
Johnson 45 22 67 30
Knox 23 72 95 49
Laclede 84 72 156 81
Lafayette 53 30 83 39
Lawrence 23 64 87 44
Lewis 29 25 54 22
Lincoln 45 39 84 40
Linn 70 69 139 73
Livingston 37 22 59 24
McDonald 74 103 177 95
Macon 45 60 105 51
Madison 102 66 168 89
Maries 37 25 62 28
Marion 70 39 109 53
Mercer 53 87 140 74
Miller 64 72 136 71
Mississippi 110 87 197 105
Moniteau 9 30 39 15
Monroe 9 50 59 24
Montgomery 84 39 123 65
Morgan 64 112 176 93
New Madrid 112 87 199 107
Missouri Primary Care Needs Assessment 2015 20
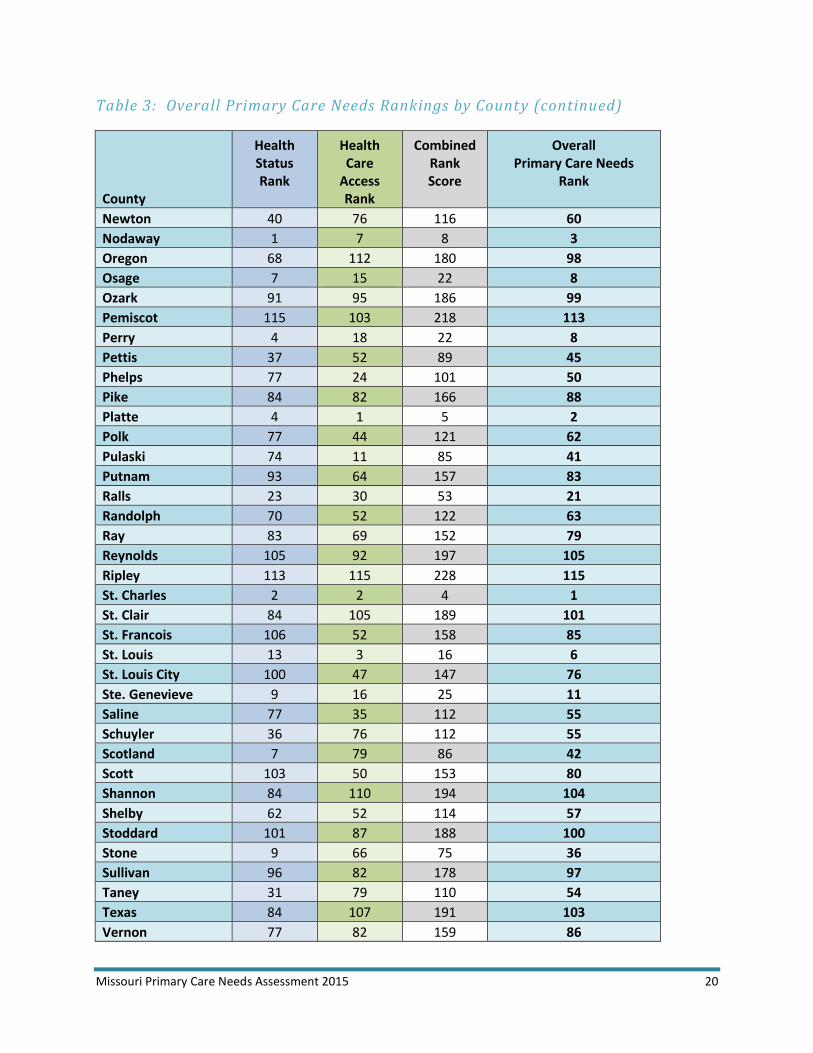
Table 3: Overall Primary Care Needs Rankings by Count y (continued)
County
Health Status Rank
Health Care
Access Rank
Combined Rank Score
Overall Primary Care Needs
Rank
Newton 40 76 116 60
Nodaway 1 7 8 3
Oregon 68 112 180 98
Osage 7 15 22 8
Ozark 91 95 186 99
Pemiscot 115 103 218 113
Perry 4 18 22 8
Pettis 37 52 89 45
Phelps 77 24 101 50
Pike 84 82 166 88
Platte 4 1 5 2
Polk 77 44 121 62
Pulaski 74 11 85 41
Putnam 93 64 157 83
Ralls 23 30 53 21
Randolph 70 52 122 63
Ray 83 69 152 79
Reynolds 105 92 197 105
Ripley 113 115 228 115
St. Charles 2 2 4 1
St. Clair 84 105 189 101
St. Francois 106 52 158 85
St. Louis 13 3 16 6
St. Louis City 100 47 147 76
Ste. Genevieve 9 16 25 11
Saline 77 35 112 55
Schuyler 36 76 112 55
Scotland 7 79 86 42
Scott 103 50 153 80
Shannon 84 110 194 104
Shelby 62 52 114 57
Stoddard 101 87 188 100
Stone 9 66 75 36
Sullivan 96 82 178 97
Taney 31 79 110 54
Texas 84 107 191 103
Vernon 77 82 159 86

Missouri Primary Care Needs Assessment 2015 21
Table 3: Overall Primary Care Needs Rankings by County (continued)
County
Health Status Rank
Health Care
Access Rank
Combined Rank Score
Overall Primary Care Needs
Rank
Warren 13 35 48 19
Washington 109 107 216 110
Wayne 107 110 217 112
Webster 55 39 94 48
Worth 21 47 68 32
Wright 77 95 172 92

Missouri Primary Care Needs Assessment 2015 22
Findings
The areas of highest overall need are primarily clustered in the southern part of the state, particularly in the southeast and south central areas. In fact, 22 of the 23 counties in the highest need quintile are located south of the Missouri River; only one county (Sullivan) is located north of the Missouri River.
Map 1: Missouri Primary Care Needs Assessment – Overall Primary Care Needs Rankings

Missouri Primary Care Needs Assessment 2015 23
The counties with the highest primary care needs, based on the overall rankings, are listed in Figure 2. Nine of the counties are located in the Southeast Behavioral Risk Factor Surveillance System (BRFSS) Region. Most of these counties are located in or near the Bootheel† area. Washington County, in the St. Louis Metro BRFSS Region, and Dent County, in the Central Region, are adjacent to the Southeast BRFSS Region. All of these counties are predominantly rural, although Washington County is part of a Census-designated Metropolitan Statistical Area (MSA) due primarily to its residents’ commuting patterns.
Figure 2: Counties with the Highest Primary Care Needs Ranks
County Health Status Rank
Health Care Access Rank
Combined Rank
Scores
Overall Primary Care Needs
Rank
BRFSS Region (See Appendix B
for Map)
Ripley 113 115 228 115 Southeast
Iron 107 114 221 114 Southeast
Pemiscot 115 103 218 113 Southeast
Wayne 107 110 217 112 Southeast
Dunklin 111 105 216 110 Southeast
Washington 109 107 216 110 St. Louis Metro
Carter 104 107 211 109 Southeast
Dent 99 100 199 107 Central
New Madrid 112 87 199 107 Southeast
Mississippi 110 87 197 105 Southeast
Reynolds 105 92 197 105 Southeast
The counties that received the overall highest need ranks, shown in Figure 2 above, varied somewhat from the highest need counties in each of the primary care categories, listed in Figure 3 below. For example, Butler County tied for the second highest need rank in the health status category but was not one of the highest need counties overall or in the health care access category. Conversely, Morgan and Oregon Counties appeared on the health care access list but not the health status or overall lists.
Figure 3: Counties with the Highest Need Ranks in Each Primary Care Category
Health Status Rank
County Health Care Access Rank
County
115 Pemiscot 115 Ripley
113 Butler, Ripley 114 Iron
112 New Madrid 112 Morgan, Oregon
111 Dunklin 110 Shannon, Wayne
110 Mississippi 107 Carter, Texas, Washington
109 Washington 105 Dunklin, St. Clair
107 Iron, Wayne 103 McDonald, Pemiscot
106 St. Francois 100 Barton, Benton, Dent
105 Reynolds 95 Bates, Crawford, Hickory, Ozark, Wright
104 Carter 92 Barry, Dallas, Reynolds
†Various definitions of the Bootheel exist. This report defines the Bootheel as five counties (Dunklin, Mississippi,
New Madrid, Pemiscot, and Scott) located in the extreme southeast corner of Missouri.

Missouri Primary Care Needs Assessment 2015 24
In contrast, the counties with the lowest primary care needs, based on the overall rankings, are scattered throughout the state. As shown in Figure 4, only the Northeast BRFSS Region is not represented. In general, these are fairly large counties, with 4 having a population greater than 170,000 and 7 having a population over 75,000. All but two (Nodaway and Perry Counties) fall within an MSA. Figure 4: Counties with the Lowest Primary Care Needs Ranks
County
Health Status Rank
Health Care Access Rank
Combined Rank
Scores
Overall Primary Care Needs
Rank
BRFSS Region (See Appendix B
for Map)
St. Charles 2 2 4 1 St. Louis Metro
Platte 4 1 5 2 Kansas City Metro
Nodaway 1 7 8 3 Northwest
Christian 3 7 10 4 Southwest
Cole 4 6 10 4 Central
St. Louis 13 3 16 6 St. Louis Metro
Boone 17 3 20 7 Central
Osage 7 15 22 8 Central
Perry 4 18 22 8 Southeast
Clay 20 3 23 10 Northwest
The counties that received the overall lowest need ranks, shown in Figure 4 above, differed slightly from the lowest need counties in each of the primary care categories, listed in Figure 5 below. For example, Ste. Genevieve and Atchison received two of the lowest need ranks for both health status and health care access but were not among the ten lowest need ranks on the overall need list. Several counties (Scotland, Moniteau, Monroe, Stone, Howard, Warren, Camden, and Holt) received low need ranks for health status but not for health care access, while Cape Girardeau, Jefferson, Andrew, Cass, Pulaski, Franklin, Clinton, and Greene received low need ranks for health care access but not health status.
Figure 5: Counties with the Lowest Need Ranks in Each Primary Care Category
Health Status Rank
County Health Care Access Rank
County
1 Nodaway 1 Platte
2 St. Charles 2 St. Charles
3 Christian 3 Boone, Clay, St. Louis
4 Cole, Perry, Platte 6 Cole
7 Osage, Scotland 7 Cape Girardeau, Christian, Jefferson, Nodaway
9 Moniteau, Monroe, Ste. Genevieve, Stone
11 Andrew, Cass, Pulaski
13 Howard, St. Louis, Warren
14 Franklin
16 Camden 15 Osage
17 Atchison, Boone, Holt 16 Clinton, Ste. Genevieve
20 Clay 18 Atchison, Greene, Perry

Missouri Primary Care Needs Assessment 2015 25
The differences between the overall and the category rankings are further illustrated by maps of the health status and health care access rankings. While both of these maps generally resemble the map for the overall primary care needs rankings, they also reveal some important differences. For example, while there is a distinct grouping of counties with low health status ranks in the southeast corner of the state, a few other individual counties (Buchanan, Henry, Putnam, St. Louis City, and Sullivan) that also fell into the highest need quintile are scattered throughout the state.
Map 2: Missouri Primary Care Needs Assessment – Health Status Rankings

Missouri Primary Care Needs Assessment 2015 26
The health care access rankings map resembles the overall map in that the areas with the highest need for health care access are overwhelmingly found in the southern half of the state. However, the largest cluster of high need is not located solidly around the Bootheel, as might be expected from the overall rankings map. While there are counties with poor health care access in the Bootheel, the largest grouping of counties with low health care access ranks is found just west of the Bootheel in south central Missouri. Smaller clusters of low health care access can be found throughout the southern half of the state, from the eastern border to the western border.
Map 3: Missouri Primary Care Needs Assessment – Health Care Access Rankings

Missouri Primary Care Needs Assessment 2015 27
APPENDIX A
Health Status and Health Care Access Indicators
Health Status Indicators
Table 4: Health Status Indicators – Life Expectancy, Years of Potential Life Lost, and Ever Breastfed
Table 5: Health Status Indicators – Fair or Poor Self-Reported Health Status, Obesity, and Hypertension
Table 6: Health Status Indicators – High Cholesterol, Smoking, and Diabetes
Table 7: Health Status Indicators – Asthma, Depressive Disorders, and HIV/AIDS
Table 8: Health Status Indicators – Total Mortality, Infant Mortality, and Heart Disease Mortality
Table 9: Health Status Indicators – Cancer Mortality, Chronic Lower Respiratory Disease (CLRD) Mortality, and Stroke Mortality
Health Care Access Indicators
Table 10: Health Care Access Indicators – Poverty, Uninsured, and Medicaid Enrollment
Table 11: Health Care Access Indicators – Medicare Enrollment, Inadequate Prenatal Care, and Low Birth Weight
Table 12: Health Care Access Indicators – Preventable Hospitalizations, Dental Visit in Past Year, and Dental-Related Emergency Room Visits
Table 13: Health Care Access Indicators – Lack of Mammogram, Pap Test, and Sigmoidoscopy/ Colonoscopy Screenings
Table 14: Health Care Access Indicators – Population-to-Provider Ratios for Primary Care Providers, Mental Health Providers, and Dentists
Missouri Primary Care Needs Assessment 2015 28
Table 4: Health Status Indicators – Life Expectancy, Years of Potential Life Lost,
and Ever Breastfed
Life Expectancy Data Sources and Notes:
Life expectancy at birth provides an estimate of the number of years a person born during the given time period is expected to live if current mortality trends continue. It is a good measure of the overall health of an area.
The life expectancy rates included in this report are based on birth and death data from 2004 through 2012 and population data from 2008.
Life expectancy rates for Missouri, its 115 counties (114 counties plus the City of St. Louis, which is an independent city), and Missouri’s seven Behavioral Risk Factor Surveillance System (BRFSS) Regions are available at http://www.health.mo.gov/data/lifeexpectancy/. Data are also available for Independence, Joplin, Kansas City, and Eastern Jackson County in the 2004-2012 file.
Years of Potential Life Lost Data Sources and Notes:
The years of potential life lost (YPLL) calculation estimates the number of life years lost to premature deaths. Thus, it emphasizes deaths of younger residents. Age 75 is used as the benchmark for YPLL calculations. Similar to life expectancy, YPLL is a good measure of the overall health of an area.
The YPLL rates included in this report reflect the years of potential life lost per 100,000 residents and are calculated using death and population data from 2012 for residents under the age of 75.
YPLL totals and rates for Missouri and its 115 counties (114 counties plus the City of St. Louis, which is an independent city) are available at http://www.health.mo.gov/data/ypll/. Data are also available for Independence, Joplin, Kansas City, and Eastern Jackson County.
Ever Breastfed Data Sources and Notes:
“Breast milk is widely acknowledged to be the most complete form of nutrition for most infants, with a range of benefits for their health, growth, immunity, and development.”1 “The nutritional, immunologic, allergenic, economic and psychological advantages of breastfeeding are well recognized. Breastfeeding is nutritionally superior to any alternative infant feeding method and provides immunity to many viral and bacterial diseases; enhances infants' immunologic defenses; prevents or reduces risk of respiratory and diarrhea diseases; promotes correct development of jaws, teeth and speech patterns; decreases tendency toward childhood obesity and facilitates maternal infant attachment.”2
Ever Breastfed rates reflect the number of 2012-2013 WIC Infant participants who had ever been breastfed prior to or on their WIC certification date divided by the number of 2012-2013 WIC Infant participants with known ever breastfed status as of their WIC certification date.
Ever Breastfed rates were calculated using data provided by the Missouri WIC Program for use in the WIC Infant MICA. Rates for years prior to 2009 are available through the WIC MICA. Rates for years 2009 and later are available by request from the Missouri Department of Health and Senior Services – Bureau of Health Care Analysis and Data Dissemination.

Missouri Primary Care Needs Assessment 2015 29
Table 4: Health Status Indicators – Life Expectancy, Years of Potential Life Lost,
and Ever Breastfed (continued)
Life Expectancy at Birth, 2004-2012
Years of Potential Life Lost, 2012
Ever Breastfed, 2012-2013
Geography Rate Basic Rank
Quintile Points
Rate Basic Rank
Quintile Points
Rate Basic Rank
Quintile Points
Missouri 77.2 8,106 67.0
Adair 77.7 33 2 6,148 9 1 68.6 51 3
Andrew 77.8 29 2 8,274 46 2 74.3 23 1
Atchison 78.3 14 1 8,641 52 3 81.2 2 1
Audrain 77.2 46 2 8,729 57 3 60.6 87 4
Barry 75.7 89 4 10,813 91 4 70.0 43 2
Barton 77.5 36 2 8,670 54 3 65.3 66 3
Bates 76.7 55 3 10,903 93 5 63.4 73 4
Benton 76.1 79 4 11,640 104 5 67.0 58 3
Bollinger 75.8 87 4 9,492 75 4 68.5 53 3
Boone 79.6 3 1 4,903 3 1 72.6 30 2
Buchanan 76.2 70 4 8,960 64 3 61.0 82 4
Butler 74.0 106 5 10,864 92 4 58.2 91 4
Caldwell 75.9 85 4 13,127 110 5 63.3 75 4
Callaway 77.0 48 3 8,689 55 3 70.3 40 2
Camden 78.2 19 1 7,649 32 2 75.8 16 1
Cape Girardeau
78.1 22 1 6,950 19 1 61.4 81 4
Carroll 75.9 83 4 11,012 96 5 64.7 69 3
Carter 72.3 113 5 12,383 109 5 53.5 104 5
Cass 78.1 26 2 6,671 13 1 71.5 35 2
Cedar 75.7 91 4 10,019 80 4 63.4 74 4
Chariton 78.1 25 2 6,735 15 1 73.3 26 2
Christian 79.0 5 1 6,169 10 1 77.8 11 1
Clark 76.2 69 3 8,184 45 2 50.0 110 5
Clay 78.7 9 1 6,352 11 1 72.9 29 2
Clinton 76.0 81 4 10,403 85 4 70.9 37 2
Cole 78.3 15 1 7,276 28 2 67.4 57 3
Cooper 77.3 42 2 8,723 56 3 74.6 21 1
Crawford 75.9 84 4 8,305 47 3 64.7 69 3
Dade 76.1 77 4 8,628 51 3 66.3 61 3
Dallas 76.4 66 3 6,998 25 2 57.3 94 5
Daviess 77.2 44 2 6,970 21 1 78.3 8 1

Missouri Primary Care Needs Assessment 2015 30
Table 4: Health Status Indicators – Life Expectancy, Years of Potential Life Lost ,
and Ever Breastfed (continued)
Life Expectancy at Birth, 2004-2012
Years of Potential Life Lost, 2012
Ever Breastfed, 2012-2013
Geography Rate Basic Rank
Quintile Points
Rate Basic Rank
Quintile Points
Rate Basic Rank
Quintile Points
DeKalb 77.6 35 2 10,145 83 4 75.0 18 1
Dent 75.3 98 5 9,217 72 4 60.9 84 4
Douglas 77.3 41 2 8,576 49 3 70.3 41 2
Dunklin 72.0 114 5 14,598 114 5 48.4 112 5
Franklin 76.7 57 3 9,196 69 3 60.0 88 4
Gasconade 76.6 58 3 10,452 88 4 66.2 64 3
Gentry 78.1 23 1 6,696 14 1 61.0 83 4
Greene 77.8 31 2 7,742 37 2 78.5 6 1
Grundy 77.5 37 2 8,480 48 3 57.7 92 4
Harrison 77.3 43 2 11,013 97 5 70.3 38 2
Henry 75.3 97 5 11,038 98 5 68.6 49 3
Hickory 76.9 50 3 12,161 107 5 55.8 96 5
Holt 78.4 13 1 6,442 12 1 62.3 79 4
Howard 78.3 18 1 5,332 5 1 52.1 108 5
Howell 75.1 100 5 10,070 81 4 73.3 25 2
Iron 73.7 107 5 14,205 112 5 53.7 103 5
Jackson 76.4 67 3 8,922 62 3 73.1 28 2
Jasper 76.1 75 4 8,932 63 3 66.7 59 3
Jefferson 76.1 74 4 8,734 58 3 61.8 80 4
Johnson 78.0 27 2 6,014 8 1 80.3 3 1
Knox 77.1 47 3 8,655 53 3 78.4 7 1
Laclede 76.1 76 4 8,895 61 3 72.5 31 2
Lafayette 77.5 38 2 7,277 29 2 70.0 45 2
Lawrence 76.8 54 3 7,917 40 2 78.5 5 1
Lewis 77.7 32 2 7,705 35 2 70.0 44 2
Lincoln 76.9 49 3 6,972 22 1 63.8 72 4
Linn 76.7 56 3 9,253 73 4 62.6 77 4
Livingston 76.8 53 3 8,129 44 2 68.6 50 3
Macon 76.6 61 3 9,199 70 4 66.5 60 3
Madison 74.4 103 5 11,010 95 5 57.5 93 5
Maries 77.6 34 2 7,931 41 2 65.5 65 3
Marion 76.6 59 3 6,976 23 1 65.3 67 3
McDonald 74.7 101 5 11,269 100 5 67.9 56 3

Missouri Primary Care Needs Assessment 2015 31
Table 4: Health Status Indicators – Life Expectancy, Years of Potential Life Lost,
and Ever Breastfed (continued)
Life Expectancy at Birth, 2004-2012
Years of Potential Life Lost, 2012
Ever Breastfed, 2012-2013
Geography Rate Basic Rank
Quintile Points
Rate Basic Rank
Quintile Points
Rate Basic Rank
Quintile Points
Mercer 78.1 24 2 7,671 34 2 54.9 99 5
Miller 76.2 72 4 9,073 66 3 66.3 62 3
Mississippi 73.2 110 5 14,258 113 5 32.1 115 5
Moniteau 77.8 30 2 6,818 17 1 64.2 71 4
Monroe 78.3 17 1 5,703 6 1 76.1 14 1
Montgomery 76.2 73 4 7,486 30 2 69.1 47 3
Morgan 75.8 88 4 9,774 79 4 70.3 39 2
New Madrid 72.9 111 5 13,744 111 5 34.6 114 5
Newton 76.8 51 3 8,056 43 2 78.6 4 1
Nodaway 79.4 4 1 4,520 2 1 74.9 20 1
Oregon 75.9 86 4 10,446 87 4 49.1 111 5
Osage 78.8 7 1 9,277 74 4 68.2 55 3
Ozark 75.2 99 5 11,046 99 5 74.6 22 1
Pemiscot 71.7 115 5 15,634 115 5 36.2 113 5
Perry 78.5 12 1 6,775 16 1 53.4 105 5
Pettis 77.4 39 2 7,727 36 2 73.5 24 2
Phelps 76.3 68 3 9,590 77 4 69.1 46 2
Pike 76.5 62 3 7,933 42 2 54.9 100 5
Platte 80.2 1 1 5,729 7 1 78.3 10 1
Polk 76.2 71 4 7,816 39 2 76.0 15 1
Pulaski 76.0 80 4 7,065 26 2 72.0 33 2
Putnam 76.4 64 3 11,862 105 5 68.4 54 3
Ralls 79.0 6 1 7,490 31 2 60.8 85 4
Randolph 76.5 63 3 9,078 67 3 68.6 52 3
Ray 76.0 82 4 10,136 82 4 52.5 107 5
Reynolds 74.2 105 5 11,447 103 5 62.5 78 4
Ripley 72.7 112 5 10,518 89 4 55.6 97 5
Saline 76.6 60 3 7,181 27 2 77.2 12 1
Schuyler 76.8 52 3 8,773 59 3 71.0 36 2
Scotland 78.1 21 1 6,990 24 2 55.6 97 5
Scott 75.4 96 5 11,303 101 5 54.0 102 5
Shannon 75.4 95 5 10,433 86 4 72.0 32 2
Shelby 77.3 40 2 9,205 71 4 75.0 18 1

Missouri Primary Care Needs Assessment 2015 32
Table 4: Health Status Indicators – Life Expectancy, Years of Potential Life Lost,
and Ever Breastfed (continued)
Life Expectancy at Birth, 2004-2012
Years of Potential Life Lost, 2012
Ever Breastfed, 2012-2013
Geography Rate Basic Rank
Quintile Points
Rate Basic Rank
Quintile Points
Rate Basic Rank
Quintile Points
St. Charles 80.1 2 1 5,006 4 1 73.2 27 2
St. Clair 75.7 90 4 10,989 94 5 60.7 86 4
St. Francois 74.6 102 5 12,271 108 5 58.8 90 4
St. Louis 78.7 10 1 6,947 18 1 63.0 76 4
St. Louis City 73.2 109 5 11,421 102 5 56.4 95 5
Ste. Genevieve
78.5 11 1 9,007 65 3 66.3 63 3
Stoddard 75.7 92 4 11,886 106 5 54.6 101 5
Stone 78.2 20 1 8,889 60 3 75.3 17 1
Sullivan 76.4 65 3 9,119 68 3 59.1 89 4
Taney 77.8 28 2 7,656 33 2 76.8 13 1
Texas 76.1 78 4 9,590 78 4 70.1 42 2
Vernon 75.5 93 5 8,602 50 3 53.1 106 5
Warren 78.3 16 1 6,954 20 1 71.6 34 2
Washington 73.7 108 5 10,283 84 4 50.2 109 5
Wayne 74.3 104 5 9,557 76 4 65.0 68 3
Webster 77.2 45 2 7,791 38 2 78.3 8 1
Worth 78.7 8 1 3,755 1 1 82.1 1 1
Wright 75.5 94 5 10,578 90 4 68.8 48 3

Missouri Primary Care Needs Assessment 2015 33
Table 5: Health Status Indicators – Fair or Poor Self-Reported Health Status,
Obesity, and Hypertension
Fair or Poor Self-Reported Health Status Data Sources and Notes:
“Self-reported current health status is a good predictor of future disability, hospitalization and mortality.”3
Fair or Poor Self-Reported Health Status rates are age-adjusted percentages from the 2011 County-Level Study survey of non-institutionalized Missouri resident adults ages 18 and older.
Fair or Poor Self-Reported Health Status is derived from "fair" or "poor" responses to the following question: “Would you say that in general your health is excellent, very good, good, fair, or poor?”
Obesity Data Sources and Notes:
Obesity has been identified as a risk factor for many serious diseases and conditions, including coronary heart disease, high blood pressure (hypertension), stroke, type 2 diabetes, metabolic syndrome, cancer, osteoarthritis, and sleep apnea.4
Obesity rates are age-adjusted percentages from the 2011 County-Level Study survey of non-institutionalized Missouri resident adults ages 18 and older.
Obesity is based on a body mass index (BMI) of 30 or greater and is derived from responses to the following questions: “About how much do you weigh without shoes?” AND “About how tall are you without shoes?”
Hypertension Data Sources and Notes:
Hypertension, or high blood pressure, “is a serious condition that can lead to coronary heart disease, heart failure, stroke, kidney failure, and other health problems.”5
Hypertension rates are age-adjusted percentages from the 2011 County-Level Study survey of non-institutionalized Missouri resident adults ages 18 and older.
Hypertension is derived from a response of any length of time to the question, "About how long has it been since you last had your blood pressure checked?” AND a "yes" response to the following question: “Have you ever been told by a doctor, nurse, or other health professional that you have high blood pressure? (Females who responded "yes" to having been told had HBP only when pregnant are not included as having HBP.)” The denominator for the rate includes only those respondents who had ever had their blood pressure checked.

Missouri Primary Care Needs Assessment 2015 34
Table 5: Health Status Indicators – Fair or Poor Self-Reported Health Status,
Obesity, and Hypertension (continued)
Fair or Poor Self-Reported Health Status, 2011
Obesity, 2011
Hypertension, 2011
Geography Rate Basic Rank
Quintile Points
Rate Basic Rank
Quintile Points
Rate Basic Rank
Quintile Points
Missouri 19.3 30.0 32.6
Adair 17.5 24 2 33.0 59 3 25.4 4 1
Andrew 17.4 23 1 37.2 94 5 27.9 17 1
Atchison 14.8 13 1 30.6 40 2 29.9 29 2
Audrain 23.9 73 4 38.8 103 5 41.1 105 5
Barry 18.4 28 2 30.6 40 2 30.0 30 2
Barton 20.9 45 2 31.4 46 2 37.4 92 4
Bates 26.7 90 4 28.7 32 2 36.3 88 4
Benton 24.4 78 4 29.8 37 2 25.9 5 1
Bollinger 28.3 96 5 37.1 93 5 33.2 56 3
Boone 15.4 15 1 28.0 25 2 30.3 32 2
Buchanan 21.2 47 3 31.9 52 3 34.8 74 4
Butler 41.5 113 5 34.2 70 4 39.3 99 5
Caldwell 20.8 44 2 26.3 12 1 29.1 24 2
Callaway 23.1 61 3 32.5 56 3 26.3 7 1
Camden 18.2 26 2 26.7 13 1 35.9 83 4
Cape Girardeau
16.2 18 1 24.9 5 1 35.0 75 4
Carroll 24.3 76 4 42.1 109 5 34.1 69 3
Carter 28.7 97 5 45.8 113 5 32.4 51 3
Cass 16.6 20 1 31.6 48 3 30.4 33 2
Cedar 36.4 110 5 34.6 76 4 33.0 54 3
Chariton 20.5 40 2 39.3 105 5 42.1 108 5
Christian 18.9 30 2 26.9 14 1 28.1 20 1
Clark 24.6 81 4 33.9 69 3 26.5 8 1
Clay 19.4 33 2 31.2 45 2 30.6 39 2
Clinton 14.2 9 1 27.2 18 1 24.4 1 1
Cole 10.8 1 1 25.7 8 1 28.2 21 1
Cooper 23.3 64 3 24.4 4 1 30.4 33 2
Crawford 25.1 82 4 33.4 63 3 39.9 103 5
Dade 13.3 6 1 34.7 78 4 31.9 47 3
Dallas 26.4 86 4 37.6 97 5 41.5 106 5
Daviess 24.2 75 4 37.3 96 5 33.9 65 3

Missouri Primary Care Needs Assessment 2015 35
Table 5: Health Status Indicators – Fair or Poor Self-Reported Health Status,
Obesity, and Hypertension (continued)
Fair or Poor Self-Reported Health Status, 2011
Obesity, 2011
Hypertension, 2011
Geography Rate Basic Rank
Quintile Points
Rate Basic Rank
Quintile Points
Rate Basic Rank
Quintile Points
DeKalb 22.9 59 3 28.0 25 2 36.7 89 4
Dent 30.7 103 5 33.5 64 3 35.6 78 4
Douglas 20.9 45 2 34.2 70 4 26.2 6 1
Dunklin 37.1 111 5 33.3 62 3 45.5 114 5
Franklin 18.4 28 2 30.0 38 2 35.9 83 4
Gasconade 12.8 5 1 35.6 83 4 27.2 11 1
Gentry 18.2 26 2 35.7 85 4 27.2 11 1
Greene 19.3 32 2 25.7 8 1 29.7 28 2
Grundy 16.0 16 1 27.8 23 1 33.5 58 3
Harrison 20.2 37 2 34.7 78 4 36.1 86 4
Henry 23.7 71 4 41.6 108 5 30.4 33 2
Hickory 23.6 69 3 32.9 58 3 34.0 66 3
Holt 14.0 7 1 36.7 90 4 31.3 44 2
Howard 16.5 19 1 36.1 88 4 30.7 40 2
Howell 21.2 47 3 24.2 3 1 31.1 43 2
Iron 32.7 106 5 32.0 53 3 35.5 77 4
Jackson 19.9 35 2 28.3 28 2 32.4 51 3
Jasper 20.5 40 2 35.8 86 4 39.5 100 5
Jefferson 14.7 12 1 33.0 59 3 33.6 60 3
Johnson 23.5 68 3 33.5 64 3 35.6 78 4
Knox 23.2 63 3 31.1 42 2 30.5 38 2
Laclede 23.1 61 3 27.7 22 1 32.2 50 3
Lafayette 22.0 54 3 40.3 106 5 38.5 96 5
Lawrence 14.4 11 1 33.2 61 3 29.2 25 2
Lewis 16.1 17 1 34.2 70 4 32.1 49 3
Lincoln 20.6 43 2 31.8 49 3 31.8 46 2
Linn 18.1 25 2 38.4 101 5 29.2 25 2
Livingston 21.4 51 3 35.1 81 4 27.9 17 1
Macon 23.4 67 3 29.0 33 2 34.0 66 3
Madison 30.7 103 5 27.2 18 1 34.3 70 4
Maries 21.3 50 3 37.8 98 5 30.4 33 2
Marion 22.8 58 3 40.7 107 5 30.1 31 2
McDonald 21.4 51 3 28.6 30 2 29.0 23 1

Missouri Primary Care Needs Assessment 2015 36
Table 5: Health Status Indicators – Fair or Poor Self-Reported Health Status,
Obesity, and Hypertension (continued)
Fair or Poor Self-Reported Health Status, 2011
Obesity, 2011
Hypertension, 2011
Geography Rate Basic Rank
Quintile Points
Rate Basic Rank
Quintile Points
Rate Basic Rank
Quintile Points
Mercer 21.2 47 3 38.7 102 5 29.4 27 2
Miller 27.5 92 4 31.8 49 3 35.8 82 4
Mississippi 27.2 91 4 33.7 67 3 38.0 94 5
Moniteau 22.3 56 3 32.1 54 3 26.6 9 1
Monroe 23.3 64 3 31.1 42 2 27.1 10 1
Montgomery 20.5 40 2 37.9 99 5 34.7 73 4
Morgan 25.2 83 4 29.7 36 2 36.7 89 4
New Madrid 35.7 109 5 52.6 115 5 42.3 109 5
Newton 22.6 57 3 35.6 83 4 30.4 33 2
Nodaway 11.4 3 1 23.6 2 1 34.5 72 4
Oregon 26.4 86 4 32.3 55 3 33.6 60 3
Osage 20.3 39 2 27.1 17 1 25.2 2 1
Ozark 31.5 105 5 33.5 64 3 30.8 41 2
Pemiscot 37.8 112 5 36.6 89 4 51.8 115 5
Perry 14.1 8 1 27.3 20 1 33.6 60 3
Pettis 21.5 53 3 29.6 35 2 33.0 54 3
Phelps 26.6 88 4 37.2 94 5 37.5 93 5
Pike 26.6 88 4 31.8 49 3 38.3 95 5
Platte 11.3 2 1 28.6 30 2 27.6 13 1
Polk 23.6 69 3 34.3 74 4 37.2 91 4
Pulaski 17.2 22 1 30.2 39 2 38.6 97 5
Putnam 28.7 97 5 33.7 67 3 33.5 58 3
Ralls 19.1 31 2 34.6 76 4 35.6 78 4
Randolph 24.3 76 4 31.5 47 3 32.9 53 3
Ray 22.2 55 3 35.9 87 4 36.2 87 4
Reynolds 30.4 101 5 38.0 100 5 41.8 107 5
Ripley 35.2 108 5 42.6 110 5 44.6 113 5
Saline 20.1 36 2 38.9 104 5 34.0 66 3
Schuyler 24.5 79 4 36.7 90 4 27.8 16 1
Scotland 14.3 10 1 22.2 1 1 25.2 2 1
Scott 28.2 94 5 26.1 11 1 35.9 83 4
Shannon 28.1 93 5 26.9 14 1 34.4 71 4
Shelby 24.5 79 4 42.7 111 5 42.7 111 5

Missouri Primary Care Needs Assessment 2015 37
Table 5: Health Status Indicators – Fair or Poor Self-Reported Health Status,
Obesity, and Hypertension (continued)
Fair or Poor Self-Reported Health Status, 2011
Obesity, 2011
Hypertension, 2011
Geography Rate Basic Rank
Quintile Points
Rate Basic Rank
Quintile Points
Rate Basic Rank
Quintile Points
St. Charles 12.5 4 1 25.2 6 1 27.6 13 1
St. Clair 34.4 107 5 25.6 7 1 30.8 41 2
St. Francois 29.2 99 5 34.9 80 4 43.6 112 5
St. Louis 14.8 13 1 28.2 27 2 31.9 47 3
St. Louis City 22.9 59 3 31.1 42 2 35.7 81 4
Ste. Genevieve
20.2 37 2 25.9 10 1 31.5 45 2
Stoddard 28.2 94 5 28.4 29 2 39.5 100 5
Stone 24.1 74 4 27.6 21 1 39.7 102 5
Sullivan 25.7 84 4 35.4 82 4 38.8 98 5
Taney 25.7 84 4 29.3 34 2 27.6 13 1
Texas 29.5 100 5 34.2 70 4 35.0 75 4
Vernon 23.7 71 4 32.5 56 3 33.3 57 3
Warren 16.7 21 1 34.5 75 4 33.6 60 3
Washington 44.1 115 5 43.9 112 5 42.5 110 5
Wayne 41.8 114 5 36.9 92 4 40.8 104 5
Webster 30.4 101 5 27.8 23 1 28.0 19 1
Worth 19.5 34 2 51.4 114 5 33.8 64 3
Wright 23.3 64 3 26.9 14 1 28.7 22 1

Missouri Primary Care Needs Assessment 2015 38
Table 6: Health Status Indicators – High Cholesterol, Smoking, and Diabetes
High Cholesterol Data Sources and Notes:
High cholesterol increases a person’s risk of developing heart disease and having a stroke.6 Heart disease is the leading cause of death for Missouri residents, while stroke is the fourth leading cause of death.7
High cholesterol rates are age-adjusted percentages from the 2011 County-Level Study survey of non-institutionalized Missouri resident adults ages 18 and older.
High cholesterol rates are derived from "yes" responses from respondents ages 35 and older to the following questions: “Blood cholesterol is a fatty substance found in the blood. Have you ever had your blood cholesterol checked?” AND “Have you ever been told by a doctor, nurse, or other health professional that your blood cholesterol is high? “
Smoking Data Sources and Notes:
“Smoking is the leading cause of preventable death in the United States… Smokers are more likely than nonsmokers to develop heart disease, stroke, and lung cancer.”8 An estimated 105,913 Missouri resident deaths during the 2002-2012 time period are considered to be smoking attributable.9 Based on 2013 data, Missouri ranked 43rd in the nation for percentage of adults who are current smokers.10
Smoking rates are age-adjusted percentages from the 2011 County-Level Study survey of non-institutionalized Missouri resident adults ages 18 and older.
Smoking rates are derived from "yes" responses to the question: “Have you smoked at least 100 cigarettes in your entire life?” AND "every day" or "some days" responses to the question: “Do you now smoke cigarettes every day, some days, or not at all?”
Diabetes Data Sources and Notes:
“Diabetes is the leading cause of kidney failure, nontraumatic lower-limb amputations, and new cases of blindness among adults in the United States. [It is also] a major cause of heart disease and stroke.”11 Diabetes is the seventh leading cause of death in Missouri.12
Diabetes rates are age-adjusted percentages from the 2011 County-Level Study survey of non-institutionalized Missouri resident adults ages 18 and older.
Diabetes rates are derived from "yes" responses to the following question: “Have you ever been told by a doctor that you have diabetes?” (Females who responded “yes” to having been told they had diabetes only when pregnant and those that were told they had pre-diabetes or borderline diabetes are not included as having diabetes.)

Missouri Primary Care Needs Assessment 2015 39
Table 6: Health Status Indicators – High Cholesterol, Smoking, and Diabetes
(continued)
High Cholesterol, 2011
Smoking, 2011
Diabetes, 2011
Geography Rate Basic Rank
Quintile Points
Rate Basic Rank
Quintile Points
Rate Basic Rank
Quintile Points
Missouri 42.9 23.6 9.9
Adair 45.1 66 3 22.3 31 2 11.3 78 4
Andrew 44.9 64 3 27.8 86 4 5.8 2 1
Atchison 40.0 25 2 23.5 43 2 10.8 66 3
Audrain 44.7 62 3 24.9 54 3 9.6 45 2
Barry 46.2 78 4 28.9 90 4 13.0 96 5
Barton 54.0 109 5 18.1 12 1 14.1 104 5
Bates 39.1 15 1 17.3 9 1 9.9 51 3
Benton 39.6 19 1 25.6 60 3 10.4 63 3
Bollinger 46.8 83 4 26.4 67 3 14.9 106 5
Boone 45.6 73 4 21.3 30 2 10.3 60 3
Buchanan 40.5 27 2 27.6 84 4 11.9 85 4
Butler 52.8 106 5 33.2 101 5 17.3 114 5
Caldwell 44.6 59 3 27.3 79 4 10.9 68 3
Callaway 46.4 79 4 26.0 63 3 11.1 72 4
Camden 45.4 68 3 30.2 94 5 8.6 32 2
Cape Girardeau
43.8 52 3 21.1 28 2 9.8 49 3
Carroll 42.3 43 2 17.4 11 1 10.2 57 3
Carter 46.9 85 4 26.0 63 3 16.9 112 5
Cass 44.8 63 3 22.3 31 2 11.2 75 4
Cedar 41.7 37 2 23.6 45 2 8.0 23 1
Chariton 49.8 99 5 25.4 59 3 8.8 33 2
Christian 42.2 41 2 20.1 20 1 6.3 4 1
Clark 37.4 11 1 25.9 62 3 13.0 96 5
Clay 42.9 49 3 18.7 14 1 10.0 53 3
Clinton 44.3 57 3 21.0 27 2 9.4 41 2
Cole 36.6 8 1 12.3 2 1 8.4 28 2
Cooper 40.8 28 2 24.4 49 3 10.2 57 3
Crawford 51.3 102 5 39.5 112 5 14.0 103 5
Dade 36.9 9 1 45.4 114 5 6.6 10 1
Dallas 41.8 38 2 26.3 66 3 12.2 88 4
Daviess 50.9 101 5 20.8 24 2 6.3 4 1

Missouri Primary Care Needs Assessment 2015 40
Table 6: Health Status Indicators – High Cholesterol, Smoking, and Diabetes
(continued)
High Cholesterol, 2011
Smoking, 2011
Diabetes, 2011
Geography Rate Basic Rank
Quintile Points
Rate Basic Rank
Quintile Points
Rate Basic Rank
Quintile Points
DeKalb 38.0 14 1 20.7 23 1 7.5 16 1
Dent 46.8 83 4 30.6 95 5 11.6 80 4
Douglas 48.7 93 5 20.0 19 1 10.6 64 3
Dunklin 59.2 115 5 27.6 84 4 15.8 109 5
Franklin 41.6 35 2 23.7 47 3 6.8 11 1
Gasconade 39.1 15 1 18.1 12 1 6.8 11 1
Gentry 44.0 53 3 26.8 73 4 9.1 37 2
Greene 45.4 68 3 23.3 40 2 9.0 35 2
Grundy 42.3 43 2 34.4 104 5 6.9 13 1
Harrison 39.6 19 1 28.3 89 4 12.9 95 5
Henry 47.8 88 4 25.6 60 3 10.0 53 3
Hickory 35.8 6 1 35.1 107 5 8.1 25 2
Holt 40.2 26 2 33.6 103 5 6.4 6 1
Howard 33.7 4 1 20.5 22 1 5.7 1 1
Howell 37.5 13 1 27.5 82 4 10.8 66 3
Iron 47.9 89 4 38.0 111 5 13.5 99 5
Jackson 42.1 40 2 24.9 54 3 9.9 51 3
Jasper 41.5 32 2 23.5 43 2 11.0 70 4
Jefferson 42.8 48 3 21.1 28 2 9.5 43 2
Johnson 45.9 74 4 24.4 49 3 15.8 109 5
Knox 41.6 35 2 15.4 5 1 7.4 14 1
Laclede 48.0 91 4 23.3 40 2 11.7 83 4
Lafayette 44.0 53 3 19.2 15 1 9.0 35 2
Lawrence 39.8 21 1 25.1 56 3 7.4 14 1
Lewis 39.3 18 1 20.8 24 2 8.0 23 1
Lincoln 45.9 74 4 23.0 39 2 7.9 21 1
Linn 52.7 104 5 24.3 48 3 10.0 53 3
Livingston 46.6 82 4 22.3 31 2 12.2 88 4
Macon 45.5 71 4 24.7 52 3 8.1 25 2
Madison 45.2 67 3 29.4 92 4 15.6 108 5
Maries 45.9 74 4 24.8 53 3 8.5 30 2
Marion 41.5 32 2 27.4 81 4 12.1 86 4
McDonald 45.5 71 4 26.8 73 4 9.4 41 2

Missouri Primary Care Needs Assessment 2015 41
Table 6: Health Status Indicators – High Cholesterol, Smoking, and Diabetes
(continued)
High Cholesterol, 2011
Smoking, 2011
Diabetes, 2011
Geography Rate Basic Rank
Quintile Points
Rate Basic Rank
Quintile Points
Rate Basic Rank
Quintile Points
Mercer 49.3 95 5 32.3 100 5 8.3 27 2
Miller 47.9 89 4 22.7 36 2 10.9 68 3
Mississippi 49.5 97 5 32.2 99 5 9.8 49 3
Moniteau 39.1 15 1 17.3 9 1 7.6 17 1
Monroe 41.2 29 2 25.3 57 3 11.6 80 4
Montgomery 59.1 114 5 29.5 93 5 9.2 38 2
Morgan 44.0 53 3 20.8 24 2 7.7 18 1
New Madrid 49.5 97 5 22.7 36 2 13.8 102 5
Newton 39.9 22 1 19.7 17 1 11.0 70 4
Nodaway 35.3 5 1 13.7 4 1 7.8 19 1
Oregon 48.6 92 4 26.5 70 4 9.3 39 2
Osage 42.7 47 3 15.8 7 1 6.4 6 1
Ozark 47.2 86 4 36.7 110 5 11.1 72 4
Pemiscot 55.6 113 5 48.3 115 5 16.3 111 5
Perry 36.3 7 1 26.4 67 3 7.9 21 1
Pettis 32.3 1 1 23.6 45 2 10.2 57 3
Phelps 37.2 10 1 27.2 77 4 11.2 75 4
Pike 44.6 59 3 22.4 34 2 12.2 88 4
Platte 47.4 87 4 24.6 51 3 8.5 30 2
Polk 55.0 112 5 27.3 79 4 14.9 106 5
Pulaski 42.9 49 3 15.7 6 1 10.7 65 3
Putnam 49.9 100 5 27.5 82 4 9.6 45 2
Ralls 41.8 38 2 16.1 8 1 10.3 60 3
Randolph 46.4 79 4 26.2 65 3 11.1 72 4
Ray 46.4 79 4 25.3 57 3 8.9 34 2
Reynolds 54.0 109 5 34.5 105 5 11.3 78 4
Ripley 52.3 103 5 39.8 113 5 13.3 98 5
Saline 44.5 58 3 35.4 108 5 10.3 60 3
Schuyler 33.4 3 1 19.5 16 1 9.7 48 3
Scotland 42.4 46 2 8.2 1 1 6.5 9 1
Scott 42.3 43 2 31.2 96 5 13.6 101 5
Shannon 43.5 51 3 26.9 75 4 9.5 43 2
Shelby 52.7 104 5 13.5 3 1 8.4 28 2

Missouri Primary Care Needs Assessment 2015 42
Table 6: Health Status Indicators – High Cholesterol, Smoking, and Diabetes
(continued)
High Cholesterol, 2011
Smoking, 2011
Diabetes, 2011
Geography Rate Basic Rank
Quintile Points
Rate Basic Rank
Quintile Points
Rate Basic Rank
Quintile Points
St. Charles 44.1 56 3 20.2 21 1 6.2 3 1
St. Clair 41.5 32 2 31.7 98 5 11.6 80 4
St. Francois 45.0 65 3 27.2 77 4 13.5 99 5
St. Louis 39.9 22 1 19.8 18 1 9.6 45 2
St. Louis City 41.2 29 2 26.6 71 4 12.1 86 4
Ste. Genevieve
44.6 59 3 22.7 36 2 10.1 56 3
Stoddard 49.4 96 5 27.8 86 4 12.7 94 5
Stone 37.4 11 1 28.1 88 4 6.4 6 1
Sullivan 48.7 93 5 27.0 76 4 17.0 113 5
Taney 33.1 2 1 31.5 97 5 12.5 92 4
Texas 41.3 31 2 34.6 106 5 12.2 88 4
Vernon 42.2 41 2 26.4 67 3 12.5 92 4
Warren 45.4 68 3 23.3 40 2 11.2 75 4
Washington 53.0 108 5 36.6 109 5 23.4 115 5
Wayne 54.0 109 5 33.5 102 5 14.4 105 5
Webster 52.9 107 5 22.4 34 2 9.3 39 2
Worth 39.9 22 1 26.7 72 4 7.8 19 1
Wright 46.1 77 4 29.1 91 4 11.8 84 4

Missouri Primary Care Needs Assessment 2015 43
Table 7: Health Status Indicators – Asthma, Depressive Disorders, and HIV/AIDS
Asthma Data Sources and Notes:
Asthma affects approximately 10 percent of adult Missouri residents.13 Although asthma can usually be controlled with medication, the disease can impact and limit daily activities.14 In 2012 alone, 74 Missouri residents died from this disease, which also caused 7,228 Missouri resident hospitalizations for a total initial cost of $104,672,271.15,16 This was equivalent to $14,481 per hospitalization.
Asthma rates are age-adjusted percentages from the 2011 County-Level Study survey of non-institutionalized Missouri resident adults ages 18 and older.
Asthma rates are derived from "yes" responses to the following questions: “Have you ever been told by a doctor, nurse, or other health professional that you had asthma?” AND “Do you still have asthma?”
Depressive Disorders Data Sources and Notes:
“Depressive disorders are characterized by sadness severe enough or persistent enough to interfere with function and often by decreased interest or pleasure in activities.”17 “Left untreated, depression can lead to serious impairment in daily functioning and even suicide, which is the 10th leading cause of death in the U.S.”18 It is also the 10th leading cause of death for Missouri residents.19
Depressive disorder rates are age-adjusted percentages from the 2011 County-Level Study survey of non-institutionalized Missouri resident adults ages 18 and older.
Depressive disorder rates are derived from “yes” responses to the following question: “Has a doctor, nurse, or other health professional ever said that you have a depressive disorder (including depression, major depression, dysthymia, or minor depression)?”
HIV/AIDS Data Sources and Notes:
AIDS, or Acquired Immunodeficiency Syndrome, is the last stage of infection from the Human Immunodeficiency Virus, or HIV. Although the disease can be treated with antiretroviral therapy, there is no cure.20 These new treatments have increased the number of Missouri residents living with HIV/AIDS. HIV is spread through exposure to bodily fluids.21
The HIV/AIDS rates utilized in this assessment are living HIV/AIDS case rates per 100,000 residents and were calculated using the numerators and denominators described below.
Numerators were provided by the Bureau of Reportable Disease Informatics and represent the number of known living residents with HIV/AIDS as of December 31, 2013. Data for persons diagnosed in Missouri correctional facilities are included in the statewide rate, since most of these individuals were likely Missouri residents prior to incarceration. However, these data are not included in the county rates. This is based on the fact that these individuals, especially those in the state prison system, are often incarcerated in a different location than where they were residing (and were likely infected) prior to imprisonment. If included among the cases from the area where imprisoned at the time of diagnosis, it would distort the picture of the epidemic in that area. Individuals diagnosed at federal correctional facilities in Missouri are not included in any data presented.
The denominator for the HIV/AIDS rate calculation is the 2013 population estimate from the U.S. Census Bureau.

Missouri Primary Care Needs Assessment 2015 44
Table 7: Health Status Indicators – Asthma, Depressive Disorders, and HIV/AIDS
(continued)
Asthma, 2011
Depressive Disorders, 2011
HIV/AIDS, December 31, 2013
Geography Rate Basic Rank
Quintile Points
Rate Basic Rank
Quintile Points
Rate* Basic Rank
Quintile Points
Missouri 10.1 20.6 193.6
Adair 8.9 50 3 24.0 83 4 *46.9 64 3
Andrew 19.3 113 5 13.9 8 1 *17.2 13 1
Atchison 7.8 34 2 18.9 35 2 *18.4 14 1
Audrain 5.5 15 1 23.2 77 4 *46.8 63 3
Barry 8.9 50 3 25.2 95 5 *39.4 56 3
Barton 6.8 29 2 19.0 37 2 *8.1 4 1
Bates 8.5 40 2 20.5 57 3 *72.5 97 5
Benton 7.2 32 2 14.5 9 1 *58.1 80 4
Bollinger 12.1 89 4 21.8 67 3 *8.0 3 1
Boone 9.3 55 3 23.6 80 4 129.4 110 5
Buchanan 8.3 38 2 27.5 104 5 89.3 103 5
Butler 13.2 102 5 35.7 114 5 81.2 102 5
Caldwell 6.2 24 2 23.1 76 4 *55.0 73 4
Callaway 8.7 45 2 17.6 25 2 *38.3 53 3
Camden 5.0 9 1 24.9 90 4 *20.5 20 1
Cape Girardeau
8.6 44 2 20.0 52 3 67.3 92 4
Carroll 10.8 74 4 16.7 22 1 *11.0 5 1
Carter 10.1 64 3 22.5 72 4 *15.9 11 1
Cass 16.5 110 5 24.1 85 4 61.6 84 4
Cedar 15.9 109 5 23.7 82 4 *28.8 36 2
Chariton 13.1 101 5 21.4 63 3 *13.1 7 1
Christian 8.2 37 2 19.8 48 3 53.2 72 4
Clark 4.5 3 1 19.0 37 2 *28.9 37 2
Clay 10.9 76 4 20.5 57 3 118.0 108 5
Clinton 5.1 10 1 11.4 2 1 *29.2 39 2
Cole 5.9 21 1 12.6 6 1 74.3 98 5
Cooper 12.9 96 5 19.2 39 2 *39.7 58 3
Crawford 11.0 77 4 21.5 65 3 *36.7 51 3
Dade 8.8 48 3 16.5 19 1 *66.0 88 4
Dallas 9.3 55 3 15.9 16 1 *36.3 49 3
Daviess 11.4 84 4 19.9 50 3 *24.1 30 2

Missouri Primary Care Needs Assessment 2015 45
Table 7: Health Status Indicators – Asthma, Depressive Disorders, and HIV/AIDS
(continued)
Asthma, 2011
Depressive Disorders, 2011
HIV/AIDS, December 31, 2013
Geography Rate Basic Rank
Quintile Points
Rate Basic Rank
Quintile Points
Rate Basic Rank
Quintile Points
DeKalb 8.3 38 2 16.3 18 1 *23.4 28 2
Dent 11.3 83 4 37.8 115 5 12.7 6 1
Douglas 10.6 72 4 24.9 90 4 *66.6 90 4
Dunklin 12.4 92 4 24.0 83 4 66.2 89 4
Franklin 10.1 64 3 21.7 66 3 49.1 69 3
Gasconade 6.0 22 1 15.3 10 1 *40.3 60 3
Gentry 10.1 64 3 25.1 94 5 *14.8 9 1
Greene 8.5 40 2 24.9 90 4 138.4 111 5
Grundy 12.3 91 4 29.4 106 5 *29.0 38 2
Harrison 10.6 72 4 28.3 105 5 *22.9 26 2
Henry 8.0 36 2 24.1 85 4 *40.8 61 3
Hickory 9.0 52 3 19.7 45 2 *43.0 62 3
Holt 5.3 12 1 22.2 70 4 *0.0 1 1
Howard 4.9 6 1 9.9 1 1 *48.7 68 3
Howell 5.6 17 1 31.2 110 5 56.9 76 4
Iron 5.4 13 1 25.0 93 5 *58.0 79 4
Jackson 12.6 93 5 20.3 56 3 442.4 114 5
Jasper 8.5 40 2 21.4 63 3 110.8 106 5
Jefferson 10.5 71 4 18.9 35 2 57.4 77 4
Johnson 9.3 55 3 17.7 26 2 62.3 86 4
Knox 7.1 31 2 20.5 57 3 *24.6 31 2
Laclede 9.6 58 3 23.6 80 4 56.1 75 4
Lafayette 7.9 35 2 24.6 89 4 60.7 83 4
Lawrence 5.5 15 1 19.4 43 2 *31.4 43 2
Lewis 9.6 58 3 16.8 23 1 *39.4 57 3
Lincoln 9.8 60 3 22.5 72 4 *33.4 45 2
Linn 5.7 19 1 17.9 27 2 *80.9 101 5
Livingston 8.7 45 2 18.5 33 2 *20.2 17 1
Macon 11.0 77 4 18.1 30 2 *57.9 78 4
Madison 10.8 74 4 23.4 78 4 *40.2 59 3
Maries 4.3 2 1 24.3 87 4 *22.2 22 1
Marion 9.9 62 3 19.8 48 3 *48.4 67 3
McDonald 8.7 45 2 20.5 57 3 *62.1 85 4

Missouri Primary Care Needs Assessment 2015 46
Table 7: Health Status Indicators – Asthma, Depressive Disorders, and HIV/AIDS
(continued)
Asthma, 2011
Depressive Disorders, 2011
HIV/AIDS, December 31, 2013
Geography Rate Basic Rank
Quintile Points
Rate Basic Rank
Quintile Points
Rate Basic Rank
Quintile Points
Mercer 14.4 105 5 20.0 52 3 *0.0 1 1
Miller 5.8 20 1 19.2 39 2 *35.9 47 3
Mississippi 11.6 86 4 31.2 110 5 189.0 112 5
Moniteau 13.7 104 5 17.9 27 2 *19.1 15 1
Monroe 11.2 81 4 19.7 45 2 *22.8 25 2
Montgomery 3.9 1 1 20.6 61 3 *58.5 81 4
Morgan 11.7 87 4 19.7 45 2 *29.6 40 2
New Madrid 14.4 105 5 27.3 103 5 *76.2 99 5
Newton 9.0 52 3 25.6 97 5 37.4 52 3
Nodaway 4.8 5 1 15.3 10 1 *30.1 41 2
Oregon 8.5 40 2 26.9 102 5 *36.4 50 3
Osage 10.0 63 3 11.4 2 1 *14.6 8 1
Ozark 13.0 99 5 19.2 39 2 *94.1 105 5
Pemiscot 14.7 108 5 26.8 101 5 112.2 107 5
Perry 6.0 22 1 15.8 15 1 *26.2 32 2
Pettis 9.8 60 3 22.5 72 4 52.1 71 4
Phelps 11.0 77 4 22.5 72 4 *33.5 46 2
Pike 11.5 85 4 21.0 62 3 *26.8 33 2
Platte 5.6 17 1 18.5 33 2 124.3 109 5
Polk 12.1 89 4 25.3 96 5 *22.6 24 2
Pulaski 10.2 70 4 15.7 13 1 70.7 94 5
Putnam 12.6 93 5 25.9 98 5 *20.5 19 1
Ralls 6.4 26 2 21.9 69 3 *19.6 16 1
Randolph 6.9 30 2 26.6 100 5 *36.1 48 3
Ray 18.0 112 5 16.0 17 1 *39.1 55 3
Reynolds 13.0 99 5 19.9 50 3 *15.2 10 1
Ripley 12.9 96 5 32.4 113 5 *28.5 35 2
Saline 8.8 48 3 21.8 67 3 *55.9 74 4
Schuyler 11.2 81 4 16.6 21 1 *22.9 27 2
Scotland 4.9 6 1 11.9 4 1 *20.3 18 1
Scott 12.9 96 5 16.5 19 1 68.7 93 5
Shannon 4.7 4 1 19.2 39 2 *48.2 66 3
Shelby 14.5 107 5 18.3 31 2 *16.2 12 1

Missouri Primary Care Needs Assessment 2015 47
Table 7: Health Status Indicators – Asthma, Depressive Disorders, and HIV/AIDS
(continued)
Asthma, 2011
Depressive Disorders, 2011
HIV/AIDS, December 31, 2013
Geography Rate Basic Rank
Quintile Points
Rate Basic Rank
Quintile Points
Rate Basic Rank
Quintile Points
St. Charles 6.2 24 2 17.5 24 2 58.9 82 4
St. Clair 21.2 115 5 30.1 107 5 *31.6 44 2
St. Francois 11.0 77 4 24.3 87 4 72.5 96 5
St. Louis 10.1 64 3 18.3 31 2 196.1 113 5
St. Louis City 11.7 87 4 20.1 54 3 1020.4 115 5
Ste. Genevieve
6.5 28 2 13.1 7 1 *50.6 70 4
Stoddard 6.4 26 2 20.1 54 3 *23.5 29 2
Stone 4.9 6 1 12.2 5 1 *38.3 54 3
Sullivan 16.6 111 5 23.4 78 4 *77.5 100 5
Taney 5.4 13 1 31.1 108 5 91.5 104 5
Texas 10.1 64 3 22.3 71 4 *27.3 34 2
Vernon 7.4 33 2 18.0 29 2 *66.8 91 4
Warren 9.1 54 3 19.4 43 2 *30.3 42 2
Washington 13.5 103 5 31.6 112 5 *71.5 95 5
Wayne 19.8 114 5 31.1 108 5 *22.4 23 1
Webster 10.1 64 3 26.0 99 5 65.8 87 4
Worth 5.1 10 1 15.7 13 1 *47.8 65 3
Wright 12.8 95 5 15.6 12 1 *21.7 21 1
*This rate is based on fewer than 20 cases and is considered to be unstable.

Missouri Primary Care Needs Assessment 2015 48
Table 8: Health Status Indicators – Total Mortality, Infant Mortality, and Heart
Disease Mortality
Total Mortality Data Sources and Notes:
“Reductions in deaths and death rates are often used as an indicator of the success of public health initiatives to improve the health and well-being of the U.S. population…”22
Total mortality rates are reported per 100,000 residents and were obtained from the Death MICA, which contains data from Missouri resident death certificates.
Total mortality rates are age-adjusted to the 2000 U.S. Standard Population and represent the 2002-2012 time period.
Infant Mortality Data Sources and Notes:
“Infant mortality is an important indicator of health for any nation. Infant mortality rates are used worldwide to gauge the health and well-being of populations, and growing evidence suggests that higher infant mortality within a population is linked to that population's overall health and development across the life course.”23 Infant mortality has been selected as a Leading Health Indicator by Healthy People 2020.24
Infant mortality rates are reported per 100,000 resident live births and were obtained from the Death MICA, which contains data from Missouri resident death certificates.
Infant mortality rates are age-specific for residents under one year of age and represent the 2002-2012 time period.
Heart Disease Mortality Data Sources and Notes:
Heart disease is the leading cause of death in both Missouri and the United States overall.25,26
Heart disease mortality rates are reported per 100,000 residents and were obtained from the Death MICA, which contains data from Missouri resident death certificates.
Heart disease mortality rates are age-adjusted to the 2000 U.S. Standard Population and represent the 2002-2012 time period.
Mortality by cause is determined using the underlying cause of death on the death certificate. The heart disease mortality indicator utilizes International Classification of Diseases, Tenth Revision (ICD-10) codes I00-I09, I11, I13, and I20-I51. This category of "heart disease" is one of the National Center for Health Statistics' standard categories for ranking the leading causes of death. In addition to "ischemic heart disease," some of the causes included are: rheumatic heart disease, hypertensive heart disease, pulmonary embolism, various valve disorders, cardiomyopathy, atrial fibrillation, and congestive heart failure.

Missouri Primary Care Needs Assessment 2015 49
Table 8: Health Status Indicators – Total Mortality, Infant Mortality, and Heart
Disease Mortality (continued)
Total Mortality, 2002-2012
Infant Mortality, 2002-2012
Heart Disease Mortality, 2002-2012
Geography Rate Basic Rank
Quintile Points
Rate Basic Rank
Quintile Points
Rate Basic Rank
Quintile Points
Missouri 847.4 727.0 223.6
Adair 838.0 40 2 798.7 79 4 207.5 27 2
Andrew 790.5 21 1 *832.9 85 4 224.9 46 2
Atchison 817.4 34 2 *151.5 2 1 198.4 19 1
Audrain 867.6 58 3 527.1 17 1 190.8 13 1
Barry 920.4 85 4 702.4 54 3 271.3 98 5
Barton 800.7 25 2 *688.9 51 3 186.4 10 1
Bates 880.1 64 3 *434.6 9 1 234.2 62 3
Benton 911.0 78 4 *722.2 59 3 228.2 57 3
Bollinger 900.6 75 4 *809.5 82 4 272.4 99 5
Boone 733.3 5 1 576.8 27 2 165.0 4 1
Buchanan 912.0 80 4 779.0 72 4 225.5 48 3
Butler 1,030.9 105 5 1,011.7 103 5 240.5 72 4
Caldwell 859.6 54 3 *972.4 99 5 216.6 34 2
Callaway 838.1 41 2 928.7 95 5 207.9 29 2
Camden 778.3 14 1 524.1 16 1 226.4 53 3
Cape Girardeau
814.3 32 2 712.2 58 3 221.0 39 2
Carroll 897.1 72 4 *735.9 61 3 336.6 111 5
Carter 1,098.0 112 5 *1,150.7 108 5 237.0 66 3
Cass 810.7 30 2 547.2 22 1 185.4 9 1
Cedar 911.9 79 4 *946.5 96 5 226.1 49 3
Chariton 766.0 10 1 *842.1 87 4 222.8 41 2
Christian 787.0 19 1 520.2 14 1 201.8 22 1
Clark 856.1 51 3 *636.3 43 2 244.8 73 4
Clay 782.5 17 1 545.6 21 1 169.8 5 1
Clinton 956.5 100 5 761.1 63 3 206.2 25 2
Cole 781.7 15 1 766.8 65 3 193.6 15 1
Cooper 840.4 42 2 *681.5 50 3 247.4 76 4
Crawford 927.2 88 4 *472.5 10 1 290.6 106 5
Dade 944.4 97 5 *570.1 26 2 209.1 31 2
Dallas 854.7 49 3 *756.0 62 3 192.9 14 1
Daviess 831.5 37 2 *673.1 48 3 229.4 58 3

Missouri Primary Care Needs Assessment 2015 50
Table 8: Health Status Indicators – Total Mortality, Infant Mortality, and Heart
Disease Mortality (continued)
Total Mortality, 2002-2012
Infant Mortality, 2002-2012
Heart Disease Mortality, 2002-2012
Geography Rate Basic Rank
Quintile Points
Rate Basic Rank
Quintile Points
Rate Basic Rank
Quintile Points
DeKalb 806.5 27 2 *570.0 25 2 239.7 70 4
Dent 917.1 83 4 *765.3 64 3 226.1 49 3
Douglas 820.0 35 2 *545.5 20 1 186.5 11 1
Dunklin 1,136.7 115 5 1,056.3 105 5 324.4 109 5
Franklin 893.3 70 4 626.2 40 2 237.5 68 3
Gasconade 871.0 60 3 *840.3 86 4 226.2 51 3
Gentry 794.0 22 1 *217.4 4 1 245.4 75 4
Greene 815.1 33 2 630.5 41 2 206.1 24 2
Grundy 836.4 39 2 *612.2 36 2 221.8 40 2
Harrison 812.5 31 2 *806.5 81 4 251.5 84 4
Henry 952.9 98 5 896.7 91 4 248.5 80 4
Hickory 840.9 43 2 *832.3 84 4 197.1 17 1
Holt 760.8 9 1 *639.0 44 2 205.4 23 1
Howard 808.2 29 2 *707.0 55 3 222.9 42 2
Howell 960.1 102 5 661.7 47 3 226.5 54 3
Iron 1,135.6 114 5 *797.1 78 4 297.2 107 5
Jackson 869.9 59 3 772.5 69 3 199.0 20 1
Jasper 927.7 89 4 497.8 13 1 281.4 102 5
Jefferson 958.7 101 5 591.7 32 2 260.0 92 4
Johnson 847.7 46 2 579.0 28 2 218.8 37 2
Knox 864.6 56 3 *382.4 8 1 207.7 28 2
Laclede 924.6 87 4 920.7 94 5 290.2 105 5
Lafayette 851.7 47 3 623.9 39 2 253.0 85 4
Lawrence 885.5 67 3 803.1 80 4 200.4 21 1
Lewis 796.6 24 2 *564.1 24 2 239.8 71 4
Lincoln 916.6 82 4 606.2 35 2 255.0 90 4
Linn 871.1 61 3 *583.8 30 2 265.7 95 5
Livingston 846.2 45 2 *590.8 31 2 244.8 73 4
Macon 876.7 63 3 *341.5 6 1 236.1 63 3
Madison 995.6 103 5 *785.0 75 4 265.3 94 5
Maries 856.6 52 3 *95.5 1 1 281.3 101 5
Marion 894.8 71 4 729.2 60 3 226.2 51 3
McDonald 956.3 99 5 868.0 89 4 236.6 65 3

Missouri Primary Care Needs Assessment 2015 51
Table 8: Health Status Indicators – Total Mortality, Infant Mortality, and Heart
Disease Mortality (continued)
Total Mortality, 2002-2012
Infant Mortality, 2002-2012
Heart Disease Mortality, 2002-2012
Geography Rate Basic Rank
Quintile Points
Rate Basic Rank
Quintile Points
Rate Basic Rank
Quintile Points
Mercer 722.9 4 1 *1,229.5 111 5 190.1 12 1
Miller 900.3 74 4 658.8 46 2 270.0 97 5
Mississippi 1,101.6 113 5 *774.8 70 4 386.7 114 5
Moniteau 820.5 36 2 *554.6 23 1 206.3 26 2
Monroe 789.8 20 1 *180.7 3 1 232.8 60 3
Montgomery 897.5 73 4 *824.5 83 4 250.8 83 4
Morgan 940.7 95 5 875.7 90 4 228.1 56 3
New Madrid 1,050.9 108 5 978.2 100 5 358.9 113 5
Newton 857.5 53 3 711.4 57 3 239.5 69 3
Nodaway 742.3 6 1 *580.3 29 2 208.1 30 2
Oregon 890.1 68 3 *605.1 34 2 331.3 110 5
Osage 768.1 12 1 *677.1 49 3 254.9 89 4
Ozark 919.6 84 4 *544.5 19 1 218.0 36 2
Pemiscot 1,082.4 111 5 1,157.3 109 5 355.2 112 5
Perry 782.1 16 1 *378.5 7 1 232.9 61 3
Pettis 835.0 38 2 613.4 37 2 219.1 38 2
Phelps 892.7 69 3 697.3 52 3 223.1 43 2
Pike 875.6 62 3 998.0 102 5 260.7 93 5
Platte 694.4 1 1 540.6 18 1 154.5 2 1
Polk 907.6 77 4 496.1 12 1 195.4 16 1
Pulaski 933.9 93 5 779.8 73 4 254.1 88 4
Putnam 861.1 55 3 *960.0 98 5 253.2 86 4
Ralls 722.4 3 1 *1,367.5 114 5 174.1 6 1
Randolph 913.9 81 4 642.8 45 2 217.3 35 2
Ray 927.8 90 4 *617.3 38 2 250.4 82 4
Reynolds 939.6 94 5 *1,685.4 115 5 247.4 76 4
Ripley 1,064.2 109 5 1,316.5 113 5 314.2 108 5
Saline 866.1 57 3 1,031.2 104 5 253.2 86 4
Schuyler 807.2 28 2 *1,117.3 107 5 143.8 1 1
Scotland 801.2 26 2 *788.4 77 4 174.9 7 1
Scott 932.4 92 4 911.5 93 5 247.4 76 4
Shannon 905.0 76 4 *995.5 101 5 249.9 81 4
Shelby 843.1 44 2 *771.8 68 3 225.3 47 3

Missouri Primary Care Needs Assessment 2015 52
Table 8: Health Status Indicators – Total Mortality, Infant Mortality, and Heart
Disease Mortality (continued)
Total Mortality, 2002-2012
Infant Mortality, 2002-2012
Heart Disease Mortality, 2002-2012
Geography Rate Basic Rank
Quintile Points
Rate Basic Rank
Quintile Points
Rate Basic Rank
Quintile Points
St. Charles 710.5 2 1 597.4 33 2 179.2 8 1
St. Clair 884.6 66 3 *494.1 11 1 247.9 79 4
St. Francois 1,007.7 104 5 710.6 56 3 287.6 103 5
St. Louis 768.0 11 1 769.0 67 3 213.4 32 2
St. Louis City 1,040.2 107 5 1,116.2 106 5 287.9 104 5
Ste. Genevieve
774.3 13 1 *244.3 5 1 236.1 63 3
Stoddard 922.1 86 4 783.6 74 4 216.0 33 2
Stone 753.1 8 1 788.1 76 4 198.0 18 1
Sullivan 883.4 65 3 *768.5 66 3 232.2 59 3
Taney 796.5 23 1 631.4 42 2 224.8 45 2
Texas 855.8 50 3 1,169.6 110 5 227.6 55 3
Vernon 928.2 91 4 905.1 92 4 268.3 96 5
Warren 786.8 18 1 523.7 15 1 224.7 44 2
Washington 1,073.2 110 5 698.7 53 3 404.1 115 5
Wayne 1,032.4 106 5 *956.6 97 5 237.1 67 3
Webster 854.1 48 3 775.3 71 4 259.6 91 4
Worth 745.1 7 1 *1,260.5 112 5 161.6 3 1
Wright 943.3 96 5 846.9 88 4 280.1 100 5
*This rate is based on fewer than 20 cases and is considered to be unstable.

Missouri Primary Care Needs Assessment 2015 53
Table 9: Health Status Indicators – Cancer Mortality, Chronic Lower Respiratory
Disease (CLRD) Mortality, and Stroke Mortality
Cancer Mortality Data Sources and Notes:
Cancer is the second leading cause of death in both Missouri and the United States overall.27,28
Cancer mortality rates are reported per 100,000 residents and were obtained from the Death MICA, which contains data from Missouri resident death certificates.
Cancer mortality rates are age-adjusted to the 2000 U.S. Standard Population and represent the 2002-2012 time period.
Mortality by cause is determined using the underlying cause of death on the death certificate. The cancer mortality indicator utilizes ICD-10 codes C00-C97 and may also be referred to as mortality from malignant neoplasms. This indicator includes leukemia and cancers of various organs but excludes benign neoplasms, carcinoma in situ, and neoplasms of uncertain behavior.
Chronic Lower Respiratory Disease (CLRD) Mortality Data Sources and Notes:
CLRD is the third leading cause of death in Missouri and the U.S.29,30
CLRD mortality rates are reported per 100,000 residents and were obtained from the Death MICA, which contains data from Missouri resident death certificates.
CLRD mortality rates are age-adjusted to the 2000 U.S. Standard Population and represent the 2002-2012 time period.
Mortality by cause is determined using the underlying cause of death on the death certificate. The CLRD mortality indicator utilizes ICD-10 codes J40-J47 and includes deaths from chronic obstructive pulmonary disease (COPD) and allied conditions. This category is called "chronic lower respiratory diseases" in the National Center for Health Statistics' current listing of leading causes of death. Also included are bronchitis (unless it is specified as acute bronchitis), emphysema, asthma, bronchiectasis, and chronic airway obstruction not elsewhere classified. The vast majority of the deaths in this category are attributed to "chronic airway obstruction not elsewhere classified."
Stroke Mortality Data Sources and Notes:
Stroke is the fourth leading cause of death in Missouri and the U.S.31,32
Stroke mortality rates are reported per 100,000 residents and were obtained from the Death MICA, which contains data from Missouri resident death certificates.
Stroke mortality rates are age-adjusted to the 2000 U.S. Standard Population and represent the 2002-2012 time period.
Mortality by cause is determined using the underlying cause of death on the death certificate. The stroke mortality indicator utilizes ICD-10 codes I60-I69 and includes deaths from cerebrovascular disease (stroke), whether due to bleeding or to blockage of arteries in the brain. This indicator also includes deaths due to late effects of strokes.

Missouri Primary Care Needs Assessment 2015 54
Table 9: Health Status Indicators – Cancer Mortality, Chronic Lower Respiratory
Disease (CLRD) Mortality, and Stroke Mortality (continued)
Cancer Mortality, 2002-2012
CLRD Mortality, 2002-2012
Stroke Mortality, 2002-2012
Geography Rate Basic Rank
Quintile Points
Rate Basic Rank
Quintile Points
Rate Basic Rank
Quintile Points
Missouri 191.1 49.7 49.8
Adair 182.2 33 2 53.5 51 3 55.4 80 4
Andrew 178.8 22 1 57.3 64 3 50.1 57 3
Atchison 183.3 35 2 67.0 102 5 65.0 102 5
Audrain 201.5 72 4 75.1 107 5 49.2 54 3
Barry 191.3 51 3 49.3 36 2 64.3 99 5
Barton 168.7 8 1 35.3 3 1 54.7 77 4
Bates 204.7 80 4 57.6 68 3 57.8 88 4
Benton 218.1 101 5 63.0 94 5 58.7 90 4
Bollinger 204.5 79 4 56.4 63 3 43.2 25 2
Boone 173.0 14 1 40.1 8 1 47.8 44 2
Buchanan 202.8 74 4 78.1 108 5 66.0 106 5
Butler 222.3 104 5 64.3 96 5 67.2 107 5
Caldwell 197.3 63 3 50.9 43 2 38.3 11 1
Callaway 185.6 38 2 60.8 83 4 47.4 41 2
Camden 165.0 5 1 47.1 27 2 46.3 34 2
Cape Girardeau
177.9 20 1 43.7 17 1 50.2 59 3
Carroll 171.3 10 1 47.2 28 2 44.5 30 2
Carter 258.8 115 5 96.2 115 5 58.5 89 4
Cass 188.1 43 2 54.5 57 3 51.7 64 3
Cedar 208.9 90 4 62.1 90 4 57.3 85 4
Chariton 195.1 60 3 32.3 1 1 41.5 19 1
Christian 171.7 13 1 45.5 21 1 52.4 66 3
Clark 212.6 96 5 78.1 108 5 65.8 105 5
Clay 189.1 46 2 62.2 92 4 42.1 20 1
Clinton 200.5 70 4 79.3 110 5 59.9 93 5
Cole 180.6 31 2 52.3 49 3 42.8 23 1
Cooper 176.4 19 1 47.6 31 2 48.7 52 3
Crawford 209.5 91 4 46.9 25 2 51.9 65 3
Dade 214.0 99 5 54.6 58 3 49.8 55 3
Dallas 190.2 48 3 52.7 50 3 40.1 16 1
Daviess 199.5 68 3 48.4 32 2 65.4 104 5

Missouri Primary Care Needs Assessment 2015 55
Table 9: Health Status Indicators – Cancer Mortality, Chronic Lower Respiratory
Disease (CLRD) Mortality, and Stroke Mortality (continued)
Cancer Mortality, 2002-2012
CLRD Mortality, 2002-2012
Stroke Mortality, 2002-2012
Geography Rate Basic Rank
Quintile Points
Rate Basic Rank
Quintile Points
Rate Basic Rank
Quintile Points
DeKalb 154.2 1 1 61.5 87 4 53.4 71 4
Dent 199.2 66 3 60.1 78 4 68.7 109 5
Douglas 190.2 48 3 67.8 104 5 45.9 31 2
Dunklin 234.5 111 5 82.1 112 5 81.2 114 5
Franklin 194.3 55 3 51.7 45 2 51.3 61 3
Gasconade 191.7 52 3 45.7 22 1 59.7 92 4
Gentry 173.9 17 1 42.7 14 1 53.9 73 4
Greene 180.5 30 2 50.4 42 2 47.8 44 2
Grundy 204.8 81 4 51.9 47 3 54.2 75 4
Harrison 171.3 10 1 51.8 46 2 34.2 3 1
Henry 220.4 103 5 57.5 67 3 72.3 112 5
Hickory 194.7 58 3 49.8 39 2 48.6 51 3
Holt 164.8 4 1 59.3 74 4 43.9 27 2
Howard 186.9 40 2 40.0 7 1 57.6 87 4
Howell 205.7 82 4 67.1 103 5 64.3 99 5
Iron 238.6 112 5 89.5 113 5 65.1 103 5
Jackson 194.3 55 3 51.5 44 2 48.3 49 3
Jasper 188.9 45 2 63.8 95 5 47.9 46 2
Jefferson 211.4 94 5 60.3 79 4 58.8 91 4
Johnson 194.8 59 3 49.8 39 2 53.2 70 4
Knox 220.3 102 5 61.4 86 4 42.4 21 1
Laclede 195.6 61 3 55.9 62 3 62.0 97 5
Lafayette 191.7 52 3 54.0 52 3 46.1 32 2
Lawrence 184.9 37 2 59.8 76 4 67.9 108 5
Lewis 198.2 64 3 42.7 14 1 81.8 115 5
Lincoln 203.6 75 4 44.9 19 1 53.9 73 4
Linn 187.7 42 2 61.5 87 4 48.5 50 3
Livingston 192.5 54 3 51.9 47 3 46.6 36 2
Macon 179.3 24 2 44.1 18 1 52.4 66 3
Madison 224.4 106 5 68.0 105 5 40.6 18 1
Maries 199.3 67 3 40.4 10 1 43.1 24 2
Marion 204.3 77 4 66.5 101 5 50.6 60 3
McDonald 206.5 83 4 55.5 61 3 47.6 43 2

Missouri Primary Care Needs Assessment 2015 56
Table 9: Health Status Indicators – Cancer Mortality, Chronic Lower Respiratory
Disease (CLRD) Mortality, and Stroke Mortality (continued)
Cancer Mortality, 2002-2012
CLRD Mortality, 2002-2012
Stroke Mortality, 2002-2012
Geography Rate Basic Rank
Quintile Points
Rate Basic Rank
Quintile Points
Rate Basic Rank
Quintile Points
Mercer 187.1 41 2 47.3 29 2 32.5 2 1
Miller 201.5 72 4 54.1 55 3 47.4 41 2
Mississippi 250.6 114 5 61.0 84 4 72.7 113 5
Moniteau 170.9 9 1 57.6 68 3 36.9 8 1
Monroe 163.8 3 1 48.6 33 2 36.9 8 1
Montgomery 213.3 98 5 57.7 70 4 40.5 17 1
Morgan 208.0 86 4 57.3 64 3 52.8 68 3
New Madrid 228.1 108 5 64.5 97 5 51.4 62 3
Newton 185.6 38 2 49.7 38 2 51.5 63 3
Nodaway 165.1 6 1 46.0 23 1 46.3 34 2
Oregon 182.0 32 2 36.8 4 1 42.4 21 1
Osage 159.4 2 1 42.2 13 1 36.2 6 1
Ozark 204.2 76 4 49.2 35 2 56.7 81 4
Pemiscot 223.9 105 5 65.8 100 5 54.2 75 4
Perry 180.0 27 2 39.0 5 1 43.9 27 2
Pettis 208.1 89 4 50.3 41 2 54.9 78 4
Phelps 178.6 21 1 58.0 72 4 64.8 101 5
Pike 190.2 48 3 57.9 71 4 47.9 46 2
Platte 165.5 7 1 47.3 29 2 35.8 4 1
Polk 183.0 34 2 62.1 90 4 62.7 98 5
Pulaski 207.0 84 4 59.5 75 4 61.5 96 5
Putnam 200.9 71 4 60.4 80 4 26.4 1 1
Ralls 179.7 25 2 47.0 26 2 36.1 5 1
Randolph 212.1 95 5 54.4 56 3 47.2 40 2
Ray 204.3 77 4 61.3 85 4 39.8 15 1
Reynolds 208.0 86 4 65.5 98 5 47.1 39 2
Ripley 224.4 106 5 71.7 106 5 70.2 110 5
Saline 211.3 93 5 46.3 24 2 57.0 82 4
Schuyler 188.2 44 2 61.5 87 4 52.8 68 3
Scotland 199.9 69 3 54.0 52 3 44.1 29 2
Scott 208.0 86 4 62.5 93 5 57.2 84 4
Shannon 211.0 92 4 58.3 73 4 60.0 94 5
Shelby 195.6 61 3 55.1 60 3 57.5 86 4

Missouri Primary Care Needs Assessment 2015 57
Table 9: Health Status Indicators – Cancer Mortality, Chronic Lower Respiratory
Disease (CLRD) Mortality, and Stroke Mortality (continued)
Cancer Mortality, 2002-2012
CLRD Mortality, 2002-2012
Stroke Mortality, 2002-2012
Geography Rate Basic Rank
Quintile Points
Rate Basic Rank
Quintile Points
Rate Basic Rank
Quintile Points
St. Charles 173.1 15 1 41.2 12 1 36.6 7 1
St. Clair 194.4 57 3 54.9 59 3 55.1 79 4
St. Francois 213.2 97 5 65.6 99 5 50.1 57 3
St. Louis 178.8 22 1 33.5 2 1 46.1 32 2
St. Louis City 232.0 109 5 43.6 16 1 57.0 82 4
Ste. Genevieve
175.0 18 1 39.2 6 1 39.6 14 1
Stoddard 216.3 100 5 81.5 111 5 61.1 95 5
Stone 173.3 16 1 40.3 9 1 39.1 13 1
Sullivan 184.3 36 2 60.6 81 4 47.0 38 2
Taney 189.7 47 3 45.0 20 1 38.5 12 1
Texas 179.7 25 2 54.0 52 3 48.9 53 3
Vernon 198.6 65 3 48.8 34 2 43.4 26 2
Warren 180.1 28 2 40.9 11 1 37.6 10 1
Washington 232.9 110 5 49.6 37 2 46.6 36 2
Wayne 239.1 113 5 89.5 113 5 71.8 111 5
Webster 171.4 12 1 60.6 81 4 53.6 72 4
Worth 180.4 29 2 59.8 76 4 49.8 55 3
Wright 207.9 85 4 57.3 64 3 48.2 48 3

Missouri Primary Care Needs Assessment 2015 58
Table 10: Health Care Access Indicators –Poverty, Uninsured, and Medicaid
Enrollment
Poverty Data Sources and Notes:
Socioeconomic characteristics such as poverty directly influence the health status of a community or region.33,34,35 Low income and poverty may limit a person’s ability to pay for a variety of goods and services related to health, such as fees related to medical visits, healthy foods, and medications.
Poverty rates represent the estimated percentage of residents living in poverty.
Poverty rates were obtained from the U.S. Census Bureau, Small Area Income and Poverty Estimates (SAIPE) program and reflect 2013 estimates. “School district estimates sum to county estimates, county estimates sum to state estimates, and state estimates sum to the national estimate.”36
Uninsured Data Sources and Notes:
Health insurance status is tied to several other socioeconomic indicators. Research indicates that persons without health insurance are less likely to receive screenings for chronic medical conditions and have high death rates for diseases such as diabetes, hypertension, and coronary heart disease.37
Uninsured rates represent the estimated percentage of residents under age 65 without health insurance.
Uninsured rates were obtained from the U.S. Census Bureau, Small Area Health Insurance Estimates (SAHIE) program and represent 2012 estimates. “Each year’s estimates are adjusted so that before rounding the county estimates sum to their respective state totals and for key demographics the state estimates sum to the national ACS† numbers insured and uninsured.”38
Medicaid Enrollment Data Sources and Notes:
“Medicaid is a joint federal and state program that helps with medical costs for some people with limited income and resources. Medicaid also offers benefits not normally covered by Medicare, like nursing home care and personal care services.”39 “It covers children, the aged, blind, and/or disabled and other people who are eligible to receive federally assisted income maintenance payments.”40
Medicaid enrollment rates represent the percentage of residents actively enrolled in all categories of Medicaid, which in Missouri is also referred to as MO HealthNet. Active enrollment does not necessarily mean that services were used during a particular month.
Medicaid enrollment rates were calculated using the number of actively enrolled residents on June 30, 2012, as the numerator and 2012 population estimates from the U.S. Census Bureau as the denominator. The number of actively enrolled residents was obtained from the Medicaid Records MICA.41,42
†ACS refers to the American Community Survey, which is conducted by the U.S. Census Bureau.

Missouri Primary Care Needs Assessment 2015 59
Table 10: Health Care Access Indicators –Poverty, Uninsured, and Medicaid
Enrollment (continued)
Poverty, 2013
Uninsured, 2012
Medicaid Enrollment, June 30, 2012
Geography Rate Basic Rank
Quintile Points
Rate Basic Rank
Quintile Points
Rate Basic Rank
Quintile Points
Missouri 15.8 15.8 16.1
Adair 24.9 101 5 17.8 52 3 15.1 36 2
Andrew 10.1 5 1 13.0 6 1 9.8 5 1
Atchison 13.2 19 1 16.2 29 2 11.4 10 1
Audrain 19.7 69 3 18.1 57 3 15.6 41 2
Barry 20.2 76 4 21.7 106 5 20.6 75 4
Barton 18.5 60 3 18.8 67 3 20.7 78 4
Bates 21.6 86 4 19.7 77 4 17.6 60 3
Benton 23.1 95 5 20.4 90 4 20.3 72 4
Bollinger 19.6 67 3 18.3 62 3 24.0 94 5
Boone 19.8 71 4 14.5 12 1 11.7 12 1
Buchanan 17.8 52 3 17.2 41 2 19.3 69 3
Butler 22.0 88 4 17.1 39 2 27.9 102 5
Caldwell 15.3 26 2 17.3 42 2 14.9 33 2
Callaway 13.8 22 1 14.9 16 1 14.2 27 2
Camden 18.0 54 3 20.2 86 4 14.9 32 2
Cape Girardeau
15.8 30 2 14.5 12 1 15.1 37 2
Carroll 17.7 50 3 17.4 43 2 17.3 55 3
Carter 23.7 98 5 21.5 104 5 28.8 106 5
Cass 9.2 3 1 13.1 7 1 12.4 16 1
Cedar 25.5 103 5 20.0 84 4 23.4 93 5
Chariton 16.8 39 2 16.8 36 2 16.1 46 2
Christian 11.4 9 1 14.8 15 1 13.5 22 1
Clark 17.5 45 2 18.9 70 4 17.5 57 3
Clay 10.0 4 1 12.9 5 1 10.1 6 1
Clinton 11.5 11 1 15.6 23 1 11.6 11 1
Cole 13.7 21 1 12.7 4 1 15.0 35 2
Cooper 15.5 28 2 16.3 30 2 14.8 30 2
Crawford 20.1 74 4 18.7 66 3 22.3 91 4
Dade 18.4 56 3 20.4 90 4 18.4 65 3
Dallas 21.7 87 4 20.4 90 4 21.2 83 4
Daviess 18.9 64 3 20.6 96 5 15.6 42 2

Missouri Primary Care Needs Assessment 2015 60
Table 10: Health Care Access Indicators –Poverty, Uninsured, and Medicaid
Enrollment (continued)
Poverty, 2013
Uninsured, 2012
Medicaid Enrollment, June 30, 2012
Geography Rate Basic Rank
Quintile Points
Rate Basic Rank
Quintile Points
Rate Basic Rank
Quintile Points
DeKalb 17.2 41 2 15.7 24 2 10.6 8 1
Dent 23.0 94 5 20.4 90 4 25.4 99 5
Douglas 22.5 93 5 21.2 100 5 25.4 98 5
Dunklin 27.0 109 5 18.5 63 3 34.8 114 5
Franklin 10.8 7 1 15.2 19 1 13.3 21 1
Gasconade 15.8 30 2 17.8 52 3 14.3 28 2
Gentry 16.1 33 2 19.8 81 4 15.1 38 2
Greene 20.2 76 4 17.7 49 3 16.3 50 3
Grundy 21.4 83 4 18.2 59 3 18.3 63 3
Harrison 19.0 65 3 19.2 73 4 20.2 71 4
Henry 18.4 56 3 17.0 38 2 20.3 73 4
Hickory 24.7 100 5 24.4 113 5 18.7 66 3
Holt 13.1 18 1 18.0 56 3 12.3 14 1
Howard 15.9 32 2 16.6 34 2 17.3 54 3
Howell 27.6 111 5 18.1 57 3 25.0 97 5
Iron 22.0 88 4 18.8 67 3 29.5 110 5
Jackson 17.2 41 2 17.7 49 3 17.9 62 3
Jasper 18.3 55 3 20.4 90 4 20.1 70 4
Jefferson 11.5 11 1 14.1 8 1 12.4 15 1
Johnson 17.7 50 3 14.4 10 1 11.4 9 1
Knox 21.3 82 4 24.6 114 5 14.8 31 2
Laclede 22.1 91 4 18.9 70 4 22.7 92 4
Lafayette 12.7 16 1 15.0 18 1 16.2 49 3
Lawrence 18.6 62 3 19.7 77 4 19.2 68 3
Lewis 17.5 45 2 17.1 39 2 13.6 23 1
Lincoln 11.9 14 1 15.5 20 1 15.7 43 2
Linn 19.6 67 3 17.4 43 2 17.7 61 3
Livingston 17.2 41 2 16.4 32 2 16.0 45 2
Macon 18.8 63 3 17.6 47 3 17.2 53 3
Madison 21.4 83 4 18.8 67 3 24.6 96 5
Maries 17.5 45 2 18.6 65 3 14.1 25 2
Marion 16.8 39 2 15.7 24 2 21.9 88 4
McDonald 20.7 79 4 24.9 115 5 21.9 90 4

Missouri Primary Care Needs Assessment 2015 61
Table 10: Health Care Access Indicators –Poverty, Uninsured, and Medicaid
Enrollment (continued)
Poverty, 2013
Uninsured, 2012
Medicaid Enrollment, June 30, 2012
Geography Rate Basic Rank
Quintile Points
Rate Basic Rank
Quintile Points
Rate Basic Rank
Quintile Points
Mercer 17.6 48 3 20.2 86 4 15.3 39 2
Miller 20.5 78 4 19.2 73 4 20.7 81 4
Mississippi 36.3 115 5 18.2 59 3 29.5 111 5
Moniteau 14.1 23 1 18.2 59 3 12.4 17 1
Monroe 15.7 29 2 19.7 77 4 16.2 48 3
Montgomery 15.3 26 2 17.7 49 3 20.7 79 4
Morgan 22.0 88 4 23.3 110 5 20.7 80 4
New Madrid 23.7 98 5 16.7 35 2 29.7 112 5
Newton 16.1 33 2 21.3 102 5 17.5 56 3
Nodaway 18.5 60 3 14.4 10 1 8.5 3 1
Oregon 26.4 107 5 21.1 98 5 28.6 104 5
Osage 10.1 5 1 15.5 20 1 8.5 4 1
Ozark 26.2 104 5 23.8 111 5 21.8 87 4
Pemiscot 31.4 113 5 14.9 16 1 37.9 115 5
Perry 12.7 16 1 15.5 20 1 14.2 26 2
Pettis 20.1 74 4 20.2 86 4 20.4 74 4
Phelps 16.4 37 2 17.9 55 3 17.5 58 3
Pike 19.8 71 4 18.9 70 4 16.2 47 3
Platte 7.7 2 1 10.7 2 1 7.1 2 1
Polk 20.0 73 4 17.6 47 3 21.2 84 4
Pulaski 15.1 25 2 15.9 26 2 10.6 7 1
Putnam 17.9 53 3 21.2 100 5 15.7 44 2
Ralls 11.4 9 1 16.1 27 2 13.1 20 1
Randolph 22.4 92 4 16.5 33 2 21.3 85 4
Ray 13.2 19 1 14.7 14 1 13.9 24 2
Reynolds 23.3 96 5 19.9 83 4 26.6 100 5
Ripley 23.6 97 5 20.5 95 5 33.8 113 5
Saline 18.4 56 3 17.5 45 2 20.6 77 4
Schuyler 21.2 81 4 23.8 111 5 17.1 52 3
Scotland 17.6 48 3 22.4 108 5 14.5 29 2
Scott 18.4 56 3 16.3 30 2 26.6 101 5
Shannon 31.5 114 5 22.5 109 5 28.3 103 5
Shelby 17.2 41 2 18.5 63 3 17.6 59 3
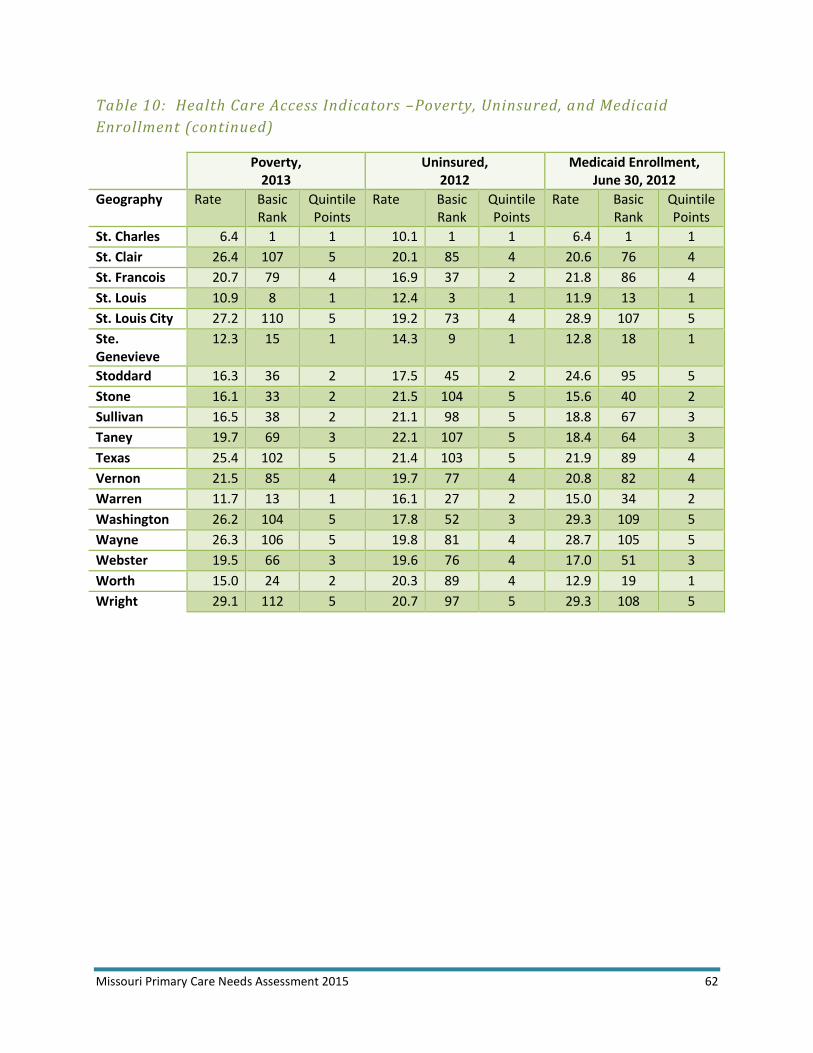
Missouri Primary Care Needs Assessment 2015 62
Table 10: Health Care Access Indicators –Poverty, Uninsured, and Medicaid
Enrollment (continued)
Poverty, 2013
Uninsured, 2012
Medicaid Enrollment, June 30, 2012
Geography Rate Basic Rank
Quintile Points
Rate Basic Rank
Quintile Points
Rate Basic Rank
Quintile Points
St. Charles 6.4 1 1 10.1 1 1 6.4 1 1
St. Clair 26.4 107 5 20.1 85 4 20.6 76 4
St. Francois 20.7 79 4 16.9 37 2 21.8 86 4
St. Louis 10.9 8 1 12.4 3 1 11.9 13 1
St. Louis City 27.2 110 5 19.2 73 4 28.9 107 5
Ste. Genevieve
12.3 15 1 14.3 9 1 12.8 18 1
Stoddard 16.3 36 2 17.5 45 2 24.6 95 5
Stone 16.1 33 2 21.5 104 5 15.6 40 2
Sullivan 16.5 38 2 21.1 98 5 18.8 67 3
Taney 19.7 69 3 22.1 107 5 18.4 64 3
Texas 25.4 102 5 21.4 103 5 21.9 89 4
Vernon 21.5 85 4 19.7 77 4 20.8 82 4
Warren 11.7 13 1 16.1 27 2 15.0 34 2
Washington 26.2 104 5 17.8 52 3 29.3 109 5
Wayne 26.3 106 5 19.8 81 4 28.7 105 5
Webster 19.5 66 3 19.6 76 4 17.0 51 3
Worth 15.0 24 2 20.3 89 4 12.9 19 1
Wright 29.1 112 5 20.7 97 5 29.3 108 5

Missouri Primary Care Needs Assessment 2015 63
Table 11: Health Care Access Indicators – Medicare Enrollment, Inadequate
Prenatal Care, and Low Birth Weight
Medicare Enrollment Data Sources and Notes:
“Medicare is the federal health insurance program for people who are 65 or older, certain younger people with disabilities, and people with End-Stage Renal Disease (permanent kidney failure requiring dialysis or a transplant, sometimes called ESRD).”43
Medicare enrollment rates represent the percentage of residents enrolled in Medicare. These rates include both aged and disabled participants with hospital and/or supplemental medical insurance.
Medicare enrollment rates were calculated using the total number of Medicare recipients on July 1, 2012, from the Centers for Medicare and Medicaid Services and 2012 population estimates from the U.S. Census Bureau. 44,45 The number of Missouri recipients was calculated by summing the county totals.
Inadequate Prenatal Care Data Sources and Notes:
Adequacy of prenatal care measures when a pregnant woman first received prenatal care and how often she received prenatal care throughout her pregnancy.46 “Babies born to mothers who received no prenatal care are three times more likely to be born at low birth weight, and five times more likely to die, than those whose mothers received prenatal care.”47
Inadequate prenatal care rates are percentages calculated using the Missouri Index developed by Wayne Schramm with the Missouri Department of Health and Senior Services. Using this index, inadequate prenatal care is defined as fewer than 5 prenatal visits for pregnancies less than 37 weeks in length, fewer than 8 visits for pregnancies 37 weeks or longer, or care beginning after the first 4 months of pregnancy. If adequacy of prenatal care can be determined even if the month prenatal care began or the number of prenatal care visits is unknown, these records are included. Inadequate prenatal care rates utilizing the Missouri Index tend to be higher than inadequate prenatal care rates that utilize the Kotelchuck Index, a commonly cited alternative prenatal care adequacy measure.
Inadequate prenatal care rates were obtained from the Birth MICA, which contains data from Missouri resident birth certificates, and represent the 2008-2012 time period. (Rates for both the Missouri Index and the Kotelchuck Index definitions of inadequate prenatal care are available in the Birth MICA.)
Low Birth Weight Data Sources and Notes:
Low birth weight is associated with many negative health outcomes during infancy and may be connected to some chronic diseases that occur later in life.48
Low birth weight rates are percentages that reflect the number of resident infants with a birth weight less than 2,500 grams (5 pounds, 8 ounces) divided by the total number of resident live births. Infants with a very low birth weight of less than 1,500 grams (3 pounds, 5 ounces) are included in low birth weight rates.
Low birth weight rates were obtained from the Birth MICA, which contains data from Missouri resident birth certificates, and represent the 2008-2012 time period.

Missouri Primary Care Needs Assessment 2015 64
Table 11: Health Care Access Indicators – Medicare Enrollment, Inadequate
Prenatal Care, and Low Birth Weight (continued)
Medicare Enrollment, July 1, 2012
Inadequate Prenatal Care, 2008-2012
Low Birth Weight, 2008-2012
Geography Rate Basic Rank
Quintile Points
Rate Basic Rank
Quintile Points
Rate Basic Rank
Quintile Points
Missouri 19.2 15.1 8.0
Adair 17.9 17 1 9.4 9 1 8.3 86 4
Andrew 18.6 21 1 9.8 10 1 6.4 19 1
Atchison 27.0 100 5 8.9 7 1 6.1 15 1
Audrain 21.0 44 2 24.8 106 5 7.7 65 3
Barry 23.7 62 3 18.6 80 4 7.3 54 3
Barton 24.2 70 4 22.1 99 5 7.1 48 3
Bates 24.0 65 3 13.2 37 2 7.8 70 4
Benton 34.7 114 5 14.3 47 3 7.7 65 3
Bollinger 24.1 68 3 11.5 18 1 6.7 28 2
Boone 13.2 2 1 12.7 29 2 7.7 65 3
Buchanan 19.0 24 2 13.0 33 2 7.9 76 4
Butler 25.7 88 4 20.3 92 4 9.7 105 5
Caldwell 22.2 52 3 10.4 14 1 9.1 100 5
Callaway 18.6 22 1 15.7 58 3 9.9 106 5
Camden 26.8 97 5 11.8 21 1 5.9 13 1
Cape Girardeau
18.8 23 1 12.9 32 2 8.3 86 4
Carroll 25.7 86 4 15.2 54 3 8.6 91 4
Carter 26.3 95 5 22.8 101 5 11.3 110 5
Cass 17.9 16 1 13.6 40 2 6.9 41 2
Cedar 30.8 112 5 16.9 69 3 6.2 16 1
Chariton 26.0 90 4 11.9 22 1 5.7 12 1
Christian 18.0 19 1 9.8 10 1 6.2 16 1
Clark 24.1 69 3 13.6 40 2 5.2 4 1
Clay 15.8 6 1 12.6 28 2 6.7 28 2
Clinton 17.8 15 1 9.3 8 1 6.7 28 2
Cole 17.2 12 1 15.5 56 3 7.8 70 4
Cooper 20.7 38 2 21.4 97 5 10.3 108 5
Crawford 23.1 60 3 14.1 45 2 8.2 82 4
Dade 26.9 98 5 12.7 29 2 7.4 56 3
Dallas 24.3 73 4 15.0 53 3 6.9 41 2
Daviess 22.7 56 3 29.2 110 5 5.2 4 1

Missouri Primary Care Needs Assessment 2015 65
Table 11: Health Care Access Indicators – Medicare Enrollment, Inadequate
Prenatal Care, and Low Birth Weight (continued)
Medicare Enrollment, July 1, 2012
Inadequate Prenatal Care, 2008-2012
Low Birth Weight, 2008-2012
Geography Rate Basic Rank
Quintile Points
Rate Basic Rank
Quintile Points
Rate Basic Rank
Quintile Points
DeKalb 16.9 10 1 7.3 2 1 7.2 52 3
Dent 25.3 81 4 14.3 47 3 8.1 80 4
Douglas 25.2 78 4 13.0 33 2 8.2 82 4
Dunklin 25.4 83 4 19.0 84 4 11.7 111 5
Franklin 19.5 30 2 10.0 12 1 6.8 37 2
Gasconade 26.0 91 4 13.5 39 2 6.8 37 2
Gentry 27.7 106 5 16.5 65 3 5.2 4 1
Greene 19.4 26 2 13.1 35 2 7.4 56 3
Grundy 25.2 79 4 27.3 108 5 6.7 28 2
Harrison 25.9 89 4 19.4 87 4 6.4 19 1
Henry 28.5 107 5 17.1 70 4 7.8 70 4
Hickory 36.1 115 5 17.4 73 4 7.5 60 3
Holt 25.7 87 4 8.1 4 1 8.7 93 5
Howard 20.9 42 2 12.0 24 2 8.6 91 4
Howell 25.6 85 4 12.2 26 2 6.9 41 2
Iron 27.4 104 5 18.1 76 4 7.3 54 3
Jackson 17.3 13 1 20.5 93 5 8.3 86 4
Jasper 19.4 27 2 23.5 103 5 6.7 28 2
Jefferson 17.0 11 1 8.2 5 1 6.8 37 2
Johnson 13.9 3 1 19.1 86 4 6.3 18 1
Knox 25.3 82 4 33.0 114 5 4.9 3 1
Laclede 23.4 61 3 15.9 60 3 7.0 46 2
Lafayette 22.1 51 3 14.9 52 3 6.5 22 1
Lawrence 22.8 59 3 15.6 57 3 7.8 70 4
Lewis 21.2 45 2 21.6 98 5 5.4 7 1
Lincoln 16.4 8 1 10.8 15 1 6.6 26 2
Linn 26.3 94 5 16.6 66 3 4.8 2 1
Livingston 22.8 58 3 12.8 31 2 6.5 22 1
Macon 25.6 84 4 18.9 83 4 7.5 60 3
Madison 26.0 92 4 15.9 60 3 6.5 22 1
Maries 24.1 67 3 13.8 44 2 5.6 10 1
Marion 22.5 54 3 18.8 81 4 7.9 76 4
McDonald 17.5 14 1 31.8 112 5 8.7 93 5

Missouri Primary Care Needs Assessment 2015 66
Table 11: Health Care Access Indicators – Medicare Enrollment, Inadequate
Prenatal Care, and Low Birth Weight (continued)
Medicare Enrollment, July 1, 2012
Inadequate Prenatal Care, 2008-2012
Low Birth Weight, 2008-2012
Geography Rate Basic Rank
Quintile Points
Rate Basic Rank
Quintile Points
Rate Basic Rank
Quintile Points
Mercer 24.4 75 4 31.0 111 5 7.6 62 3
Miller 20.8 40 2 13.7 43 2 6.4 19 1
Mississippi 22.1 49 3 24.3 105 5 12.4 114 5
Moniteau 18.1 20 1 16.7 67 3 6.7 28 2
Monroe 25.0 77 4 19.9 90 4 10.1 107 5
Montgomery 24.0 66 3 13.2 37 2 6.7 28 2
Morgan 30.7 111 5 19.0 84 4 6.6 26 2
New Madrid 22.1 50 3 18.8 81 4 12.0 112 5
Newton 20.6 37 2 23.9 104 5 6.8 37 2
Nodaway 16.1 7 1 8.7 6 1 5.4 7 1
Oregon 27.0 99 5 14.3 47 3 8.9 98 5
Osage 18.0 18 1 10.0 12 1 6.7 28 2
Ozark 31.1 113 5 19.5 88 4 9.1 100 5
Pemiscot 23.8 63 3 23.2 102 5 13.6 115 5
Perry 20.3 32 2 7.5 3 1 7.7 65 3
Pettis 20.2 31 2 17.9 75 4 6.7 28 2
Phelps 19.4 28 2 14.1 45 2 7.9 76 4
Pike 20.6 35 2 25.1 107 5 8.8 97 5
Platte 14.9 4 1 12.4 27 2 6.9 41 2
Polk 20.9 41 2 11.9 22 1 7.4 56 3
Pulaski 10.6 1 1 14.3 47 3 7.4 56 3
Putnam 27.2 103 5 16.8 68 3 6.5 22 1
Ralls 22.8 57 3 20.2 91 4 8.4 90 4
Randolph 20.8 39 2 16.4 62 3 7.0 46 2
Ray 20.3 33 2 15.4 55 3 7.6 62 3
Reynolds 27.2 102 5 21.2 96 5 7.2 52 3
Ripley 26.7 96 5 20.5 93 5 10.4 109 5
Saline 21.2 46 2 11.7 20 1 8.1 80 4
Schuyler 24.3 72 4 27.4 109 5 8.2 82 4
Scotland 20.9 43 2 42.9 115 5 4.4 1 1
Scott 24.2 71 4 16.4 62 3 9.5 104 5
Shannon 25.2 80 4 13.1 35 2 7.6 62 3
Shelby 24.8 76 4 18.5 77 4 8.7 93 5

Missouri Primary Care Needs Assessment 2015 67
Table 11: Health Care Access Indicators – Medicare Enrollment, Inadequate
Prenatal Care, and Low Birth Weight (continued)
Medicare Enrollment, July 1, 2012
Inadequate Prenatal Care, 2008-2012
Low Birth Weight, 2008-2012
Geography Rate Basic Rank
Quintile Points
Rate Basic Rank
Quintile Points
Rate Basic Rank
Quintile Points
St. Charles 15.1 5 1 6.7 1 1 7.1 48 3
St. Clair 29.9 109 5 17.6 74 4 8.2 82 4
St. Francois 22.0 48 3 16.4 62 3 8.3 86 4
St. Louis 19.1 25 2 10.9 16 1 8.7 93 5
St. Louis City 16.6 9 1 22.6 100 5 12.2 113 5
Ste. Genevieve
21.3 47 3 11.5 18 1 7.1 48 3
Stoddard 26.1 93 5 18.5 77 4 9.2 103 5
Stone 30.1 110 5 17.1 70 4 8.0 79 4
Sullivan 24.4 74 4 13.6 40 2 7.8 70 4
Taney 24.0 64 3 18.5 77 4 7.8 70 4
Texas 22.6 55 3 12.1 25 2 7.7 65 3
Vernon 22.3 53 3 20.5 93 5 7.1 48 3
Warren 19.4 29 2 11.4 17 1 5.6 10 1
Washington 20.6 36 2 17.2 72 4 9.0 99 5
Wayne 29.0 108 5 19.7 89 4 9.1 100 5
Webster 20.4 34 2 32.0 113 5 5.9 13 1
Worth 27.1 101 5 14.7 51 3 5.5 9 1
Wright 27.5 105 5 15.8 59 3 6.9 41 2
*This rate is based on fewer than 20 cases and is considered to be unstable.

Missouri Primary Care Needs Assessment 2015 68
Table 12: Health Care Access Indicators – Preventable Hospitalizations, Dental
Visit in Past Year, and Dental-Related Emergency Room Visits
Preventable Hospitalizations Data Sources and Notes:
A “seminal article on this topic is from Billings, et al. (1993).† As defined in this article, preventable hospitalizations (also called ambulatory care sensitive conditions) are ‘diagnoses for which timely and effective outpatient care can help to reduce the risks of hospitalization by either preventing the onset of an illness or condition, controlling an acute episodic illness or condition, or managing a chronic disease or condition...’”49 “Although not all such hospitalizations can be avoided, admission rates in populations and communities can vary depending on access to primary care, care-seeking behaviors, and the quality of care available. Because hospitalization tends to be costlier than outpatient or primary care, potentially preventable hospitalizations often are tracked as markers of health system efficiency.”50
Preventable hospitalization rates are reported per 10,000 residents under age 65 and were obtained from the Preventable Hospitalizations MICA, which contains data from Missouri resident hospital records submitted through the Missouri Patient Abstract System.
Preventable hospitalization rates are age-adjusted to the 2000 U.S. Standard Population and reflect 2010 data.
Dental Visit in Past Year Data Sources and Notes:
“The health of the mouth and surrounding craniofacial (skull and face) structures is central to a person’s overall health and well-being.”51 “Research findings have pointed to possible associations between chronic oral infections and diabetes, heart and lung diseases, stroke, and low-birth-weight, premature births,” as well as other negative health outcomes.52 “Most healthy adults should visit a dentist at least once per year. During this visit, a dentist or dental hygienist will examine the teeth and gums, look for broken or damaged teeth, and will look for signs of oral cancer. Additionally, teeth will be cleaned to remove plaque and tartar in order to prevent tooth decay. Dental professionals often educate patients about proper brushing and flossing techniques, good dietary practices, avoiding tobacco products, and ways to avoid injuring teeth and gums.”53 Thus, regular dental exams are another form of health screening and provide a way to prevent poor health outcomes or treat them before they become severe.
Dental visit in past year rates are percentages from the 2011 County-Level Study survey of non-institutionalized Missouri resident adults ages 18 and older. These percentages are not age-adjusted.
Dental visit in past year rates are derived from “Within the past year (anytime less than 12 months ago)” responses to the following question: “How long has it been since you last visited a dentist or a dental clinic for any reason?” Visits to dental specialists such as orthodontists are included.
†Billings, J., Zeitel, L., Lukomnik, J., Carey, T.S., Blank, A.E., & Newman, L. (Spring 1993). Impact of Socioeconomic Status on Hospital Use in New York City. Health Affairs 12(1), 162-173.

Missouri Primary Care Needs Assessment 2015 69
Table 12: Health Care Access Indicators – Preventable Hospitalizations, Dental
Visit in Past Year, and Dental-Related Emergency Room Visits (continued)
Dental-Related Emergency Room (ER) Visits Data Sources and Notes:
The American Dental Association has identified dental care ER visits as an area of health care in which costs could be reduced and patient care and outcomes improved.54 The dental-related ER visit rates in this report were obtained from the Emergency Room MICA diagnosis category of disorders of teeth and jaw. The specific diagnoses “included in the ‘disorders of teeth and jaw’ category have been reviewed by DHSS-affiliated dentists to ensure they represent complaints that specifically exclude injuries and malignancies. Therefore, these dental emergency department (ED) visits can be considered preventable and non-traumatic. Dentists have also confirmed that these complaints could all be treated in a dental office rather than a hospital. Furthermore, EDs generally only provide short-term relief of symptoms for this class of dental problems, which means that an additional visit to a dentist will be necessary for most patients to complete their treatment.”55
Dental-related ER visit rates are reported per 1,000 residents and were obtained from the Emergency Room MICA, which contains data from Missouri resident ER records submitted through the Missouri Patient Abstract System.
Dental-related ER visit rates are age-adjusted to the 2000 U.S. Standard Population and represent the 2010-2012 time period.

Missouri Primary Care Needs Assessment 2015 70
Table 12: Health Care Access Indicators – Preventable Hospitalizations, Dental
Visit in Past Year, and Dental-Related Emergency Room Visits (continued)
Preventable Hospitalizations, 2010
Dental Visit in Past Year, 2011
Dental-Related ER Visits, 2010-2012
Geography Rate Basic Rank
Quintile Points
Rate Basic Rank
Quintile Points
Rate Basic Rank
Quintile Points
Missouri 141.3 57.5 10.3
Adair 162.8 86 4 62.5 24 2 5.7 26 2
Andrew 89.5 12 1 61.9 25 2 2.9 5 1
Atchison 113.9 40 2 61.2 27 2 3.8 10 1
Audrain 104.1 27 2 52.1 70 4 14.4 90 4
Barry 105.7 31 2 47.8 91 4 22.6 110 5
Barton 222.3 107 5 54.3 61 3 16.4 97 5
Bates 211.7 105 5 58.3 38 2 17.5 100 5
Benton 141.2 67 3 47.6 93 5 13.0 80 4
Bollinger 104.4 29 2 55.9 49 3 6.4 34 2
Boone 103.5 26 2 66.2 15 1 7.3 43 2
Buchanan 194.3 101 5 54.9 57 3 8.6 53 3
Butler 238.6 110 5 53.1 67 3 13.5 83 4
Caldwell 149.8 76 4 60.9 28 2 6.0 27 2
Callaway 135.0 59 3 56.8 44 2 18.5 104 5
Camden 90.9 13 1 54.2 62 3 14.3 89 4
Cape Girardeau
110.7 35 2 68.9 10 1 11.4 73 4
Carroll 240.6 111 5 62.8 23 1 8.6 53 3
Carter 225.3 108 5 48.3 90 4 6.2 31 2
Cass 100.5 20 1 69.6 8 1 8.9 55 3
Cedar 146.8 73 4 47.2 94 5 12.7 78 4
Chariton 114.6 41 2 50.7 75 4 8.3 51 3
Christian 76.7 4 1 60.4 30 2 6.3 33 2
Clark 148.4 74 4 56.6 46 2 2.4 3 1
Clay 141.2 67 3 68.9 9 1 6.8 38 2
Clinton 157.4 79 4 70.5 5 1 6.1 29 2
Cole 118.0 44 2 73.9 3 1 13.5 83 4
Cooper 113.8 39 2 59.2 34 2 11.6 74 4
Crawford 138.3 65 3 41.9 110 5 14.6 91 4
Dade 104.2 28 2 47.0 96 5 9.1 58 3
Dallas 95.7 19 1 48.4 89 4 9.9 62 3
Daviess 112.3 36 2 49.4 84 4 4.5 18 1

Missouri Primary Care Needs Assessment 2015 71
Table 12: Health Care Access Indicators – Preventable Hospitalizations, Dental
Visit in Past Year, and Dental-Related Emergency Room Visits (continued)
Preventable Hospitalizations, 2010
Dental Visit in Past Year, 2011
Dental-Related ER Visits, 2010-2012
Geography Rate Basic Rank
Quintile Points
Rate Basic Rank
Quintile Points
Rate Basic Rank
Quintile Points
DeKalb 103.1 25 2 47.8 92 4 3.8 10 1
Dent 125.4 51 3 46.4 99 5 17.6 101 5
Douglas 73.0 2 1 39.6 113 5 4.0 14 1
Dunklin 349.6 114 5 39.7 112 5 16.9 98 5
Franklin 143.0 71 4 61.5 26 2 18.8 106 5
Gasconade 129.8 54 3 57.2 42 2 10.4 67 3
Gentry 157.4 79 4 52.2 69 3 5.6 24 2
Greene 117.5 43 2 63.2 21 1 17.7 102 5
Grundy 157.5 81 4 55.5 52 3 6.7 37 2
Harrison 158.6 82 4 45.0 104 5 5.6 24 2
Henry 180.3 97 5 54.6 59 3 12.2 76 4
Hickory 87.5 10 1 49.3 85 4 8.3 51 3
Holt 101.6 22 1 54.8 58 3 2.8 4 1
Howard 83.3 8 1 55.1 55 3 8.9 55 3
Howell 141.9 69 3 55.6 51 3 13.2 81 4
Iron 169.8 90 4 45.4 102 5 25.9 113 5
Jackson 154.9 78 4 63.6 20 1 11.3 72 4
Jasper 166.6 88 4 50.2 80 4 25.2 112 5
Jefferson 135.2 60 3 65.3 17 1 5.5 23 1
Johnson 122.4 48 3 64.8 18 1 6.4 34 2
Knox 103.0 24 2 50.3 78 4 3.9 12 1
Laclede 113.0 38 2 50.3 79 4 15.6 96 5
Lafayette 161.8 84 4 60.2 33 2 13.7 85 4
Lawrence 106.6 32 2 54.9 56 3 20.9 108 5
Lewis 53.8 1 1 59.1 35 2 1.8 1 1
Lincoln 136.9 62 3 56.6 45 2 18.5 104 5
Linn 161.8 84 4 56.9 43 2 7.0 40 2
Livingston 119.5 46 2 66.2 14 1 8.1 48 3
Macon 130.8 57 3 45.0 103 5 6.0 27 2
Madison 159.8 83 4 51.3 72 4 23.4 111 5
Maries 77.5 5 1 51.1 73 4 4.5 18 1
Marion 142.5 70 4 49.5 82 4 10.3 65 3
McDonald 139.1 66 3 56.1 48 3 7.8 46 2

Missouri Primary Care Needs Assessment 2015 72
Table 12: Health Care Access Indicators – Preventable Hospitalizations, Dental
Visit in Past Year, and Dental-Related Emergency Room Visits (continued)
Preventable Hospitalizations, 2010
Dental Visit in Past Year, 2011
Dental-Related ER Visits, 2010-2012
Geography Rate Basic Rank
Quintile Points
Rate Basic Rank
Quintile Points
Rate Basic Rank
Quintile Points
Mercer 144.0 72 4 44.7 105 5 2.9 5 1
Miller 108.2 34 2 50.4 77 4 14.0 88 4
Mississippi 222.2 106 5 57.5 40 2 3.7 9 1
Moniteau 92.4 14 1 55.3 53 3 6.9 39 2
Monroe 89.4 11 1 63.0 22 1 9.2 59 3
Montgomery 123.0 49 3 52.9 68 3 11.2 71 4
Morgan 122.1 47 3 45.9 100 5 11.6 74 4
New Madrid 203.0 104 5 48.6 87 4 4.8 20 1
Newton 127.8 53 3 49.0 86 4 15.2 93 5
Nodaway 82.1 7 1 78.9 1 1 3.5 8 1
Oregon 126.4 52 3 50.5 76 4 7.2 41 2
Osage 94.3 17 1 68.1 11 1 7.3 43 2
Ozark 116.4 42 2 46.4 98 5 3.2 7 1
Pemiscot 509.5 115 5 43.7 106 5 11.1 70 4
Perry 93.4 15 1 74.2 2 1 12.9 79 4
Pettis 130.4 55 3 58.5 37 2 13.8 86 4
Phelps 135.2 60 3 60.4 31 2 15.0 92 4
Pike 130.5 56 3 53.7 64 3 8.9 55 3
Platte 85.2 9 1 73.2 4 1 3.9 12 1
Polk 119.4 45 2 53.3 66 3 11.0 69 3
Pulaski 93.4 15 1 65.5 16 1 4.3 17 1
Putnam 194.0 100 5 51.0 74 4 4.0 14 1
Ralls 75.3 3 1 60.3 32 2 4.1 16 1
Randolph 177.5 93 5 49.4 83 4 15.5 94 5
Ray 173.5 91 4 56.3 47 3 10.2 64 3
Reynolds 202.2 103 5 41.9 109 5 17.4 99 5
Ripley 279.7 113 5 36.5 115 5 17.9 103 5
Saline 178.7 95 5 46.5 97 5 10.9 68 3
Schuyler 166.0 87 4 60.8 29 2 2.3 2 1
Scotland 167.3 89 4 55.8 50 3 6.1 29 2
Scott 191.9 99 5 66.2 13 1 9.2 59 3
Shannon 112.9 37 2 37.8 114 5 19.2 107 5
Shelby 79.4 6 1 49.6 81 4 5.2 22 1

Missouri Primary Care Needs Assessment 2015 73
Table 12: Health Care Access Indicators – Preventable Hospitalizations, Dental
Visit in Past Year, and Dental-Related Emergency Room Visits (continued)
Preventable Hospitalizations, 2010
Dental Visit in Past Year, 2011
Dental-Related ER Visits, 2010-2012
Geography Rate Basic Rank
Quintile Points
Rate Basic Rank
Quintile Points
Rate Basic Rank
Quintile Points
St. Charles 101.4 21 1 70.3 6 1 4.8 20 1
St. Clair 178.4 94 5 48.5 88 4 9.5 61 3
St. Francois 188.7 98 5 54.0 63 3 28.3 115 5
St. Louis 137.9 64 3 70.0 7 1 6.5 36 2
St. Louis City 233.9 109 5 57.3 41 2 10.3 65 3
Ste. Genevieve
105.4 30 2 58.9 36 2 8.2 50 3
Stoddard 180.1 96 5 54.3 60 3 10.0 63 3
Stone 102.4 23 1 55.1 54 3 13.4 82 4
Sullivan 242.3 112 5 58.2 39 2 7.2 41 2
Taney 152.2 77 4 64.2 19 1 21.8 109 5
Texas 123.3 50 3 47.1 95 5 15.5 94 5
Vernon 148.4 74 4 51.7 71 4 13.9 87 4
Warren 137.0 63 3 67.2 12 1 12.6 77 4
Washington 198.2 102 5 43.4 107 5 27.0 114 5
Wayne 175.3 92 4 41.1 111 5 8.1 48 3
Webster 95.5 18 1 53.6 65 3 8.0 47 3
Worth 107.6 33 2 45.5 101 5 6.2 31 2
Wright 131.4 58 3 42.2 108 5 7.3 43 2

Missouri Primary Care Needs Assessment 2015 74
Table 13: Health Care Access Indicators –Mammogram, Pap Test, and
Sigmoidoscopy/Colonoscopy Screenings
Health Screenings Data Sources and Notes:
Appropriate health screenings provide a way to identify and combat potentially lethal health conditions before they become life threatening.56
Screening rates are age-adjusted percentages from the 2011 County-Level Study survey of non-institutionalized Missouri resident adults ages 18 and older.
Mammogram screening rates are derived from responses of “1 year or more” from women ages 40 and older to the following questions: “How long has it been since you had your last mammogram?” AND “How long has it been since your last breast exam (clinical breast exam by a doctor or other health professional)?”
Pap test screening rates are derived from responses of “3 years or more” from women ages 18 and older to the following question: “How long has it been since you had your last Pap test?”
Sigmoidoscopy/Colonoscopy screening rates are derived from responses of “10 years or more” from men and women ages 50 and older to the following question: "How long has it been since you had your last sigmoidoscopy or colonoscopy?"

Missouri Primary Care Needs Assessment 2015 75
Table 13: Health Care Access Indicators – Mammogram, Pap Test, and
Sigmoidoscopy/Colonoscopy Screenings (continued)
No Mammogram or Clinical Breast Exam
in Last Year for Women Ages 40+, 2011
No Pap Test in Last Three Years
for Women Ages 18+, 2011
No Sigmoidoscopy or Colonoscopy in Past 10 Years
for Adults Ages 50+, 2011
Geography Rate Basic Rank
Quintile Points
Rate Basic Rank
Quintile Points
Rate Basic Rank
Quintile Points
Missouri 30.7 25.1 37.7
Adair 36.0 59 3 32.3 65 3 41.6 42 2
Andrew 30.5 22 1 19.0 6 1 44.0 52 3
Atchison 35.6 53 3 26.4 34 2 41.7 43 2
Audrain 22.1 4 1 20.2 9 1 36.2 18 1
Barry 41.1 76 4 33.0 70 4 59.7 115 5
Barton 35.7 55 3 34.7 76 4 56.5 112 5
Bates 45.1 99 5 36.8 89 4 41.0 41 2
Benton 31.6 24 2 38.9 99 5 47.6 75 4
Bollinger 35.1 50 3 32.7 68 3 37.8 25 2
Boone 24.9 6 1 18.6 5 1 29.5 5 1
Buchanan 36.0 59 3 30.8 57 3 48.9 84 4
Butler 27.4 14 1 27.5 40 2 44.1 56 3
Caldwell 26.5 10 1 33.8 75 4 44.1 56 3
Callaway 31.6 24 2 27.3 38 2 28.0 1 1
Camden 41.5 77 4 23.2 21 1 42.9 48 3
Cape Girardeau
34.3 45 2 27.8 41 2 36.9 23 1
Carroll 46.5 103 5 36.0 84 4 48.1 79 4
Carter 30.8 23 1 32.3 65 3 48.9 84 4
Cass 34.6 48 3 20.4 10 1 36.6 20 1
Cedar 42.4 84 4 36.9 90 4 38.2 28 2
Chariton 49.3 107 5 18.3 4 1 46.5 68 3
Christian 35.9 57 3 25.8 30 2 36.6 20 1
Clark 34.2 43 2 40.7 104 5 45.5 66 3
Clay 28.3 16 1 25.4 28 2 33.5 12 1
Clinton 38.8 67 3 46.1 112 5 33.0 11 1
Cole 27.2 13 1 26.6 36 2 29.3 4 1
Cooper 45.0 97 5 33.6 73 4 40.9 40 2
Crawford 39.3 70 4 36.6 88 4 42.5 47 3
Dade 30.1 21 1 43.2 107 5 45.2 64 3
Dallas 41.5 77 4 45.6 110 5 51.2 94 5
Daviess 38.2 65 3 37.8 95 5 52.8 96 5

Missouri Primary Care Needs Assessment 2015 76
Table 13: Health Care Access Indicators – Mammogram, Pap Test, and
Sigmoidoscopy/Colonoscopy Screenings (continued)
No Mammogram or Clinical Breast Exam
in Last Year for Women Ages 40+, 2011
No Pap Test in Last Three Years
for Women Ages 18+, 2011
No Sigmoidoscopy or Colonoscopy in Past 10 Years
for Adults Ages 50+, 2011
Geography Rate Basic Rank
Quintile Points
Rate Basic Rank
Quintile Points
Rate Basic Rank
Quintile Points
DeKalb 43.2 88 4 33.4 72 4 47.2 74 4
Dent 42.4 84 4 47.1 114 5 52.9 97 5
Douglas 47.9 104 5 37.0 91 4 49.6 88 4
Dunklin 48.7 106 5 23.8 24 2 48.1 79 4
Franklin 26.8 12 1 23.0 20 1 34.3 13 1
Gasconade 32.3 27 2 27.3 38 2 38.5 31 2
Gentry 41.5 77 4 25.8 30 2 57.3 113 5
Greene 26.4 9 1 29.4 51 3 35.1 16 1
Grundy 36.2 62 3 38.4 97 5 50.4 93 5
Harrison 44.9 96 5 35.1 79 4 45.3 65 3
Henry 40.9 75 4 39.7 100 5 44.7 60 3
Hickory 40.2 74 4 41.3 105 5 48.2 82 4
Holt 42.2 83 4 37.3 92 4 40.5 36 2
Howard 38.5 66 3 40.5 103 5 46.5 68 3
Howell 45.0 97 5 35.6 81 4 54.5 106 5
Iron 50.7 111 5 36.0 84 4 47.9 77 4
Jackson 29.0 17 1 23.4 23 1 32.3 9 1
Jasper 32.8 32 2 26.5 35 2 53.1 98 5
Jefferson 33.2 36 2 22.9 18 1 29.9 6 1
Johnson 41.9 82 4 29.3 50 3 38.3 29 2
Knox 33.0 35 2 45.9 111 5 46.3 67 3
Laclede 44.0 94 5 34.8 78 4 46.5 68 3
Lafayette 29.7 19 1 17.7 2 1 37.8 25 2
Lawrence 42.4 84 4 47.0 113 5 50.3 92 4
Lewis 32.5 30 2 30.1 54 3 44.0 52 3
Lincoln 39.4 71 4 32.2 64 3 41.8 44 2
Linn 43.9 92 4 36.5 86 4 49.9 91 4
Livingston 37.2 64 3 29.4 51 3 44.3 58 3
Macon 32.4 28 2 35.7 82 4 35.0 15 1
Madison 27.4 14 1 28.5 43 2 37.5 24 2
Maries 38.9 69 3 22.6 17 1 42.4 46 2
Marion 32.8 32 2 31.8 62 3 47.7 76 4
McDonald 49.5 109 5 41.6 106 5 55.2 108 5

Missouri Primary Care Needs Assessment 2015 77
Table 13: Health Care Access Indicators – Mammogram, Pap Test, and
Sigmoidoscopy/Colonoscopy Screenings (continued)
No Mammogram or Clinical Breast Exam
in Last Year for Women Ages 40+, 2011
No Pap Test in Last Three Years
for Women Ages 18+, 2011
No Sigmoidoscopy or Colonoscopy in Past 10 Years
for Adults Ages 50+, 2011
Geography Rate Basic Rank
Quintile Points
Rate Basic Rank
Quintile Points
Rate Basic Rank
Quintile Points
Mercer 35.3 52 3 35.2 80 4 48.1 79 4
Miller 41.6 80 4 24.9 27 2 43.1 49 3
Mississippi 38.8 67 3 28.6 44 2 38.0 27 2
Moniteau 39.7 72 4 25.7 29 2 43.6 50 3
Monroe 35.9 57 3 21.0 12 1 38.4 30 2
Montgomery 24.9 6 1 19.8 8 1 35.9 17 1
Morgan 53.7 114 5 50.6 115 5 44.5 59 3
New Madrid 34.0 41 2 32.0 63 3 40.8 39 2
Newton 29.9 20 1 27.2 37 2 48.7 83 4
Nodaway 32.9 34 2 26.3 33 2 47.1 73 4
Oregon 43.9 92 4 29.2 48 3 55.8 110 5
Osage 19.1 2 1 24.3 25 2 36.5 19 1
Ozark 39.9 73 4 40.4 102 5 57.9 114 5
Pemiscot 32.4 28 2 14.2 1 1 49.2 87 4
Perry 33.9 40 2 22.9 18 1 49.1 86 4
Pettis 35.6 53 3 28.6 44 2 44.9 61 3
Phelps 33.8 39 2 29.1 47 3 39.4 34 2
Pike 45.6 100 5 28.2 42 2 45.0 63 3
Platte 20.8 3 1 21.9 16 1 28.7 3 1
Polk 34.4 46 2 37.5 94 5 53.2 99 5
Pulaski 34.2 43 2 31.3 60 3 32.2 7 1
Putnam 41.8 81 4 23.3 22 1 53.9 105 5
Ralls 17.5 1 1 19.2 7 1 36.6 20 1
Randolph 34.0 41 2 30.2 55 3 42.2 45 2
Ray 51.5 112 5 43.7 108 5 43.7 51 3
Reynolds 42.8 87 4 29.2 48 3 55.2 108 5
Ripley 57.8 115 5 38.8 98 5 44.9 61 3
Saline 26.0 8 1 17.8 3 1 38.8 32 2
Schuyler 36.4 63 3 32.6 67 3 53.7 103 5
Scotland 52.3 113 5 43.9 109 5 54.5 106 5
Scott 33.7 38 2 31.4 61 3 44.0 52 3
Shannon 49.3 107 5 36.5 86 4 52.1 95 5
Shelby 36.1 61 3 29.4 51 3 44.0 52 3

Missouri Primary Care Needs Assessment 2015 78
Table 13: Health Care Access Indicators – Mammogram, Pap Test, and
Sigmoidoscopy/Colonoscopy Screenings (continued)
No Mammogram or Clinical Breast Exam
in Last Year for Women Ages 40+, 2011
No Pap Test in Last Three Years
for Women Ages 18+, 2011
No Sigmoidoscopy or Colonoscopy in Past 10 Years
for Adults Ages 50+, 2011
Geography Rate Basic Rank
Quintile Points
Rate Basic Rank
Quintile Points
Rate Basic Rank
Quintile Points
St. Charles 29.6 18 1 21.1 13 1 28.6 2 1
St. Clair 33.6 37 2 40.3 101 5 53.8 104 5
St. Francois 32.6 31 2 34.7 76 4 39.3 33 2
St. Louis 22.3 5 1 20.6 11 1 32.6 10 1
St. Louis City 26.6 11 1 21.4 15 1 39.4 34 2
Ste. Genevieve
34.4 46 2 21.2 14 1 40.5 36 2
Stoddard 43.4 89 4 31.1 59 3 47.9 77 4
Stone 32.2 26 2 26.2 32 2 32.2 7 1
Sullivan 46.2 102 5 37.3 92 4 53.5 102 5
Taney 44.6 95 5 33.6 73 4 46.9 72 4
Texas 43.4 89 4 33.3 71 4 56.3 111 5
Vernon 48.1 105 5 32.9 69 3 53.3 100 5
Warren 34.7 49 3 37.8 95 5 34.9 14 1
Washington 35.8 56 3 35.8 83 4 46.8 71 4
Wayne 43.7 91 4 24.6 26 2 49.7 89 4
Webster 35.2 51 3 28.9 46 2 40.7 38 2
Worth 46.0 101 5 30.2 55 3 53.4 101 5
Wright 50.2 110 5 30.8 57 3 49.8 90 4

Missouri Primary Care Needs Assessment 2015 79
Table 14: Health Care Access Indicators – Population-to-Provider Ratios for
Primary Care Providers, Mental Health Providers, and Dentists
Population-to-Provider Ratios Data Sources and Notes:
Population-to-provider ratios are important access to care indicators because “many areas … lack sufficient providers to meet patient needs; as of January 2014, there were about 6,000 primary care, 3,900 mental health, and 4,800 dental federally designated ‘Health Professional Shortage Areas’ in the U.S. Having a usual primary care provider is associated with a higher likelihood of appropriate care, and a usual source of care is associated with better health outcomes. In 2010, 86 percent of Americans had a usual source of care, but those with low incomes were less likely to than those with higher incomes, and the uninsured were twice as likely as the insured to lack a usual care source.”57
Population-to-provider ratios represent the ratio of the county population to the number of providers in the specified health care category.
Population-to-provider ratios were obtained from the 2014 County Health Rankings and Roadmaps website. The mental health provider and dentist ratios utilized in this report reflect updates made to the County Health Rankings and Roadmaps website as of July 11, 2014. An explanation of these updates is available at http://www.countyhealthrankings.org/content/data-changes.
Population-to-provider ratios were not available for a small number of counties. In these instances, the average of the ratios from surrounding counties was used. If one of the surrounding counties was also missing the population-to-provider ratio, that county was excluded from the average calculation. Counties for which substitute ratios were calculated are flagged in the data table. (Counties from other states were included in the substitute ratios as appropriate.)
Primary Care Provider Ratio Notes:
“Primary care physicians include non-federal, practicing physicians (M.D.'s and D.O.'s) under age 75 specializing in general practice medicine, family medicine, internal medicine, and pediatrics… Sufficient availability of primary care physicians is essential for preventive and primary care, and when needed, referrals to appropriate specialty care… Although the relationship between primary care physicians and improved health outcomes is supported in the literature, this measure has a number of limitations. First, primary care physicians are classified by county, but physicians living on the edge of counties or who practice in multiple locations may see patient populations that reside in surrounding counties. Second, physicians are not the only type of primary care provider available for most patients. This measure does not include nurse practitioners, physician assistants or other practitioners available for primary care services. Last, the way care is organized and coordinated may be just as important to health outcomes as the number of primary care physicians in an area.”58
Counties with missing primary care provider ratios in the 2011 data file were Chariton, Putnam, Shelby, and Worth.

Missouri Primary Care Needs Assessment 2015 80
Table 14: Health Care Access Indicators – Population-to-Provider Ratios for
Primary Care Providers, Mental Health Providers, and Dentists (continued)
Mental Health Provider Ratio Notes:
“This measure represents the ratio of the county population to the number of mental health providers including psychiatrists, psychologists, licensed clinical social workers, counselors, and advanced practice nurses specializing in mental health care… This data comes from the National Provider Identification data file, which has some limitations. Providers who transmit electronic health records are required to obtain an identification number, but very small providers may not obtain a number. While providers have the option of deactivating their identification number, some mental health professionals included in this list may no longer be practicing or accepting new patients.”59
Counties with missing mental health provider ratios in the 2013 data file were Andrew, Bollinger, Caldwell, DeKalb, Miller, Monroe, Ozark, Putnam, Schuyler, Shannon, Shelby, Sullivan, and Worth.
Dentist Ratio Notes:
“This measure estimates the population per dentist in the county… Dentists are classified by county, but dentists living on the edge of counties or who practice in multiple locations may see patient populations that reside in surrounding counties. This data comes from the National Provider Identification data file, which has some limitations. Providers who transmit electronic health records are required to obtain an identification number, but very small providers may not obtain a number. While providers have the option of deactivating their identification number, some dentists included in this list may no longer be practicing or accepting new patients.”60
Counties with missing dentist ratios in the 2012 data file were Chariton and Shannon.

Missouri Primary Care Needs Assessment 2015 81
Table 14: Health Care Access Indicators – Population-to-Provider Ratios for
Primary Care Providers, Mental Health Providers, and Dentists (continued)
Primary Care Providers, 2011
Mental Health Providers, 2013
Dentists, 2012
Geography Rate Basic Rank
Quintile Points
Rate Basic Rank
Quintile Points
Rate Basic Rank
Quintile Points
Missouri 1,455 947 1,985
Adair 852 2 1 1,112 23 1 2,132 21 1
Andrew 8,598 108 5 †3,199 72 4 4,354 76 4
Atchison 5,569 97 5 2,759 65 3 1,839 13 1
Audrain 1,420 20 1 801 14 1 3,660 58 3
Barry 1,960 44 2 3,950 86 4 3,950 67 3
Barton 2,465 60 3 2,467 56 3 12,337 112 5
Bates 5,669 98 5 3,342 74 4 8,355 105 5
Benton 2,389 58 3 3,792 83 4 4,741 83 4
Bollinger 12,356 113 5 †2,406 54 3 6,191 93 5
Boone 941 3 1 430 2 1 1,702 8 1
Buchanan 1,470 22 1 854 17 1 1,794 12 1
Butler 979 5 1 730 10 1 2,050 18 1
Caldwell 9,315 110 5 †6,245 103 5 9,145 106 5
Callaway 2,613 63 3 715 9 1 4,923 86 4
Camden 1,213 13 1 1,827 36 2 2,192 22 1
Cape Girardeau
1,064 9 1 916 20 1 1,425 5 1
Carroll 3,087 73 4 9,086 108 5 2,272 25 2
Carter 6,365 101 5 2,087 46 2 6,262 95 5
Cass 4,002 86 4 2,788 66 3 3,861 62 3
Cedar 2,790 67 3 1,971 40 2 3,450 52 3
Chariton †2,290 53 3 7,649 106 5 †3,067 45 2
Christian 2,619 65 3 2,753 63 3 3,628 57 3
Clark 2,340 56 3 3,485 79 4 3,485 54 3
Clay 1,656 29 2 1,388 29 2 1,792 11 1
Clinton 1,890 42 2 5,127 99 5 1,864 15 1
Cole 1,176 12 1 898 18 1 1,909 16 1
Cooper 2,523 62 3 1,593 34 2 3,504 55 3
Crawford 6,200 99 5 4,139 88 4 8,277 104 5
Dade 1,952 43 2 1,892 37 2 7,568 101 5
Dallas 16,749 115 5 4,200 90 4 4,200 73 4
Daviess 8,313 106 5 8,239 107 5 4,120 72 4

Missouri Primary Care Needs Assessment 2015 82
Table 14: Health Care Access Indicators – Population-to-Provider Ratios for
Primary Care Providers, Mental Health Providers, and Dentists (continued)
Primary Care Providers, 2011
Mental Health Providers, 2013
Dentists, 2012
Geography Rate Basic Rank
Quintile Points
Rate Basic Rank
Quintile Points
Rate Basic Rank
Quintile Points
DeKalb 4,256 88 4 †4,402 91 4 12,940 113 5
Dent 2,613 63 3 1,956 39 2 2,235 23 1
Douglas 4,516 90 4 2,717 62 3 2,717 36 2
Dunklin 1,683 33 2 2,652 61 3 3,978 68 3
Franklin 1,521 23 1 2,415 55 3 2,415 28 2
Gasconade 2,167 48 3 2,139 47 3 4,991 88 4
Gentry 2,262 51 3 3,389 77 4 2,259 24 2
Greene 983 6 1 592 4 1 1,485 6 1
Grundy 2,046 45 2 1,149 24 2 2,585 33 2
Harrison 1,773 37 2 793 12 1 2,909 41 2
Henry 1,587 26 2 671 7 1 2,461 29 2
Hickory 9,628 111 5 2,348 51 3 9,391 107 5
Holt 2,407 59 3 2,328 50 3 4,655 80 4
Howard 3,401 81 4 3,390 78 4 2,542 32 2
Howell 1,356 17 1 1,231 26 2 2,902 40 2
Iron 5,328 96 5 2,075 44 2 10,374 111 5
Jackson 1,331 16 1 689 8 1 1,355 4 1
Jasper 1,234 14 1 841 16 1 1,859 14 1
Jefferson 4,304 89 4 2,622 60 3 3,863 63 3
Johnson 2,323 54 3 1,360 28 2 3,022 44 2
Knox 1,032 8 1 4,082 87 4 4,082 71 4
Laclede 1,549 24 2 1,476 30 2 3,935 66 3
Lafayette 3,321 79 4 2,757 64 3 3,308 50 3
Lawrence 1,841 40 2 1,012 21 1 2,748 38 2
Lewis 3,385 80 4 2,035 42 2 10,174 109 5
Lincoln 6,635 103 5 3,811 84 4 6,669 98 5
Linn 1,571 25 2 4,161 89 4 6,242 94 5
Livingston 1,370 18 1 3,007 70 4 1,671 7 1
Macon 3,118 75 4 2,596 59 3 2,596 34 2
Madison 3,049 71 4 2,075 44 2 3,112 46 2
Maries 9,171 109 5 4,507 92 4 3,005 43 2
Marion 1,149 11 1 898 18 1 2,053 19 1
McDonald 7,659 105 5 22,876 115 5 3,813 61 3

Missouri Primary Care Needs Assessment 2015 83
Table 14: Health Care Access Indicators – Population-to-Provider Ratios for
Primary Care Providers, Mental Health Providers, and Dentists (continued)
Primary Care Providers, 2011
Mental Health Providers, 2013
Dentists, 2012
Geography Rate Basic Rank
Quintile Points
Rate Basic Rank
Quintile Points
Rate Basic Rank
Quintile Points
Mercer 3,804 85 4 3,729 82 4 3,729 60 3
Miller 4,128 87 4 †4,631 93 5 4,963 87 4
Mississippi 3,577 83 4 4,774 96 5 7,161 100 5
Moniteau 3,139 77 4 5,208 100 5 3,906 65 3
Monroe 2,911 68 3 †3,375 76 4 4,352 75 4
Montgomery 3,068 72 4 2,999 69 3 5,998 92 4
Morgan 5,126 94 5 5,029 98 5 10,059 108 5
New Madrid 6,261 100 5 9,244 109 5 4,622 79 4
Newton 4,868 92 4 6,563 105 5 5,907 91 4
Nodaway 1,676 32 2 1,561 32 2 4,684 81 4
Oregon 11,017 112 5 10,997 113 5 5,499 90 4
Osage 13,915 114 5 13,858 114 5 4,619 78 4
Ozark 4,798 91 4 †2,308 49 3 4,801 84 4
Pemiscot 3,635 84 4 6,037 102 5 18,111 115 5
Perry 2,380 57 3 2,377 52 3 2,717 36 2
Pettis 2,481 61 3 1,176 25 2 2,645 35 2
Phelps 1,000 7 1 750 11 1 2,499 31 2
Pike 3,095 74 4 9,283 110 5 3,713 59 3
Platte 1,420 20 1 1,644 35 2 1,770 9 1
Polk 1,732 36 2 795 13 1 3,877 64 3
Pulaski 3,545 82 4 1,087 22 1 1,024 1 1
Putnam †1,807 39 2 †3,590 81 4 2,466 30 2
Ralls 5,141 95 5 10,277 112 5 10,277 110 5
Randolph 1,690 34 2 2,303 48 3 2,814 39 2
Ray 2,323 54 3 5,766 101 5 7,688 102 5
Reynolds 1,647 28 2 833 15 1 1,111 2 1
Ripley 7,072 104 5 4,679 94 5 7,018 99 5
Saline 1,791 38 2 1,556 31 2 3,334 51 3
Schuyler 2,191 49 3 †3,055 71 4 4,370 77 4
Scotland 966 4 1 4,877 97 5 4,877 85 4
Scott 1,702 35 2 2,060 43 2 1,779 10 1
Shannon 8,432 107 5 †3,926 85 4 †4,077 70 4
Shelby †2,214 50 3 †2,383 53 3 3,117 48 3

Missouri Primary Care Needs Assessment 2015 84
Table 14: Population-to-Provider Ratios for Primary Care Providers, Mental
Health Providers, and Dentists (continued)
Primary Care Providers, 2011
Mental Health Providers, 2013
Dentists, 2012
Geography Rate Basic Rank
Quintile Points
Rate Basic Rank
Quintile Points
Rate Basic Rank
Quintile Points
St. Charles 2,123 46 2 1,562 33 2 1,920 17 1
St. Clair 1,607 27 2 9,474 111 5 4,737 82 4
St. Francois 1,131 10 1 646 6 1 2,996 42 2
St. Louis 850 1 1 607 5 1 1,283 3 1
St. Louis City 1,414 19 1 484 3 1 2,374 27 2
Ste. Genevieve
2,266 52 3 2,957 68 3 3,548 56 3
Stoddard 1,656 29 2 3,311 73 4 4,256 74 4
Stone 3,226 78 4 3,508 80 4 7,892 103 5
Sullivan 1,665 31 2 †2,549 58 3 6,546 97 5
Taney 1,256 15 1 2,942 67 3 3,115 47 3
Texas 2,161 47 3 6,453 104 5 6,453 96 5
Vernon 2,995 69 3 423 1 1 3,458 53 3
Warren 6,503 102 5 4,679 94 5 5,459 89 4
Washington 5,015 93 5 2,510 57 3 3,137 49 3
Wayne 2,695 66 3 3,351 75 4 13,402 114 5
Webster 3,037 70 4 2,020 41 2 4,039 69 3
Worth †1,854 41 2 †1,914 38 2 2,079 20 1
Wright 3,119 76 4 1,242 27 2 2,329 26 2
†Population-to-provider ratio was not available. An estimated value calculated by averaging the ratios of surrounding counties was used.

Missouri Primary Care Needs Assessment 2015 85
APPENDIX B
Glossary
Age-Adjusted Rates
Statistical Significance
Unstable Rates
Behavioral Risk Factor Surveillance System (BRFSS)
Missouri County-Level Study
Healthy People 2020
Body Mass Index
Resident

Missouri Primary Care Needs Assessment 2015 86
Age-Adjusted Rates
Age adjusting rates is a way to make fairer comparisons between groups with different age distributions. For example, a county having a higher percentage of elderly people may have a higher rate of death or hospitalization than a county with a younger population, merely because the elderly are more likely to die or be hospitalized. (The same distortion can happen when comparing races, genders, or time periods.) Age adjustment can make the different groups more comparable.
A "standard" population distribution is used to adjust death and hospitalization rates. The age-adjusted rates are rates that would have existed if the population under study had the same age distribution as the "standard" population. Therefore, they are summary measures adjusted for differences in age distributions.
The National Center for Health Statistics recommends that the U.S. 2000 standard population be used when calculating age-adjusted rates. The U.S. 2000 standard population was used for all age-adjusted rates in this report unless otherwise noted.
When age-adjusted rates from different sources are compared, it is very important to verify that the same standard population was used in both sources. It is not legitimate to compare adjusted rates which use different standard populations. Users of Missouri Information for Community Assessment (MICA) have the option of selecting age-adjusted rates based on the U.S. 1940, 1970 or 2000 standard populations when generating tables where age adjustment is utilized. Age-adjusted rates in the Community Data Profiles use the U.S. 2000 standard population. Age-adjusted rates published elsewhere (e.g., in the annual Missouri Vital Statistics) may be slightly different from those found in the MICAs or Community Data Profiles due to updating of population estimates for years between decennial Censuses.
The constant or "per population" number used for the age-adjusted rates may vary depending on the type of event. For example, the age-adjusted rates for deaths are reported per 100,000 residents. However, age-adjusted rates for hospitalizations and procedures are reported per 10,000 residents, and age-adjusted rates for emergency department visits are reported per 1,000 residents.
The use of different standard populations can also affect general trends in total mortality and cause of death and differences in mortality by race and gender. For more information on this topic see: “Effects of Changing from the 1940 to the Year 2000 Standard Population for Age-Adjusted Death Rates in Missouri”: Missouri Monthly Vital Statistics, 33.12 (Feb. 2000).

Missouri Primary Care Needs Assessment 2015 87
Statistical Significance
Statistical significance tests are performed to determine whether the difference between two rates is probably the result of chance factors or if it is meaningful.
Unstable Rates
Unstable rates are rates based on fewer than 20 events. They can be common for small population areas, such as certain counties, or for low-frequency events, such as cause-specific deaths or birth defects. If the use of data from one specified year is not required, combining multiple years of data can often generate a stable rate. Similarly, data from several counties can be combined to create a stable regional rate. In this report, multiple years of data were combined for indicators with unstable rates for a large number of counties.

Missouri Primary Care Needs Assessment 2015 88
Behavioral Risk Factor Surveillance System (BRFSS)
The Behavioral Risk Factor Surveillance System (BRFSS) is an annual landline and cell telephone survey that collects information on health risk behaviors, preventive health practices, and health care access from non-institutionalized adults ages 18 and older. The annual BRFSS sample size of over 6,000 Missouri residents produces prevalence estimates at the state and regional levels.
Source: http://www.health.mo.gov/data/brfss/BRFSSRegionsMap.pdf

Missouri Primary Care Needs Assessment 2015 89
Missouri County-Level Study
The Missouri County-Level Study (CLS) is a BRFSS-like landline and cell telephone survey that was conducted in 2007 and 2011 with approximately 50,000 non-institutionalized adults ages 18 and older. Sufficient data were collected to produce prevalence estimates for each of the state’s 114 counties and the City of St. Louis.
Healthy People 2020
Healthy People 2020 objectives are health status targets for the entire U.S. Targets are set using baseline U.S. data. Objectives are organized into 42 topic areas, with Leading Health Indicators identified in 12 of these topic areas. Additional information about Healthy People 2020 is available at http://www.healthypeople.gov/2020/default.aspx.
Body Mass Index
Body Mass Index (BMI) is an indicator of body fat. The Behavioral Risk Factor Surveillance System and Missouri County-Level Study derive Overweight (25.0 – 29.9 BMI) and Obese (>=30 BMI) indicators by calculating BMI using responses to the following questions:
“About how much do you weigh without shoes?” “About how tall are you without shoes?”
Resident
Resident means the person was a resident of Missouri at the time of the event in question (birth, death, emergency room visit, etc.). Data in the MICA (Missouri Information for Community Assessment) system are reported by resident status. For example, a record for a Missouri resident treated in a Kansas hospital would be reported as a Missouri hospitalization. Missouri receives vital records and hospital data from most of its border states.

Missouri Primary Care Needs Assessment 2015 90
APPENDIX C
The MICA (Missouri Information for Community Assessment) System
MICA System Tools
Accessing the MICA Tools

Missouri Primary Care Needs Assessment 2015 91
MICA System Tools
Community Data Profiles are static tables and are available for various subject areas. Each Community Data Profile table provides data on 15-30 indicators for the county/city selected. Information provided includes data years, number of events, county/city rate, state rate, statistical significance (compared to the state), quintile ranking, links to additional graphing functions, and multiple downloading options.
MICA (Missouri Information for Community Assessment) datasets provide information on health conditions and associated topics. Users can choose from among the many conditions, generate data tables by year of occurrence, age, gender, race, and county or zip code of residence, and obtain age-adjusted rates. MICA also allows users to download tables into other applications in order to produce charts or graphs. Data for the MICAs are extracted and summarized from files maintained by the Missouri Department of Health and Senior Services. Frequencies are then pre-computed for each combination of the variables. This provides two major advantages: the response time to create and return a table is usually less than five seconds, and no individual record can be accessed. Confidentiality rules have been developed to protect the privacy of individuals.
Priorities MICA provides a structured process for determining the priority health needs within a community. This tool allows a user to select diseases or risk factors for prioritization and then choose criteria to be used to determine the priority health needs among those diseases or risk factors. Users can rate the level of community support for each disease/risk factor and the importance of each criterion. Priorities can be determined for the state of Missouri, individual counties, or selected cities/areas. A total weight is given to each disease/risk factor based on the user’s choices, and the diseases/risk factors are then presented as a ranked list.
CHIR (Community Health Improvement Resources) is an interactive, evidence-based planning tool which incorporates its predecessor, Intervention MICA. It provides links to information and resources which can be used to design, implement, and evaluate interventions that improve the health of a community. CHIR includes seven steps: Partnerships, Assessment, Readiness, Capacity, Intervention, Evaluation, and Momentum.
Together these four tools can assist public health professionals with the process of continuous community health improvements.

Missouri Primary Care Needs Assessment 2015 92
Accessing the MICA Tools
Much of the health data included in this report may be accessed on the Missouri Department of Health and Senior Services (DHSS) Community Data Profiles and MICA websites. Users can easily create different types of tables, charts, or maps pertaining to health indicators.
The following step-by-step guide offers instructions for accessing health data on the DHSS Community Data Profiles website.
1. Go to the DHSS Community Data Profiles website: http://health.mo.gov/data/CommunityDataProfiles/index.html
2. From the topic list, select a Profile. Then use the pull-down geography menu to choose whether to view data by city, county, or at the state level. Data for BRFSS Regions are available for some topics. Click the Submit button.
3. The requested data table will appear.
4. The Trend Line and Comparison Bar Graph columns at the right side of the table provide links to
available graphics. Users can select the Trend Line icon to create a graph showing three-year moving average trend lines for the selected geography and the state. Users can select the Comparison Bar Graphs icon to create a bar chart showing the rates for a specific indicator in selected geographies or compare indicators within a single geography.
The following step-by-step guide offers instructions on accessing data on the DHSS MICA website.
1. Go to the DHSS MICA website: http://health.mo.gov/data/mica/MICA/
2. Choose a topic from the list of MICA datasets.
3. Select a viewing option. Options may include county/city tables, maps, or ZIPzip cCode tables. Each option provides a query screen that allows users to customize the data output.
For more detailed information on using the Community Data Profiles and MICAs, please refer to the MICA User Handbook at http://health.mo.gov/data/mica/MICA/CHAIPTraining.html or contact the DHSS Bureau of Health Care Analysis and Data Dissemination at 573-751-6272.
The Bureau also offers free health data trainings which are posted at http://health.mo.gov/data/mica/MICA/healthdatatraining.html. A quarterly newsletter describing data and feature updates is available through this link as well.

Missouri Primary Care Needs Assessment 2015 93
Endnotes
1 Healthy People 2020. (Last updated October 31, 2014). Maternal, Infant, and Child Health. Accessed October
31, 2014, from http://www.healthypeople.gov/2020/topics-objectives/topic/maternal-infant-and-child-health. 2 Centers for Disease Control and Prevention, Pediatric and Pregnancy Nutrition Surveillance System. (Last
updated March 8, 2011). PNSS Health Indicators. Accessed November 13, 2014, from http://www.cdc.gov/PEDNSS/what_is/pnss_health_indicators.htm. 3 Boardman, M., and Hoff, S. (Last updated June 1, 2012). Self-reported Health Status. In Washington State
Department of Health, Health of Washington State. Accessed November 13, 2014, from http://www.doh.wa.gov/Portals/1/Documents/5500/GHS-SRHS2012.pdf. 4 U.S. Department of Health and Human Services, National Heart, Lung, and Blood Institute. (Last updated July 13,
2012). What Are the Health Risks of Overweight and Obesity? Accessed November 13, 2014, from http://www.nhlbi.nih.gov/health/health-topics/topics/obe/risks.html. 5 U.S. Department of Health and Human Services, National Heart, Lung, and Blood Institute. (Last updated August
2, 2012). What Is High Blood Pressure? Accessed November 13, 2014, from http://www.nhlbi.nih.gov/health/health-topics/topics/hbp/. 6 Centers for Disease Control and Prevention. (Last updated February 28, 2014). High Cholesterol. Accessed
November 13, 2014, from http://www.cdc.gov/cholesterol/. 7 Missouri Department of Health and Senior Services. (Last updated April 24, 2014). MICA: Death MICA. Accessed
November 13, 2014, from http://www.health.mo.gov/data/mica/DeathMICA/. 8 Centers for Disease Control and Prevention. (Last updated February 6, 2014). Smoking & Tobacco Use. Accessed
November 13, 2014, from http://www.cdc.gov/tobacco/data_statistics/fact_sheets/health_effects/effects_cig_smoking/. 9 Missouri Department of Health and Senior Services. (Last updated September 22, 2014). Community Data
Profiles: Death – Leading Causes Profile. Accessed November 13, 2014, from http://www.health.mo.gov/data/CommunityDataProfiles/index.html. 10
America’s Health Rankings. (2014). Missouri: Measures. Accessed November 13, 2014, from http://www.americashealthrankings.org/mo. 11
U.S. Department of Health and Human Services, Centers for Disease Control and Prevention. (2011). National Diabetes Fact Sheet: National Estimates and General Information on Diabetes and Prediabetes in the United States. Accessed February 9, 2015, from http://www.cdc.gov/diabetes/pubs/pdf/ndfs_2011.pdf. 12
Missouri Department of Health and Senior Services. (Last updated January 26, 2015). MICA: Death MICA. Accessed February 9, 2015, from http://www.health.mo.gov/data/mica/DeathMICA/. 13
Missouri Department of Health and Senior Services. Community Data Profiles: 2011 County-Level Study – Health and Preventive Practices Profile. Accessed November 13, 2014, from http://www.health.mo.gov/data/CommunityDataProfiles/index.html. 14
U.S. National Library of Medicine, National Institutes of Health. (Last updated May 14, 2014). MedlinePlus: Asthma. Accessed November 13, 2014, from http://www.nlm.nih.gov/medlineplus/ency/article/000141.htm.

Missouri Primary Care Needs Assessment 2015 94
15
Missouri Department of Health and Senior Services. (Last updated April 24, 2014). MICA: Death MICA. Accessed November 13, 2014, from http://www.health.mo.gov/data/mica/DeathMICA/. 16
Missouri Department of Health and Senior Services. (Last updated May 28, 2014). MICA: Hospital Discharges, Charges, and Days of Care MICA. Accessed November 13, 2014, from http://www.health.mo.gov/data/mica/D_C_DofCMICA/. 17
Coryell, W. (Last updated December 2013). Depressive Disorders. The Merck Manual Professional Edition. Accessed November 13, 2014, from http://www.merckmanuals.com/professional/psychiatric_disorders/mood_disorders/depressive_disorders.html. 18
National Alliance on Mental Illness. What Is Depression? Accessed November 13, 2014, from http://www.nami.org/Template.cfm?Section=depression. 19
Missouri Department of Health and Senior Services. (Last updated April 24, 2014). MICA: Death MICA. Accessed November 13, 2014, from http://www.health.mo.gov/data/mica/DeathMICA/. 20
AIDS.gov. (Last updated April 29, 2014). What Is HIV/AIDS? Accessed November 13, 2014, from http://www.aids.gov/hiv-aids-basics/hiv-aids-101/what-is-hiv-aids/. 21
AIDS.gov. (Last updated June 16, 2014). How Do You Get HIV or AIDS? Accessed November 13, 2014, from http://www.aids.gov/hiv-aids-basics/hiv-aids-101/how-you-get-hiv-aids/index.html. 22
Hoyert, D.L. (March 2012). 75 Years of Mortality in the United States, 1935–2010. NCHS Data Brief 88. Hyattsville, MD: National Center for Health Statistics. Accessed February 9, 2015, from http://www.cdc.gov/nchs/data/databriefs/db88.htm#x2013;2010</a>. 23
U.S. Department of Health and Human Services, Health Resources and Services Administration, Maternal and Child Health. Infant Mortality. Accessed November 13, 2014, from http://mchb.hrsa.gov/infantmortality/. 24
Healthy People 2020. (Last updated November 18, 2014). Cancer. Accessed November 18, 2014, from http://www.healthypeople.gov/2020/topics-objectives/topic/cancer. 25
Missouri Department of Health and Senior Services. (Last updated April 24, 2014). MICA: Death MICA. Accessed November 13, 2014, from http://www.health.mo.gov/data/mica/DeathMICA/. 26
Healthy People 2020. (Last updated November 18, 2014). Heart Disease and Stroke. Accessed November 18, 2014, from http://www.healthypeople.gov/2020/topics-objectives/topic/heart-disease-and-stroke. 27
Missouri Department of Health and Senior Services. (Last updated April 24, 2014). MICA: Death MICA. Accessed November 13, 2014, from http://www.health.mo.gov/data/mica/DeathMICA/. 28
Healthy People 2020. (Last updated November 13, 2014). Leading Health Indicators: Maternal, Infant, and Child Health. Accessed November 13, 2014, from http://www.healthypeople.gov/2020/leading-health-indicators/2020-lhi-topics/Maternal-Infant-and-Child-Health. 29
Missouri Department of Health and Senior Services. (Last updated April 24, 2014). MICA: Death MICA. Accessed November 13, 2014, from http://www.health.mo.gov/data/mica/DeathMICA/. 30
Centers for Disease Control and Prevention. (Last updated July 14, 2014). Faststats: Leading Causes of Death. Accessed November 26, 2014, from http://www.cdc.gov/nchs/fastats/leading-causes-of-death.htm.

Missouri Primary Care Needs Assessment 2015 95
31
Missouri Department of Health and Senior Services. (Last updated April 24, 2014). MICA: Death MICA. Accessed November 13, 2014, from http://www.health.mo.gov/data/mica/DeathMICA/. 32
Centers for Disease Control and Prevention. (Last updated July 14, 2014). Faststats: Leading Causes of Death. Accessed November 26, 2014, from http://www.cdc.gov/nchs/fastats/leading-causes-of-death.htm. 33
Murray, S. (March 28, 2006). Poverty and Health. Canadian Medical Association Journal, 174(7), 923. Accessed November 26, 2014, from http://www.ncbi.nlm.nih.gov/pmc/articles/PMC1405857/. doi: 10.1503/cmaj.060235 34
Rice, S. (August 29, 2006). Poverty and Poor Health Are Intertwined, Experts Say. CNN Health. Accessed November 26, 2014, from http://articles.cnn.com/2006-08-29/health/poverty.health_1_health-insurance-poverty-health-care?_s=PM:HEALTH. 35
Strully, K.W. (May 2009). Job Loss and Health in the U.S. Labor Market. Demography 46(2), 221-246. Accessed November 26, 2014, from http://www.ncbi.nlm.nih.gov/pmc/articles/PMC2831278/. 36
U.S. Census Bureau, Small Area Income and Poverty Estimates (SAIPE). SAIPE Methodology. Accessed November 12, 2014, from https://www.census.gov/did/www/saipe/methods/index.html. 37
Brooks, E.L., Preis, S.R., Hwang, S., Murabito, J.M., Benjamin, E.J., Kelly-Hayes, M., . . . Levy, D. (August 2010). Health Insurance and Cardiovascular Disease Risk Factors. American Journal of Medicine 123(8), 741-747. Accessed November 26, 2014, from http://www.ncbi.nlm.nih.gov/pmc/articles/PMC2913281/. 38
U.S. Census Bureau, Small Area Health Insurance Estimates. SAHIE Methodology. Accessed November 12, 2014, from http://www.census.gov/did/www/sahie/methods/index.html. 39
Centers for Medicare and Medicaid Services. Medicare.gov: Medicaid. Accessed November 26, 2014, from http://www.medicare.gov/your-medicare-costs/help-paying-costs/medicaid/medicaid.html. 40
Social Security Administration. Medicaid Information. Accessed November 26, 2014, from http://www.socialsecurity.gov/disabilityresearch/wi/medicaid.htm. 41
Missouri Department of Health and Senior Services. (Last updated November 19, 2014). MICA: Medicaid Records MICA. Accessed November 20, 2014, from http://www.health.mo.gov/data/mica/MICA/. 42
Missouri Department of Health and Senior Services. (Last updated March 25, 2014). MICA: Population MICA. Accessed November 20, 2014, from http://www.health.mo.gov/data/mica/PopulationMICA/. 43
Centers for Medicare and Medicaid Services. Medicare.gov: What Is Medicare? Accessed November 26, 2014, from http://www.medicare.gov/sign-up-change-plans/decide-how-to-get-medicare/whats-medicare/what-is-medicare.html. 44
Centers for Medicare and Medicaid Services. (July 1, 2012). Medicare Enrollment Reports: Medicare Aged and Disabled by State and County as of July 1, 2012. Accessed November 12, 2014, from http://www.cms.gov/Research-Statistics-Data-and-Systems/Statistics-Trends-and-Reports/MedicareEnrpts/Downloads/County2012.pdf. 45
Missouri Department of Health and Senior Services. (Last updated March 25, 2014). MICA: Population MICA. Accessed November 12, 2014, from http://www.health.mo.gov/data/mica/PopulationMICA/.

Missouri Primary Care Needs Assessment 2015 96
46
Kotelchuck, M. (September 1994). Overview of Adequacy of Prenatal Care Utilization Index. Accessed November 26, 2014, from http://www.mchlibrary.info/databases/HSNRCPDFs/Overview_APCUIndex.pdf. 47
U.S. Department of Health and Human Services, Health Resources and Services Administration. Maternal and Child Health: Prenatal Services. Accessed November 26, 2014, from http://mchb.hrsa.gov/programs/womeninfants/prenatal.html. 48
America’s Health Rankings. Low Birthweight. Accessed November 26, 2014, from http://www.americashealthrankings.org/ALL/birthweight. 49
Missouri Department of Health and Senior Services. Preventable Hospitalization MICA: Documentation. Accessed February 10, 2015, from http://www.health.mo.gov/data/mica/PreventableMICA/Documentation.html. 50
Moy, E., Chang, E., & Barrett, E. (November 22, 2013). Potentially Preventable Hospitalizations – United States, 2001-2009. Morbidity and Mortality Weekly Reports Supplements 62(03), 139-143. Accessed November 26, 2014, from http://www.cdc.gov/mmwr/preview/mmwrhtml/su6203a23.htm. 51
HealthyPeople.gov. (Last updated November 25, 2014). Oral Health. Accessed November 26, 2014, from http://www.healthypeople.gov/2020/topics-objectives/topic/oral-health. 52
U.S. Department of Health and Human Services. Oral Health in America: A Report of the Surgeon General. Rockville, MD: U.S. Department of Health and Human Services, National Institute of Dental and Craniofacial Research, National Institutes of Health, 2000. Accessed February 10, 2015, from http://www.nidcr.nih.gov/DataStatistics/SurgeonGeneral/Report/ExecutiveSummary.htm. 53
Missouri Department of Health and Senior Services. (2014). Oral Health in Missouri – 2014: A Burden Report by the Missouri Department of Health and Senior Services. Accessed November 26, 2014, from http://health.mo.gov/living/families/oralhealth/pdf/2014OralHealthReport.pdf. 54
American Dental Association. (Last updated August 2013). The Issue: Reduce Health Care Costs and Improve Patient Care by Treating Dental Disease in the Dental Practice Instead of the ER. Accessed November 26, 2014, from http://www.ada.org/~/media/ADA/Public%20Programs/Files/ER_Utilization_Issues_Flyer.ashx. 55
Kelsey, A. (November 2014). MICA User Group Newsletter, Issue #11. Accessed November 26, 2014, from http://www.health.mo.gov/data/mica/MICA/pdf/newsletter11.pdf. 56
National Cancer Institute at the National Institutes of Health. (Last updated July 2, 2014). Cancer Screening Overview (PDQ®): What Is Cancer Screening? Accessed February 10, 2015, from http://www.cancer.gov/cancertopics/pdq/screening/overview/patient/page1. 57
County Health Rankings & Roadmaps. (2014). Access to Care. Accessed December 15, 2014, from http://www.countyhealthrankings.org/our-approach/health-factors/access-care. 58
County Health Rankings & Roadmaps. (2014). Primary Care Physicians. Accessed December 15, 2014, from http://www.countyhealthrankings.org/app/#!/missouri/2014/measure/factors/4/description. 59
County Health Rankings & Roadmaps. (2014). Mental Health Providers. Accessed December 15, 2014, from http://www.countyhealthrankings.org/app/#!/missouri/2014/measure/factors/62/description. 60
County Health Rankings & Roadmaps. (2014). Dentists. Accessed December 15, 2014, from http://www.countyhealthrankings.org/app/#!/missouri/2014/measure/factors/88/description.