mister sandman, bring me good marks! on the relationship ... · pdf file1 mister sandman,...
TRANSCRIPT
1
Mister Sandman, Bring Me Good Marks!
On the Relationship Between Sleep
Quality and Academic Achievement
Stijn Baerta,b,c,*, Eddy Omeya, Dieter Verhaesta,d, Aurélie Vermeira
a Sherppa—Study Hive for Economic Research and Public Policy Analysis, Ghent
University. Sint-Pietersplein 6, B-9000 Ghent, Belgium.
b Department of Sociology, University of Antwerp. Sint-Jacobsstraat 2, B-2000
Antwerp, Belgium.
c IZA—Institute for the Study of Labor. Schaumburg-Lippe-Straße 5-9, D-53113 Bonn,
Germany.
d HRRG—Human Relations Research Group, KU Leuven. Warmoesberg 26, B-1000
Brussels, Belgium.
* Corresponding author. Email address: [email protected]. Telephone number:
003292643481. Fax number: 003292648996. Homepage:
http://users.UGent.be/~sbaert.
Abstract. There is growing evidence that health factors affect tertiary
education success in a causal way. This study assesses the effect of sleep
quality on academic achievement at university. To this end, we surveyed

2
804 students about their sleep quality by means of the Pittsburgh Sleep
Quality Index (PSQI) before the start of their first exam period in December
2013 at Ghent University. PSQI scores were merged with course marks in
this exam period. Instrumenting PSQI scores by sleep quality during
secondary education, we find that increasing total sleep quality with one
standard deviation leads to 4.85 percentage point higher course marks.
Based on this finding, we suggest that higher education providers might be
incentivised to invest part of their resources for social facilities in
professional support for students with sleep and other health problems.
Keywords. Belgium; economics of education; economics of health;
economics of sleep; academic achievement; sleep quality.
3
1 Introduction
For decades, economists have been studying the determinants of academic
attainment. Seminal studies such as Black et al. (2005), Vardardottir (2013)
and Leos-Urbel et al. (2013) have identified prior accumulated human
capital, the costs and returns of higher education, social background
characteristics and gender as key determinants in explaining outcomes in
higher education.
Recently, academics have also focused on the role of health factors on
academic achievements. For instance Ding et al. (2009), García-Gómez et
al. (2013), Fletcher (2014), Sabia (2007), Balsa et al. (2011) and Pieterse
(Forthcoming) identify a negative relationship between poor general
health, health shocks, ADHD, body weight, alcohol usage and maltreatment
respectively on the one hand and academic performance on the other
hand. In addition, Bharadwaj et al. (2013) reveal a positive relationship
between early health interventions and academic achievement.
A neglected factor in the economic literature on academic
achievements is sleep quality. From a theoretical point of view, a positive
relationship between sleep quality and academic performance can be
expected. Based on research within medicine and biology, we know that
night’s rest is essential to helping maintain mood, attention, motivation,
4
memory and cognitive performance. While asleep, the brain integrates
new knowledge and forms new associations (see, e.g., AlDabal &
BaHammam, 2011; Alvaro, 2014; Beebe, 2011; Buckhalt et al., 2007; Gais &
Born, 2004; Louca & Short, 2014; Meijer et al., 2000; Siegel, 2001;
Vandekerckhove & Cluydts, 2010; Walker & Stickgold, 2004). From an
empirical point of view, former contributions indeed found a positive
relation between sleep quality and/or sleep duration and academic
performance. Many studies report a positive association between
opportune sleep habits and beneficial primary and secondary schooling
outcomes such as reading, math and spatial ability test scores and school
grades (see, e.g., Bruni et al., 2006; Dewald et al., 2010; Kelly et al., 2013;
Meijer, 2008; Perkinson-Gloor, 2013; Short et al., 2013; Stea et al., 2014).
In addition, randomised controlled trails have shown that interventions
such as teaching behavioural sleep strategies and imposing minimum
restrictions on sleep duration result in a positive effect on academic
achievement in primary and secondary school (Beebe et al., 2010; Fallone
et al., 2005; Quach et al., 2011; Quach et al., 2013; Randazzo et al., 1998;
Sadeh et al., 2003). Last, some studies also report positive correlations
between sleep quality or sleep duration on the one hand and grade point
averages and exam passing probabilities on the other hand in tertiary
education in China, Ethiopia, Germany and Portugal (Ahrberg et al., 2012;

5
Genzel et al., 2013; Gomes, 2011; Lemma et al., 2014; Wong et al., 2012).
In contrast, Eliasson et al. (2010) and Trockel et al. (2000) find no
significant results in this respect in the United States (Washington DC and
Utah). For a more in-depth review of former studies on the relationship
between sleep habits and academic performance, we refer to Curcio et al.
(2006), Shochat et al. (2014) and Taras & Potts-Datema (2005).
In this study, we empirically test the relationship between sleep quality,
sleep duration and academic achievement. To this end, we survey first-year
university students on their sleep habits, by means of the Pittsburgh Sleep
Quality Index (Buysse et al., 1989), before the start of their first exam
period at university. In addition, these students are surveyed on general
social background and health characteristics. The resulting dataset is
merged with their academic achievement in terms of course marks in their
first exam period. Our research question is then answered by exploring
2SLS estimations on the gathered data. To be able to correctly identify the
influence of sleep quality on academic achievement, the respondents’
sleep quality is instrumented by their sleep quality during secondary
education.
Our contribution to the aforementioned academic literature is
threefold. First, we contribute to the recent string of articles – a series
characterised, as mentioned before, by mixed findings – on the effect of
6
sleep behaviour on academic performance among university students.
Second, we are innovative in studying the effect of both sleep quality and
sleep duration on academic performance at university within one empirical
framework. Third, as reviewed by Curcio et al. (2006), most non-
experimental studies on sleep quality and academic performance present
correlation and simple (linear or mediation) regression analyses. Thereby,
as we will argue in Section 3, their results cannot be given a causal
interpretation. In the present study we explicitly take into account the
endogeneity of sleep quality with respect to academic performance by
means of the mentioned data gathering and statistical analysis method.
2 Data
2.1 Data Gathering
Our dataset was constructed by merging survey data on first-year
university students’ sleep quality and further individual characteristics with
their first university exam marks.
In December 2013, we conducted a survey on the students present at
the start of the last lecture of the first-semester courses of Economics and
Introduction to Accountancy at Ghent University in Belgium. These courses
7
are part of the first year Bachelor programs of (Business) Economics – the
first-year study program is the same for the Bachelor of Science in
Economics and the Bachelor of Science in Business Economics at Ghent
University – and Commercial Sciences respectively, but are also taken by
some students of other programs. The total number of students enrolled in
the course of Economics (Introduction to Accountancy) in 2013 was 685
(638). 394 (410) of them attended the last lecture of the course. The fact
that the attendance rate was only about 58% (64%) should not pose a
problem of external validity as it is unlikely that the relationship between
sleep quality and academic achievement would be different between
attenders and non-attenders. These students were asked to fill out a
paper-and-pencil questionnaire.
This questionnaire comprised five sections. A first section was
dedicated to general questions about the subject’s social-economic
background characteristics (age, gender, parental education, household
composition, nationality, language at parental home, living place, prior
educational attainment, relationship status and general health). These
characteristics are used in our analysis to explain both sleep quality (see,
e.g. Hale et al., 2013, for recent evidence on the relationship between
social background and sleep quality) and academic achievement.
In a second section, we surveyed quality of sleep by means of the
8
validated Pittsburgh Sleep Quality Index (Buysse et al., 1989). This question
module measures sleep quality (in broad sense) during the previous
month. The PSQI contains 19 self-rated questions yielding seven PSQI
submeasures: sleep duration, sleep disturbance, sleep latency, day
dysfunction due to sleepiness, sleep efficiency, overall perceived sleep
quality and need of medicines to sleep. Each component is scored from 0
to 3. For instance, the PSQI submeasure of sleep duration, the most
important submeasure in the context of the present study, is based on
question 4 of the Pittsburgh Sleep Quality Index: “During the past month,
how many hours of actual sleep did you get at night? (This may be different
than the number of hours you spent in bed.)” The answer on this question
is then scored as follows: PSQI submeasure of sleep duration score 0 for a
sleep duration of at least seven hours; score 1 for a sleep duration of at
least six (but lower than seven) hours, score 2 for a sleep duration of at
least five (but lower than six) hours and score 3 for a sleep duration lower
than five hours.
Summing up all submeasures yields a total PSQI score between 0 and
21, with higher scores indicating lower sleep quality. A total PSQI score
greater than 5 is classified as poor quality sleep. The official Dutch
translation of the PSQI was requested from Dr. Buysse and a user
agreement was signed. The reader will notice that although the ‘Quality’ in
9
PSQI refers to a qualitative measure of sleep, some components have a
rather quantitative point of view. We will come back to this issue in Section
4 when we focus on the particularly explanatory power of the two PSQI
submeasures of sleep duration and overall perceived sleep quality.
In a third section of our survey we additionally let the students rate the
sleep quality of their parents (“How would you rate your mother’s/father’s
sleep quality?”) and their sleep quality during secondary education (“How
would you rate your overall sleep quality during secondary education?”) on
a five-point Likert scale (going from “very good” to “very bad”). In addition,
we asked whether or not they suffered from congenital medical problems
affecting their sleep quality. These variables are important for our
econometric analysis being predictors for sleep quality that cannot be
determined by university outcomes.
In a fourth section, the students had to fulfil the validated Depression
Anxiety Stress Scales (DASS-21) questionnaire. The Dutch translation of the
DASS-21 questionnaire was downloaded from
www.psy.unsw.edu.au/dass/. DASS-21 is a set of three self-report scales
designed to measure the negative emotional states of depression, anxiety
and stress. Each of the three DASS-21 scales contains 7 items that are to be
rated on a four-point Likert scale leading to a score between 0 and 21. The
higher the score on these scales, the higher the emotional problems.
10
Depression, anxiety and stress are regularly reported to be associated with
both sleep quality (see, e.g., Breslau et al., 1996; Eller et al., 2006) and
academic achievements (see, e.g., Andrews & Wilding, 2004; Eisenberg et
al., 2009). Hence the importance of including them as control variables in
our analysis.
In a last section, the students were asked whether they agreed with the
fact that their survey answers would be merged with their first-semester
exam marks by a third party. This clause was prepared in collaboration with
the Chairman of the Board of Examiners of the Faculty of Economics and
Business of Ghent University. In total, 382 (352) of the students in the
course of Economics (Introduction to Accountancy) gave us the permission
to use their survey answers together with their exam marks for our
research aims. From this population we retained, for reasons of
methodology (see Section 3.1) and homogeneity, all full-time first year
students in the Bachelor programs of (Business) Economics and
Commercial Sciences (329 and 307 students respectively).
In February 2013, the survey data were merged with the marks of the
students for their first semester courses, based on the student number the
participants of the survey mentioned in the last section of the
questionnaire. For reasons of privacy, this was done by a third party. Due
to the fact that some of the students did not bring their student card with
11
them and did not know their 8-digit student number by heart, the third
party could only merge survey data and exam marks for 328 (293) full-time
first year students in the Bachelor programs of (Business) Economics
(Commercial Sciences). As a result our merged dataset contains
information on 47.88% (45.92%) of the students enrolled in the course of
Economics (Introduction to Accountancy). All students in (Business)
Economics took the courses of Accounting, Economics, Human Sciences,
Law, Mathematics and Production Technology. For the students in
Commercial Sciences, marks were registered for the courses of
Accountancy, Commercial and Financial Transactions, English, French,
Information Technology, Law, Mathematics and Microeconomics. As
English, French and Information Technology could also be taken in the
second semester, not all students in our data got marks for these courses.
The data gathering process was reviewed and approved by the Ethical
Committee of the Faculty of Economics and Business Administration of
Ghent University.
2.2 Data Description
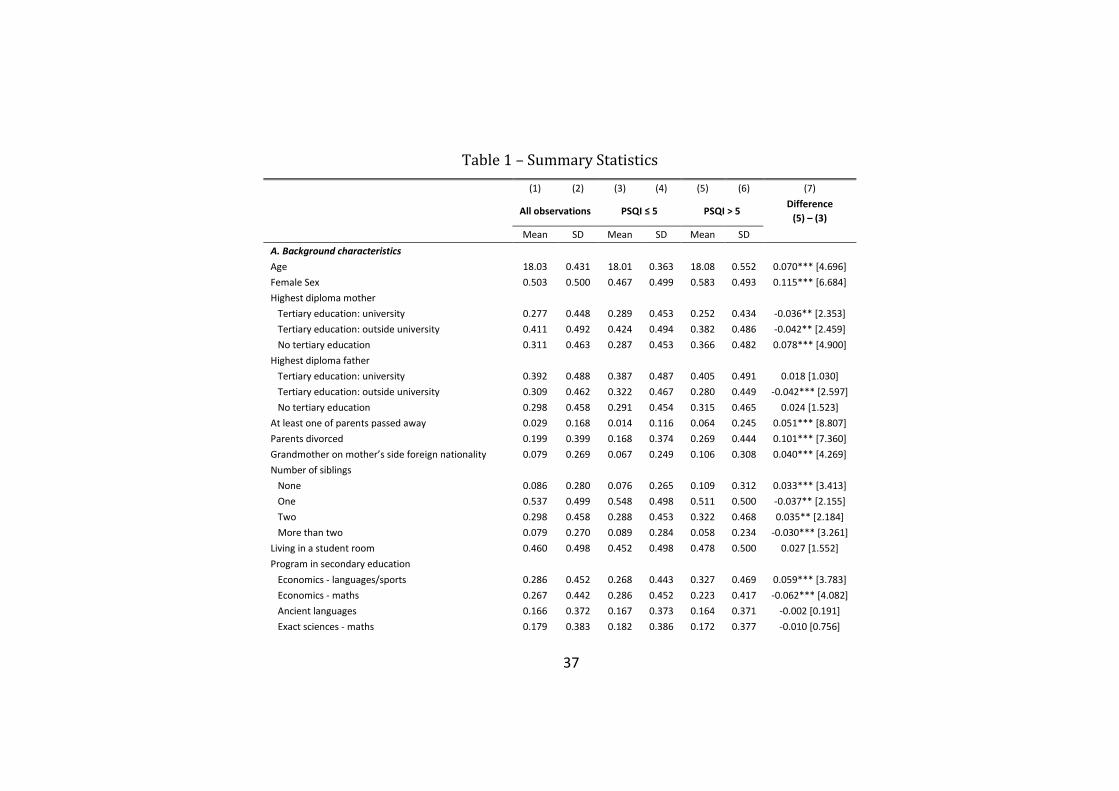
In Table 1 we report descriptive statistics for the variables used in the
econometric analysis. We separately report statistics on the total sample,
on the sample of good sleepers (PSQI ≤ 5) and on the sample of bad
12
sleepers (PSQI > 5). In total 69.57% of our subjects are good sleepers and
30.43% are bad sleepers. The latter percentage is very comparable with the
29% individuals with a PSQI score higher than 5 in the sample of German
medical students surveyed by Ahrberg et al. (2012).
TABLE 1 ABOUT HERE
Panel A provides the reader with statistics on the background
characteristics of our subjects. The subsample of bad sleepers comprises, in
line with Venn et al. (2013) and Jackson et al. (2014), more females and
individuals with a migration background. In addition, children of parents
who passed away or divorced and single individuals are overrepresented
among the group of bad sleepers. There are also more individuals in this
subsample with bad general and mental health characteristics. Therefore,
as mentioned before, controlling for these characteristics when identifying
the impact of sleep quality on study results is important. Panel B shows
statistics for our potential instruments for sleep quality. These statistics
provide already an indication for the relative strength of these potential
instruments. The sleep quality during secondary education index seems to
be the strongest predictor of poor quality of sleep. This index is 25.35%
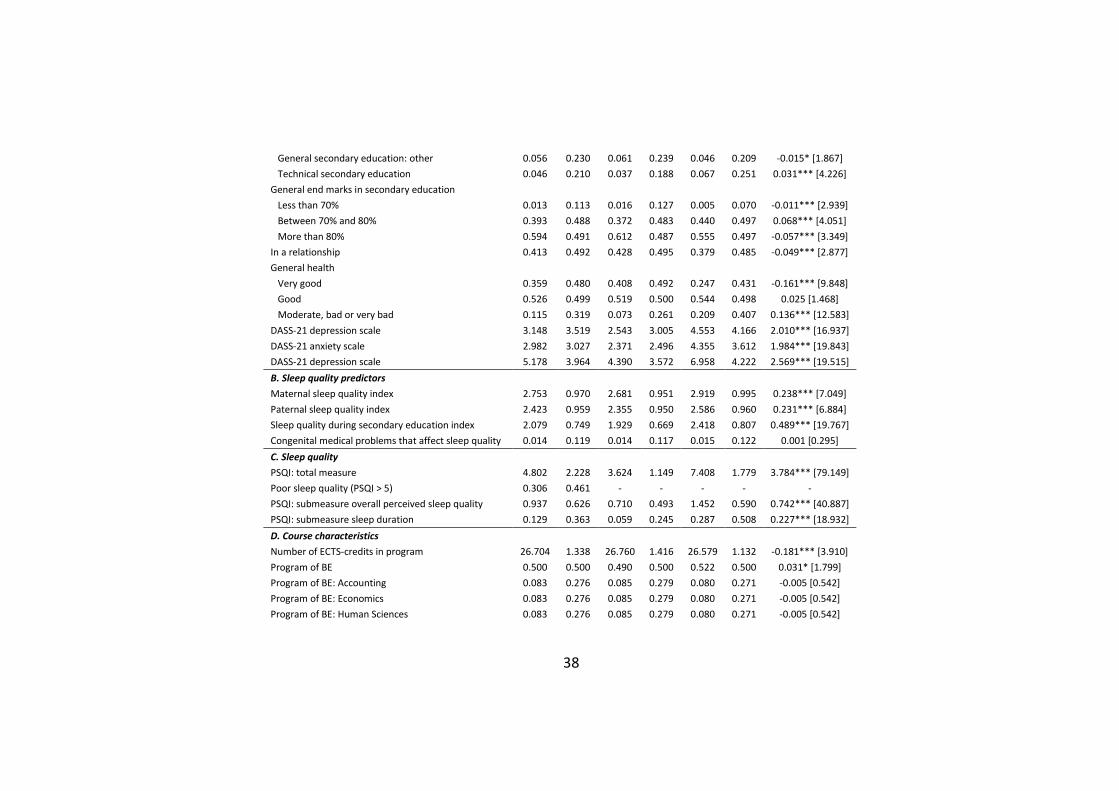
higher among bad sleepers than among good sleepers. Panel C shows that

13
the average PSQI score among the population is 4.80, which is quite close
to the threshold for poor sleep quality. Furthermore, not surprisingly, the
average scores for the PSQI submeasures of overall perceived sleep quality
and sleep duration are substantially higher among the bad sleepers than
among the good sleepers. For the course characteristics, presented in
Panel D, we observe few differences between both subsamples by sleep
quality.
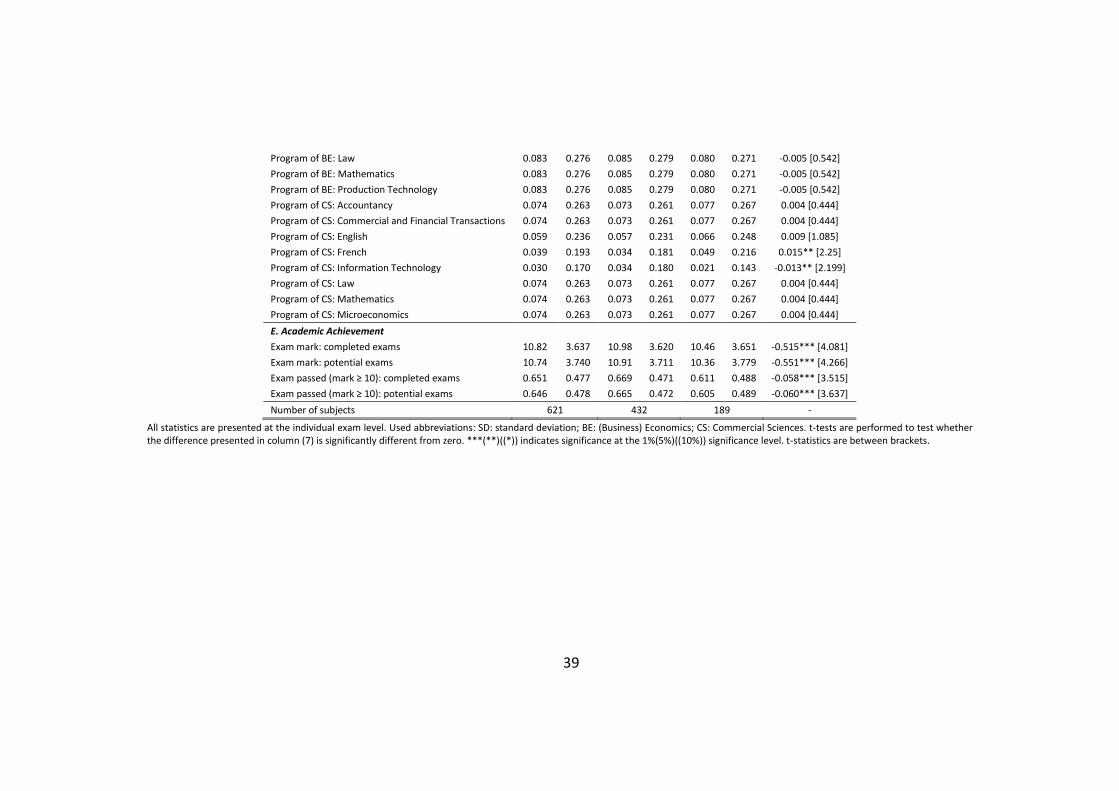
Panel E of Table 1 presents the outcome variables at the individual
exam level. We construct four outcomes concerning academic
achievement based on the individual exam marks at the end of the first
semester. The first outcome variable (“exam mark: completed exams”) is
equal to the exam mark (out of 20 points) for all exams made, leaving out
observations for which the students were not present at the exam and ipso
facto did not pass the exam. The second outcome variable (“exam mark:
potential exams”) is equal to the first one except that the exam mark when
students did not show up for the exam was recoded to 0, thus increasing
the number of observations slightly. We introduce this alternative outcome
variable as bad sleepers might be more likely to skip exams, due to reasons
of motivation and mood, than good sleepers. However, as in total only
0.74% of the potential exams were not taken, the difference between the
first and the second outcome variable is very limited. The third and fourth
14
variable are dummies indicating whether the student passed the exam or
not, i.e. whether the mark for the particular individual in the course is at
least 10 out of 20 points. The third variable (“exam passed (mark ≥ 10):
completed exams”) and fourth variable (“exam passed (mark ≥ 10):
potential exams”) again differ in whether exams for which the student did
not show up were left out or were given a 0 mark.
In line with our expectations, both the exam marks and the exam
passing chances are somewhat lower among the bad sleepers. A simple t-
test shows that this difference is significant at the 1% significance level for
all academic outcomes. However, this comparison does not take selection,
neither on the aforementioned observable characteristics nor on
unobservable characteristics (that may correlate with both academic
outcomes and sleep quality) into account. The instrumental variable
regression we apply in this research takes the selection on observable
characteristics into account and deals with potential problems of
endogeneity. Therefore, the analyses outlined in the next section lead to a
more founded answer to our research question.
15
3 Methods
3.1 Sleep Quality as an Endogenous Explanatory Variable
Sleep quality is potentially endogenous to academic achievement. Factors
and events that are unobservable to the researcher may influence both
academic achievement and contemporaneous sleep quality. Moreover, bad
academic achievement or indications of bad academic achievement in the
near future may induce sleepless nights. We aim at controlling for this
problem in three ways.
First, in our analyses we control for the large set of individual
background characteristics outlined in Panel A of Table 1. This set of
variables includes measures for health in general and psychological health,
adopting the DASS-21 scales, in particular. Thereby we aim at minimising
the number of factors influencing both sleep quality and academic
achievement that are omitted from the analysis and estimate the effect of
sleep quality within homogeneous subgroups of individuals.
Second, and as described in Section 2.1, we measured sleep quality by
means of the PSQI at the end of the first semester lectures at university,
i.e. just before the start of Christmas holidays, which are used by the
students to prepare the first semester exams, taking place immediately
16
after the Christmas holidays. This is a conscious choice as thereby sleep
quality is estimated before exam stress takes place. Hence, reversed
causality is not an issue in our study.
However, even if we control for a large set of individual background
characteristics and use PSQI scores estimated before the exam period,
sources of endogeneity might still be present. For instance, students may
experience learning difficulties that were not anticipated at the start of the
semester. Or, given the high failure rate during the first year, they may face
strong pressure to succeed. Another potential source of endogeneity is
random measurement error, because sleep quality during the month of
observation may deviate from the average sleep quality during the
semester. Although the medical literature indicates that sleep habits,
especially sleep duration, are persistent, even at young ages and even
across a 10-year period (Bruni et al., 2014; Kataria et al., 1987;
Klackenberg, 1982; Roberts et al., 2008; Thorleifsdottir et al., 2002),
unexpected circumstances may lead to an outlier month for at least some
individuals. To deal with these endogeneity problems, we assess the
impact of sleep quality on academic achievement with an instrumental
variable econometric approach.
Potential instruments are, as presented in Panel B of Table 1, self-
reported maternal sleep quality, paternal sleep quality, sleep quality during
17
secondary education and a dummy indicating (congenital) medical
problems that affect sleep quality. However, most of these variables
appear to be weak instruments. Table B.1 (in the Online Appendix [INSERT
LINK TO ONLINE APPENDIX]) shows that the correlation rates between the
PSQI measures (the submeasure for sleep duration in particular) on the
one hand and all potential arguments except sleep quality during
secondary education on the other hand are rather low. We also
constructed various variables combining the reported maternal and
paternal sleep quality but this hardly affected the low magnitude of the
correlation rates. Therefore, in what follows, we will only use the sleep
quality during secondary education index as an instrument for all PSQI
scores. As the end of secondary education lies only a few months in the
past, recall bias should not be substantial.
A key identifying assumption for the 2SLS estimator is that the chosen
instrument may not be correlated with other determinants of the outcome
variable, i.e. the exam marks, that are not controlled for. However, it is
clear that sleep quality during secondary education may be (positively)
correlated with unobserved factors that do (positively) affect university
performance such as intrinsic motivation to succeed and to be healthy.
Therefore, without additionally controlling for individual background
characteristics, these unobserved factors could introduce an upward bias in
18
the 2SLS estimates of how sleep quality affects exam performance. In
addition, there may also be sources of downward bias as, e.g., having an
anxious or obsessive personality may result in worse sleep but better
academic performance. However, we believe these sources of bias should
be captured by the aforementioned additional controls outlined in Panel A
of Table 1. On the one hand, we directly control for general health and the
DASS-21 scales. On the other hand, other potential unobservables that
affect both our instrument and academic outcomes should in the first place
translate in higher or lower general end marks in secondary education, for
which we control.
3.2 Econometric Model
In order to answer our main research question, we regress variables
capturing individual academic achievement on PSQI measures at the
individual level, a set of individual-specific control variables and course
dummies. The variables we include in the different regressions are the
ones outlined in Panel E, Panel C, Panel A and Panel D of Table 1,
respectively.
The coefficients of interest can be estimated by means of ordinary least
squares (OLS). For the academic achievement outcome “exam passed”, this
boils down to the choice of estimating a linear probability model instead of
19
a discrete choice model. As we cluster standard errors at the subject level,
this linear probability model is robust to heteroskedasticity which is
important given the binary nature of the outcome variable. In addition, we
looked into the analogous results replacing the linear probability model
with a probit model. The estimated marginal effects for the probit model
were very similar to the OLS results.
However, for reasons outlined in Section 3.1, our main analyses adopts
two-stage least squares (2SLS) techniques. As mentioned before, we use
sleep quality during secondary education as an instrument for the PSQI-
variable. In all models, standard errors are clustered at the subject level.
4 Results
In this subsection, we discuss our empirical analyses. Table B.2, Table B.3,
Table B.4 and Table B.5 in the Online Appendix [INSERT LINK TO ONLINE
APPENDIX] present the results for basic regressions with as a dependent
variable the mark on completed exams, the marks on potential exams, the
indicator variable for passing completed exams and the indicator variable
for passing potential exams, respectively. Each table comprises the
estimation results for eight regression models labelled from (1) to (8).
20
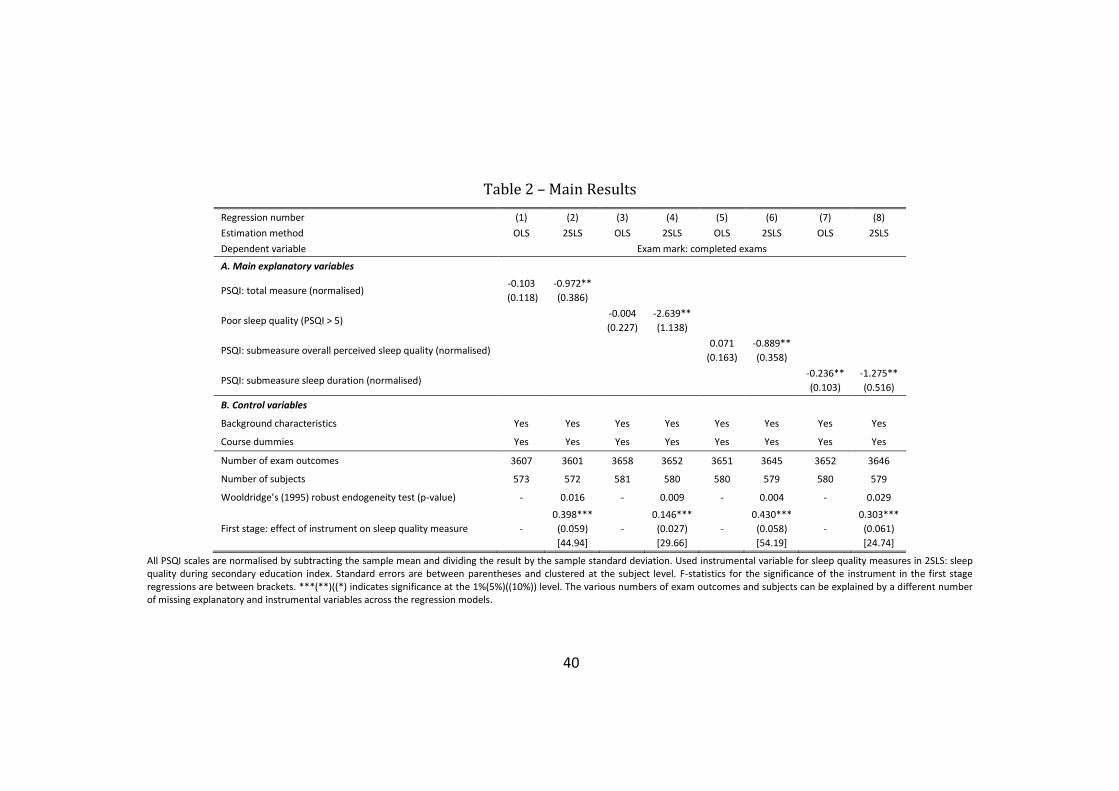
Table 2 summarises the most important results of Table B.2. In model
(1) and model (2) the main explanatory variable is the standardised total
PSQI score. In model (1) we get by means of OLS regression a coefficient
for this main explanatory variable which is not significantly different from
zero. However, this estimate might be biased due to the endogeneity
problem mentioned in Section 3.1. Wooldridge’s (1995) robust
endogeneity test (which is used given that we cluster standard errors at the
subject level), presented in column (2), rejects, indeed, exogeneity of the
total PSQI score with respect to the exam results. Therefore, model (2) is
our preferred model. The 2SLS estimate for the effect of the total PSQI
score on the exam mark is about -0.97 and significantly different from 0 at
the 5% significance level. This result can be interpreted as follows. An
increase of the total PSQI score with one standard deviation, i.e. with
about 2.23, leads to a decrease of the exam mark with about one point out
of 20 (or 4.85 percentage points).
TABLE 2 ABOUT HERE
A comparison of the OLS and 2SLS results presented in column (1) and
column (2) of Table 2 learns that, due to the endogeneity problem, OLS
estimates are biased upward. A potential omitted variable that could
21
explain this bias is, as mentioned in Section 3.1, the pressure a first-year
student may experience as a consequence of the high failure rate. If this
pressure is high, this may lead to higher marks on the one hand and lower
sleep quality (and thereby a higher PSQI score) on the other hand. Another
potential explanation for the downward bias of the OLS estimates is the
aforementioned problem of random measurement error in average sleep
quality during the semester.
We briefly discuss some secondary results reported in column (2) of
Table B.2. Note that a structural interpretation of some explanatory
variables is hazardous as they might be endogenous to exam outcomes.
The observed (and strong) effects of ethnicity, program in secondary
education and general end marks in secondary education, are generally
consistent with our expectations. Somewhat surprising is the, albeit weakly
significantly, negative effect of high educated fathers. This variable,
however, correlates to an important extent with other drivers of exam
marks such as the program in secondary education.
In model (3) and model (4) we regress the mark for each completed
exam on a dummy indicating bad sleepers. Again, exogeneity of this
dummy is rejected so that we focus on the results presented in column (4).
We find that the average exam mark is about 2.64 points lower among the
bad sleepers ceteris paribus, an estimate which is significantly different
22
from 0 at the 5% significance level.
As the total PSQI score is composed both by quantitative and
qualitative indicators of sleep quality, it is interesting to test which of both
dimensions affects exam results the most. Therefore, in model (5) and
model (6) we substitute the total PSQI score by the PSQI submeasure of
overall perceived sleep quality. In model (7) and model (8) we use the PSQI
submeasure of sleep duration. The 2SLS estimation results have, for both
submeasures, the expected negative sign and are significantly different
from 0. However, the magnitude of the latter submeasure is somewhat
higher. An increase of the overall perceived sleep quality with one standard
deviation lowers the exam mark with about 0.89 points (4.45 percentage
points) while an increase of the sleep duration index with one standard
deviation lowers the exam score with about 1.28 points (6.38 percentage
points). Interestingly, also the OLS estimate is significantly different from 0
for the latter submeasure. The reader might mention that also the test for
endogeneity is less significant for this measure (compared with the test
statistics in columns (2), (4) and (6)). This makes sense. While it is clear that
omitted variables like indications of bad exam results or internal and
external pressure may affect (overall perceived) sleep quality, this is less
clear for sleep duration.
This higher predictive power for sleep duration compared with overall

23
perceived sleep quality can be explained by the types of sleep that a
person goes through during a regular sleep period of about seven hours.
The first half of the sleep period is dominated by a deep sleep, the slow-
wave sleep (SWS). The second half of the sleep period is characterised by
longer periods of rapid-eye-time-sleep (REM), during which more brain
activity occurs. Individuals who score low in terms of sleep duration, will
typically get less REM-sleep. It is known, however, that this type of sleep is
important for storing knowledge in a more permanent way. In other words,
the REM-sleep leads to memory consolidation. Moreover, it associates new
information with existing knowledge (Diekelmann & Born, 2010; Smith &
Lapp, 1991). It goes without saying that the latter mechanisms are
important in the context of rehearsing, understanding, reproducing and
applying new academic knowledge in preparation of an exam.
Table B.3 presents comparable results for the same academic outcome,
i.e. exam scores, but now for all potential exams, recoding exams for which
students did not show up to 0. Unsurprisingly, given the small number of
potential exams that were not taken, this leads to results that are
completely similar to those of Table B.2.
Table B.4 shows the regression results when using the dummy
indicating exam success, i.e. indicating an exam mark of at least 10 points
out of 20. First, we get that increasing the total PSQI score with one

24
standard deviation lowers the probability of exam success with about 9.22
percentage points. This is a strong effect. However, our regression results
show that characteristics such as ethnicity, program in secondary
education and general end marks in secondary education are still better
predictors for exam success than sleep quality. Second, the effect of the
dummy indicating bad sleepers is even higher. At the same time, the
standard errors are quite high in regression model (4). Last, based on
columns (6) and (8) we find again suggestive evidence for sleep duration
being a better predictor for exam success than overall perceived sleep
quality. The results presented in Table B.5, based on all potential exams,
lead to the same conclusions.
Last, we conducted additional regressions with the mark on completed
exams as dependent variable and alternative specifications for the main
explanatory variables. The results of these analyses, which are in line with
our benchmark results, are discussed in the Online Appendix [INSERT LINK
TO ONLINE APPENDIX].
5 Conclusion
In this study we empirically tested the impact of sleep quality on
25
educational achievement at university. This research complements recent
contributions looking into the role of other health factors on university
achievements. Furthermore, our hypothesis of a positive relationship
between sleep quality and academic success was supported by former
research within medicine and biology indicating that night’s rest is essential
to helping maintain mood, motivation, memory and cognitive
performance.
In view of our research aims, we surveyed first-year university students
on their sleep quality, by means of the Pittsburgh Sleep Quality Index
(PSQI). In addition, these students were surveyed on general social
background and health characteristics. The resulting dataset was merged
with the marks they scored in their first examination period. To be able to
correctly identify the influence of sleep quality on academic achievement,
we used an instrumental variable econometric approach.
We found that an increase of one’s PSQI score with one standard
deviation, which implies a deterioration of his/her overall sleep quality,
leads to a decrease of the exam mark with 0.97 out of 20 points (or with
4.85 percentage points). Moreover, this result seems to be to a large
extent driven by aspects of sleep duration captured by the PSQI measure
(rather than by qualitative aspects).
26
From a policy perspective, our results seem to indicate that students
should be encouraged to not sleep (systematically) too little. While sleep
quality is a factor which is not fully under control of students, their average
sleep duration is to a large extend a choice. In this respect we follow
Mindell et al. (2011) that “sleep should be a standard component of school
curriculums, with an emphasis on the importance of the need for sleep, the
impact of sleep loss, awareness of sleep problems, and the basics of sleep
and sleep architecture.” In addition, higher education providers might be
incentivised to invest part of their resources for social facilities in
professional support for students with health – including sleep – problems.
With this paper, we aimed at taking an important step forward in the
causal interpretation of the relationship between sleep quality and
academic achievement. While we carefully discussed the validity of our
instrumental variable approach, complete exogeneity cannot be
guaranteed. Therefore, we believe that randomised controlled trials of
sleep interventions with students in tertiary education would be a fruitful
direction for further research. Last, we look forward to future research on
the impact of sleep quality and sleep duration on other dimensions of
academic achievement such as the length and success of doctoral studies.
27
References
Ahrberg, K., Dresler, M., Niedermaier, S., Steiger, A., & Genzel, L.
(2012). The interaction between sleep quality and academic performance.
Journal of Psychiatric Research, 46, 1618—1622.
AlDabal, L., & BaHammam, A. S. (2011). Metabolic, endocrine and
immune consequences of sleep deprivation. The Open Respiratory
Medicine Journal, 5, 31—43.
Alvaro, P.-A. (2014). Relation between sleep quality and attention in
students of business administration. Biological Rhythm Research, 45, 131—
142.
Andrews, B., & Wilding, J. M. (2004). The relation of depression and
anxiety to life-stress and achievement in students. British Journal of
Psychology, 95, 509—521.
Balsa, A. I., Giuliano, L. M., & French, T. (2011). The effects of alcohol
use on academic achievement in high school. Economics of Education
Review, 30, 1—15.
Beebe, D. W. (2011). Cognitive, Behavioral, and Functional
Consequences of Inadequate Sleep in Children and Adolescents. Pediatric
Clinics of North America, 58, 649—665.
28
Beebe, D. W., Rose, D., & Amin, R. (2010). Attention, learning, and
arousal of experimentally sleep-restricted adolescents in a simulated
classroom. Journal of Adolescent Health, 47, 523—525.
Bharadwaj, P., Loken, K. V., & Neilson, C. (2013). Early Life Health
Interventions and Academic Achievement. American Economic Review,
103, 1862—1891.
Black, S. E., Devereux, P. J., & Salvanes, K. J. (2005). Why the apple
doesn't fall far: Understanding intergenerational transmission of human
capital. American Economic Review, 95, 437—449.
Breslau, N., Roth, T., Rosenthal, L., & Andreski, P. (1996). Sleep
disturbance and psychiatric disorders: a longitudinal epidemiological study
of young adults. Biological Psychiatry, 39, 411—418.
Bruni, O., Baumgartner, E., Sette, S., Ancona, M., Caso, G., Di Cosimo,
M. E., Mannini, A., Ometto, M., Pasquini, A., Ulliana, A., & Ferri, R. (2014).
Longitudinal Study of Sleep Behavior in Normal Infants during the First Year
of Life. Journal of Clinical Sleep Medicine, 10, 1119—1127.
Bruni, O., Ferini-Strambi, L., Russo, P. M., Antignani, M., Innocenzi, M.,
Ottaviano, P., Valente, D., & Ottaviano, S. (2006). Sleep disturbances and
teacher ratings of school achievement and temperament in children. Sleep
Medicine, 7, 43—48.
29
Buckhalt, J. A., El-Sheikh, M., & Keller, P. (2007). Children’s Sleep and
Cognitive Functioning: Race and Socioeconomic Status as Moderators of
Effects. Child Development, 78, 213—231.
Buysse, D. J., Reynolds, C. F., Monk, T. H., Berman, S. R., & Kupfer, D. J.
(1989). The Pittsburgh Sleep Quality Index (PSQI): A new instrument for
psychiatric research and practice. Psychiatry Research, 28, 193—213.
Curcio, G., Ferrara, M., & De Gennaro, L. (2006). Sleep loss, learning
capacity and academic performance. Sleep Medicine Reviews, 10, 323—
337.
Dewald, J. F., Meijer, A. M., Oort, F. J., Kerkhof, G. A., & Bogels, S. M.
(2010). The influence of sleep quality, sleep duration and sleepiness on
school performance in children and adolescents: A meta-analytic review.
Sleep Medicine Reviews, 14, 179—189.
Diekelmann, S., & Born, J. (2010). The memory function of sleep. Nature
Reviews Neuroscience, 11, 114—126.
Ding, W., Lehrer, S. F., Rosenquist, J. N., & Audrain-McGovern, J. (2009).
The impact of poor health on academic performance: New evidence using
genetic markers. Journal of Health Economics, 28, 578—597.
Eisenberg, D., Golberstein, E., & Hunt, J. B. (2009). Mental health and
academic success in college. B.E. Journal of Economic Analysis & Policy, 9,
30
1—37.
Eliasson, A. H., Lettieri, C. J., & Eliasson, A. H. (2010). Early to bed, early
to rise! Sleep habits and academic performance in college students. Sleep
Breath, 14, 71—75.
Eller, T., Aluoja, A., Vasar, V., & Veldi, M. (2006). Symptoms of anxiety
and depression in Estonian medical students with sleep problems.
Depression and Anxiety, 23, 250—256.
Fallone, G., Acebo, C., Seifer, R., & Carskadon, M. A. (2005).
Experimental restriction of sleep opportunity in children: effects on teacher
ratings. Sleep, 28, 1561—1567.
Fletcher, J. M. (2014): The effects of childhood ADHD on adult labor
market outcomes. Health Economics, 23, 159-181.
Gais, S., & Born, J. (2004). Declarative memory consolidation:
mechanisms acting during human sleep. Learning and Memory, 11, 679—
685.
García-Gómez, P., van Kippersluis, H., O’Donnell, O., & van Doorslaer, E.
(2013). Long-Term and Spillover Effects of Health Shocks on Employment
and Income. Journal of Human Resources, 21, 873—909
Genzel, L., Ahrberg, K., Roselli, C., Niedermaier, S., Steiger, A., Dresler,
M., Roenneberg, T. (2013). Sleep timing is more important than sleep
31
length or quality for medical school performance. Chronobiology
International, 30, 766—771.
Gomes, A. A., Tavares, J., & de Azevedo, M. H. P. (2011). Sleep and
Academic Performance in Undergraduates: A Multi-measure, Multi-
predictor approach. Chronobiology International, 28, 786—801.
Hale, L., Hill, T. D., Friedman, E., Javier Nieto, F., Galvao, L. W.,
Engelman, C. D., Malecki, K. M. C., & Peppard, P. E. (2013). Perceived
neighborhood quality, sleep quality, and health status: Evidence from the
Survey of the Health of Wisconsin. Social Science & Medicine, 79, 16—22.
Jackson, C. L., Hu, F. B., Redline, S., Williams, D. R., Mattei, J., &
Kawachi, I. (2014). Racial/ethnic disparities in short sleep duration by
occupation: The contribution of immigrant status. Social Science &
Medicine, 118, 71—79.
Kataria, S., Swanson, M.S., & Trevathan, G.E. (1987). Persistence of
sleep disturbances in preschool children. Journal of Pediatrics, 110, 642—
646.
Kelly, Y., Kelly, J., & Sacker, A. (2013). Time for bed: associations with
cognitive performance in 7-year-old children: a longitudinal population-
based study. Journal of Epidemiology & Community Health, 67, 926—931.
Klackenberg, G. (1982). Sleep behaviour studied longitudinally: data
32
form 4–16 years on duration, night-awakening and bed sharing. Acta
Paediatrica Scandinavica, 71, 501—506.
Lemma, S., Berhane, Y., Worku, A., Gelaye, B., & Williams, M. A. (2014).
Good quality sleep is associated with better academic performance among
university students in Ethiopia. Sleep Breath, 18, 257—263.
Leos-Urbel, J., Schwartz, A. E., Weinstein, M., & Corcoran, S. P. (2013).
Not just for poor kids: The impact of universal free school breakfast on
meal participation and student outcomes. Economics of Education Review,
36, 88—107.
Louca, M., & Short, M. A. (2014). The effect of one night’s sleep
deprivation on adolescent neurobehavioral performance. Sleep, 37, 1799—
1807.
Meijer, A. M. (2008). Chronic sleep reduction, functioning at school and
school achievement in preadolescents. Journal of Sleep Research, 17, 395—
405.
Meijer, A. M., Habekothé, H. T., & van den Wittenboer, G. L. H. (2000).
Time in bed, quality of sleep and school functioning of children. Journal of
Sleep Research, 9, 145—153.
Mindell, J. A., Owens, J., Alves, R., Bruni, O., Goh, Y. T., Hiscock, H.,
Kohyama, J., & Sadeh, A. (2011). Give children and adolescents the gift of a
33
good night’s sleep: A call to action. Sleep Medicine, 12, 203—204.
Perkinson-Gloor, N., Lemola, S., & Grob, A. (2013). Sleep duration,
positive attitude toward life, and academic achievement: The role of
daytime tiredness, behavioral persistence, and school start times. Journal
of Adolescence, 36, 311—318.
Pieterse, D. (Forthcoming): Childhood maltreatment and educational
outcomes: Evidence from South Africa. Health Economics. DOI:
10.1002/hec.3065.
Quach, J., Gold, L., Arnup, S., Sia, K.-L., Wake, M., & Hiscock, H. (2013).
Sleep well—be well study: improving school transition by improving child
sleep: a translational randomised trial. BMJ Open, 3, e004009.
Quach, J., Hiscock, H., Ukoumunne, O. C., & Wake, M. (2011). A Brief
Sleep Intervention Improves Outcomes in the School Entry Year: A
Randomized Controlled Trial. Pediatrics, 128, 692—701.
Randazzo, A. C., Muehlback, M. J., Schweitzer, P. K., & Walsh, J. K.
(1998). Cognitive function following acute sleep restriction in children ages
10–14. Sleep, 21, 861–868.
Roberts, R. E., Roberts, C. R., & Chan, W. (2008). Persistence and change
in symptoms of insomnia among adolescents. Sleep, 31, 177—184.
Sabia, J. J. (2007). The effect of body weight on adolescent academic
34
performance. Southern Economic Journal, 73, 871—900.
Sadeh, A., Gruber, R., & Raviv, A. (2003). The effects of sleep restriction
and extension on school-age children: what a difference an hour makes.
Child Development, 74, 444—455.
Shochat, T., Cohen-Zion, M., & Tzischinsky, O. (2014). Functional
consequences of inadequate sleep in adolescents: A systematic review.
Sleep Medicine Reviews, 18, 75—87.
Short, M. A., Gradisar, M., Lack, L. C., & Wright, H. R. (2013). The impact
of sleep on adolescent depressed mood, alertness and academic
performance. Journal of Adolescence, 36, 1025—1033.
Siegel, J. M. (2001). The REM sleep-memory consolidation hypothesis.
Science, 294, 1058—1063.
Smith, C., & Lapp, L. (1991). Increases in number of REMS and REM
density in humans following an intensive learning period. Journal of Sleep
Research & Sleep Medicine, 14, 325—330.
Stea, T. H., Knutsen, T., & Torstveit, M. K. (2014). Association between
short time in bed, health-risk behaviors and poor academic achievement
among Norwegian adolescents. Sleep Medicine, 15, 666—671.
Taras, H., & Potts-Datema, W. (2005). Sleep and Student Performance
at School. Journal of School Health, 75, 248—254.
35
Thorleifsdottir, B., Björnsson, J. K., Benediktsdottir, B., Gislason, T., &
Kristbjarnarson, H. (2002). Sleep and sleep habits from childhood to young
adulthood over a 10-year period. Journal of Psychosomatic Research, 53,
529—537.
Trockel, M. T., Barnes, M. D., Egget, D. L. (2000). Health-Related
Variables and Academic Performance Among First-Year College Students:
Implications for Sleep and Other Behaviors. Journal of American College
Health, 49, 125—131.
Vandekerckhove, M., & Cluydts, R. (2010). The emotional brain and
sleep: An intimate relationship. Sleep Medicine Reviews, 14, 219—226.
Vardardottir, A. (2013). Peer effects and academic achievement: a
regression discontinuity approach. Economics of Education Review, 36,
108—121.
Venn, S., Meadows, R., & Arber, S. (2013). Gender differences in
approaches to self-management of poor sleep in later life. Social Science &
Medicine, 79, 117—123.
Walker, M. P., Stickgold, R. (2004): Sleep-dependent learning review
and memory consolidation. Neuron, 44, 121-133.
Wong, M. L., Lau, E. Y. Y., Wan, J. H. Y., Cheung, S. F., Hui, C. H., & Mok,
D. S. Y. (2012). The interplay between sleep and mood in predicting

36
academic functioning, physical health and psychological health: A
longitudinal study. Journal of Psychosomatic Research, 74, 271—277.
Wooldridge, J. M. (1995). Score diagnostics for linear models estimated
by two stage least squares. In: Maddala, G. S., Phillips, P. C. B., &
Srinivasan, T. N. (Eds.) Advances in Econometrics and Quantitative
Economics: Essays in Honor of Professor C. R. Rao. Oxford: Blackwell.
37
Table 1 – Summary Statistics
(1) (2) (3) (4) (5) (6) (7)
All observations PSQI ≤ 5 PSQI > 5 Difference
(5) – (3)
Mean SD Mean SD Mean SD
A. Background characteristics
Age 18.03 0.431 18.01 0.363 18.08 0.552 0.070*** [4.696]
Female Sex 0.503 0.500 0.467 0.499 0.583 0.493 0.115*** [6.684]
Highest diploma mother
Tertiary education: university 0.277 0.448 0.289 0.453 0.252 0.434 -0.036** [2.353]
Tertiary education: outside university 0.411 0.492 0.424 0.494 0.382 0.486 -0.042** [2.459]
No tertiary education 0.311 0.463 0.287 0.453 0.366 0.482 0.078*** [4.900]
Highest diploma father
Tertiary education: university 0.392 0.488 0.387 0.487 0.405 0.491 0.018 [1.030]
Tertiary education: outside university 0.309 0.462 0.322 0.467 0.280 0.449 -0.042*** [2.597]
No tertiary education 0.298 0.458 0.291 0.454 0.315 0.465 0.024 [1.523]
At least one of parents passed away 0.029 0.168 0.014 0.116 0.064 0.245 0.051*** [8.807]
Parents divorced 0.199 0.399 0.168 0.374 0.269 0.444 0.101*** [7.360]
Grandmother on mother’s side foreign nationality 0.079 0.269 0.067 0.249 0.106 0.308 0.040*** [4.269]
Number of siblings
None 0.086 0.280 0.076 0.265 0.109 0.312 0.033*** [3.413]
One 0.537 0.499 0.548 0.498 0.511 0.500 -0.037** [2.155]
Two 0.298 0.458 0.288 0.453 0.322 0.468 0.035** [2.184]
More than two 0.079 0.270 0.089 0.284 0.058 0.234 -0.030*** [3.261]
Living in a student room 0.460 0.498 0.452 0.498 0.478 0.500 0.027 [1.552]
Program in secondary education
Economics - languages/sports 0.286 0.452 0.268 0.443 0.327 0.469 0.059*** [3.783]
Economics - maths 0.267 0.442 0.286 0.452 0.223 0.417 -0.062*** [4.082]
Ancient languages 0.166 0.372 0.167 0.373 0.164 0.371 -0.002 [0.191]
Exact sciences - maths 0.179 0.383 0.182 0.386 0.172 0.377 -0.010 [0.756]
38
General secondary education: other 0.056 0.230 0.061 0.239 0.046 0.209 -0.015* [1.867]
Technical secondary education 0.046 0.210 0.037 0.188 0.067 0.251 0.031*** [4.226]
General end marks in secondary education
Less than 70% 0.013 0.113 0.016 0.127 0.005 0.070 -0.011*** [2.939]
Between 70% and 80% 0.393 0.488 0.372 0.483 0.440 0.497 0.068*** [4.051]
More than 80% 0.594 0.491 0.612 0.487 0.555 0.497 -0.057*** [3.349]
In a relationship 0.413 0.492 0.428 0.495 0.379 0.485 -0.049*** [2.877]
General health
Very good 0.359 0.480 0.408 0.492 0.247 0.431 -0.161*** [9.848]
Good 0.526 0.499 0.519 0.500 0.544 0.498 0.025 [1.468]
Moderate, bad or very bad 0.115 0.319 0.073 0.261 0.209 0.407 0.136*** [12.583]
DASS-21 depression scale 3.148 3.519 2.543 3.005 4.553 4.166 2.010*** [16.937]
DASS-21 anxiety scale 2.982 3.027 2.371 2.496 4.355 3.612 1.984*** [19.843]
DASS-21 depression scale 5.178 3.964 4.390 3.572 6.958 4.222 2.569*** [19.515]
B. Sleep quality predictors
Maternal sleep quality index 2.753 0.970 2.681 0.951 2.919 0.995 0.238*** [7.049]
Paternal sleep quality index 2.423 0.959 2.355 0.950 2.586 0.960 0.231*** [6.884]
Sleep quality during secondary education index 2.079 0.749 1.929 0.669 2.418 0.807 0.489*** [19.767]
Congenital medical problems that affect sleep quality 0.014 0.119 0.014 0.117 0.015 0.122 0.001 [0.295]
C. Sleep quality
PSQI: total measure 4.802 2.228 3.624 1.149 7.408 1.779 3.784*** [79.149]
Poor sleep quality (PSQI > 5) 0.306 0.461 - - - - -
PSQI: submeasure overall perceived sleep quality 0.937 0.626 0.710 0.493 1.452 0.590 0.742*** [40.887]
PSQI: submeasure sleep duration 0.129 0.363 0.059 0.245 0.287 0.508 0.227*** [18.932]
D. Course characteristics
Number of ECTS-credits in program 26.704 1.338 26.760 1.416 26.579 1.132 -0.181*** [3.910]
Program of BE 0.500 0.500 0.490 0.500 0.522 0.500 0.031* [1.799]
Program of BE: Accounting 0.083 0.276 0.085 0.279 0.080 0.271 -0.005 [0.542]
Program of BE: Economics 0.083 0.276 0.085 0.279 0.080 0.271 -0.005 [0.542]
Program of BE: Human Sciences 0.083 0.276 0.085 0.279 0.080 0.271 -0.005 [0.542]
39
Program of BE: Law 0.083 0.276 0.085 0.279 0.080 0.271 -0.005 [0.542]
Program of BE: Mathematics 0.083 0.276 0.085 0.279 0.080 0.271 -0.005 [0.542]
Program of BE: Production Technology 0.083 0.276 0.085 0.279 0.080 0.271 -0.005 [0.542]
Program of CS: Accountancy 0.074 0.263 0.073 0.261 0.077 0.267 0.004 [0.444]
Program of CS: Commercial and Financial Transactions 0.074 0.263 0.073 0.261 0.077 0.267 0.004 [0.444]
Program of CS: English 0.059 0.236 0.057 0.231 0.066 0.248 0.009 [1.085]
Program of CS: French 0.039 0.193 0.034 0.181 0.049 0.216 0.015** [2.25]
Program of CS: Information Technology 0.030 0.170 0.034 0.180 0.021 0.143 -0.013** [2.199]
Program of CS: Law 0.074 0.263 0.073 0.261 0.077 0.267 0.004 [0.444]
Program of CS: Mathematics 0.074 0.263 0.073 0.261 0.077 0.267 0.004 [0.444]
Program of CS: Microeconomics 0.074 0.263 0.073 0.261 0.077 0.267 0.004 [0.444]
E. Academic Achievement
Exam mark: completed exams 10.82 3.637 10.98 3.620 10.46 3.651 -0.515*** [4.081]
Exam mark: potential exams 10.74 3.740 10.91 3.711 10.36 3.779 -0.551*** [4.266]
Exam passed (mark ≥ 10): completed exams 0.651 0.477 0.669 0.471 0.611 0.488 -0.058*** [3.515]
Exam passed (mark ≥ 10): potential exams 0.646 0.478 0.665 0.472 0.605 0.489 -0.060*** [3.637]
Number of subjects 621 432 189 -
All statistics are presented at the individual exam level. Used abbreviations: SD: standard deviation; BE: (Business) Economics; CS: Commercial Sciences. t-tests are performed to test whether the difference presented in column (7) is significantly different from zero. ***(**)((*)) indicates significance at the 1%(5%)((10%)) significance level. t-statistics are between brackets.
40
Table 2 – Main Results
Regression number (1) (2) (3) (4) (5) (6) (7) (8)
Estimation method OLS 2SLS OLS 2SLS OLS 2SLS OLS 2SLS
Dependent variable Exam mark: completed exams
A. Main explanatory variables
PSQI: total measure (normalised) -0.103
(0.118)
-0.972**
(0.386)
Poor sleep quality (PSQI > 5) -0.004
(0.227)
-2.639**
(1.138)
PSQI: submeasure overall perceived sleep quality (normalised) 0.071
(0.163)
-0.889**
(0.358)
PSQI: submeasure sleep duration (normalised) -0.236**
(0.103)
-1.275**
(0.516)
B. Control variables
Background characteristics Yes Yes Yes Yes Yes Yes Yes Yes
Course dummies Yes Yes Yes Yes Yes Yes Yes Yes
Number of exam outcomes 3607 3601 3658 3652 3651 3645 3652 3646
Number of subjects 573 572 581 580 580 579 580 579
Wooldridge’s (1995) robust endogeneity test (p-value) - 0.016 - 0.009 - 0.004 - 0.029
First stage: effect of instrument on sleep quality measure -
0.398***
(0.059)
[44.94]
-
0.146***
(0.027)
[29.66]
-
0.430***
(0.058)
[54.19]
-
0.303***
(0.061)
[24.74]
All PSQI scales are normalised by subtracting the sample mean and dividing the result by the sample standard deviation. Used instrumental variable for sleep quality measures in 2SLS: sleep quality during secondary education index. Standard errors are between parentheses and clustered at the subject level. F-statistics for the significance of the instrument in the first stage regressions are between brackets. ***(**)((*) indicates significance at the 1%(5%)((10%)) level. The various numbers of exam outcomes and subjects can be explained by a different number of missing explanatory and instrumental variables across the regression models.