mit global change outlook
TRANSCRIPT

MIT Global Change Outlook
WebinarJune 16, 2021
Lead Authors: Sergey Paltsev and Adam SchlosserCo-Authors: Henry Chen, Xiang Gao, Angelo Gurgel, Henry Jacoby, Jennifer Morris, Ronald Prinn,
Andrei Sokolov and Kenneth StrzepekContributors: Noelle Selin, Richard Schmalensee and Lucy Young
Design and Editing: Jamie Bartholomay, Mark Dwortzan, Jennifer Morris, Anne Slinn
http://globalchange.mit.edu/
The Outlook
2
Policy
Technology
Economy
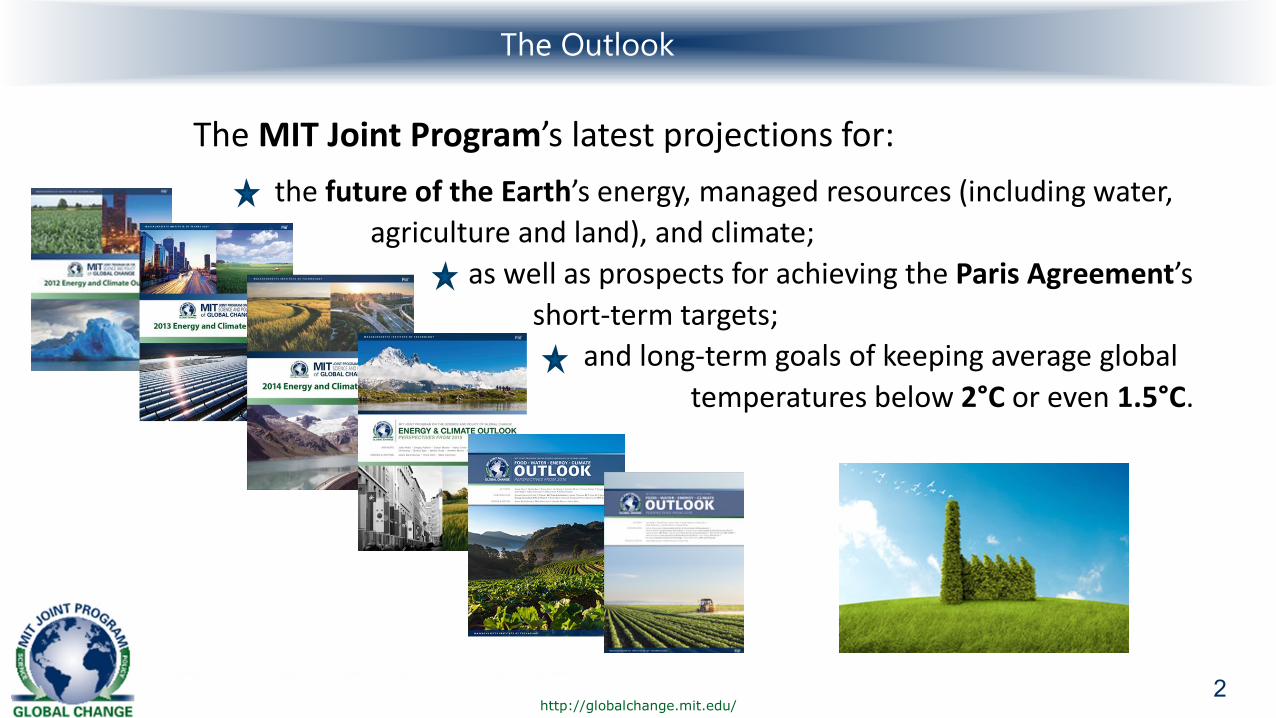
The MIT Joint Program’s latest projections for: the future of the Earth’s energy, managed resources (including water,
agriculture and land), and climate;as well as prospects for achieving the Paris Agreement’s
short-term targets;and long-term goals of keeping average global
temperatures below 2°C or even 1.5°C.
http://globalchange.mit.edu/
What’s new in the 2021 Outlook?
3
Policy
Technology
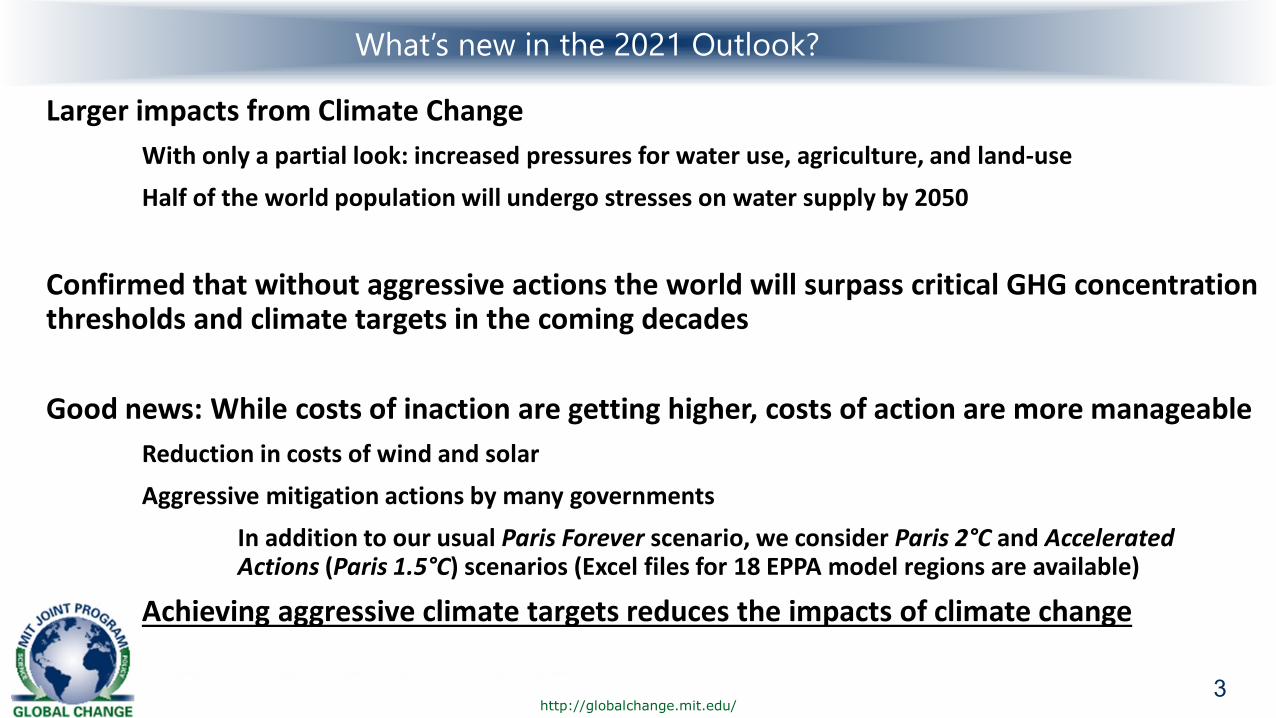
Larger impacts from Climate ChangeWith only a partial look: increased pressures for water use, agriculture, and land-use
Half of the world population will undergo stresses on water supply by 2050
Confirmed that without aggressive actions the world will surpass critical GHG concentration thresholds and climate targets in the coming decades
Good news: While costs of inaction are getting higher, costs of action are more manageableReduction in costs of wind and solar
Aggressive mitigation actions by many governments In addition to our usual Paris Forever scenario, we consider Paris 2°C and Accelerated Actions (Paris 1.5°C) scenarios (Excel files for 18 EPPA model regions are available)
Achieving aggressive climate targets reduces the impacts of climate change

http://globalchange.mit.edu/
Invitation: Explore the Outlook Results
4
Policy
Technology

http://globalchange.mit.edu/
Scenarios
5
Policy
Technology
Accelerated Actions = Accelerated Paris

http://globalchange.mit.edu/
New Announcements for 2030 from April 22, 2021
6
Accelerated Actions = Accelerated Paris
USA: 50-52% (old target: 26-28% in 2025) relative to 2005
Canada: 40-45% (old target: 30%) relative to 2005
Japan: 46% (old target: 26%) relative to 2013
Korea: later in the year (old target: 24.4%) relative to 2017
China: starts reducing coal production from 2026

http://globalchange.mit.edu/
Global GHG Emissions
7

http://globalchange.mit.edu/
Greenhouse Gamble
8
Which wheel would you rather spin?
http://globalchange.mit.edu/
Regional Groups
9
Policy
Technology
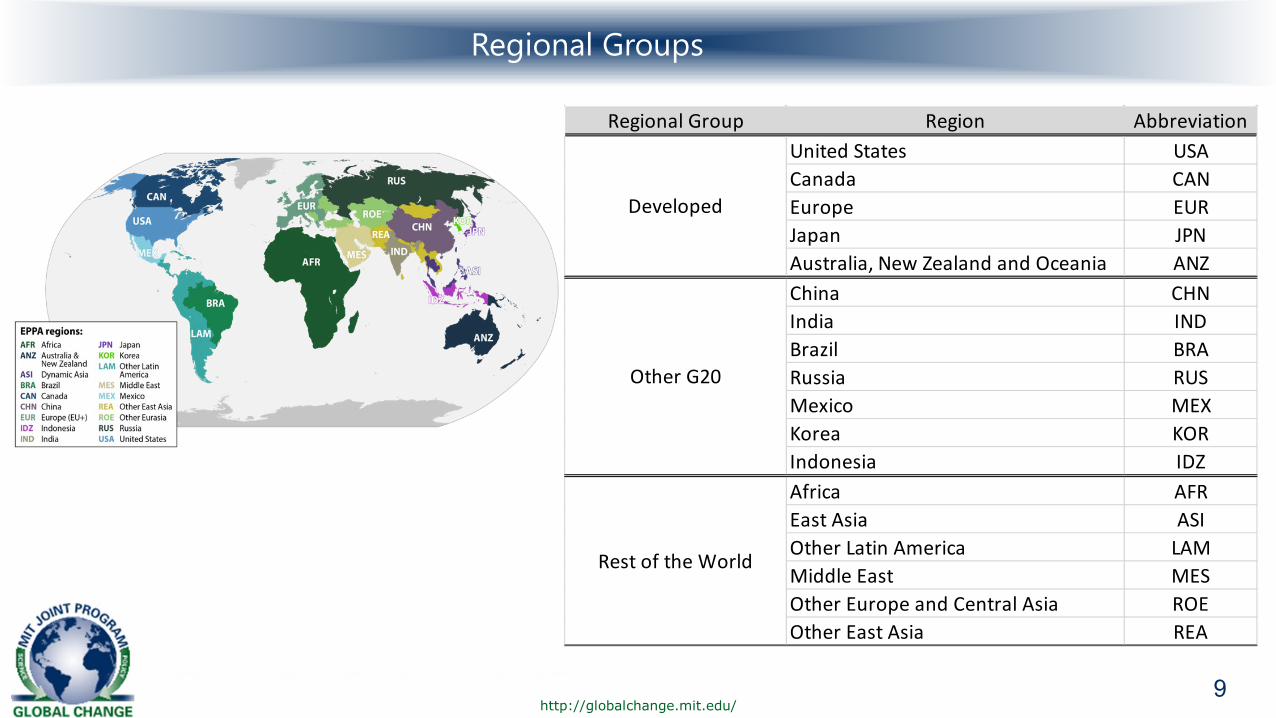
Regional Group Region AbbreviationUnited States USACanada CANEurope EURJapan JPNAustralia, New Zealand and Oceania ANZChina CHNIndia INDBrazil BRARussia RUSMexico MEXKorea KORIndonesia IDZAfrica AFREast Asia ASIOther Latin America LAMMiddle East MESOther Europe and Central Asia ROEOther East Asia REA
Developed
Other G20
Rest of the World

http://globalchange.mit.edu/
Global Drivers
10
Global population grows from 7.8 billion people in 2020 to 9.7 billion in 2050, and to 10.9 billion in 2100
In contrast to population, most of the global economic value in 2020 was in the Developed region
Despite the higher economic growth in non-Developed region, their shares of global GDP catch up with the Developed region only by the end of the century.

http://globalchange.mit.edu/
Impact of Covid-19
11
From 2020 to 2050, Covid-19 impacts on energy use and renewable energy deployment are relatively modest (2-4% reduction in energy use each year and virtually the same pathway for renewables relative to the non-Covid trajectory).
For the years 2025-2050, we project that global GDP will remain about 3-4% below what it would be in a world without Covid.

http://globalchange.mit.edu/
Global Primary Energy
12
Global primary energy use in the Paris Forever scenario grows to about 770 exajoules (EJ) by 2050, up by 31% from about 590 EJ in 2020. The share of fossil fuels drops from the current 80% to 70% in 2050. Wind and solar – 6-fold increase.
In the Paris 2°C scenario, the fossil fuel share drops to about 50% in 2050, wind and solar energy grow almost 9 times from 2020 to 2050.
In the Accelerated Actions scenario, the fossil fuel share drops to about 34%, wind and solar energy grow almost 13 times from 2020 to 2050.

http://globalchange.mit.edu/
Global Electricity Production
13
In the Paris Forever scenario, global electricity production (and use) grows by 67% from 2020 to 2050. In comparison to primary energy growth of 31% over the same period, electricity grows about twice as fast, resulting in a continuing electrification of the global economy.
Electricity generation from renewable sources becomes a dominant source of power by 2050 in all scenarios, providing 70-80% of global power generation by midcentury in the climate stabilization scenarios

http://globalchange.mit.edu/
Global Electric Vehicle Fleet
14
From about 10 million EVs in 2020, EV stock in the Paris Forever scenario reaches 100 million EVs in 2030, almost 300 million in 2040 and nearly 650 million in 2050.
For a 67% electrification of the global LDV stock in 2050, global EV sales would exceed 30 million in 2030, 60 million in 2040, and 100 million in 2050.

http://globalchange.mit.edu/
Global Electric Car Sales in 2019-2020
15
In the first half of 2020, global EV sales were down by 15% relative to their corresponding 2019 levels due to lockdowns and shutdowns of EV manufacturing facilities in several countries.
Overall, it is estimated that in 2020 about 3 million EVs sold, which is 40% more than in 2019 despite the pandemic.
Europe: 1.4 million EVs sold in 2020 (5% imported from China).
http://globalchange.mit.edu/
Fossil Fuels: Stranded Value
16
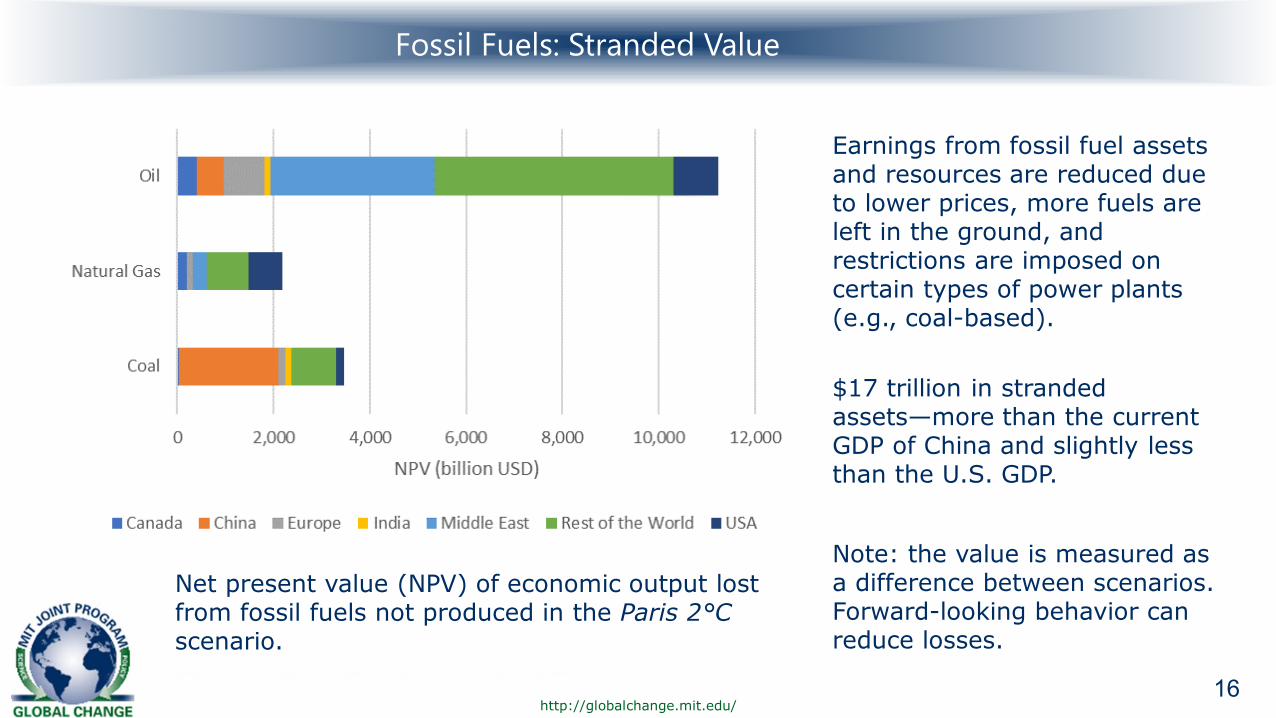
Net present value (NPV) of economic output lost from fossil fuels not produced in the Paris 2°Cscenario.
Earnings from fossil fuel assets and resources are reduced due to lower prices, more fuels are left in the ground, and restrictions are imposed on certain types of power plants (e.g., coal-based).
$17 trillion in stranded assets—more than the current GDP of China and slightly less than the U.S. GDP.
Note: the value is measured as a difference between scenarios. Forward-looking behavior can reduce losses.

http://globalchange.mit.edu/
Global Food Production
17
Under the Paris Forever scenario, overall food production increases by 90% from 2020 to 2050, crop production by 70% and livestock production by 81%. Livestock grows faster than crop due to higher shares of protein-rich food in diets when income rises.
Greater agricultural yields will prevent high increases in prices.
Global land-use projections from 2020 to 2050 are quite stable. Natural forest areas decrease by 1% and natural grasslands by 3%.