mitacs comprehensive evaluation of nh3 production and utilization options for clean energy...
TRANSCRIPT
Mitacs Accelerate Project
Final Report
Application Ref.: IT08015
Comprehensive Evaluation of NH3 Production and Utilization
Options for Clean Energy Applications
Period: September 2016 - March 2017
Submission Date: March 25, 2017
Principal Investigator:
Prof. Dr. Ibrahim Dincer
Intern:
Yusuf Bicer
Partner Organization:
Hydrofuel®TM Inc.
2
TABLE OF CONTENTS
LIST OF FIGURES ........................................................................................................................ 4 LIST OF TABLES .......................................................................................................................... 9 ACKNOWLEDGEMENT ............................................................................................................ 11
NOMENCLATURE ..................................................................................................................... 12 SUMMARY .................................................................................................................................. 14 CHAPTER 1: QUICK FACTS ABOUT AMMONIA ........................................................... 15
1. What are the uses of ammonia? ......................................................................................... 16 2. Is ammonia really a fuel? ................................................................................................... 17
3. Is ammonia a suitable fuel for transportation sector? ........................................................ 17 4. How can ammonia be used in transportation? ................................................................... 17 5. Is ammonia a clean fuel?.................................................................................................... 17 6. How much greenhouse gas can I save if I drive an ammonia car? .................................... 18
7. Is ammonia a cost effective fuel? ....................................................................................... 18 8. What is the process of ammonia production? .................................................................... 20
9. What is the source of ammonia and is it cleaner than other fuels? .................................... 20 CHAPTER 2: ELECTROCHEMICAL SYNTHESIS OF AMMONIA ................................. 23
1. Introduction ........................................................................................................................ 23 2. Experimental Investigation and Analysis .......................................................................... 24 3. Results and Discussion ...................................................................................................... 26
4. Concluding Remarks .......................................................................................................... 30 CHAPTER 3: ELECTROCHEMICAL AMMONIA SYNTHESIS FROM
PHOTOELECTROCHEMICAL HYDROGEN ........................................................................... 31 1. Introduction ........................................................................................................................ 31 2. Life Cycle Assessment of Photoelectrochemical Hydrogen Based
Electrochemical Ammonia Synthesis ....................................................................................... 31
3. LCA Uncertainty Analyses Results ................................................................................... 36 4. Experimental Investigation and Analysis .......................................................................... 38 5. Results and Discussion ...................................................................................................... 39
6. Concluding Remarks .......................................................................................................... 43 CHAPTER 4: FROM HYDROCARBONS TO AMMONIA ................................................ 44
1. Natural Gas to Ammonia ................................................................................................... 44 2. Transport of Natural Gas or Ammonia .............................................................................. 48
3. Case Studies for LNG and Ammonia ................................................................................ 49 Case 1: Europe ...................................................................................................................... 50 Case 2: U.S............................................................................................................................ 52 Case 3: Middle East .............................................................................................................. 53
Case 4: Ontario, Canada ....................................................................................................... 55 4. Oil sand to Ammonia ......................................................................................................... 56 5. Concluding Remarks .......................................................................................................... 60
CHAPTER 5: AMMONIA IN MARITIME APPLICATIONS ............................................. 61 1. Ammonia production routes .............................................................................................. 61 2. Methodology ...................................................................................................................... 62 3. Life cycle phases ................................................................................................................ 63 4. Results and Discussion ...................................................................................................... 66 5. Concluding Remarks .......................................................................................................... 75
3
CHAPTER 6: AMMONIA IN AVIATION ........................................................................... 76
1. Methodology ...................................................................................................................... 77 2. Description of the Processes .............................................................................................. 79
Aircraft manufacturing.......................................................................................................... 79
Construction and maintenance of airport .............................................................................. 79 Operation of the aircraft ........................................................................................................ 79 Maintenance and operation of the airport ............................................................................. 82 Transportation via aircraft..................................................................................................... 82
3. Results and Discussion ...................................................................................................... 83
4. Concluding Remarks .......................................................................................................... 89 CHAPTER 7: AMMONIA IN ROAD TRANSPORTATION ............................................... 91
1. Life Cycle Assessment of Vehicles ................................................................................... 92 CHAPTER 8: ON-BOARD AMMONIA UTILIZATION ..................................................... 97
1. Life Cycle Assessment of On-Board Ammonia Cracking Vehicles .................................. 97 2. Ammonia Decomposition ................................................................................................ 100
3. On-Board Ammonia......................................................................................................... 101 4. On-Board Ammonia Electrolysis ..................................................................................... 104
5. Case Study for Ammonia Electrolysis Vehicle ............................................................... 105 6. Thermodynamic Analyses of On-Board Ammonia Electrolysis ..................................... 107
CHAPTER 9: ECONOMIC ANALYSES OF SOLAR ENERGY BASED
AMMONIA PRODUCTION ...................................................................................................... 113 CHAPTER 10: SCALE-UP ANALYSES FOR SOLAR ENERGY BASED
AMMONIA PRODUCTION ...................................................................................................... 120 7. Case Study for Ontario..................................................................................................... 127
CHAPTER 11: CONCLUDING REMARKS ........................................................................ 129
REFERENCES ........................................................................................................................... 130
4
LIST OF FIGURES
Figure 1 Ammonia utilization options in transportation sector .................................................... 18 Figure 2 Comparison of various vehicle fuels in terms of energy cost per gigajoule .................. 18 Figure 3 Comparison of driving cost for various fueled vehicles ................................................. 19
Figure 4 Abiotic depletion values during production of various fuels ......................................... 21 Figure 5 Ozone layer depletion during productions of various fuels ............................................ 21 Figure 6 Comparison of global warming potential of 1 MJ energy production from various
resources ....................................................................................................................................... 22 Figure 7 Nickel mesh electrodes in the reactor, molten salt in the reactor ................................... 25
Figure 8 Heating tape used around the alumina crucible and experimental setup with
flowmeters, temperature controller and tubing ............................................................................. 25 Figure 9 The experimental setup for the electrochemical ammonia synthesis in the fume
hood and solar light ....................................................................................................................... 27 Figure 10 The relationship between voltage and time during several experimental runs at
different applied currents and temperatures for electrochemical synthesis of NH3 using N2
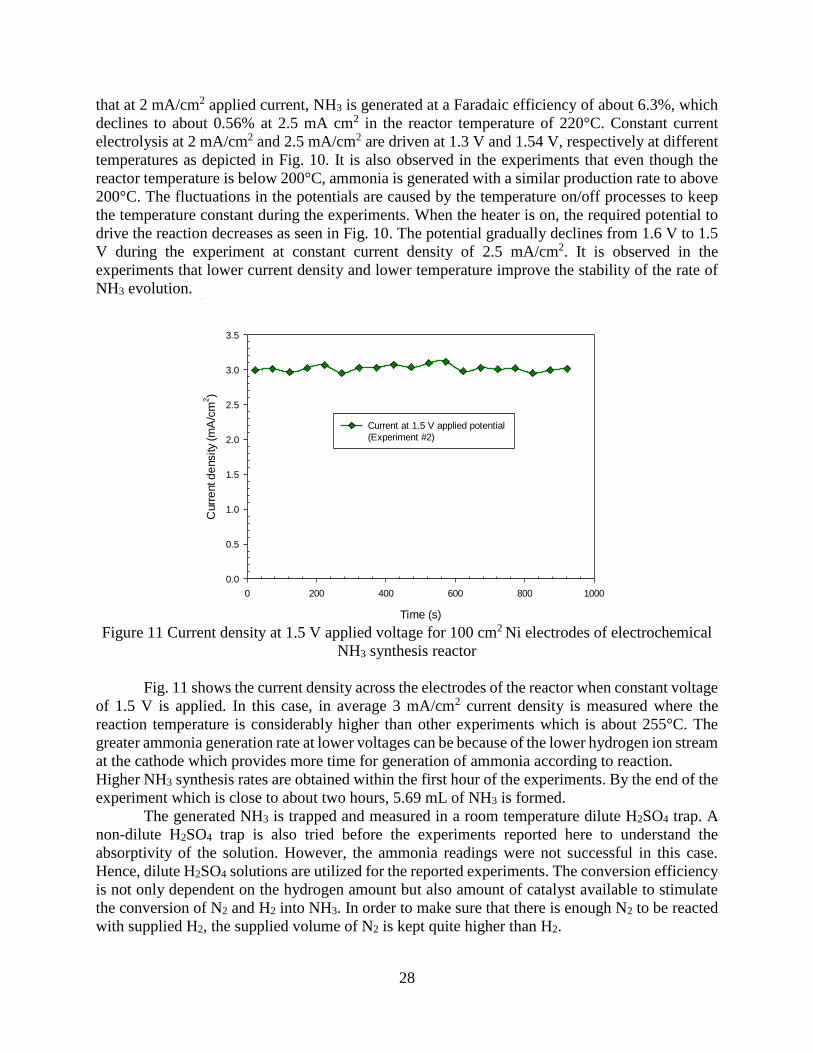
and H2 with nano-Fe3O4 in a molten salt hydroxide electrolyte ................................................... 27 Figure 11 Current density at 1.5 V applied voltage for 100 cm2 Ni electrodes of
electrochemical NH3 synthesis reactor ......................................................................................... 28
Figure 12 Applied potential-current density relations at 200°C for electrochemical NH3
formation using N2 and H2 with nano-Fe3O4 in a molten salt hydroxide electrolyte ................... 29
Figure 13 Change of electrochemical NH3 formation rates depending on the applied current
densities and reactor temperature using N2 and H2 with nano-Fe3O4 in a molten salt
hydroxide electrolyte .................................................................................................................... 30
Figure 14 The boundaries of the conducted LCA for PEC hydrogen production ........................ 31
Figure 15 The boundaries of the conducted LCA for electrochemical ammonia synthesis
process........................................................................................................................................... 32 Figure 16 The share of toxic substances for PEC (concentrated light) based electrochemical
ammonia synthesis ........................................................................................................................ 33 Figure 17 Contribution of various sub-processes to human toxicity potential of PEC
(concentrated light) based electrochemical ammonia synthesis ................................................... 33 Figure 18 The share of depleting abiotic sources for PEC (concentrated light) based
electrochemical ammonia synthesis .............................................................................................. 34
Figure 19 Contribution of various sub-processes to abiotic depletion potential of PEC
(concentrated light) based electrochemical ammonia synthesis ................................................... 34
Figure 20 The share of greenhouse gas emissions for PEC (concentrated light) based
electrochemical ammonia synthesis .............................................................................................. 35
Figure 21 Contribution of various sub-processes to global warming potential of PEC
(concentrated light) based electrochemical ammonia synthesis ................................................... 35 Figure 22 Probability distribution of global warming potential for PEC based (concentrated
light) electrochemical ammonia production method .................................................................... 36 Figure 23 Probability distribution of human toxicity potential for PEC based (concentrated
light) electrochemical ammonia production method .................................................................... 37 Figure 24 Probability distribution of abiotic depletion potential for PEC based
(concentrated light) electrochemical ammonia production method.............................................. 37 Figure 25 Uncertainty ranges of the selected impact categories for PEC based
(concentrated light) electrochemical ammonia production method.............................................. 38
5
Figure 26 Experimental setup for photoelectrochemical hydrogen production integrated to
ammonia synthesis ........................................................................................................................ 38 Figure 27 The experiments under concentrated sun light for photoelectrochemical
hydrogen production integrated to ammonia synthesis ................................................................ 39
Figure 28 Photoelectrochemical hydrogen production using concentrated light and solar
light splitting at 1.7 V applied potential........................................................................................ 40 Figure 29 Photoelectrochemical hydrogen production using concentrated light and solar
light splitting at 3 V applied potential during electrochemical ammonia synthesis ..................... 40 Figure 30 The relationship between voltage and time during several experimental runs at
different applied currents and temperatures for electrochemical synthesis of NH3 using N2
and H2 with nano-Fe3O4 in a molten salt hydroxide electrolyte ................................................... 41 Figure 31 Coulombic and energy efficiencies of two experimental runs for electrochemical
NH3 synthesis using N2 and H2 with nano-Fe3O4 in a molten salt hydroxide electrolyte. ........... 42
Figure 32 Applied potential-current density relations at 200°C and 180°C for
electrochemical NH3 formation using N2 and H2 with nano-Fe3O4 in a molten salt
hydroxide electrolyte .................................................................................................................... 42 Figure 33 Main routes for decomposition of methane to hydrogen and carbon (modified
from [44]) ...................................................................................................................................... 45 Figure 34 Schematic diagram of ammonia production from natural gas and alternative
utilization options.......................................................................................................................... 45
Figure 35 Illustration of ammonia and urea production from natural gas .................................... 45 Figure 36 Ozone depletion values during production of one kg of ammonia and natural gas
....................................................................................................................................................... 46 Figure 37 Acidification values of ammonia, natural gas and petrol during one kg fuel
production process ........................................................................................................................ 47
Figure 38 Comparison of cost of production for ammonia using various routes ......................... 47
Figure 39 Comparison of global warming potential of 1 MJ energy production from various
resources ....................................................................................................................................... 48 Figure 40 LNG transport processes .............................................................................................. 48
Figure 41 Illustration of an LNG tanker (adapted from [45]) ....................................................... 49 Figure 42 Cost contributions for natural gas based ammonia production plant (adapted from
[49])............................................................................................................................................... 50 Figure 43 Illustration of the Case 1 for Europe ............................................................................ 51
Figure 44 Contribution of sub-processes to total cost of LNG and ammonia for Case 1 in
Europe ........................................................................................................................................... 51 Figure 45 Illustration of the Case 2 for the U.S ............................................................................ 52 Figure 46 Contribution of sub-processes to total cost of LNG and ammonia for Case 2 in
the U.S........................................................................................................................................... 53 Figure 47 Illustration of the Case 3 for Middle East .................................................................... 54 Figure 48 Contribution of sub-processes to total cost of LNG and ammonia for Case 3 in
Middle East ................................................................................................................................... 54 Figure 49 Illustration of the Case 4 for Ontario ............................................................................ 55 Figure 50 Contribution of sub-processes to total cost of LNG and ammonia for Case 4 ............. 56 Figure 51 Schematic diagram of oil sand to ammonia plant ........................................................ 58 Figure 52 Acidification impact comparison of selected ammonia routes..................................... 58 Figure 53 Eutrophication impact comparison of selected ammonia routes .................................. 59
6
Figure 54 Ozone layer depletion impact comparison of selected ammonia routes ...................... 59
Figure 55 Comparison of 1 MJ electricity production and ammonia production ......................... 59 Figure 56 Well-to-haul life cycle phases of maritime transportation ........................................... 62 Figure 57 Marine sediment ecotoxicity values of transoceanic tanker and transoceanic
freight ship per tonne kilometer for ammonia and conventional heavy fuel oil ........................... 66 Figure 58 Process contributions to marine sediment ecotoxicity values of transoceanic
freight ship driven by dual fuel (50% ammonia from hydropower and 50% heavy fuel oil) ....... 67 Figure 59 Emissions causing marine sediment ecotoxicity for transoceanic tanker driven
by various fuels ............................................................................................................................. 67
Figure 60 Process contributions to marine sediment ecotoxicity values of transoceanic
freight ship fueled by sole ammonia from municipal waste ......................................................... 68 Figure 61 Process contributions to marine aquatic ecotoxicity values of transoceanic freight
ship fueled by sole ammonia from geothermal energy ................................................................. 68
Figure 62 Process contributions to marine aquatic ecotoxicity values of transoceanic freight
ship fueled by sole ammonia from biomass energy ...................................................................... 69
Figure 63 Process contributions to acidification values of transoceanic tanker fueled by
ammonia from biomass energy and heavy fuel oil ....................................................................... 69
Figure 64 Process contributions to stratospheric ozone layer depletion of transoceanic
freight ship by dual fuel (50% ammonia from municipal waste and 50% heavy fuel oil) ........... 70 Figure 65 Marine aquatic ecotoxicity values of transoceanic tanker and transoceanic freight
ship per tonne kilometer for ammonia and conventional heavy fuel oil....................................... 70 Figure 66 Global warming potential of transoceanic tanker and transoceanic freight ship
per tonne kilometer for ammonia and conventional heavy fuel oil .............................................. 71 Figure 67 Process contributions to global warming potentials transoceanic freight ship
driven by conventional heavy fuel oil ........................................................................................... 72
Figure 68 Acidification values of transoceanic tanker and transoceanic freight ship per
tonne kilometer for ammonia and conventional heavy fuel oil .................................................... 72 Figure 69 Abiotic depletion values of transoceanic tanker and transoceanic freight ship per
tonne kilometer for ammonia and conventional heavy fuel oil .................................................... 73
Figure 70 Process contributions to abiotic depletion values of transoceanic freight ship
driven by ammonia from wind energy .......................................................................................... 74
Figure 71 Abiotic substances causing depletion of abiotic resources for transoceanic tanker
driven by various fuels .................................................................................................................. 74
Figure 72 . Stratospheric ozone layer depletion values of transoceanic tanker and
transoceanic freight ship per tonne kilometer for ammonia and conventional heavy fuel oil
....................................................................................................................................................... 75 Figure 73 Comparisons of fuel mass and volume per unit energy (data from [66]) ..................... 77
Figure 74 Complete well-to-wake life cycle phases used in the study ......................................... 78 Figure 75 Land use in full life cycle of various fueled aircrafts per travelled tonne-km ............. 83 Figure 76 Global warming potential of various fueled aircrafts per travelled tonne-km ............. 84
Figure 77 Ozone layer depletion values of various fueled aircrafts per travelled tonne-km ........ 85 Figure 78 Abiotic depletion values of various fueled aircrafts per travelled tonne-km .............. 85 Figure 79 Human toxicity values of various fueled aircrafts per travelled tonne-km .................. 86 Figure 80 Total environmental and social cost of emissions for various fueled aircrafts from
conventional and renewable resources.......................................................................................... 86
7
Figure 81 Comparison of total environmental and social cost of emissions for renewable
based ammonia driven aircrafts and kerosene driven aircraft ...................................................... 87 Figure 82 Comparison of fuel costs during the operation of aircrafts for the given range ........... 88 Figure 83 Comparison of energy and exergy efficiencies of various fueled aircrafts ................. 89
Figure 84 Complete life cycle of vehicles including fuel/vehicle cycle. ...................................... 92 Figure 85 Life cycle comparison of global warming results for various vehicles ........................ 94 Figure 86 Life cycle comparison of human toxicity results for various vehicles from nuclear
energy and solar PV routes ........................................................................................................... 95 Figure 87 Life cycle comparison of global warming results for various vehicles from
nuclear energy and solar PV routes .............................................................................................. 95 Figure 88 Life cycle comparison abiotic depletion for various vehicles from nuclear energy
and solar PV routes ....................................................................................................................... 96 Figure 89 The complete process describing the production, storage and decomposition of
ammonia for hydrogen driven vehicle .......................................................................................... 98 Figure 90 Abiotic depletion results of on-board ammonia cracking vehicles from various
resources and gasoline vehicle ...................................................................................................... 99 Figure 91 Acidification depletion results of on-board ammonia cracking vehicles from
various resources and gasoline vehicle ......................................................................................... 99 Figure 92 Global warming results of on-board ammonia cracking vehicles from various
resources and gasoline vehicle ...................................................................................................... 99
Figure 93 Ozone layer depletion results of on-board ammonia cracking vehicles from
various resources and gasoline vehicle ....................................................................................... 100
Figure 94 Ammonia fuel processing system (adapted from [72]) .............................................. 102 Figure 95 Energy and exergy efficiencies of the ammonia electrolysis cell unit ....................... 109 Figure 96 Effect of changing AEC current density on electrolysis voltage and overall AEC
energy and exergy efficiencies .................................................................................................... 109
Figure 97 Effect of changing AEC current density on AEC exergy destruction, ammonia
amount required for electrolysis and hydrogen produced by AEC............................................. 110 Figure 98 Effect of changing AEC operating temperature on exergy destruction and overall
AEC energy and exergy efficiencies........................................................................................... 110 Figure 99 Effect of changing AEC operating pressure on AEC cell voltage and required
power........................................................................................................................................... 111 Figure 100 The effects of ambient temperature on the total exergy destruction rate and
heat loss of the AEC ................................................................................................................... 111 Figure 101 The effects of ammonia inlet mass flow rate on exergy destruction and
efficiencies of AEC ..................................................................................................................... 112 Figure 102 Cost breakdown of the integrated system for hydrogen and ammonia
production ................................................................................................................................... 114 Figure 103 The exergy destruction rates of the integrated system components ......................... 116 Figure 104 The cost rate of exergy destruction in each component of the integrated system
..................................................................................................................................................... 117 Figure 105 The effects of PEC reactor capital cost on the system cost rates and
exergoeconomic factors .............................................................................................................. 117 Figure 106 The effects of increasing interest rate on the total system cost rates ........................ 118 Figure 107 The effects of system total lifetime on the system cost rates ................................... 118 Figure 108 The effects of system total lifetime on the system cost rates ................................... 119
8
Figure 109 Illustration of large scale electrochemical ammonia production plant .................... 121
Figure 110 The calculated cost of hydrogen and ammonia with contributing factors for a
1000 kg/day concentrated PEC hydrogen production plant ....................................................... 125 Figure 111 The cost breakdown of hydrogen production plant .................................................. 126
Figure 112 The sensitivity of the hydrogen cost based on different parameters ........................ 126 Figure 113 Waterfall diagram for ammonia cost considering better plant operating capacity
and lower capital, operating costs ............................................................................................... 127 Figure 114 Waterfall diagram for hydrogen cost considering better plant operating capacity
and lower capital, operating costs ............................................................................................... 127
Figure 115 Comparison of ammonia costs using different production routes in Ontario .......... 128
9
LIST OF TABLES
Table 1 Comparison of ammonia with other fuels ........................................................................ 19 Table 2 Experimental conditions for electrochemical ammonia synthesis .................................. 26 Table 3 Summary of the experimental results showing the NH3 formation rates and
efficiencies .................................................................................................................................... 29 Table 4 The shares of different sub-processes in human toxicity category for PEC
(concentrated light) based electrochemical ammonia synthesis ................................................... 32 Table 5 The shares of different sub-processes in abiotic depletion category for PEC
(concentrated light) based electrochemical ammonia synthesis ................................................... 33
Table 6 The shares of different sub-processes in global warming category for PEC
(concentrated light) based electrochemical ammonia synthesis ................................................... 35 Table 7 Uncertainty analyses results of PEC based (concentrated light) electrochemical
ammonia production method ........................................................................................................ 36 Table 8 Summary of the experimental results showing the NH3 formation rates and
efficiencies .................................................................................................................................... 41
Table 9 Comparison of hydrogen production technologies from fossil-fuels .............................. 46 Table 10 Unit cost of LNG including the sub-processes for Case 1 ............................................. 50 Table 11 Total unit cost of ammonia and LNG considering production, liquefaction and
transport for Case 1 ....................................................................................................................... 51 Table 12 Unit cost of LNG including the sub-processes for Case 2 ............................................. 52
Table 13 Total unit cost of ammonia and LNG considering production, liquefaction and
transport for Case 2 ....................................................................................................................... 53 Table 14 Unit cost of LNG including the sub-processes for Case 3 ............................................. 53
Table 15 Total unit cost of ammonia and LNG considering production, liquefaction and
transport for Case 3 ....................................................................................................................... 54 Table 16 Unit cost of LNG including the sub-processes for Case 4 ............................................. 55 Table 17 Total unit cost of ammonia and LNG considering production, liquefaction and
transport for Case 4 in Canada ...................................................................................................... 56 Table 18 Trip scenario for transoceanic freight ship .................................................................... 64
Table 19 Trip scenario for transoceanic tanker ............................................................................. 64 Table 20 Specifications of some alternative aviation fuels .......................................................... 76 Table 21 Fuel and energy requirements of various fueled aircrafts .............................................. 82
Table 22 Environmental and social cost of emissions for complete life cycle of various
fueled aircrafts from conventional resources ................................................................................ 87
Table 23 Average fuel consumption rates and fuel costs for selected alternative fuels ............... 88 Table 24 Energy consumptions per km for the selected vehicles ................................................. 93
Table 25 Ammonia conversion rates at equilibrium ................................................................... 101 Table 26 Various chemical reactions for thermal H2 production. .............................................. 103 Table 27 Technical targets for onboard hydrogen storage for light-duty vehicles ..................... 106 Table 28 Data used in the analyses for ammonia electrolysis .................................................... 108 Table 29 The overpotentials and actual cell voltage in the AEC ............................................... 109
Table 30 The cost of materials used in the PEC hydrogen production reactor .......................... 113 Table 31 The cost of materials used in the electrochemical ammonia production reactor ......... 113 Table 32 The cost of materials used in the integrated system for PEC hydrogen based
electrochemical ammonia production system ............................................................................. 114 Table 33 The financial and operation parameters used in the exergoeconomic analyses .......... 116
10
Table 34 The exergoeconomic results of the components in the integrated system ................... 117
Table 35 The capacity and hydrogen production plant output .................................................. 121 Table 36 The financial input parameters used to calculate the unit hydrogen production
cost .............................................................................................................................................. 121
Table 37 The direct and indirect depreciable capital costs ........................................................ 122 Table 38 The fixed operating costs of the PEC hydrogen production plant ............................... 123 Table 39 The cost of material replacements of the system components..................................... 123 Table 40 The direct capital costs of the components in 1000 kg/day PEC concentrated
light hydrogen production plant .................................................................................................. 124
Table 41 Cost of electricity considered in the analyses .............................................................. 128

11
ACKNOWLEDGEMENT
The principal investigator and intern acknowledge the financial support provided by the Mitacs
and Hydrofuel Inc.
12
NOMENCLATURE
e Charge of an electron (1.60217657 × 10¹⁹ C)
F Faraday constant (C/mol)
h Enthalpy (kJ/kg)
I Irradiance (W/m2)
i Current density (A/m2)
�� Mass flow rate (g/s)
M Molarity (M)
�� Mol flow rate (mol/s)
R Resistance (ohm)
t Time (s)
V Volume (L)
W Work rate (W)
Greek Letters
η Efficiency
𝛿 Nernst diffusion layer thickness (cm)
Acronyms
ADF Abiotic Depletion Factor
ASTM American Section of the International Association for Testing Materials
AOI Angle of incidence
AR Anti-reflective
CFC Chlorofluorocarbon
CML Center of Environmental Science of Leiden University
CCS Carbon Capture Storage
CFC Chlorofluorocarbon
CNG Compressed Natural Gas
CPV Concentrated photovoltaic
DB Dichlorobenzene
DWT Dead Weight Tonnage
DWT Dead Weight Tonnage
DC Direct current
EV Electric Vehicle
EIS Electrochemical impendence spectroscopy
GHG Greenhouse Gas
GREET Greenhouse Gases, Regulated Emissions, and Energy Use in Transportation
GWP Global Warming Potential
HEV Hybrid Electric Vehicle
IATA The International Air Transport Association
IAM Integrated Assessment
ICE Internal Combustion Engine
IPCC Intergovernmental Panel on Climate Change
IR Infrared
ISO International Organization for Standards
KN Knot
13
LCA Life Cycle Assessment
LDI Lean Direct Injection
LPG Liquefied Petroleum Gas
LNG Liquefied Natural Gas
LHV Lower heating value
MSWI Municipal Waste Incineration Plant
NMI Nautical Mile
NM Non-Methane
NAAQS National Ambient Air Quality Standards
NIR Near infrared
NOCT Nominal operating cell temperature
PAH Polycyclic aromatic hydrocarbon
PTH Pump to Haul
PM Particulate Matter
PTWa Pump to Wake
PV Photovoltaic
PEC Photoelectrochemical
PtB Platinum black
PV Photovoltaic
RSZ Reduced Speed Zones
RER Europe
RMS Root mean square
SSPC Solid-state proton conductors
SMR Steam Methane Reforming
TKM Tonne-kilometer
UCG Underground Coal Gasification
UCTE Union for the Co‐ordination of Transmission of Electricity
UV Ultraviolet
VOC Volatile Organic Compounds
WTP Wheel to Pump
WTH Well to Haul
14
SUMMARY
Ammonia is not only a fertilizer but also an alternative fuel for transportation and power
generation. It can easily be adapted to fuel both diesel generators and larger utility power plants.
The ability of being produced from renewable energy sources allows on-site ammonia production
where it is needed. The high hydroelectric, wind, and solar energy source potential of Canada make
the energy storage attractive using ammonia. Ontario, with decreasing electricity prices, has
potentials for on-site ammonia production from hydropower. Solar energy, as the most abundant
source of energy in the world, can be directly utilized for ammonia synthesis via various routes
such as electrochemical and thermochemical cycles.
Canada have significant potential of renewable resources such as hydropower and wind
power. Ammonia can be transported via ocean tankers or pipelines. Besides being a zero emission
fuel in the utilization process, about 30% greenhouse gas reduction is possible using renewable
energy such as wind in the ammonia production when compared to conventional unleaded
gasoline. Compared to propane, greenhouse gas production decreases about 18%. Hence in the
overall life cycle, ammonia has significant environmental advantages. Even if ammonia is
produced from hydrocarbons, it has similar greenhouse gas emissions with solar energy based
route. It is important to emphasize that an ammonia driven passenger vehicle releases less
greenhouse gas emissions than compressed natural gas (CNG), liquefied petroleum gas (LPG),
diesel, and even hybrid electric vehicles. Considering vehicle and fuel production together,
emissions from an ammonia-fueled passenger car is very close to electric vehicles per km traveled
as even lower in a few routes. An ammonia-fueled vehicle can save 100 g of greenhouse gas per
km compared to gasoline when the complete vehicle and fuel life cycle is considered. Depletion
of abiotic resources is moderately lower for conventional ammonia production, which is originated
from natural gas, than liquefied natural gas, diesel, petrol and propane fuels.
In this report, detailed background information about production and utilization of
ammonia is presented in Chapter 1. In Chapter 2, an alternative ammonia synthesis method is
experimentally realized and tested. The selected route is molten salt electrolyte based
electrochemical ammonia production. In Chapter 3, the required hydrogen for ammonia synthesis
is produced using photoelectrochemical route and integrated to ammonia synthesis. The
experimental results are presented under different conditions. Chapter 4 explains ammonia
production from hydrocarbon sources such as natural gas. The comparative results for liquefied
natural gas (LNG) and ammonia are given for production and transport phases. Chapter 5
investigates the usage of ammonia in maritime applications and performs a life cycle assessment.
In Chapter 6, ammonia is evaluated as a potential fuel for aviation industry and the performances
of alternative fuels are comparatively presented. Chapter 7 performs a life cycle assessment for
ammonia usage in road vehicles whereas in Chapter 8, ammonia is produced using different routes
and decomposed on-board for hydrogen driven vehicles. On-board ammonia electrolysis is also
analyzed and presented. Chapter 9 investigates the cost of photoelectrochemical hydrogen and
ammonia using exergoeconomic approach and the system is scaled-up in Chapter 10 to find the
total cost of hydrogen and ammonia.
15
CHAPTER 1: QUICK FACTS ABOUT AMMONIA
Currently about 4.8 million metric tonnes of ammonia are produced yearly in Canada. 95.4% of
produced ammonia originates from natural gas via steam methane reforming technique. 2.3% is
produced by coal gasification, and 2.3% is from petroleum-coke in Canada [1]. On the other hand,
the U.S. yearly produces about 12 million metric tonnes of ammonia. China is the largest ammonia
producer in the world with a capacity of 55 million metric tonnes [1]. Global ammonia production
corresponds to about 200 million metric tonnes. Only 4% of ammonia is used directly whereas the
remaining is either used as a fertilizer or as a chemical in other industrial applications [1]. 80
million metric tonnes of ammonia is converted to urea for fertilizer uses. 1 L of gasoline costs
about 0.65 USD in the U.S. This corresponds to 0.84 USD per kg gasoline. In comparison, 1 kg of
ammonia sells for about 0.35 USD in the U.S [2]. Hence, ammonia is a lower cost fuel in mass
basis.
The United States, Mexico and Canada have now set to declare that 50% of North
America's electricity will come from clean power sources by year 2025 at the Three Amigos
Summit in Ottawa [3]. It is now more obvious that the importance of alternative fuels and storage
mediums increases day by day. In this regard, renewable ammonia (NH3), which is a carbon-free
fuel, refrigerant and working fluid, appears to be a unique solution to overcome local and global
issues. It will help achieve carbon-free economy. The most unique part of ammonia is that it can
be used for multi-purpose applications, including fuel, refrigerant, working fluid, and storage
media of hydrogen. The other clear advantage is that it can serve almost all sectors, ranging from
transportation to residential, industrial to commercial, public to utility, and agricultural to
chemical.
Ammonia as a potential fuel candidate for vehicles can also be produced using
conventional hydrocarbons in a cleaner manner by implying current technologies and
developments even with lower costs. Hydrogen can be produced by dissociation of hydrocarbons,
which can be then converted to ammonia using nitrogen supply from air [4]. Dissociation of
hydrocarbons such as methane and oil sand bitumen is a promising option especially for Canada
[5,6]. Although decomposition of heavy fractions such as oil sand bitumen can bring some
challenges because of various metal and sulfur contents, purification is always possible and
applicable. This technology can be promising for oil sand reserves in Alberta and stranded natural
gas reserves in Newfoundland and Labrador. Ammonia is an excellent fuel candidate with the
ability to secure off peak power at negative or very low prices. We can convert excess electricity
to ammonia, and then we can burn it in generators, internal combustion engines, fuel cells and use
as fertilizer. Where and when needed, it can be transported via pipelines, trucks, and ocean tankers.
Using appropriate renewable resources and cleaner hydrocarbon utilization paths,
ammonia production can be cost-effective and environmentally friendly. On-site production and
utilization of ammonia brings additional significant cost and efficiency advantages.
Ammonia (NH3):
consists of one nitrogen atom from air separation and three hydrogen atoms from any
conventional or renewable resources.
is the second largest synthesized industrial chemical in the world.
is a significant hydrogen carrier and transportation fuel that does not contain any carbon atoms
and has a high hydrogen ratio.
contains about 48% more hydrogen by volume than liquefied hydrogen.
does not emit direct greenhouse gas emission during utilization
16
can be used as solid and/or liquid for many purposes.
can be stored and transported under relatively lower pressures.
can be produced from various type of resources ranging from oil sands to renewables.
is a suitable fuel to be transferred using steel pipelines with minor modifications which are
currently used for natural gas and oil.
can be used in all types of combustion engines, gas turbines, burners as a sustainable fuel with
only small modifications and directly in fuel cells which is a very important advantage
compared to other type of fuels.
brings a non-centralized power generation via fuel cells, stationary generators, furnaces/boilers
and enables smart grid applications.
can be used as a refrigerant for cooling in the car.
1. What are the uses of ammonia?
Ammonia is considered a possible working fluid for thermodynamic cycles, working for
refrigeration, heating, power or any mixture of those can be coupled with internal combustion
engines, and using exhaust gasses to drive automotive absorption refrigeration system.
Ammonia has been recognized and employed as a leading refrigerant in the industrial
sector due to its outstanding thermal properties, zero ozone depletion and global warming potential
(GWP). Ammonia has the highest refrigerating effect per unit mass compared to all the refrigerants
being used including the halocarbons. The remarkable advantages of ammonia over R-134a could
be lower overall operating costs of ammonia systems, the flexibility in meeting complex and
several refrigeration needs, and lower initial costs for numerous applications. Ammonia has better
heat transfer properties than most of chemical refrigerants and consequently allow for the use of
equipment with a smaller heat transfer area. Thereby plant construction cost will be lower. But as
these properties also benefit the thermodynamic efficiency in the system, it also reduces the
operating costs of the system. In many countries the cost of ammonia per mass is considerably
lower than the cost of HFCs. This kind of advantage is even multiplied by the fact that ammonia
has a lower density in liquid phase. Modern ammonia systems are fully contained closed-loop
systems with fully integrated controls, which regulate pressures throughout the system. Ammonia
is used as refrigerant highly in the refrigeration structures of food industry like dairies, ice creams
plants, frozen food production plants, cold storage warehouses, processors of fish, poultry and
meat and a number of other uses.
It is also stimulating to note that NH3 is a reduction agent for the NOx typically current in
combustion releases. The reaction of NOx with ammonia over catalysts produces only steam and
nitrogen. An average car needs only approximately 30 mL of NH3 per 100 km to neutralize any
NOx emissions. If the vehicles run with NH3 as fuel, this amount is unimportant with respect to
the fuel tank volume.
Ammonia is used as fertilizer in the agriculture. It is also converted into urea by reacting
with CO2. The majority of growth in ammonia usage is expected to be for industrial uses and the
production of fertilizer products.
It is also worth to examine the option to cool the engine with ammonia that can act as a
refrigerant while it is heated to the temperature at which it is fed to the power producer (ICE or
fuel cell). Optionally, the cooling outcome of ammonia, i.e., its high latent heat of evaporation,
may be used to harvest some air conditioning onboard.
17
2. Is ammonia really a fuel?
Ammonia as a sustainable fuel can be used in all types of combustion engines, gas turbines, and
burners with only small modifications and directly in fuel cells. Ammonia was initially used as a
fuel for buses in Belgium in 1940s [7]. Many studies have already been performed and many
applications have been implemented so far. A prototype unit for combustion which enabled liquid
kerosene and gaseous ammonia to be fed, and ammonia was combusted in a gas-turbine unit.
Further studies have been performed by various researchers which have proven the practicality of
using ammonia as fuel [8–14]. Numerical studies of combustion characteristics of ammonia as a
renewable fuel have been conducted. Ammonia can also be used a fuel blending option for current
gasoline and diesel engines. Combustion and emissions characteristics of compression-ignition
engine using dual ammonia-diesel fuel have been performed. Performance enhancement of
ammonia-fueled engine by using dissociation catalyst has been studied. These are just a few
examples to show the current progress in the ammonia utilization options in transportation
applications.
3. Is ammonia a suitable fuel for transportation sector?
The storage and delivery infrastructure of ammonia is similar to liquefied petroleum gas (LPG)
process. Under medium pressures (5-15 bar), both of the substances are in liquid form which brings
the significant advantage because of storage benefits. Today, vehicles running with propane are
mostly accepted and used by the public since their on-board storage is possible and it is a good
example for ammonia fueled vehicle opportunities since the storage and risk characteristics of both
substances are similar to each other. An ammonia pipeline from the Gulf of Mexico to Minnesota
and with divisions to Ohio and Texas has served the ammonia industry for many years. It indicates
that there is a working ammonia pipeline transportation which can be spread overall the world.
The potential of ammonia usage in many applications will be dependent on the availability of
ammonia in the cities. Ammonia is a suitable substance to be transferred using steel pipelines with
minor modifications which are currently used for natural gas and oil. In this way, the problem of
availability of ammonia can be eliminated.
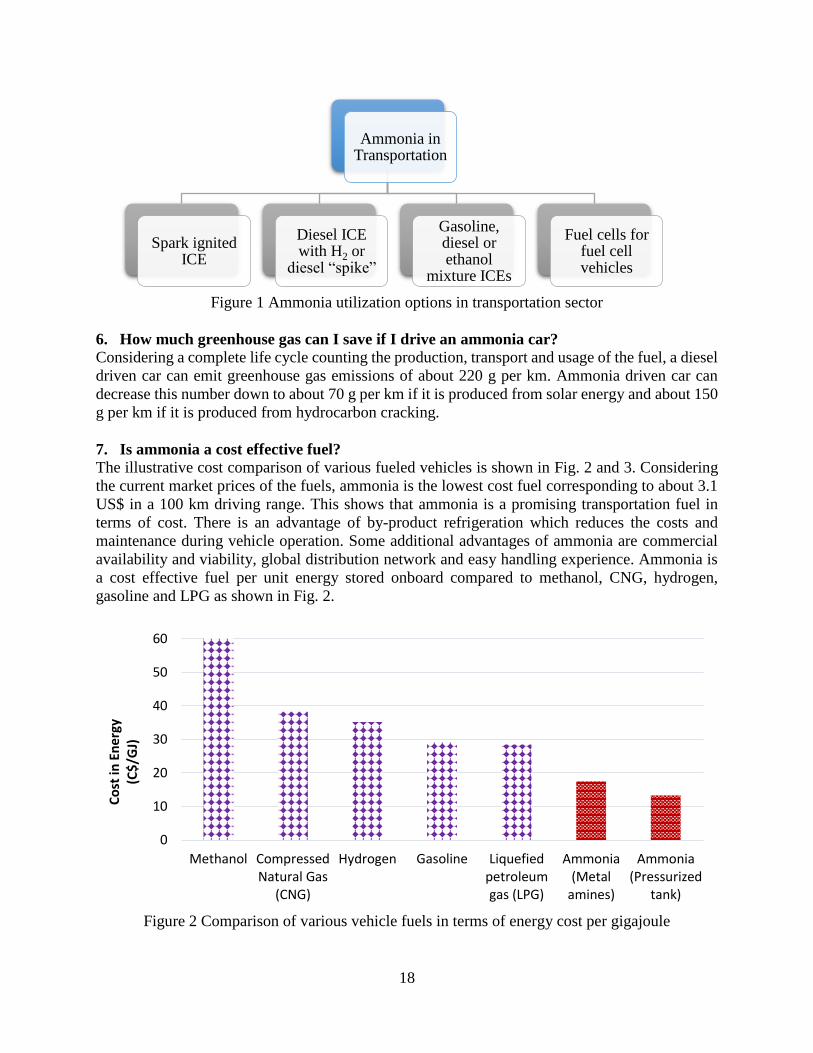
4. How can ammonia be used in transportation?
Ammonia has significant potential as an alternative fuel to further the sustainable development of
transportation sector. A few of the following alternatives are shown in Fig. 1 for direct ammonia
usage in transportation applications.
Currently, the majority of the locomotive fleet is made up of diesel-electric locomotives,
operating with either two-stroke or four-stroke prime mover diesel engines that is coupled to an
electric generator. Application of ammonia fuel for internal combustion engine (ICE) with the
alternative locomotive configurations direct feed, or a combination of direct feed and
decomposition subcategory options will bring more sustainable solutions. Additionally, fuel cell
driven vehicles and locomotives may contribute to solve the associated matters of urban air
superiority and national energy security influencing the rail and transportation sector.
5. Is ammonia a clean fuel?
Compared to gasoline vehicles, ammonia-fueled vehicles do not produce direct CO2 emission
during operation. Since ammonia produces mainly water and nitrogen on combustion, replacing a
part of conventional fuel with ammonia will have a large effect in reducing carbon dioxide
emissions.
18
Figure 1 Ammonia utilization options in transportation sector
6. How much greenhouse gas can I save if I drive an ammonia car?
Considering a complete life cycle counting the production, transport and usage of the fuel, a diesel
driven car can emit greenhouse gas emissions of about 220 g per km. Ammonia driven car can
decrease this number down to about 70 g per km if it is produced from solar energy and about 150
g per km if it is produced from hydrocarbon cracking.
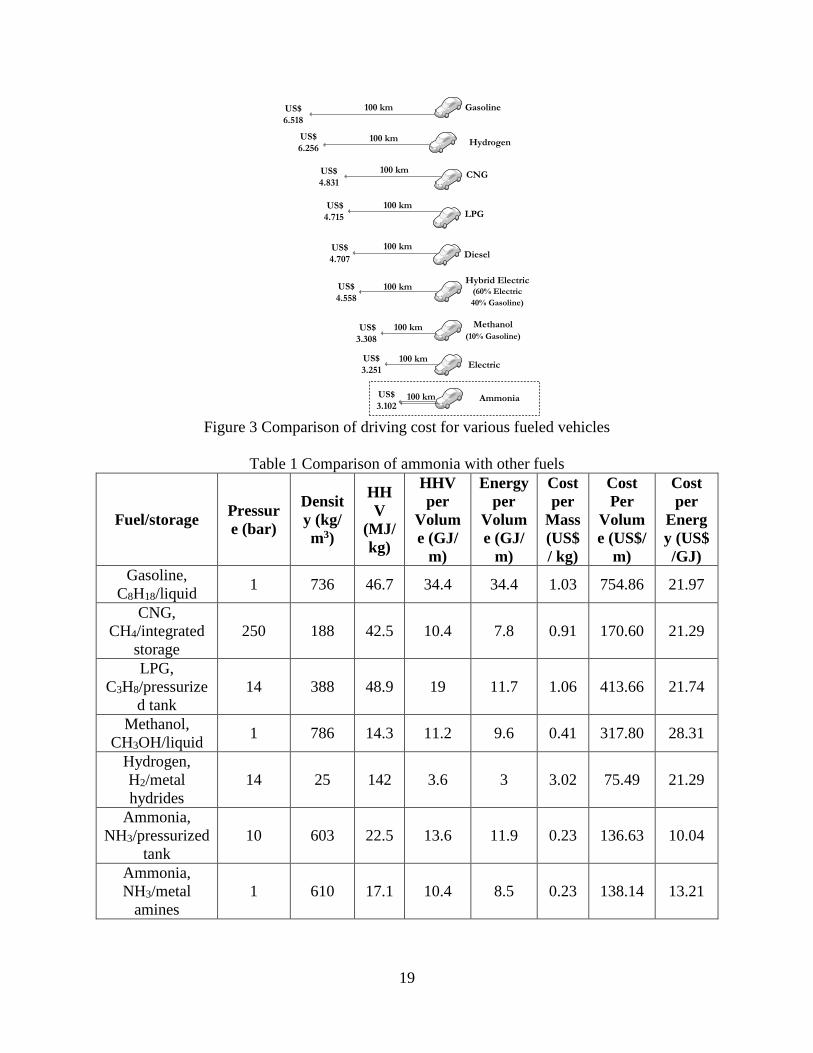
7. Is ammonia a cost effective fuel?
The illustrative cost comparison of various fueled vehicles is shown in Fig. 2 and 3. Considering
the current market prices of the fuels, ammonia is the lowest cost fuel corresponding to about 3.1
US$ in a 100 km driving range. This shows that ammonia is a promising transportation fuel in
terms of cost. There is an advantage of by-product refrigeration which reduces the costs and
maintenance during vehicle operation. Some additional advantages of ammonia are commercial
availability and viability, global distribution network and easy handling experience. Ammonia is
a cost effective fuel per unit energy stored onboard compared to methanol, CNG, hydrogen,
gasoline and LPG as shown in Fig. 2.
Figure 2 Comparison of various vehicle fuels in terms of energy cost per gigajoule
Ammonia in Transportation
Spark ignited ICE
Diesel ICE with H2 or
diesel “spike”
Gasoline, diesel or ethanol
mixture ICEs
Fuel cells for fuel cell vehicles
0
10
20
30
40
50
60
Methanol CompressedNatural Gas
(CNG)
Hydrogen Gasoline Liquefiedpetroleumgas (LPG)
Ammonia(Metal
amines)
Ammonia(Pressurized
tank)
Co
st in
En
ergy
(C$
/GJ)
19
100 km
100 km
100 km
100 km
100 km
100 km
100 km
Gasoline
Hybrid Electric (60% Electric
40% Gasoline)
LPG
Methanol
(10% Gasoline)
CNG
Hydrogen
Ammonia
US$
6.518
US$
4.558
US$
3.308
US$
4.715
US$
4.831
US$
6.256
US$
3.102
100 kmDiesel
US$
4.707
100 kmElectric
US$
3.251
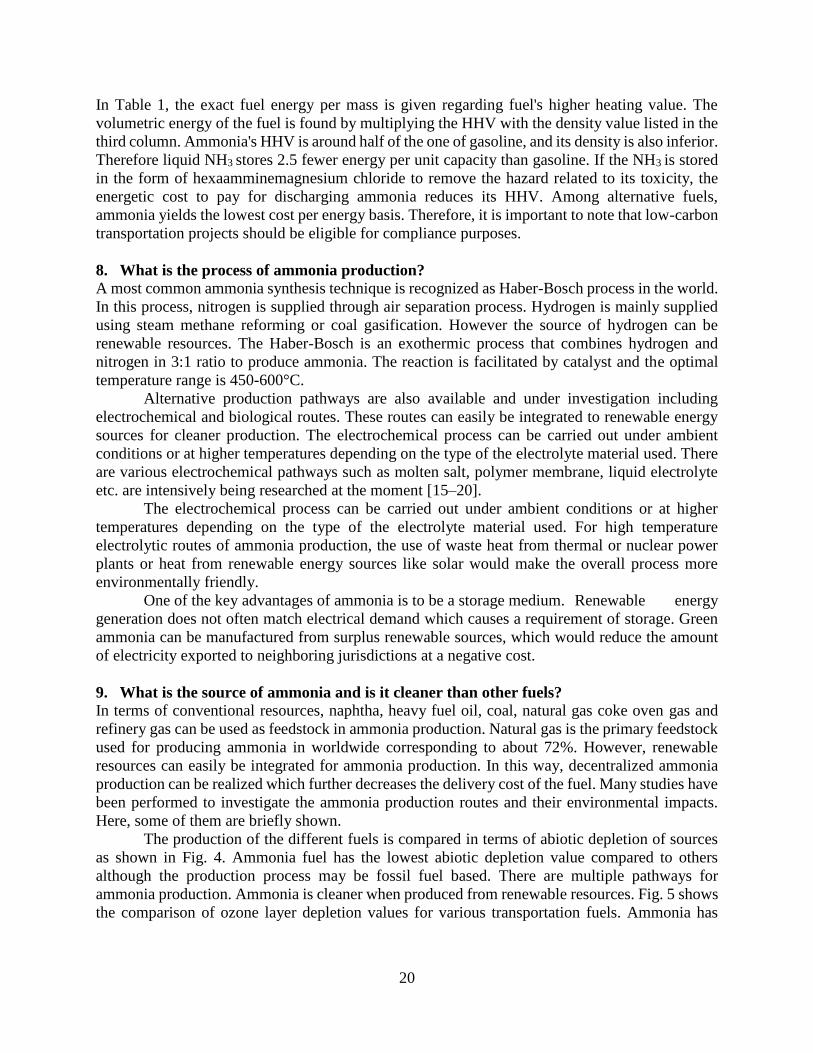
Figure 3 Comparison of driving cost for various fueled vehicles
Table 1 Comparison of ammonia with other fuels
Fuel/storage Pressur
e (bar)
Densit
y (kg/
m3)
HH
V
(MJ/
kg)
HHV
per
Volum
e (GJ/
m)
Energy
per
Volum
e (GJ/
m)
Cost
per
Mass
(US$
/ kg)
Cost
Per
Volum
e (US$/
m)
Cost
per
Energ
y (US$
/GJ)
Gasoline,
C8H18/liquid 1 736 46.7 34.4 34.4 1.03 754.86 21.97
CNG,
CH4/integrated
storage
250 188 42.5 10.4 7.8 0.91 170.60 21.29
LPG,
C3H8/pressurize
d tank
14 388 48.9 19 11.7 1.06 413.66 21.74
Methanol,
CH3OH/liquid 1 786 14.3 11.2 9.6 0.41 317.80 28.31
Hydrogen,
H2/metal
hydrides
14 25 142 3.6 3 3.02 75.49 21.29
Ammonia,
NH3/pressurized
tank
10 603 22.5 13.6 11.9 0.23 136.63 10.04
Ammonia,
NH3/metal
amines
1 610 17.1 10.4 8.5 0.23 138.14 13.21
20
In Table 1, the exact fuel energy per mass is given regarding fuel's higher heating value. The
volumetric energy of the fuel is found by multiplying the HHV with the density value listed in the
third column. Ammonia's HHV is around half of the one of gasoline, and its density is also inferior.
Therefore liquid NH3 stores 2.5 fewer energy per unit capacity than gasoline. If the NH3 is stored
in the form of hexaamminemagnesium chloride to remove the hazard related to its toxicity, the
energetic cost to pay for discharging ammonia reduces its HHV. Among alternative fuels,
ammonia yields the lowest cost per energy basis. Therefore, it is important to note that low-carbon
transportation projects should be eligible for compliance purposes.
8. What is the process of ammonia production?
A most common ammonia synthesis technique is recognized as Haber-Bosch process in the world.
In this process, nitrogen is supplied through air separation process. Hydrogen is mainly supplied
using steam methane reforming or coal gasification. However the source of hydrogen can be
renewable resources. The Haber-Bosch is an exothermic process that combines hydrogen and
nitrogen in 3:1 ratio to produce ammonia. The reaction is facilitated by catalyst and the optimal
temperature range is 450-600°C.
Alternative production pathways are also available and under investigation including
electrochemical and biological routes. These routes can easily be integrated to renewable energy
sources for cleaner production. The electrochemical process can be carried out under ambient
conditions or at higher temperatures depending on the type of the electrolyte material used. There
are various electrochemical pathways such as molten salt, polymer membrane, liquid electrolyte
etc. are intensively being researched at the moment [15–20].
The electrochemical process can be carried out under ambient conditions or at higher
temperatures depending on the type of the electrolyte material used. For high temperature
electrolytic routes of ammonia production, the use of waste heat from thermal or nuclear power
plants or heat from renewable energy sources like solar would make the overall process more
environmentally friendly.
One of the key advantages of ammonia is to be a storage medium. Renewable energy
generation does not often match electrical demand which causes a requirement of storage. Green
ammonia can be manufactured from surplus renewable sources, which would reduce the amount
of electricity exported to neighboring jurisdictions at a negative cost.
9. What is the source of ammonia and is it cleaner than other fuels?
In terms of conventional resources, naphtha, heavy fuel oil, coal, natural gas coke oven gas and
refinery gas can be used as feedstock in ammonia production. Natural gas is the primary feedstock
used for producing ammonia in worldwide corresponding to about 72%. However, renewable
resources can easily be integrated for ammonia production. In this way, decentralized ammonia
production can be realized which further decreases the delivery cost of the fuel. Many studies have
been performed to investigate the ammonia production routes and their environmental impacts.
Here, some of them are briefly shown.
The production of the different fuels is compared in terms of abiotic depletion of sources
as shown in Fig. 4. Ammonia fuel has the lowest abiotic depletion value compared to others
although the production process may be fossil fuel based. There are multiple pathways for
ammonia production. Ammonia is cleaner when produced from renewable resources. Fig. 5 shows
the comparison of ozone layer depletion values for various transportation fuels. Ammonia has
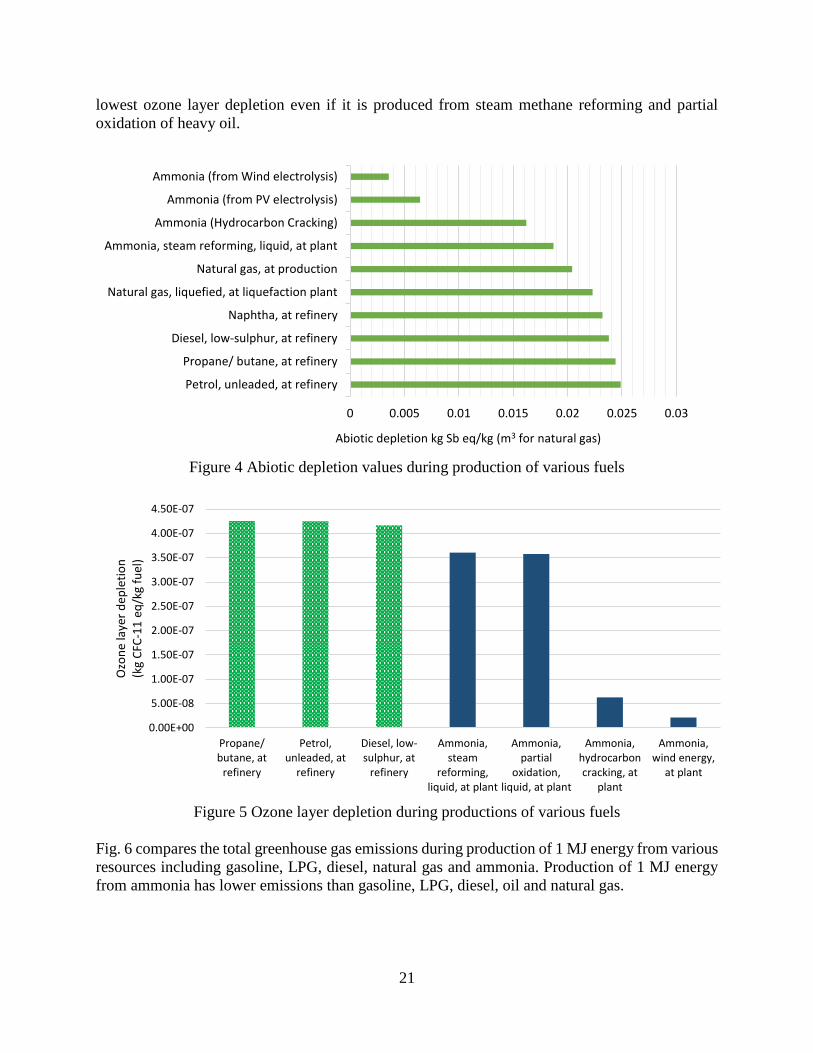
21
lowest ozone layer depletion even if it is produced from steam methane reforming and partial
oxidation of heavy oil.
Figure 4 Abiotic depletion values during production of various fuels
Figure 5 Ozone layer depletion during productions of various fuels
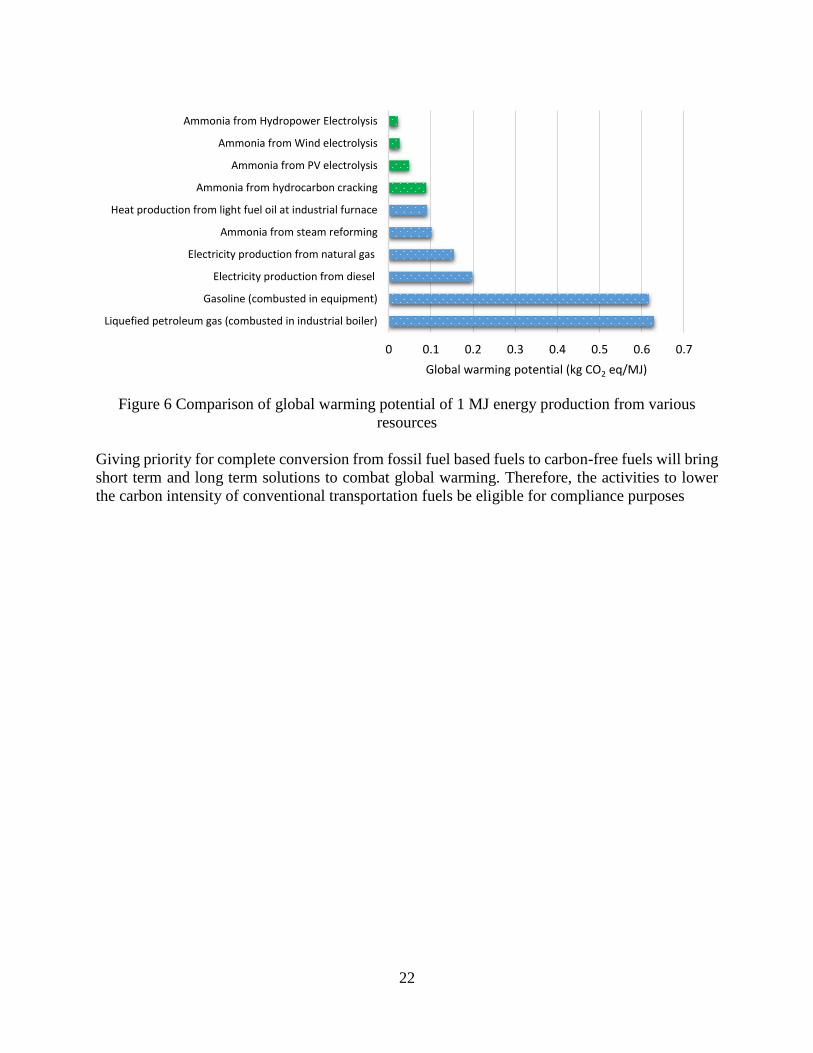
Fig. 6 compares the total greenhouse gas emissions during production of 1 MJ energy from various
resources including gasoline, LPG, diesel, natural gas and ammonia. Production of 1 MJ energy
from ammonia has lower emissions than gasoline, LPG, diesel, oil and natural gas.
0 0.005 0.01 0.015 0.02 0.025 0.03
Petrol, unleaded, at refinery
Propane/ butane, at refinery
Diesel, low-sulphur, at refinery
Naphtha, at refinery
Natural gas, liquefied, at liquefaction plant
Natural gas, at production
Ammonia, steam reforming, liquid, at plant
Ammonia (Hydrocarbon Cracking)
Ammonia (from PV electrolysis)
Ammonia (from Wind electrolysis)
Abiotic depletion kg Sb eq/kg (m3 for natural gas)
0.00E+00
5.00E-08
1.00E-07
1.50E-07
2.00E-07
2.50E-07
3.00E-07
3.50E-07
4.00E-07
4.50E-07
Propane/butane, at
refinery
Petrol,unleaded, at
refinery
Diesel, low-sulphur, at
refinery
Ammonia,steam
reforming,liquid, at plant
Ammonia,partial
oxidation,liquid, at plant
Ammonia,hydrocarboncracking, at
plant
Ammonia,wind energy,
at plant
Ozo
ne
laye
r d
eple
tio
n
(kg
CFC
-11
eq
/kg
fuel
)
22
Figure 6 Comparison of global warming potential of 1 MJ energy production from various
resources
Giving priority for complete conversion from fossil fuel based fuels to carbon-free fuels will bring
short term and long term solutions to combat global warming. Therefore, the activities to lower
the carbon intensity of conventional transportation fuels be eligible for compliance purposes
0 0.1 0.2 0.3 0.4 0.5 0.6 0.7
Liquefied petroleum gas (combusted in industrial boiler)
Gasoline (combusted in equipment)
Electricity production from diesel
Electricity production from natural gas
Ammonia from steam reforming
Heat production from light fuel oil at industrial furnace
Ammonia from hydrocarbon cracking
Ammonia from PV electrolysis
Ammonia from Wind electrolysis
Ammonia from Hydropower Electrolysis
Global warming potential (kg CO2 eq/MJ)
23
CHAPTER 2: ELECTROCHEMICAL SYNTHESIS OF AMMONIA
Natural gas is the primary feedstock used for producing ammonia in worldwide which increases
the fossil fuel dependence and greenhouse gas emissions. Therefore, alternative ammonia
synthesis methods are in development stage such as electrochemical ammonia synthesis which is
experimentally tested in this chapter.
1. Introduction
The electrochemical process can be carried out under ambient conditions or at higher temperatures
depending on the type of the electrolyte material used. For high temperature electrolytic routes of
ammonia production, the use of waste heat from thermal or nuclear power plants or heat from
renewable energy sources like solar would make the overall process more environmentally
friendly. Ammonia production from hydrogen and nitrogen is exothermic in nature and is
facilitated by high pressures and low temperatures. Thus a balance between the operating
temperature, pressure and the ammonia yield needs to be proven for electrochemical system in
determining ammonia production rates. Among solid state electrolyte methods, there are studies
in the literature although maximum production rates are lower than liquid electrolyte based
methods. A study used a proton-conducting solid electrolyte at 450°C to 700°C with Ru based
catalyst. They resulted that the conversion rates are lower compared to nitrogen or steam because
of the low conductivity of the working electrode [20]. In another study with a Nafion divider in
aqueous 2 M KOH and a Ru on cathode allowed ammonia generation from water and nitrogen at
a rate of 2.8×10⁻¹² mol NH3/s cm2 and coulombic efficiency of 0.9% at 20°C. Also, at 90°C, a
maximum rate of 2.1×10⁻¹¹ mol /s cm2 at 0.2% efficiency was observed [21]. Membrane based
applications can be performed at quite lower temperatures than molten salt electrolyte based
methods. Having Pt/C on a gas diffusion layer at both electrodes and room temperature, using
Nafion as the electrolyte yielded NH3 at a higher rate of 1.1×10⁻⁹ mol/s cm2, which consumed
water at the anode and air at the cathode at 0.6% coulombic efficiency [16]. In addition, there is
also a molten NaOH-KOH eutectic electrolyte based ammonia fuel cell studied by researchers
[22]. Licht et al. [18] obtained about 35% Faradaic efficiency where they supplied water and air
to produce ammonia in molten salt electrolyte. In their further research Li and Licht [17] reported
that since they used water as hydrogen source, at 200 mA/cm2, over 90% of applied current
generated H2, rather than NH3. In this case, hydrogen was cogenerated but required higher
potentials because of water splitting voltage.
Numerous electrochemical methods have recently been developed for consideration as
alternative syntheses of NH3 [23–33]. Kugler et al. [32] studied to increase the NH3 generation
rate by applying galvanic deposition of Rh and Ru on Ti felts in which they observed higher
formation rates for Rh coatings. Kim et al. [33] performed electrochemical synthesis of ammonia
in molten LiCl-KCl-CsCl electrolyte by a mixture of catalysts as nano-Fe2O3 and CoFe2O4. Their
maximum formation rate was 3×10⁻¹⁰ mol/s cm2 where they used water and nitrogen for the
reaction. Xu et al. [34] investigated generation of ammonia at atmospheric pressure and low
temperature electrochemically, using the SFCN materials as the cathode, a Nafion membrane as
the electrolyte, nickel-doped SDC (Ni-SDC) as the anode and silver-platinum paste as the current
collector. NH3 was produced from 25°C to 100°C temperature levels when the SFCN materials
were utilized as cathode, with SmFe0.7Cu0.1Ni0.2O3 which gives the maximum rates of ammonia
formation. Garagounis et al. [35] summarized the test results of studies within the last 15 years
using electrolyte cells. More than 30 electrolyte materials with 15 catalysts that were used as
working electrodes (cathode) were tested. The polymer Nafion yielded the highest rate of ammonia
24
formation at a very low temperature. Nafion can also be used as a proton conductor with and a
Ru/C cathode which yielded NH3 from H2O and N2 at 90°C. These low operating temperatures are
sought after when designing new systems because of the reduced energy input required and lower
rate of decomposition of the ammonia formed. As an alternative approach, the use of oxygen ion
conductors where steam and nitrogen are introduced together at the cathode should be considered.
The rate of NH3 production was however very small in a demonstration at 500°C but improved by
up to two orders of magnitude at higher temperatures as reported by Skodra et al. [36].
Furthermore, NH3 synthesis using molten salt electrolyte based systems can yield high conversion
ratios similar to that of polymer based membranes. Solid-state proton conductors (SSPC) denote a
class of ionic solid electrolytes which have the capability to transfer hydrogen ions (H+) [37].
However, this method has some disadvantages such as high temperature requirement and
formation of secondary phases [38–40]. A variety of factors need to be analyzed when selecting
the cell material such as system operating temperature, current density, pressure, and conductivity
which all affect the ammonia production rate. It is important to note that conductivity of a solid
electrolyte increases exponentially with temperature and by reducing cell thickness as reported by
Giddey et al. [41]. Kyriakou et al. [42] recently reported extensive literature data about low
temperature, medium temperature and high temperature electrochemical NH3 synthesis routes
showing that the synthesis rates can reach up to 3.3×10⁻⁸ mol/s cm2. Shipman and Symes [43]
presented the recent developments in electrochemical NH3 production and they categorized the
sources of proton as water, hydrogen and sacrificial proton donors. They resulted that the
techniques keeping the temperatures in the range of 100°C and 300°C may well demonstrate to be
the most efficient.
H2 can be directly utilized in the electrochemical NH3 formation as investigated in this
study. Most of the literature used water as hydrogen source which also requires water splitting
process at the same time with ammonia synthesis. Specifically, for solar energy storage
applications, H2 can act as short-term storage whereas NH3 can serve as long-term storage medium
which reduces the storage losses significantly. Here, electrochemical synthesis of ammonia using
H2 and N2 at ambient pressure in a molten hydroxide ambient with nano-Fe3O4 catalyst is
performed. The active surface areas of the Nickel mesh electrodes are increased to allow higher
formation rates. The effects of various parameters such as applied potential and current density,
reaction temperature on ammonia formation rate are investigated. The nickel mesh electrodes are
utilized having large surface area and the reaction temperatures are quite lower than the
conventional Haber-Bosch process.
2. Experimental Investigation and Analysis
In this study, H2 and N2 are directly used for electrochemical synthesis of ammonia at the
electrodes. N2 receives the electrons from external power supply. Hence nitrogen gas sent via the
porous nickel cathode is reduced to nitride according to the following equation:
N2 + 6e− → 2N3− (1)
It becomes N3- then after moves to the other electrode where H2 is being supplied. Hydrogen ions
combine with nitrogen ions and form NH3 at anode electrode and shown the following equation:
2N3− + 3H2 → 2NH3 + 6e− (2)
The anode reaction is also achieved on porous nickel electrode.
The overall reaction is:
3H2 + N2 → 2NH3 (3)
25
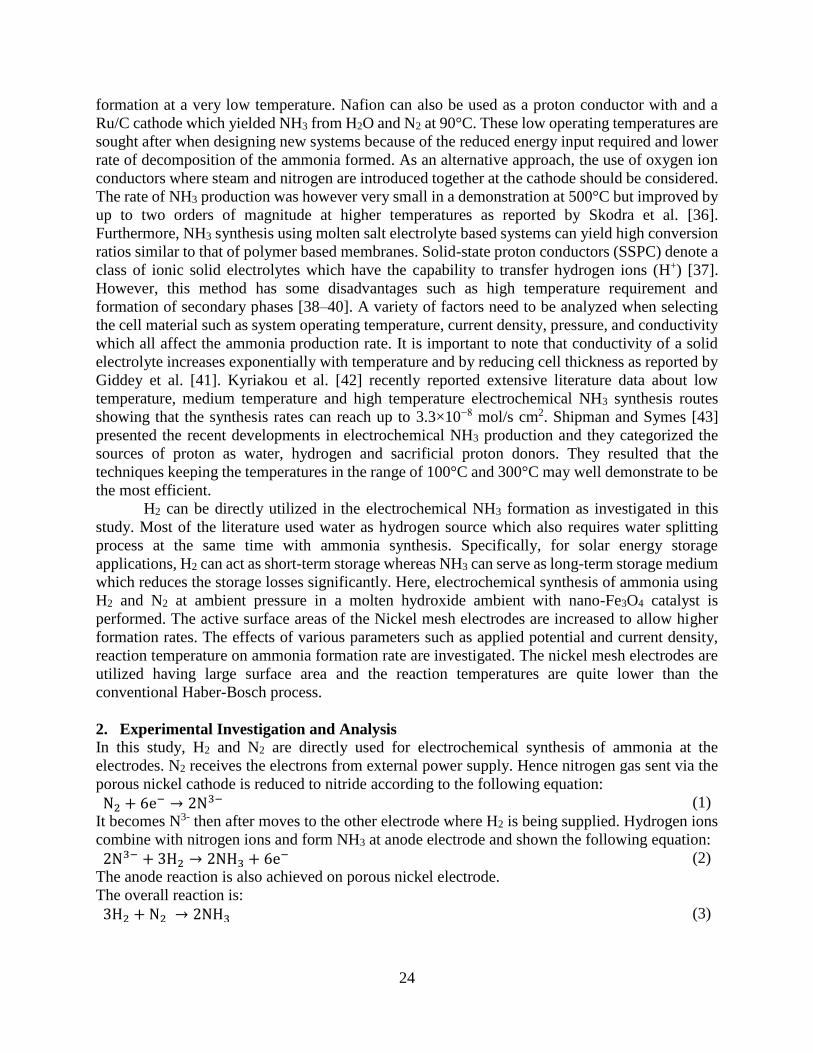
Figure 7 Nickel mesh electrodes in the reactor, molten salt in the reactor
Iron oxide (Fe3O4) as nano-powder (20-30 nm, 98+%) is used in the experiments as
catalyst. The high surface area of the nano-Fe3O4 in the electrochemical synthesis is critical for the
reaction to occur and to obtain higher ammonia evolution rates. The reactants, H2 and N2, are
bubbled through the mesh over the anode and cathode, respectively. The combined gas products
(H2, N2 and NH3) exit through two exit tubes in chamber head space. The exiting gases are firstly
measured using flowmeters and bubbled through an ammonia water trap then analyzed for
ammonia, and subsequently the NH3 scrubbed-gas is analyzed for H2 or N2.
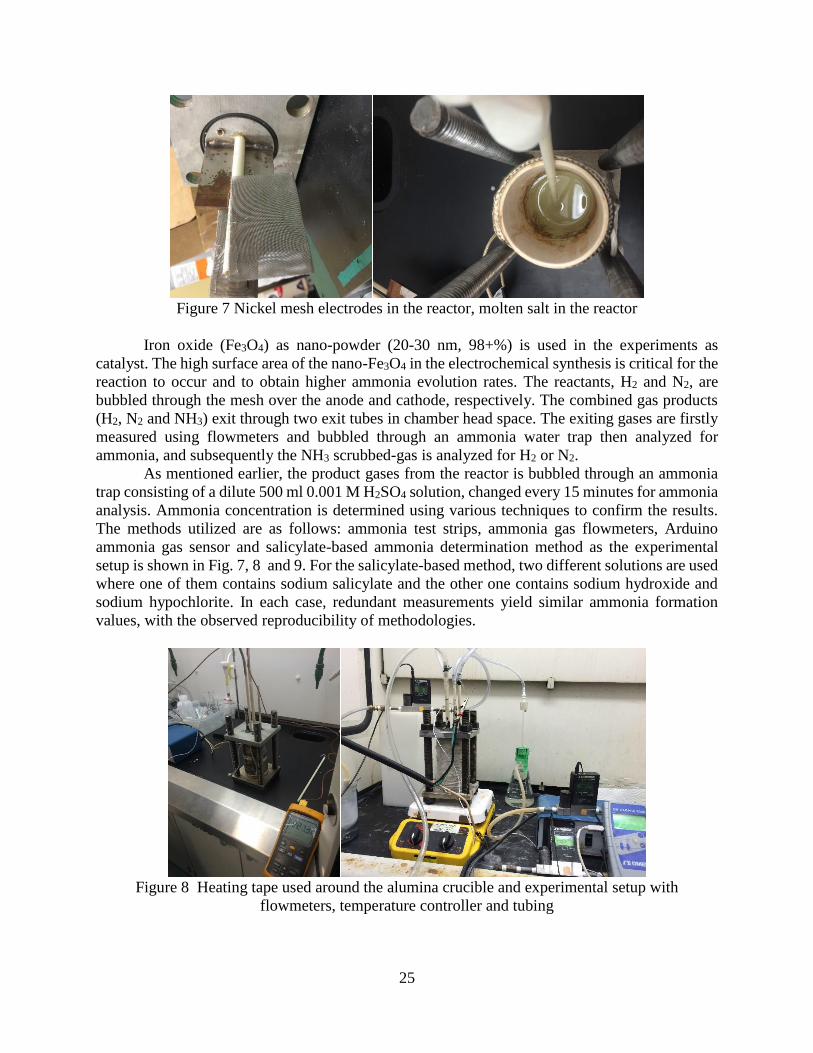
As mentioned earlier, the product gases from the reactor is bubbled through an ammonia
trap consisting of a dilute 500 ml 0.001 M H2SO4 solution, changed every 15 minutes for ammonia
analysis. Ammonia concentration is determined using various techniques to confirm the results.
The methods utilized are as follows: ammonia test strips, ammonia gas flowmeters, Arduino
ammonia gas sensor and salicylate-based ammonia determination method as the experimental
setup is shown in Fig. 7, 8 and 9. For the salicylate-based method, two different solutions are used
where one of them contains sodium salicylate and the other one contains sodium hydroxide and
sodium hypochlorite. In each case, redundant measurements yield similar ammonia formation
values, with the observed reproducibility of methodologies.
Figure 8 Heating tape used around the alumina crucible and experimental setup with
flowmeters, temperature controller and tubing
26
In addition, the pH level of the dilute H2SO4 solutions are recorded before and after NH3 trapped
in the solution in order to observe the dissolved ammonia. Ammonia formation rate is calculated
by converting the measured NH3 to moles per seconds and considering the surface area of Ni
electrodes as 100 cm2. The ammonia formation rate is calculated using the following equation:
mNH3=
[NH4+] × V
t (4)
where [NH4+] is the concentration of formed ammonia as mg/L, 𝑉 is the total volume of H2SO4 for
trapping ammonia as L and 𝑡 is the time of collection.
The Faradaic efficiency is calculated based on the moles of electrons consumed compared to the
3e−/NH3 equivalents produced. Thus, the Faradaic efficiency of ammonia generation process is
defined as follows:
𝜂Faradaic (%) =nNH3
× 𝐹 × 3
𝑖 (5)
where 𝐹 is Faraday constant and 𝑖 is the current density (A/cm2).
The energy efficiency of the ammonia production process is also calculated based on lower heating
values of reacted hydrogen and ammonia, nitrogen enthalpy and electrical power input as follows:
𝜂Energy (%) =mNH3
× 𝐿𝐻𝑉NH3
(mH2 × 𝐿𝐻𝑉H2
+ mN2× ℎN2
+ 𝑊𝑒𝑙 )
(6)
where 𝑊𝑒𝑙 is the total electricity input during the experiment calculated using the total charge,
applied voltage and duration.
3. Results and Discussion
The pure alkali hydroxides NaOH and KOH each melt only at temperatures above 300°C. The
individual melting temperatures of NaOH and KOH are 318°C and 406°C, respectively. Among
various alternatives, these two salts melt at quite lower temperatures which is a highly desired
property in order to decrease external heat energy input. Based on common materials, the NaOH-
KOH eutectic is of particular attention and melts at 170°C. Ammonia synthesis rates increase when
the molten hydroxide (NaOH-KOH) electrolyte is mixed with high–surface area Fe3O4 to provide
iron as a reactive surface and when nitrogen and hydrogen are present in the reactor. The molten
salt medium is supplied electricity between two nickel anode and cathode electrodes. The mixture
is prepared in the beginning by simply adding NaOH and KOH pellets in the reactor. After the
salts melt, nano-Fe3O4 is added to the electrolyte and then stirred. When the mixture is ready, the
lid is tightly closed and sealed. In order to yield NH3 in the reactor, H2, N2 and nano-Fe3O4 are
simultaneously needed. Table 2 shows the experimental conditions for four different runs.
Table 2 Experimental conditions for electrochemical ammonia synthesis
Experiment
#
Temperature
(°C)
Duration
(min)
Current density
(mA/cm2)
Voltage
(V)
1 210 15 2 1.4
2 255 30 3 1.5
3 215 45 2 1.3
4 220 25 2.5 1.55
Experiment 2 is performed at constant applied potential of 1.5 V whereas the others are performed
at constant current in galvanostatic mode. The temperatures given in the table are average
temperatures because, the temperature controller is on/off type and keeping the temperature
27
constant brings fluctuations. For each run, different ammonia trapping H2SO4 solution is used. The
unreacted H2 is also measured using a hydrogen sensor embedded to Arduino board which shows
the portion of H2 which does not react.
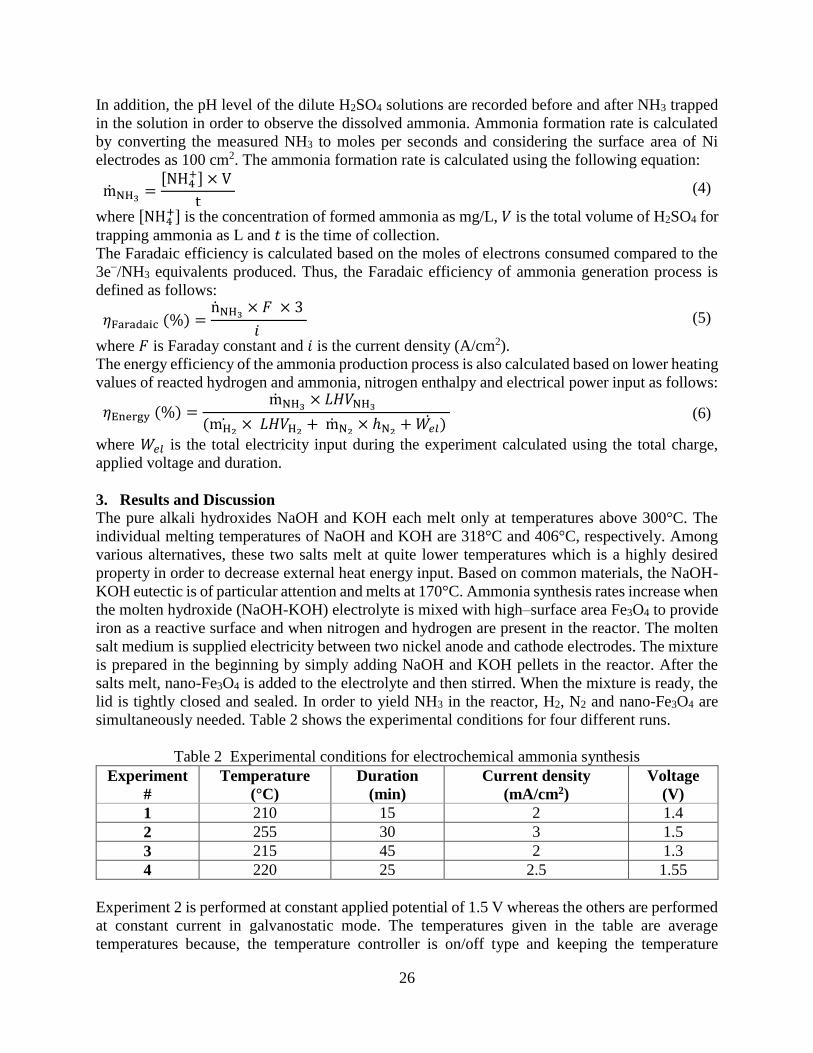
Figure 9 The experimental setup for the electrochemical ammonia synthesis in the fume hood
and solar light
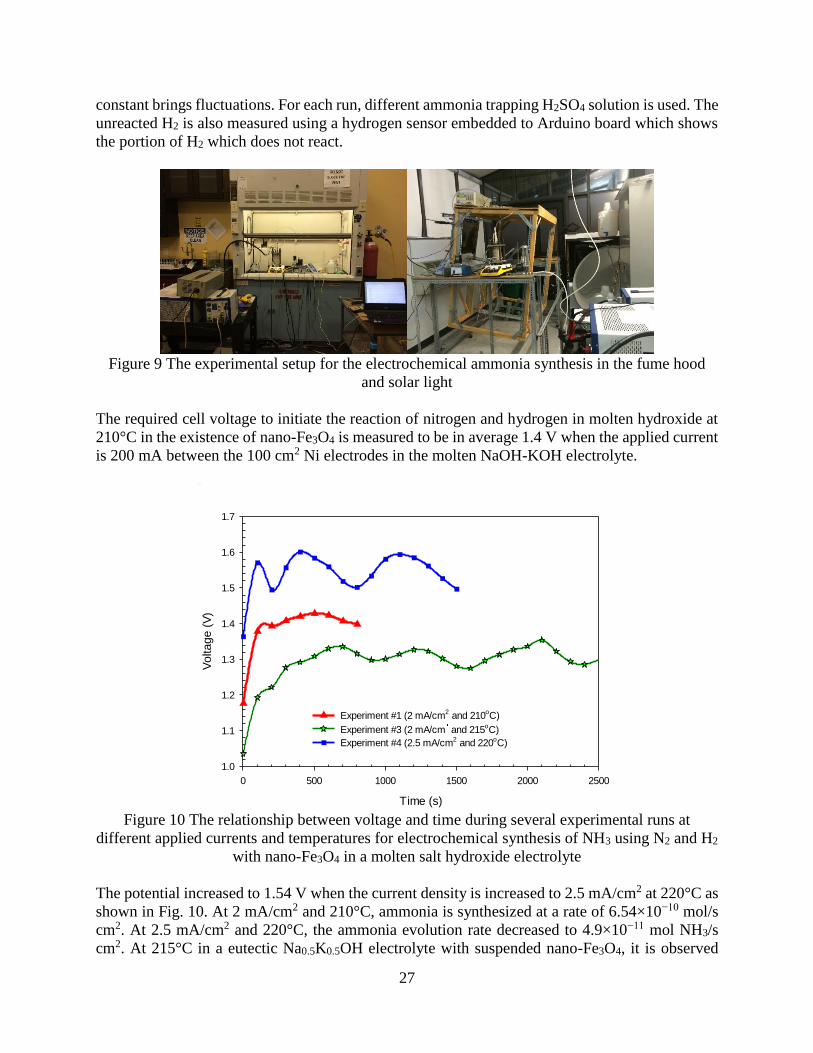
The required cell voltage to initiate the reaction of nitrogen and hydrogen in molten hydroxide at
210°C in the existence of nano-Fe3O4 is measured to be in average 1.4 V when the applied current
is 200 mA between the 100 cm2 Ni electrodes in the molten NaOH-KOH electrolyte.
Time (s)
0 500 1000 1500 2000 2500
Voltage (
V)
1.0
1.1
1.2
1.3
1.4
1.5
1.6
1.7
Experiment #1 (2 mA/cm2 and 210
oC)
Experiment #3 (2 mA/cm and 215oC)
Experiment #4 (2.5 mA/cm2 and 220
oC)
Figure 10 The relationship between voltage and time during several experimental runs at
different applied currents and temperatures for electrochemical synthesis of NH3 using N2 and H2
with nano-Fe3O4 in a molten salt hydroxide electrolyte
The potential increased to 1.54 V when the current density is increased to 2.5 mA/cm2 at 220°C as
shown in Fig. 10. At 2 mA/cm2 and 210°C, ammonia is synthesized at a rate of 6.54×10⁻¹⁰ mol/s
cm2. At 2.5 mA/cm2 and 220°C, the ammonia evolution rate decreased to 4.9×10⁻¹¹ mol NH3/s
cm2. At 215°C in a eutectic Na0.5K0.5OH electrolyte with suspended nano-Fe3O4, it is observed
28
that at 2 mA/cm2 applied current, NH3 is generated at a Faradaic efficiency of about 6.3%, which
declines to about 0.56% at 2.5 mA cm2 in the reactor temperature of 220°C. Constant current
electrolysis at 2 mA/cm2 and 2.5 mA/cm2 are driven at 1.3 V and 1.54 V, respectively at different
temperatures as depicted in Fig. 10. It is also observed in the experiments that even though the
reactor temperature is below 200°C, ammonia is generated with a similar production rate to above
200°C. The fluctuations in the potentials are caused by the temperature on/off processes to keep
the temperature constant during the experiments. When the heater is on, the required potential to
drive the reaction decreases as seen in Fig. 10. The potential gradually declines from 1.6 V to 1.5
V during the experiment at constant current density of 2.5 mA/cm2. It is observed in the
experiments that lower current density and lower temperature improve the stability of the rate of
NH3 evolution.
Time (s)
0 200 400 600 800 1000
Curr
ent d
ensity
(mA
/cm
2)
0.0
0.5
1.0
1.5
2.0
2.5
3.0
3.5
Current at 1.5 V applied potential
(Experiment #2)
Figure 11 Current density at 1.5 V applied voltage for 100 cm2 Ni electrodes of electrochemical
NH3 synthesis reactor
Fig. 11 shows the current density across the electrodes of the reactor when constant voltage
of 1.5 V is applied. In this case, in average 3 mA/cm2 current density is measured where the
reaction temperature is considerably higher than other experiments which is about 255°C. The
greater ammonia generation rate at lower voltages can be because of the lower hydrogen ion stream
at the cathode which provides more time for generation of ammonia according to reaction.
Higher NH3 synthesis rates are obtained within the first hour of the experiments. By the end of the
experiment which is close to about two hours, 5.69 mL of NH3 is formed.
The generated NH3 is trapped and measured in a room temperature dilute H2SO4 trap. A
non-dilute H2SO4 trap is also tried before the experiments reported here to understand the
absorptivity of the solution. However, the ammonia readings were not successful in this case.
Hence, dilute H2SO4 solutions are utilized for the reported experiments. The conversion efficiency
is not only dependent on the hydrogen amount but also amount of catalyst available to stimulate
the conversion of N2 and H2 into NH3. In order to make sure that there is enough N2 to be reacted
with supplied H2, the supplied volume of N2 is kept quite higher than H2.
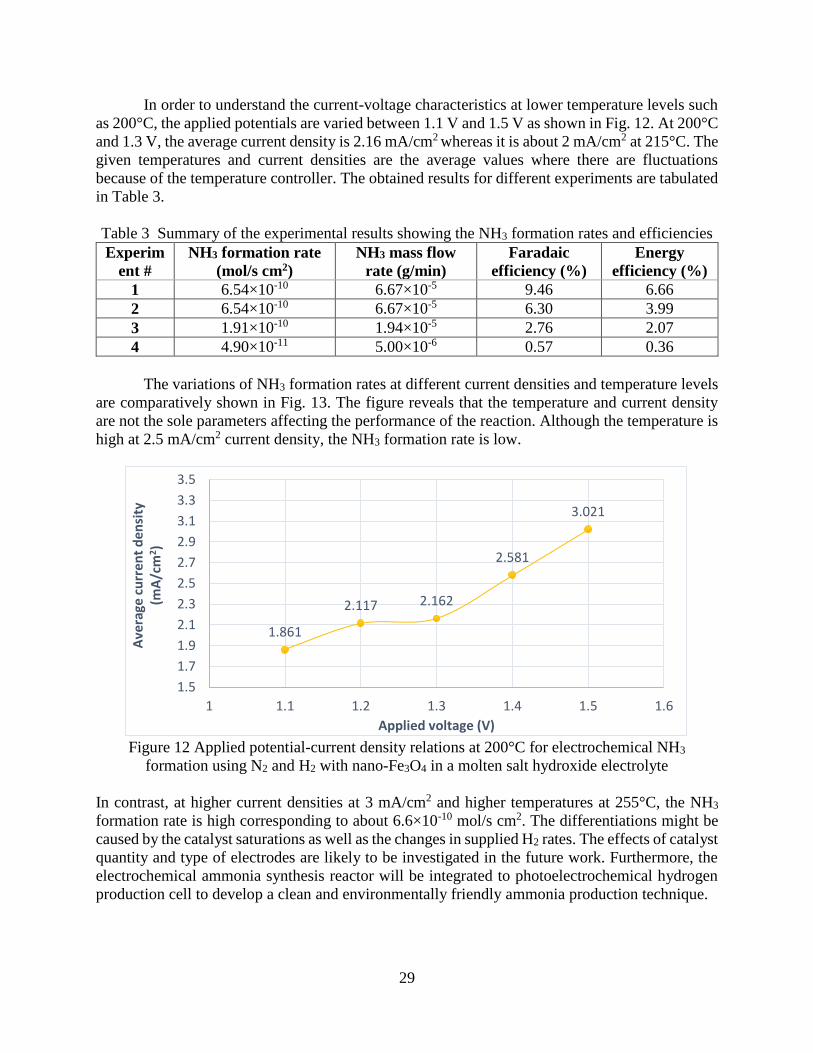
29
In order to understand the current-voltage characteristics at lower temperature levels such
as 200°C, the applied potentials are varied between 1.1 V and 1.5 V as shown in Fig. 12. At 200°C
and 1.3 V, the average current density is 2.16 mA/cm2 whereas it is about 2 mA/cm2 at 215°C. The
given temperatures and current densities are the average values where there are fluctuations
because of the temperature controller. The obtained results for different experiments are tabulated
in Table 3.
Table 3 Summary of the experimental results showing the NH3 formation rates and efficiencies
Experim
ent #
NH3 formation rate
(mol/s cm2)
NH3 mass flow
rate (g/min)
Faradaic
efficiency (%)
Energy
efficiency (%)
1 6.54×10⁻¹⁰ 6.67×10⁻⁵ 9.46 6.66
2 6.54×10⁻¹⁰ 6.67×10⁻⁵ 6.30 3.99
3 1.91×10⁻¹⁰ 1.94×10⁻⁵ 2.76 2.07
4 4.90×10⁻¹¹ 5.00×10⁻⁶ 0.57 0.36
The variations of NH3 formation rates at different current densities and temperature levels
are comparatively shown in Fig. 13. The figure reveals that the temperature and current density
are not the sole parameters affecting the performance of the reaction. Although the temperature is
high at 2.5 mA/cm2 current density, the NH3 formation rate is low.
Figure 12 Applied potential-current density relations at 200°C for electrochemical NH3
formation using N2 and H2 with nano-Fe3O4 in a molten salt hydroxide electrolyte
In contrast, at higher current densities at 3 mA/cm2 and higher temperatures at 255°C, the NH3
formation rate is high corresponding to about 6.6×10⁻¹⁰ mol/s cm2. The differentiations might be
caused by the catalyst saturations as well as the changes in supplied H2 rates. The effects of catalyst
quantity and type of electrodes are likely to be investigated in the future work. Furthermore, the
electrochemical ammonia synthesis reactor will be integrated to photoelectrochemical hydrogen
production cell to develop a clean and environmentally friendly ammonia production technique.
1.861
2.117 2.162
2.581
3.021
1.5
1.7
1.9
2.1
2.3
2.5
2.7
2.9
3.1
3.3
3.5
1 1.1 1.2 1.3 1.4 1.5 1.6
Ave
rage
cu
rre
nt
de
nsi
ty
(mA
/cm
2)
Applied voltage (V)
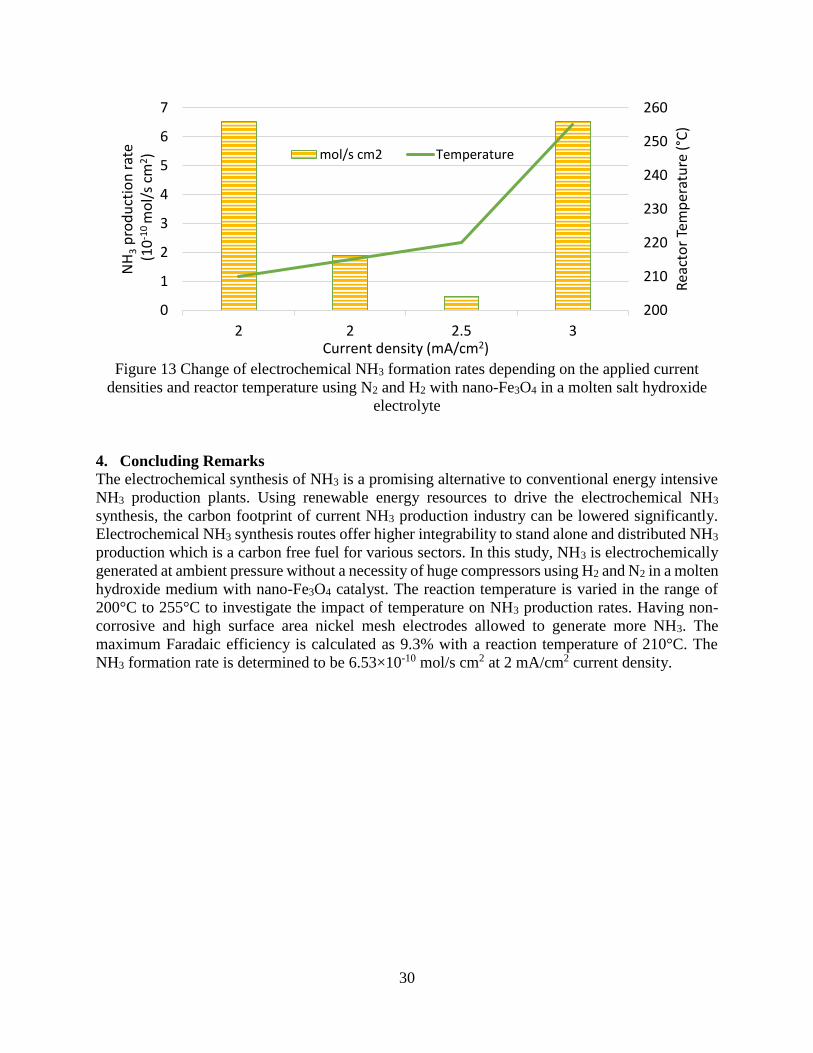
30
Figure 13 Change of electrochemical NH3 formation rates depending on the applied current
densities and reactor temperature using N2 and H2 with nano-Fe3O4 in a molten salt hydroxide
electrolyte
4. Concluding Remarks
The electrochemical synthesis of NH3 is a promising alternative to conventional energy intensive
NH3 production plants. Using renewable energy resources to drive the electrochemical NH3
synthesis, the carbon footprint of current NH3 production industry can be lowered significantly.
Electrochemical NH3 synthesis routes offer higher integrability to stand alone and distributed NH3
production which is a carbon free fuel for various sectors. In this study, NH3 is electrochemically
generated at ambient pressure without a necessity of huge compressors using H2 and N2 in a molten
hydroxide medium with nano-Fe3O4 catalyst. The reaction temperature is varied in the range of
200°C to 255°C to investigate the impact of temperature on NH3 production rates. Having non-
corrosive and high surface area nickel mesh electrodes allowed to generate more NH3. The
maximum Faradaic efficiency is calculated as 9.3% with a reaction temperature of 210°C. The
NH3 formation rate is determined to be 6.53×10⁻¹⁰ mol/s cm2 at 2 mA/cm2 current density.
200
210
220
230
240
250
260
0
1
2
3
4
5
6
7
2 2 2.5 3
Rea
cto
r Te
mp
erat
ure
(°C
)
NH
3p
rod
uct
ion
rat
e(1
0-1
0 m
ol/
s cm
2)
Current density (mA/cm2)
mol/s cm2 Temperature
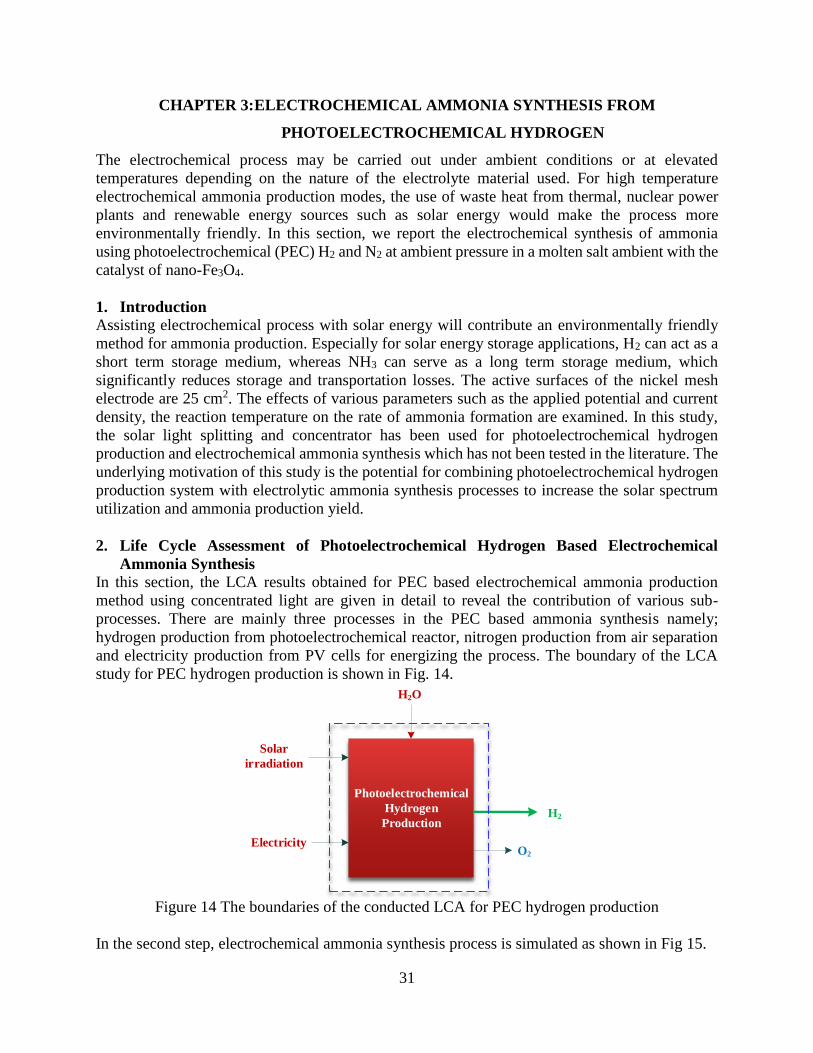
31
CHAPTER 3: ELECTROCHEMICAL AMMONIA SYNTHESIS FROM
PHOTOELECTROCHEMICAL HYDROGEN
The electrochemical process may be carried out under ambient conditions or at elevated
temperatures depending on the nature of the electrolyte material used. For high temperature
electrochemical ammonia production modes, the use of waste heat from thermal, nuclear power
plants and renewable energy sources such as solar energy would make the process more
environmentally friendly. In this section, we report the electrochemical synthesis of ammonia
using photoelectrochemical (PEC) H2 and N2 at ambient pressure in a molten salt ambient with the
catalyst of nano-Fe3O4.
1. Introduction
Assisting electrochemical process with solar energy will contribute an environmentally friendly
method for ammonia production. Especially for solar energy storage applications, H2 can act as a
short term storage medium, whereas NH3 can serve as a long term storage medium, which
significantly reduces storage and transportation losses. The active surfaces of the nickel mesh
electrode are 25 cm2. The effects of various parameters such as the applied potential and current
density, the reaction temperature on the rate of ammonia formation are examined. In this study,
the solar light splitting and concentrator has been used for photoelectrochemical hydrogen
production and electrochemical ammonia synthesis which has not been tested in the literature. The
underlying motivation of this study is the potential for combining photoelectrochemical hydrogen
production system with electrolytic ammonia synthesis processes to increase the solar spectrum
utilization and ammonia production yield.
2. Life Cycle Assessment of Photoelectrochemical Hydrogen Based Electrochemical
Ammonia Synthesis
In this section, the LCA results obtained for PEC based electrochemical ammonia production
method using concentrated light are given in detail to reveal the contribution of various sub-
processes. There are mainly three processes in the PEC based ammonia synthesis namely;
hydrogen production from photoelectrochemical reactor, nitrogen production from air separation
and electricity production from PV cells for energizing the process. The boundary of the LCA
study for PEC hydrogen production is shown in Fig. 14.
Photoelectrochemical
Hydrogen
Production
H2O
Electricity
H2
Solar
irradiation
O2
Figure 14 The boundaries of the conducted LCA for PEC hydrogen production
In the second step, electrochemical ammonia synthesis process is simulated as shown in Fig 15.
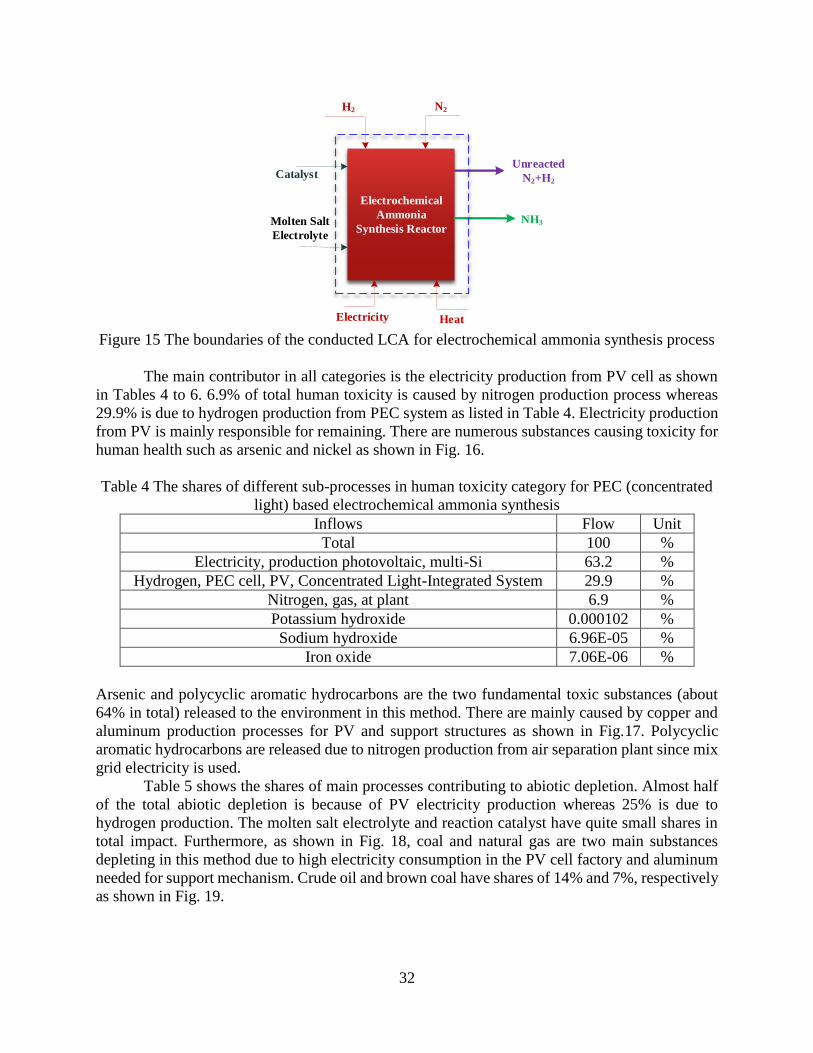
32
Electrochemical
Ammonia
Synthesis Reactor
N2H2
HeatElectricity
Molten Salt
Electrolyte
NH3
CatalystUnreacted
N2+H2
Figure 15 The boundaries of the conducted LCA for electrochemical ammonia synthesis process
The main contributor in all categories is the electricity production from PV cell as shown
in Tables 4 to 6. 6.9% of total human toxicity is caused by nitrogen production process whereas
29.9% is due to hydrogen production from PEC system as listed in Table 4. Electricity production
from PV is mainly responsible for remaining. There are numerous substances causing toxicity for
human health such as arsenic and nickel as shown in Fig. 16.
Table 4 The shares of different sub-processes in human toxicity category for PEC (concentrated
light) based electrochemical ammonia synthesis
Inflows Flow Unit
Total 100 %
Electricity, production photovoltaic, multi-Si 63.2 %
Hydrogen, PEC cell, PV, Concentrated Light-Integrated System 29.9 %
Nitrogen, gas, at plant 6.9 %
Potassium hydroxide 0.000102 %
Sodium hydroxide 6.96E-05 %
Iron oxide 7.06E-06 %
Arsenic and polycyclic aromatic hydrocarbons are the two fundamental toxic substances (about
64% in total) released to the environment in this method. There are mainly caused by copper and
aluminum production processes for PV and support structures as shown in Fig.17. Polycyclic
aromatic hydrocarbons are released due to nitrogen production from air separation plant since mix
grid electricity is used.
Table 5 shows the shares of main processes contributing to abiotic depletion. Almost half
of the total abiotic depletion is because of PV electricity production whereas 25% is due to
hydrogen production. The molten salt electrolyte and reaction catalyst have quite small shares in
total impact. Furthermore, as shown in Fig. 18, coal and natural gas are two main substances
depleting in this method due to high electricity consumption in the PV cell factory and aluminum
needed for support mechanism. Crude oil and brown coal have shares of 14% and 7%, respectively
as shown in Fig. 19.
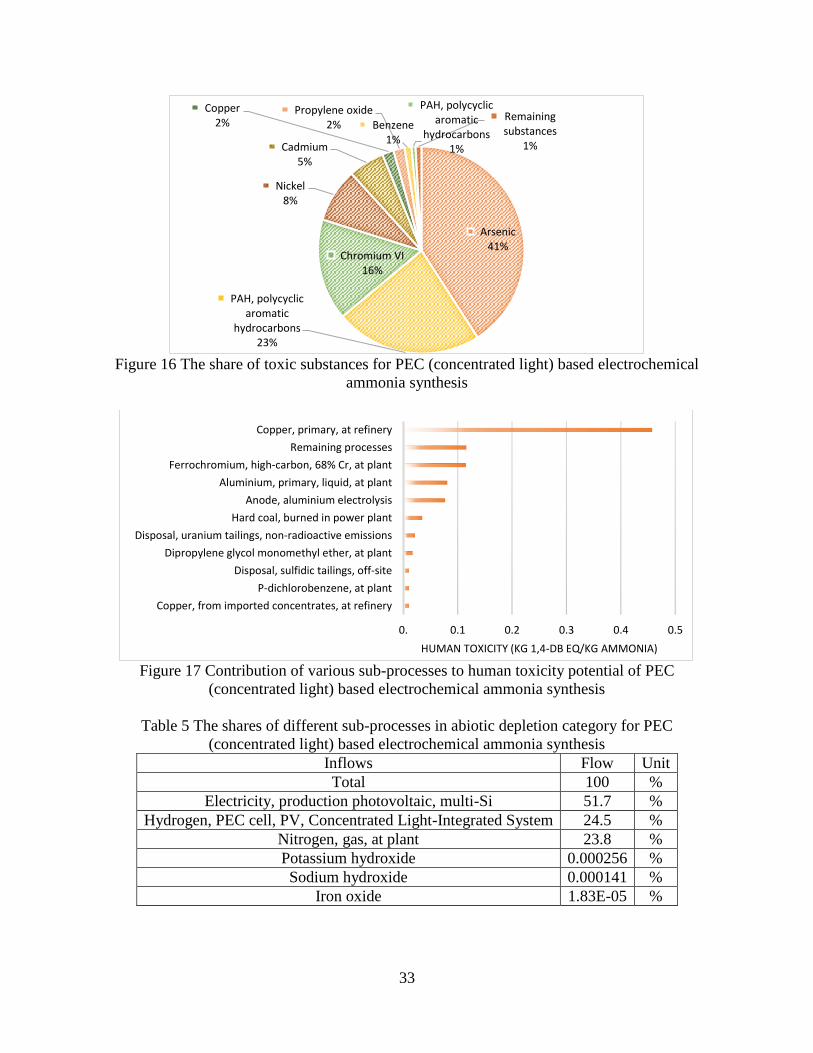
33
Figure 16 The share of toxic substances for PEC (concentrated light) based electrochemical
ammonia synthesis
Figure 17 Contribution of various sub-processes to human toxicity potential of PEC
(concentrated light) based electrochemical ammonia synthesis
Table 5 The shares of different sub-processes in abiotic depletion category for PEC
(concentrated light) based electrochemical ammonia synthesis
Inflows Flow Unit
Total 100 %
Electricity, production photovoltaic, multi-Si 51.7 %
Hydrogen, PEC cell, PV, Concentrated Light-Integrated System 24.5 %
Nitrogen, gas, at plant 23.8 %
Potassium hydroxide 0.000256 %
Sodium hydroxide 0.000141 %
Iron oxide 1.83E-05 %
Arsenic41%
PAH, polycyclic aromatic
hydrocarbons23%
Chromium VI16%
Nickel8%
Cadmium5%
Copper2%
Propylene oxide2% Benzene
1%
PAH, polycyclic aromatic
hydrocarbons1%
Remaining substances
1%
0. 0.1 0.2 0.3 0.4 0.5
Copper, from imported concentrates, at refinery
P-dichlorobenzene, at plant
Disposal, sulfidic tailings, off-site
Dipropylene glycol monomethyl ether, at plant
Disposal, uranium tailings, non-radioactive emissions
Hard coal, burned in power plant
Anode, aluminium electrolysis
Aluminium, primary, liquid, at plant
Ferrochromium, high-carbon, 68% Cr, at plant
Remaining processes
Copper, primary, at refinery
HUMAN TOXICITY (KG 1,4-DB EQ/KG AMMONIA)
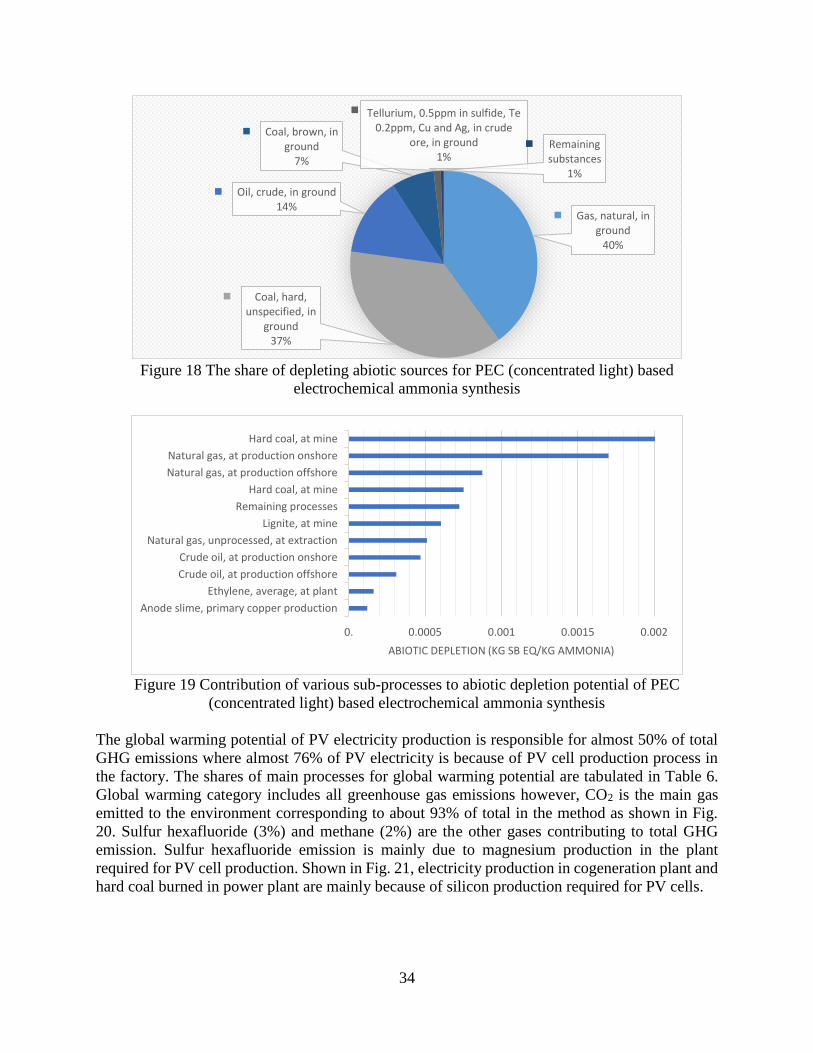
34
Figure 18 The share of depleting abiotic sources for PEC (concentrated light) based
electrochemical ammonia synthesis
Figure 19 Contribution of various sub-processes to abiotic depletion potential of PEC
(concentrated light) based electrochemical ammonia synthesis
The global warming potential of PV electricity production is responsible for almost 50% of total
GHG emissions where almost 76% of PV electricity is because of PV cell production process in
the factory. The shares of main processes for global warming potential are tabulated in Table 6.
Global warming category includes all greenhouse gas emissions however, CO2 is the main gas
emitted to the environment corresponding to about 93% of total in the method as shown in Fig.
20. Sulfur hexafluoride (3%) and methane (2%) are the other gases contributing to total GHG
emission. Sulfur hexafluoride emission is mainly due to magnesium production in the plant
required for PV cell production. Shown in Fig. 21, electricity production in cogeneration plant and
hard coal burned in power plant are mainly because of silicon production required for PV cells.
Gas, natural, in ground
40%
Coal, hard, unspecified, in
ground37%
Oil, crude, in ground14%
Coal, brown, in ground
7%
Tellurium, 0.5ppm in sulfide, Te 0.2ppm, Cu and Ag, in crude
ore, in ground1%
Remaining substances
1%
0. 0.0005 0.001 0.0015 0.002
Anode slime, primary copper production
Ethylene, average, at plant
Crude oil, at production offshore
Crude oil, at production onshore
Natural gas, unprocessed, at extraction
Lignite, at mine
Remaining processes
Hard coal, at mine
Natural gas, at production offshore
Natural gas, at production onshore
Hard coal, at mine
ABIOTIC DEPLETION (KG SB EQ/KG AMMONIA)
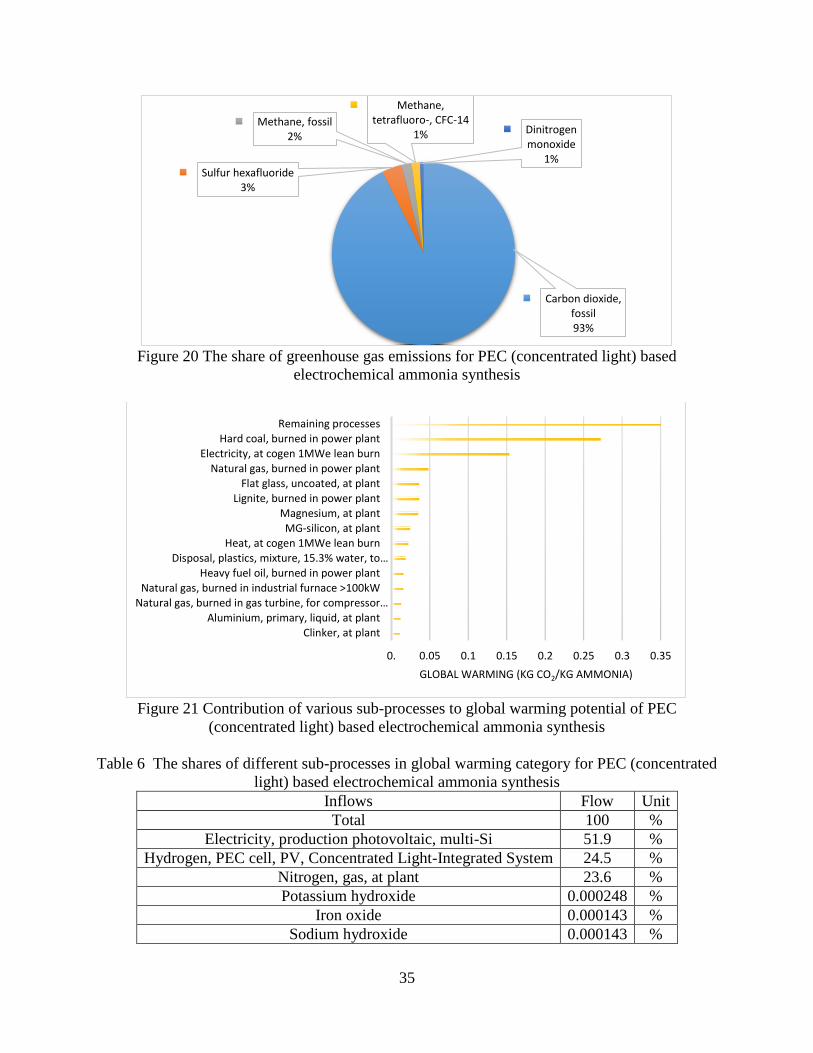
35
Figure 20 The share of greenhouse gas emissions for PEC (concentrated light) based
electrochemical ammonia synthesis
Figure 21 Contribution of various sub-processes to global warming potential of PEC
(concentrated light) based electrochemical ammonia synthesis
Table 6 The shares of different sub-processes in global warming category for PEC (concentrated
light) based electrochemical ammonia synthesis
Inflows Flow Unit
Total 100 %
Electricity, production photovoltaic, multi-Si 51.9 %
Hydrogen, PEC cell, PV, Concentrated Light-Integrated System 24.5 %
Nitrogen, gas, at plant 23.6 %
Potassium hydroxide 0.000248 %
Iron oxide 0.000143 %
Sodium hydroxide 0.000143 %
Carbon dioxide, fossil93%
Sulfur hexafluoride3%
Methane, fossil2%
Methane, tetrafluoro-, CFC-14
1% Dinitrogen monoxide
1%
0. 0.05 0.1 0.15 0.2 0.25 0.3 0.35
Clinker, at plantAluminium, primary, liquid, at plant
Natural gas, burned in gas turbine, for compressor…Natural gas, burned in industrial furnace >100kW
Heavy fuel oil, burned in power plantDisposal, plastics, mixture, 15.3% water, to…
Heat, at cogen 1MWe lean burnMG-silicon, at plant
Magnesium, at plantLignite, burned in power plant
Flat glass, uncoated, at plantNatural gas, burned in power plant
Electricity, at cogen 1MWe lean burnHard coal, burned in power plant
Remaining processes
GLOBAL WARMING (KG CO2/KG AMMONIA)
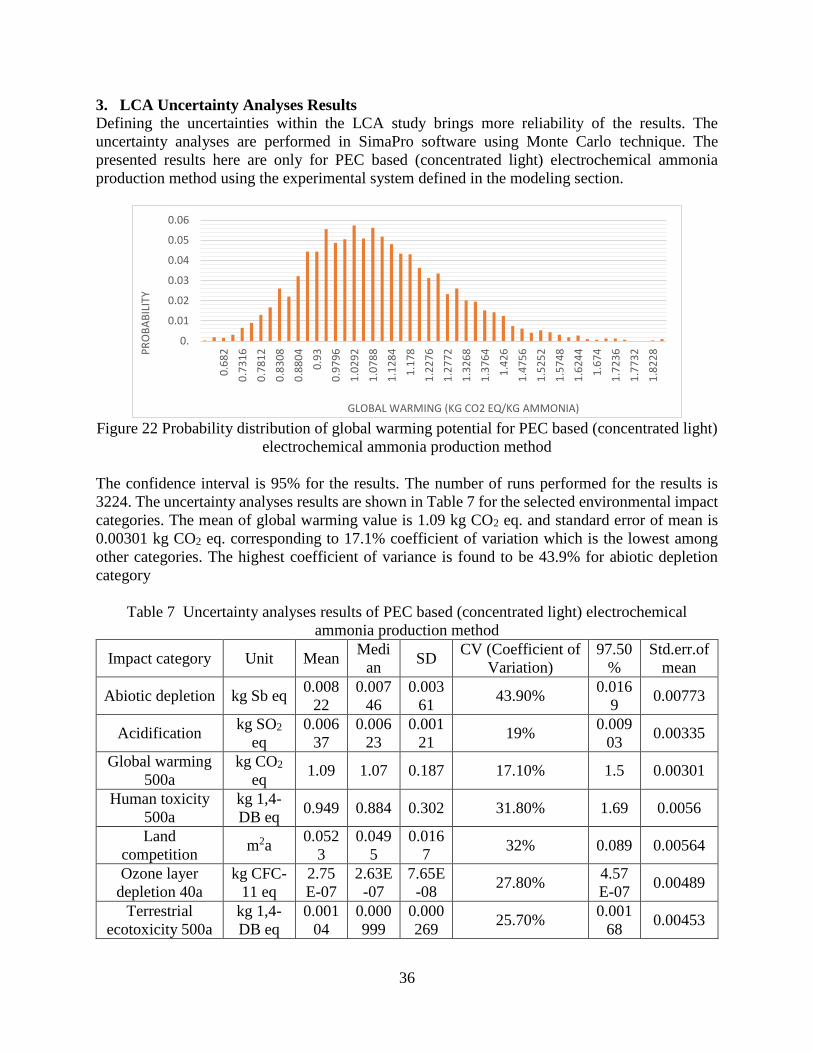
36
3. LCA Uncertainty Analyses Results
Defining the uncertainties within the LCA study brings more reliability of the results. The
uncertainty analyses are performed in SimaPro software using Monte Carlo technique. The
presented results here are only for PEC based (concentrated light) electrochemical ammonia
production method using the experimental system defined in the modeling section.
Figure 22 Probability distribution of global warming potential for PEC based (concentrated light)
electrochemical ammonia production method
The confidence interval is 95% for the results. The number of runs performed for the results is
3224. The uncertainty analyses results are shown in Table 7 for the selected environmental impact
categories. The mean of global warming value is 1.09 kg CO2 eq. and standard error of mean is
0.00301 kg CO2 eq. corresponding to 17.1% coefficient of variation which is the lowest among
other categories. The highest coefficient of variance is found to be 43.9% for abiotic depletion
category
Table 7 Uncertainty analyses results of PEC based (concentrated light) electrochemical
ammonia production method
Impact category Unit Mean Medi
an SD
CV (Coefficient of
Variation)
97.50
%
Std.err.of
mean
Abiotic depletion kg Sb eq 0.008
22
0.007
46
0.003
61 43.90%
0.016
9 0.00773
Acidification kg SO2
eq
0.006
37
0.006
23
0.001
21 19%
0.009
03 0.00335
Global warming
500a
kg CO2
eq 1.09 1.07 0.187 17.10% 1.5 0.00301
Human toxicity
500a
kg 1,4-
DB eq 0.949 0.884 0.302 31.80% 1.69 0.0056
Land
competition m2a
0.052
3
0.049
5
0.016
7 32% 0.089 0.00564
Ozone layer
depletion 40a
kg CFC-
11 eq
2.75
E-07
2.63E
-07
7.65E
-08 27.80%
4.57
E-07 0.00489
Terrestrial
ecotoxicity 500a
kg 1,4-
DB eq
0.001
04
0.000
999
0.000
269 25.70%
0.001
68 0.00453
0.
0.01
0.02
0.03
0.04
0.05
0.060
.68
2
0.7
31
6
0.7
81
2
0.8
30
8
0.8
80
4
0.9
3
0.9
79
6
1.0
29
2
1.0
78
8
1.1
28
4
1.1
78
1.2
27
6
1.2
77
2
1.3
26
8
1.3
76
4
1.4
26
1.4
75
6
1.5
25
2
1.5
74
8
1.6
24
4
1.6
74
1.7
23
6
1.7
73
2
1.8
22
8PR
OB
AB
ILIT
Y
GLOBAL WARMING (KG CO2 EQ/KG AMMONIA)
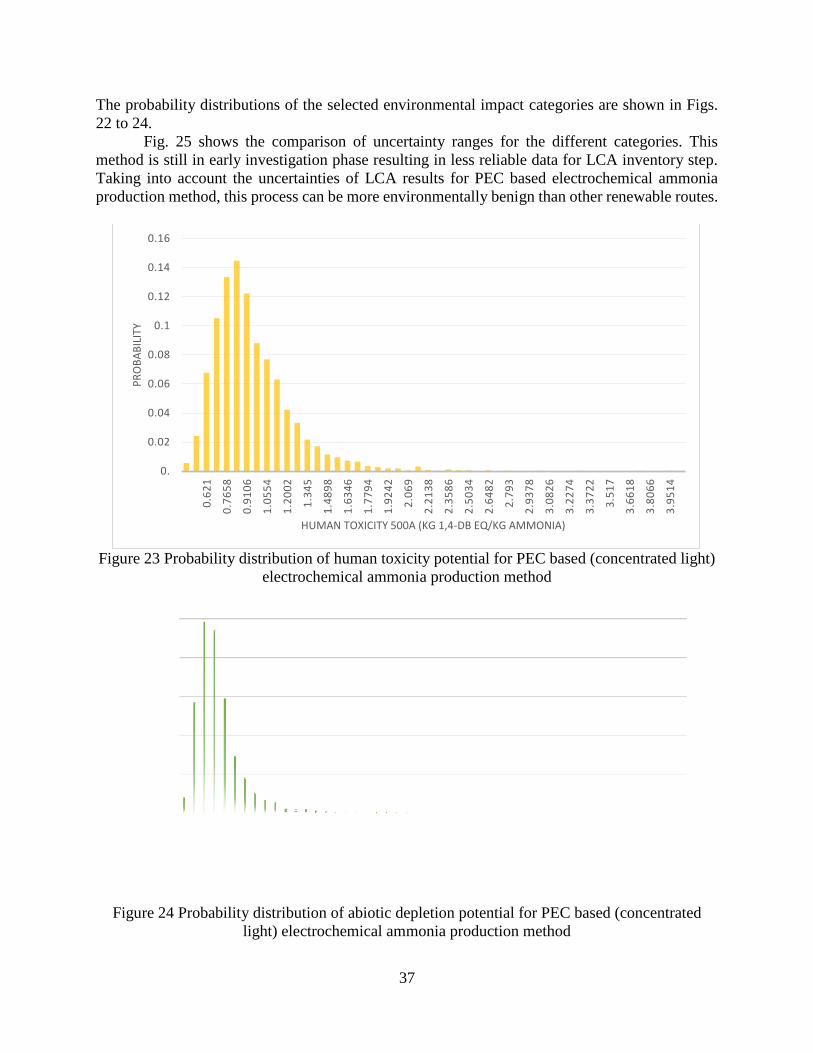
37
The probability distributions of the selected environmental impact categories are shown in Figs.
22 to 24.
Fig. 25 shows the comparison of uncertainty ranges for the different categories. This
method is still in early investigation phase resulting in less reliable data for LCA inventory step.
Taking into account the uncertainties of LCA results for PEC based electrochemical ammonia
production method, this process can be more environmentally benign than other renewable routes.
Figure 23 Probability distribution of human toxicity potential for PEC based (concentrated light)
electrochemical ammonia production method
Figure 24 Probability distribution of abiotic depletion potential for PEC based (concentrated
light) electrochemical ammonia production method
0.
0.02
0.04
0.06
0.08
0.1
0.12
0.14
0.16
0.6
21
0.7
65
8
0.9
10
6
1.0
55
4
1.2
00
2
1.3
45
1.4
89
8
1.6
34
6
1.7
79
4
1.9
24
2
2.0
69
2.2
13
8
2.3
58
6
2.5
03
4
2.6
48
2
2.7
93
2.9
37
8
3.0
82
6
3.2
27
4
3.3
72
2
3.5
17
3.6
61
8
3.8
06
6
3.9
51
4
PR
OB
AB
ILIT
Y
HUMAN TOXICITY 500A (KG 1,4-DB EQ/KG AMMONIA)
0.
0.05
0.1
0.15
0.2
0.25
0.0
06
46
5
0.0
08
75
7
0.0
11
04
9
0.0
13
34
1
0.0
15
63
3
0.0
17
92
5
0.0
20
21
7
0.0
22
50
9
0.0
24
80
1
0.0
27
09
3
0.0
29
38
5
0.0
31
67
7
0.0
33
96
9
0.0
36
26
1
0.0
38
55
3
0.0
40
84
5
0.0
43
13
7
0.0
45
42
9
0.0
47
72
1
0.0
50
01
3
0.0
52
30
5
0.0
54
59
7
0.0
56
88
9
0.0
59
18
1
PR
OB
AB
ILIT
Y
ABIOTIC DEPLETION (KG SB EQ/KG AMMONIA)
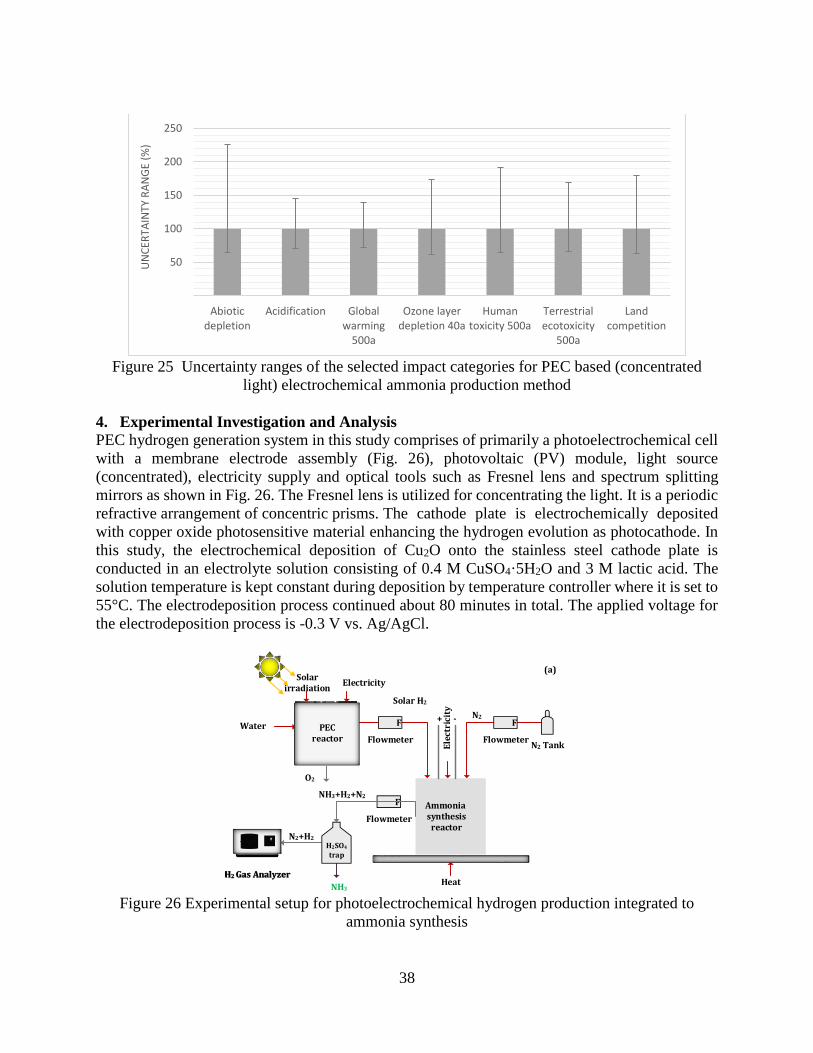
38
Figure 25 Uncertainty ranges of the selected impact categories for PEC based (concentrated
light) electrochemical ammonia production method
4. Experimental Investigation and Analysis
PEC hydrogen generation system in this study comprises of primarily a photoelectrochemical cell
with a membrane electrode assembly (Fig. 26), photovoltaic (PV) module, light source
(concentrated), electricity supply and optical tools such as Fresnel lens and spectrum splitting
mirrors as shown in Fig. 26. The Fresnel lens is utilized for concentrating the light. It is a periodic
refractive arrangement of concentric prisms. The cathode plate is electrochemically deposited
with copper oxide photosensitive material enhancing the hydrogen evolution as photocathode. In
this study, the electrochemical deposition of Cu2O onto the stainless steel cathode plate is
conducted in an electrolyte solution consisting of 0.4 M CuSO4·5H2O and 3 M lactic acid. The
solution temperature is kept constant during deposition by temperature controller where it is set to
55°C. The electrodeposition process continued about 80 minutes in total. The applied voltage for
the electrodeposition process is -0.3 V vs. Ag/AgCl.
N2
Solar H2
NH3+H2+N2
NH3Heat
+ -
Ele
ctri
city
N2+H2
Solar irradiation
Electricity
Water
O2
Ammonia synthesis
reactor
N2 Tank
F
Flowmeter
F
Flowmeter
F
Flowmeter
H2SO4 trap
H2 Gas Analyzer
(a)
PEC reactor
Figure 26 Experimental setup for photoelectrochemical hydrogen production integrated to
ammonia synthesis
50
100
150
200
250
Abioticdepletion
Acidification Globalwarming
500a
Ozone layerdepletion 40a
Humantoxicity 500a
Terrestrialecotoxicity
500a
Landcompetition
UN
CER
TAIN
TY R
AN
GE
(%)
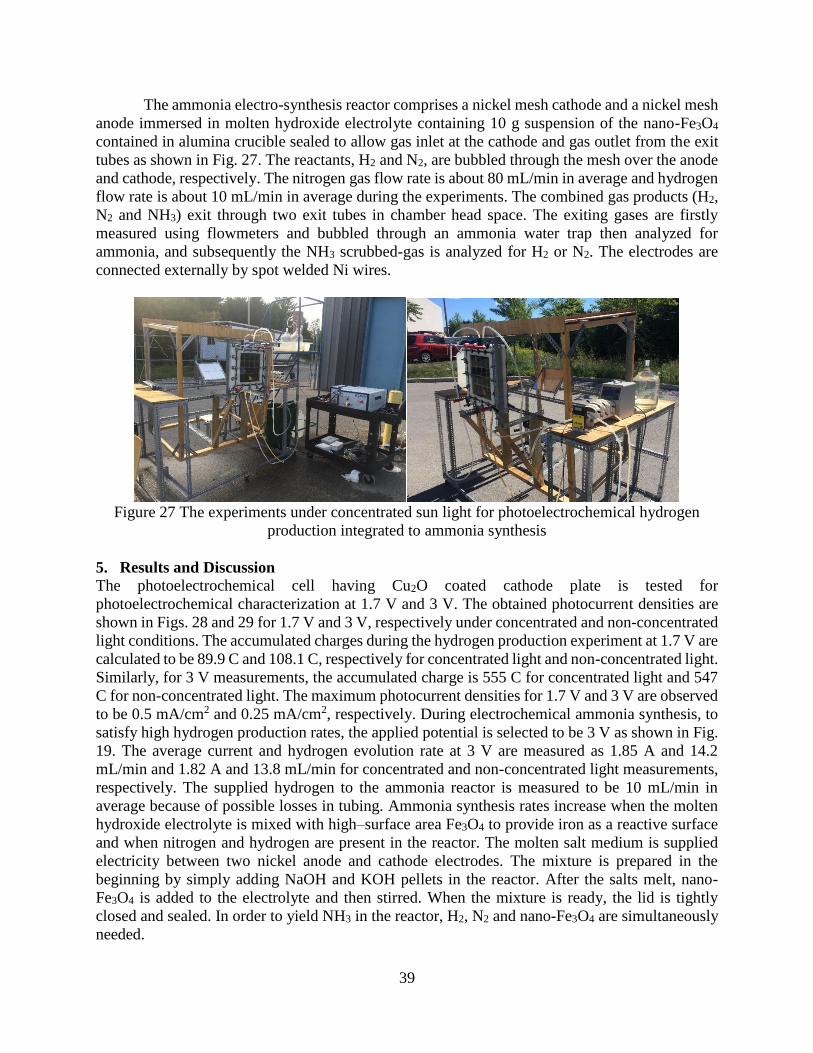
39
The ammonia electro-synthesis reactor comprises a nickel mesh cathode and a nickel mesh
anode immersed in molten hydroxide electrolyte containing 10 g suspension of the nano-Fe3O4
contained in alumina crucible sealed to allow gas inlet at the cathode and gas outlet from the exit
tubes as shown in Fig. 27. The reactants, H2 and N2, are bubbled through the mesh over the anode
and cathode, respectively. The nitrogen gas flow rate is about 80 mL/min in average and hydrogen
flow rate is about 10 mL/min in average during the experiments. The combined gas products (H2,
N2 and NH3) exit through two exit tubes in chamber head space. The exiting gases are firstly
measured using flowmeters and bubbled through an ammonia water trap then analyzed for
ammonia, and subsequently the NH3 scrubbed-gas is analyzed for H2 or N2. The electrodes are
connected externally by spot welded Ni wires.
Figure 27 The experiments under concentrated sun light for photoelectrochemical hydrogen
production integrated to ammonia synthesis
5. Results and Discussion
The photoelectrochemical cell having Cu2O coated cathode plate is tested for
photoelectrochemical characterization at 1.7 V and 3 V. The obtained photocurrent densities are
shown in Figs. 28 and 29 for 1.7 V and 3 V, respectively under concentrated and non-concentrated
light conditions. The accumulated charges during the hydrogen production experiment at 1.7 V are
calculated to be 89.9 C and 108.1 C, respectively for concentrated light and non-concentrated light.
Similarly, for 3 V measurements, the accumulated charge is 555 C for concentrated light and 547
C for non-concentrated light. The maximum photocurrent densities for 1.7 V and 3 V are observed
to be 0.5 mA/cm2 and 0.25 mA/cm2, respectively. During electrochemical ammonia synthesis, to
satisfy high hydrogen production rates, the applied potential is selected to be 3 V as shown in Fig.
19. The average current and hydrogen evolution rate at 3 V are measured as 1.85 A and 14.2
mL/min and 1.82 A and 13.8 mL/min for concentrated and non-concentrated light measurements,
respectively. The supplied hydrogen to the ammonia reactor is measured to be 10 mL/min in
average because of possible losses in tubing. Ammonia synthesis rates increase when the molten
hydroxide electrolyte is mixed with high–surface area Fe3O4 to provide iron as a reactive surface
and when nitrogen and hydrogen are present in the reactor. The molten salt medium is supplied
electricity between two nickel anode and cathode electrodes. The mixture is prepared in the
beginning by simply adding NaOH and KOH pellets in the reactor. After the salts melt, nano-
Fe3O4 is added to the electrolyte and then stirred. When the mixture is ready, the lid is tightly
closed and sealed. In order to yield NH3 in the reactor, H2, N2 and nano-Fe3O4 are simultaneously
needed.
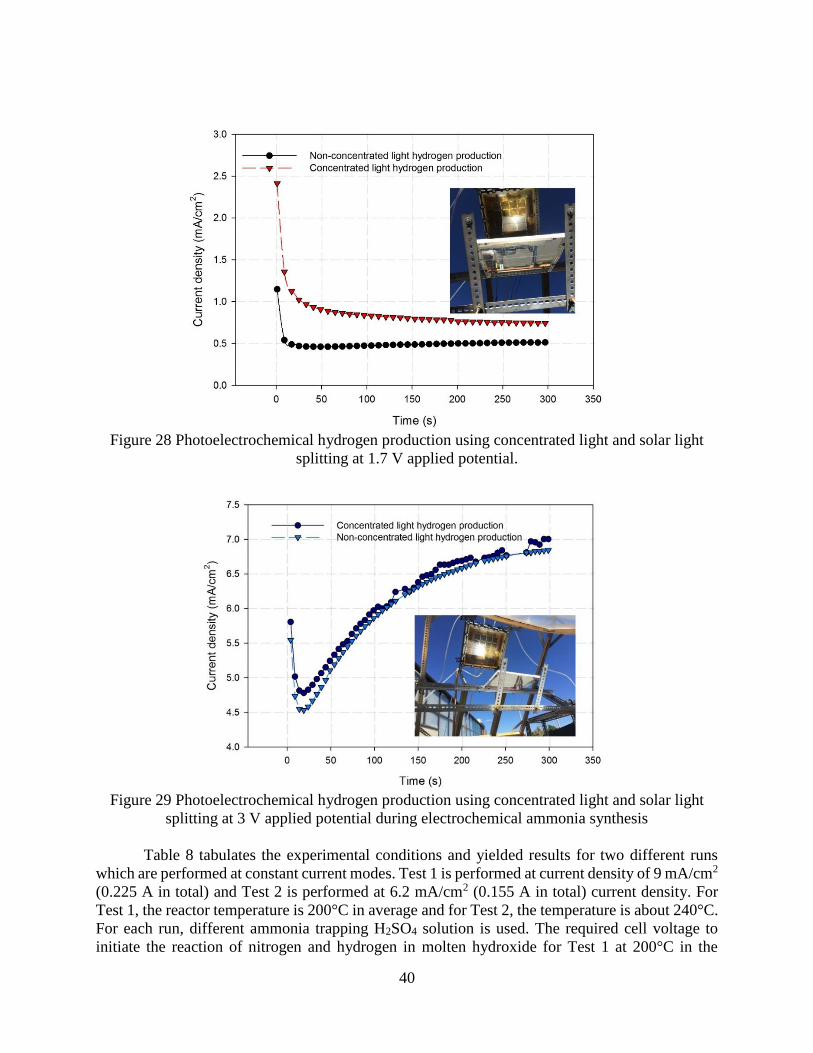
40
Figure 28 Photoelectrochemical hydrogen production using concentrated light and solar light
splitting at 1.7 V applied potential.
Figure 29 Photoelectrochemical hydrogen production using concentrated light and solar light
splitting at 3 V applied potential during electrochemical ammonia synthesis
Table 8 tabulates the experimental conditions and yielded results for two different runs
which are performed at constant current modes. Test 1 is performed at current density of 9 mA/cm2
(0.225 A in total) and Test 2 is performed at 6.2 mA/cm2 (0.155 A in total) current density. For
Test 1, the reactor temperature is 200°C in average and for Test 2, the temperature is about 240°C.
For each run, different ammonia trapping H2SO4 solution is used. The required cell voltage to
initiate the reaction of nitrogen and hydrogen in molten hydroxide for Test 1 at 200°C in the
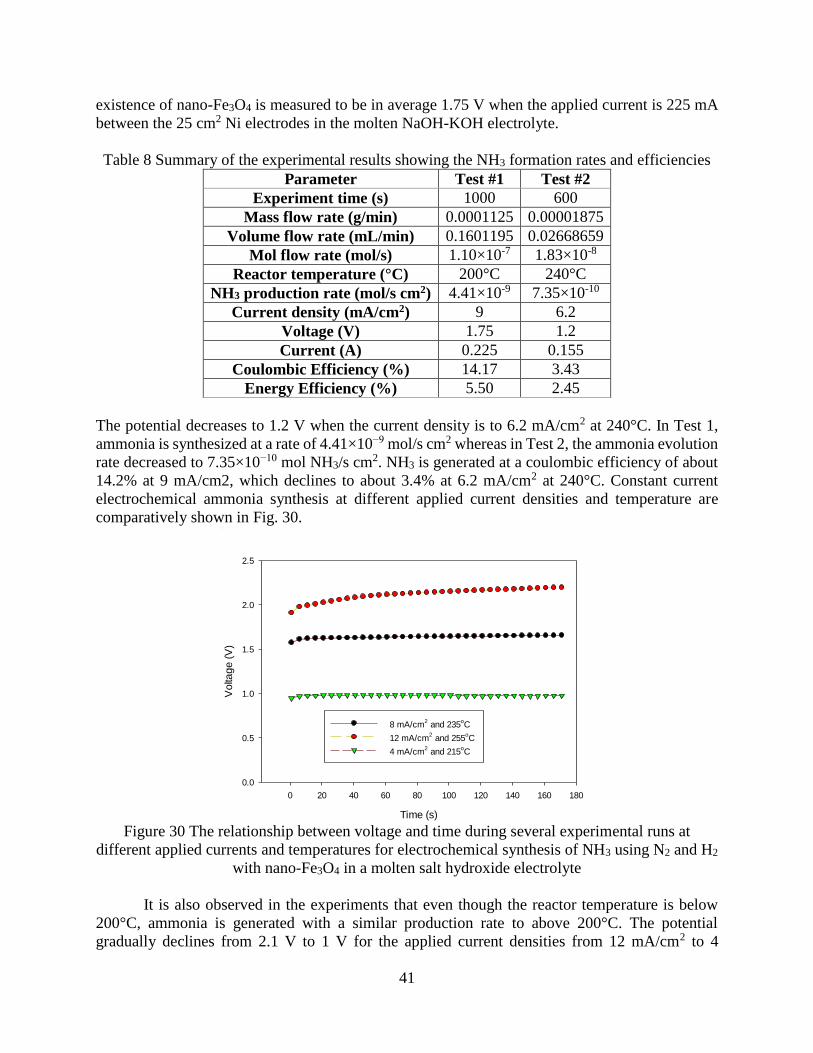
41
existence of nano-Fe3O4 is measured to be in average 1.75 V when the applied current is 225 mA
between the 25 cm2 Ni electrodes in the molten NaOH-KOH electrolyte.
Table 8 Summary of the experimental results showing the NH3 formation rates and efficiencies
Parameter Test #1 Test #2
Experiment time (s) 1000 600
Mass flow rate (g/min) 0.0001125 0.00001875
Volume flow rate (mL/min) 0.1601195 0.02668659
Mol flow rate (mol/s) 1.10×10⁻⁷ 1.83×10⁻⁸
Reactor temperature (°C) 200°C 240°C
NH3 production rate (mol/s cm2) 4.41×10⁻⁹ 7.35×10⁻¹⁰
Current density (mA/cm2) 9 6.2
Voltage (V) 1.75 1.2
Current (A) 0.225 0.155
Coulombic Efficiency (%) 14.17 3.43
Energy Efficiency (%) 5.50 2.45
The potential decreases to 1.2 V when the current density is to 6.2 mA/cm2 at 240°C. In Test 1,
ammonia is synthesized at a rate of 4.41×10⁻⁹ mol/s cm2 whereas in Test 2, the ammonia evolution
rate decreased to 7.35×10⁻¹⁰ mol NH3/s cm2. NH3 is generated at a coulombic efficiency of about
14.2% at 9 mA/cm2, which declines to about 3.4% at 6.2 mA/cm2 at 240°C. Constant current
electrochemical ammonia synthesis at different applied current densities and temperature are
comparatively shown in Fig. 30.
Time (s)
0 20 40 60 80 100 120 140 160 180
Vo
ltag
e (
V)
0.0
0.5
1.0
1.5
2.0
2.5
8 mA/cm2 and 235
oC
12 mA/cm2 and 255
oC
4 mA/cm2 and 215
oC
Figure 30 The relationship between voltage and time during several experimental runs at
different applied currents and temperatures for electrochemical synthesis of NH3 using N2 and H2
with nano-Fe3O4 in a molten salt hydroxide electrolyte
It is also observed in the experiments that even though the reactor temperature is below
200°C, ammonia is generated with a similar production rate to above 200°C. The potential
gradually declines from 2.1 V to 1 V for the applied current densities from 12 mA/cm2 to 4
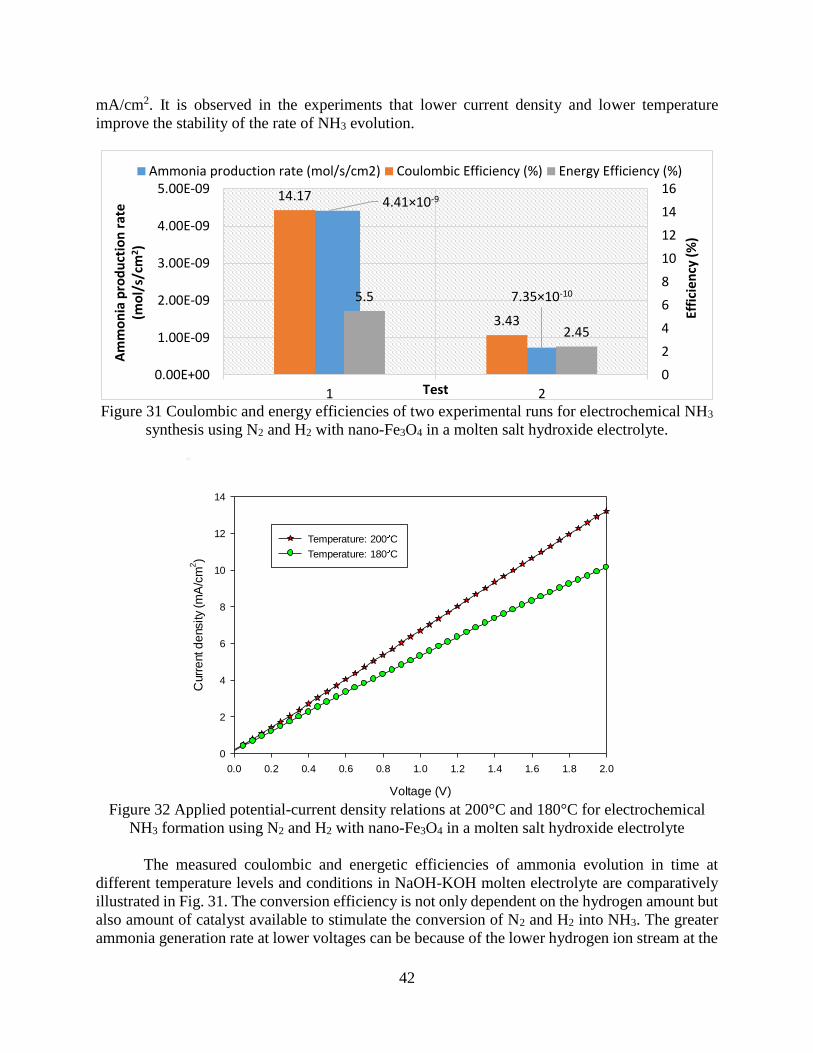
42
mA/cm2. It is observed in the experiments that lower current density and lower temperature
improve the stability of the rate of NH3 evolution.
Figure 31 Coulombic and energy efficiencies of two experimental runs for electrochemical NH3
synthesis using N2 and H2 with nano-Fe3O4 in a molten salt hydroxide electrolyte.
Voltage (V)
0.0 0.2 0.4 0.6 0.8 1.0 1.2 1.4 1.6 1.8 2.0
Curr
ent d
ensity
(mA
/cm
2)
0
2
4
6
8
10
12
14
Temperature: 200 C
Temperature: 180 C
Figure 32 Applied potential-current density relations at 200°C and 180°C for electrochemical
NH3 formation using N2 and H2 with nano-Fe3O4 in a molten salt hydroxide electrolyte
The measured coulombic and energetic efficiencies of ammonia evolution in time at
different temperature levels and conditions in NaOH-KOH molten electrolyte are comparatively
illustrated in Fig. 31. The conversion efficiency is not only dependent on the hydrogen amount but
also amount of catalyst available to stimulate the conversion of N2 and H2 into NH3. The greater
ammonia generation rate at lower voltages can be because of the lower hydrogen ion stream at the
4.41×10⁻⁹
7.35×10⁻¹⁰
14.17
3.43
5.5
2.45
0
2
4
6
8
10
12
14
16
0.00E+00
1.00E-09
2.00E-09
3.00E-09
4.00E-09
5.00E-09
1 2
Effi
cien
cy (
%)
Am
mo
nia
pro
du
ctio
n r
ate
(m
ol/
s/cm
2)
Test
Ammonia production rate (mol/s/cm2) Coulombic Efficiency (%) Energy Efficiency (%)
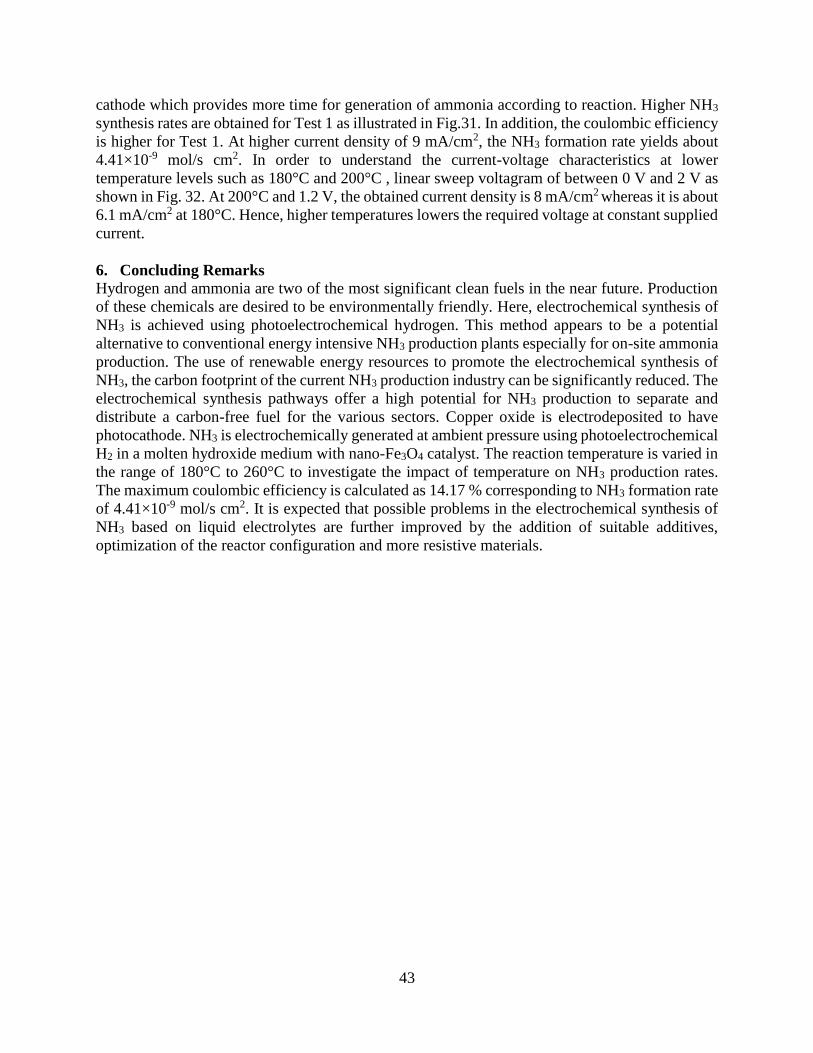
43
cathode which provides more time for generation of ammonia according to reaction. Higher NH3
synthesis rates are obtained for Test 1 as illustrated in Fig.31. In addition, the coulombic efficiency
is higher for Test 1. At higher current density of 9 mA/cm2, the NH3 formation rate yields about
4.41×10⁻⁹ mol/s cm2. In order to understand the current-voltage characteristics at lower
temperature levels such as 180°C and 200°C , linear sweep voltagram of between 0 V and 2 V as
shown in Fig. 32. At 200°C and 1.2 V, the obtained current density is 8 mA/cm2 whereas it is about
6.1 mA/cm2 at 180°C. Hence, higher temperatures lowers the required voltage at constant supplied
current.
6. Concluding Remarks
Hydrogen and ammonia are two of the most significant clean fuels in the near future. Production
of these chemicals are desired to be environmentally friendly. Here, electrochemical synthesis of
NH3 is achieved using photoelectrochemical hydrogen. This method appears to be a potential
alternative to conventional energy intensive NH3 production plants especially for on-site ammonia
production. The use of renewable energy resources to promote the electrochemical synthesis of
NH3, the carbon footprint of the current NH3 production industry can be significantly reduced. The
electrochemical synthesis pathways offer a high potential for NH3 production to separate and
distribute a carbon-free fuel for the various sectors. Copper oxide is electrodeposited to have
photocathode. NH3 is electrochemically generated at ambient pressure using photoelectrochemical
H2 in a molten hydroxide medium with nano-Fe3O4 catalyst. The reaction temperature is varied in
the range of 180°C to 260°C to investigate the impact of temperature on NH3 production rates.
The maximum coulombic efficiency is calculated as 14.17 % corresponding to NH3 formation rate
of 4.41×10⁻⁹ mol/s cm2. It is expected that possible problems in the electrochemical synthesis of
NH3 based on liquid electrolytes are further improved by the addition of suitable additives,
optimization of the reactor configuration and more resistive materials.
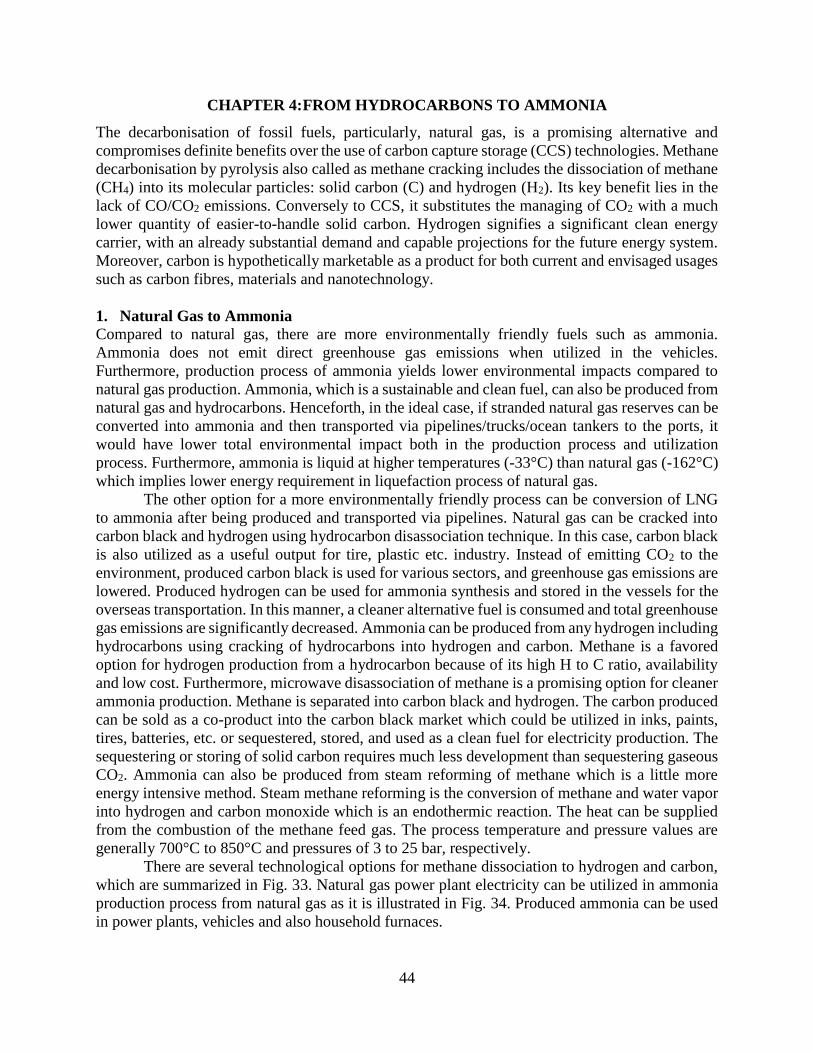
44
CHAPTER 4: FROM HYDROCARBONS TO AMMONIA
The decarbonisation of fossil fuels, particularly, natural gas, is a promising alternative and
compromises definite benefits over the use of carbon capture storage (CCS) technologies. Methane
decarbonisation by pyrolysis also called as methane cracking includes the dissociation of methane
(CH4) into its molecular particles: solid carbon (C) and hydrogen (H2). Its key benefit lies in the
lack of CO/CO2 emissions. Conversely to CCS, it substitutes the managing of CO2 with a much
lower quantity of easier-to-handle solid carbon. Hydrogen signifies a significant clean energy
carrier, with an already substantial demand and capable projections for the future energy system.
Moreover, carbon is hypothetically marketable as a product for both current and envisaged usages
such as carbon fibres, materials and nanotechnology.
1. Natural Gas to Ammonia
Compared to natural gas, there are more environmentally friendly fuels such as ammonia.
Ammonia does not emit direct greenhouse gas emissions when utilized in the vehicles.
Furthermore, production process of ammonia yields lower environmental impacts compared to
natural gas production. Ammonia, which is a sustainable and clean fuel, can also be produced from
natural gas and hydrocarbons. Henceforth, in the ideal case, if stranded natural gas reserves can be
converted into ammonia and then transported via pipelines/trucks/ocean tankers to the ports, it
would have lower total environmental impact both in the production process and utilization
process. Furthermore, ammonia is liquid at higher temperatures (-33°C) than natural gas (-162°C)
which implies lower energy requirement in liquefaction process of natural gas.
The other option for a more environmentally friendly process can be conversion of LNG
to ammonia after being produced and transported via pipelines. Natural gas can be cracked into
carbon black and hydrogen using hydrocarbon disassociation technique. In this case, carbon black
is also utilized as a useful output for tire, plastic etc. industry. Instead of emitting CO2 to the
environment, produced carbon black is used for various sectors, and greenhouse gas emissions are
lowered. Produced hydrogen can be used for ammonia synthesis and stored in the vessels for the
overseas transportation. In this manner, a cleaner alternative fuel is consumed and total greenhouse
gas emissions are significantly decreased. Ammonia can be produced from any hydrogen including
hydrocarbons using cracking of hydrocarbons into hydrogen and carbon. Methane is a favored
option for hydrogen production from a hydrocarbon because of its high H to C ratio, availability
and low cost. Furthermore, microwave disassociation of methane is a promising option for cleaner
ammonia production. Methane is separated into carbon black and hydrogen. The carbon produced
can be sold as a co-product into the carbon black market which could be utilized in inks, paints,
tires, batteries, etc. or sequestered, stored, and used as a clean fuel for electricity production. The
sequestering or storing of solid carbon requires much less development than sequestering gaseous
CO2. Ammonia can also be produced from steam reforming of methane which is a little more
energy intensive method. Steam methane reforming is the conversion of methane and water vapor
into hydrogen and carbon monoxide which is an endothermic reaction. The heat can be supplied
from the combustion of the methane feed gas. The process temperature and pressure values are
generally 700°C to 850°C and pressures of 3 to 25 bar, respectively.
There are several technological options for methane dissociation to hydrogen and carbon,
which are summarized in Fig. 33. Natural gas power plant electricity can be utilized in ammonia
production process from natural gas as it is illustrated in Fig. 34. Produced ammonia can be used
in power plants, vehicles and also household furnaces.
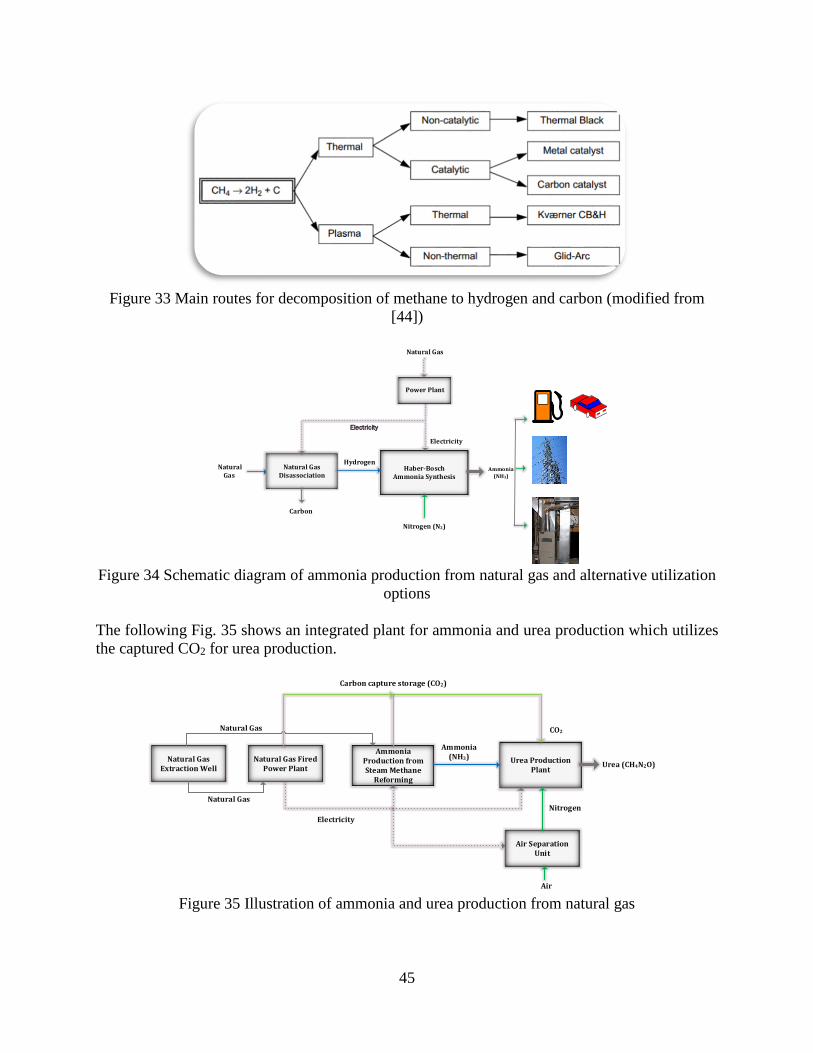
45
Figure 33 Main routes for decomposition of methane to hydrogen and carbon (modified from
[44])
Haber-Bosch Ammonia Synthesis
Natural Gas
Electricity
Power Plant
Natural Gas
Ammonia (NH3)
Natural Gas Disassociation
Carbon
Hydrogen
Nitrogen (N2)
Electricity
Figure 34 Schematic diagram of ammonia production from natural gas and alternative utilization
options
The following Fig. 35 shows an integrated plant for ammonia and urea production which utilizes
the captured CO2 for urea production.
Urea Production Plant
Electricity
Ammonia (NH3)Natural Gas Fired
Power Plant
Ammonia Production from Steam Methane
Reforming
Air Separation Unit
Air
Nitrogen
Carbon capture storage (CO2)
Urea (CH4N2O)Natural Gas
Extraction Well
Natural Gas
Natural Gas
CO2
Figure 35 Illustration of ammonia and urea production from natural gas
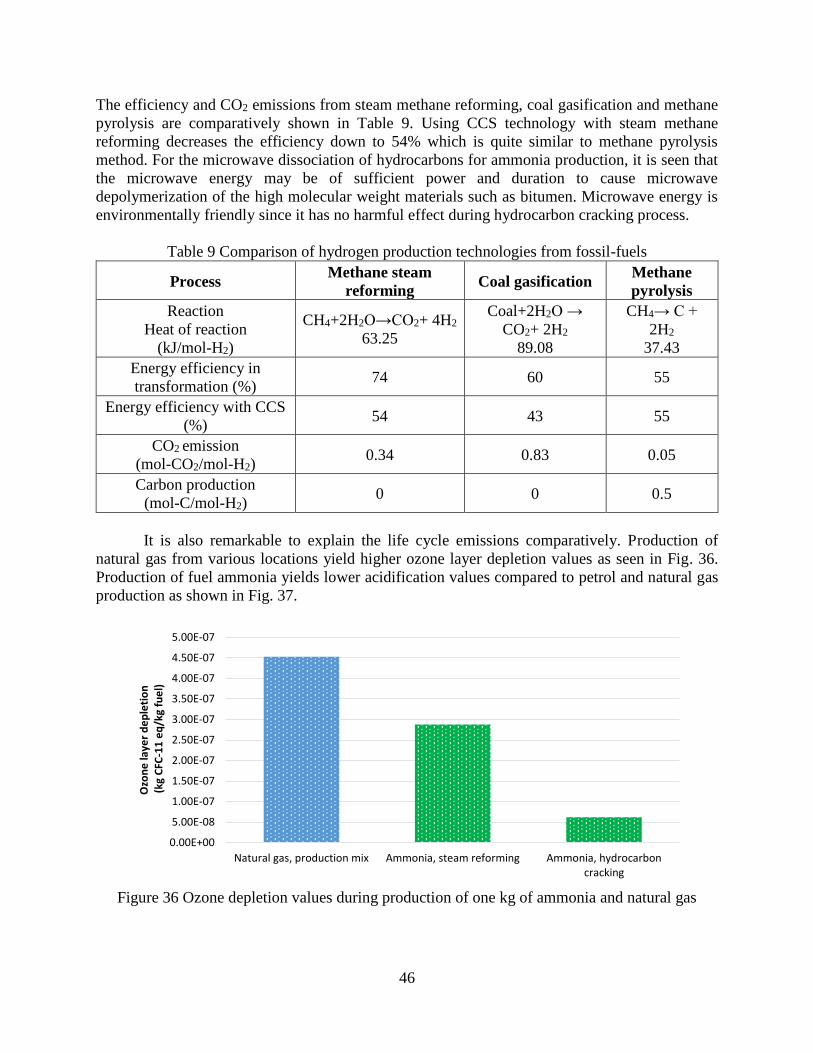
46
The efficiency and CO2 emissions from steam methane reforming, coal gasification and methane
pyrolysis are comparatively shown in Table 9. Using CCS technology with steam methane
reforming decreases the efficiency down to 54% which is quite similar to methane pyrolysis
method. For the microwave dissociation of hydrocarbons for ammonia production, it is seen that
the microwave energy may be of sufficient power and duration to cause microwave
depolymerization of the high molecular weight materials such as bitumen. Microwave energy is
environmentally friendly since it has no harmful effect during hydrocarbon cracking process.
Table 9 Comparison of hydrogen production technologies from fossil-fuels
Process Methane steam
reforming Coal gasification
Methane
pyrolysis
Reaction
Heat of reaction
(kJ/mol-H2)
CH4+2H2O→CO2+ 4H2
63.25
Coal+2H2O →
CO2+ 2H2
89.08
CH4→ C +
2H2
37.43
Energy efficiency in
transformation (%) 74 60 55
Energy efficiency with CCS
(%) 54 43 55
CO2 emission
(mol-CO2/mol-H2) 0.34 0.83 0.05
Carbon production
(mol-C/mol-H2) 0 0 0.5
It is also remarkable to explain the life cycle emissions comparatively. Production of
natural gas from various locations yield higher ozone layer depletion values as seen in Fig. 36.
Production of fuel ammonia yields lower acidification values compared to petrol and natural gas
production as shown in Fig. 37.
Figure 36 Ozone depletion values during production of one kg of ammonia and natural gas
0.00E+00
5.00E-08
1.00E-07
1.50E-07
2.00E-07
2.50E-07
3.00E-07
3.50E-07
4.00E-07
4.50E-07
5.00E-07
Natural gas, production mix Ammonia, steam reforming Ammonia, hydrocarboncracking
Ozo
ne
laye
r d
ep
leti
on
(kg
CFC
-11
eq
/kg
fue
l)
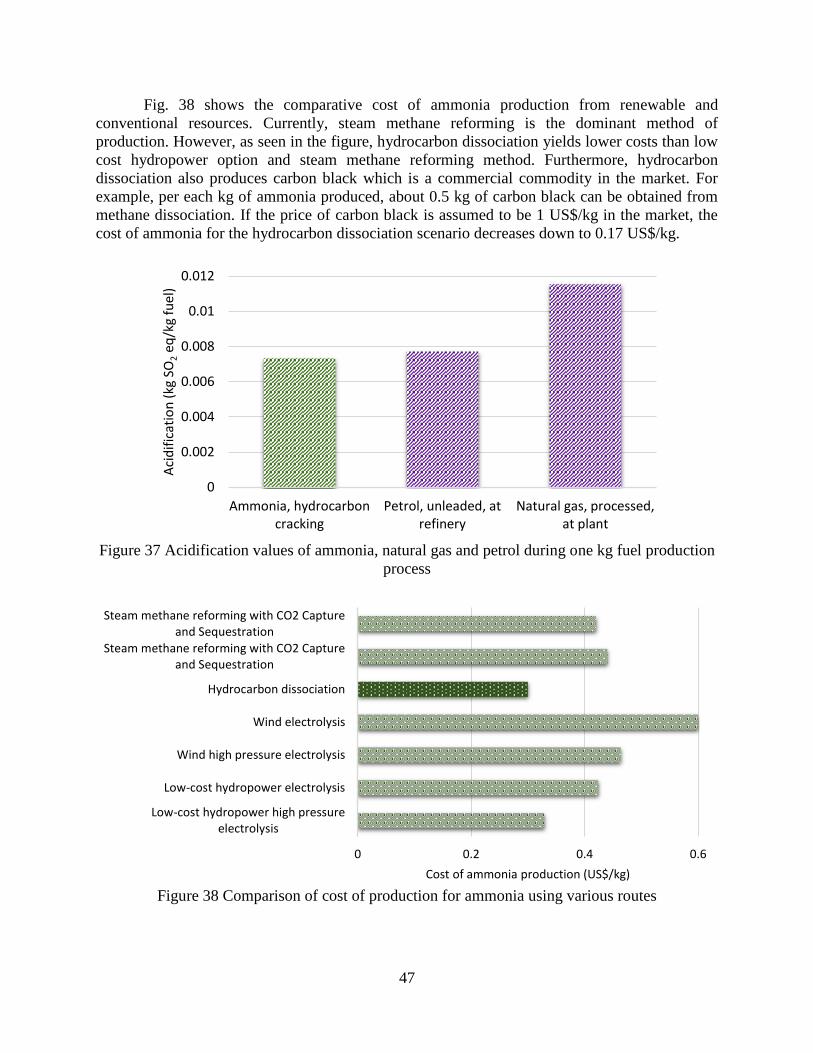
47
Fig. 38 shows the comparative cost of ammonia production from renewable and
conventional resources. Currently, steam methane reforming is the dominant method of
production. However, as seen in the figure, hydrocarbon dissociation yields lower costs than low
cost hydropower option and steam methane reforming method. Furthermore, hydrocarbon
dissociation also produces carbon black which is a commercial commodity in the market. For
example, per each kg of ammonia produced, about 0.5 kg of carbon black can be obtained from
methane dissociation. If the price of carbon black is assumed to be 1 US$/kg in the market, the
cost of ammonia for the hydrocarbon dissociation scenario decreases down to 0.17 US$/kg.
Figure 37 Acidification values of ammonia, natural gas and petrol during one kg fuel production
process
Figure 38 Comparison of cost of production for ammonia using various routes
0
0.002
0.004
0.006
0.008
0.01
0.012
Ammonia, hydrocarboncracking
Petrol, unleaded, atrefinery
Natural gas, processed,at plant
Aci
dif
icat
ion
(kg
SO
2eq
/kg
fuel
)
0 0.2 0.4 0.6
Low-cost hydropower high pressureelectrolysis
Low-cost hydropower electrolysis
Wind high pressure electrolysis
Wind electrolysis
Hydrocarbon dissociation
Steam methane reforming with CO2 Captureand Sequestration
Steam methane reforming with CO2 Captureand Sequestration
Cost of ammonia production (US$/kg)
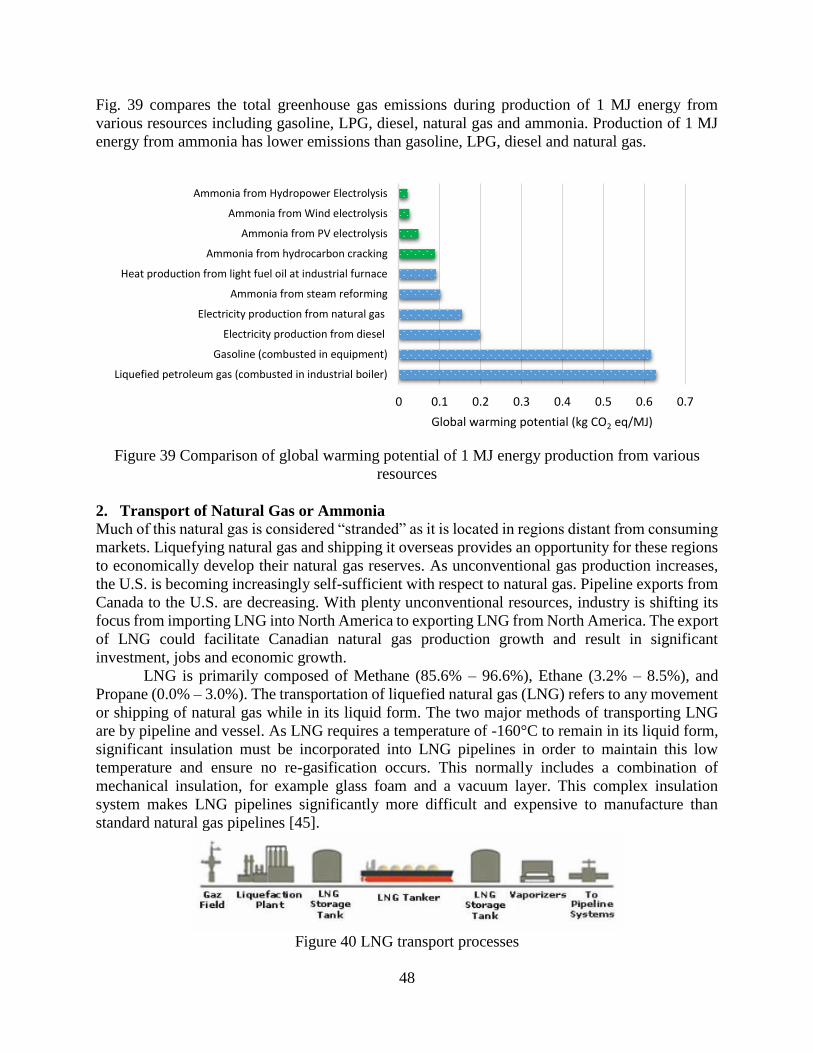
48
Fig. 39 compares the total greenhouse gas emissions during production of 1 MJ energy from
various resources including gasoline, LPG, diesel, natural gas and ammonia. Production of 1 MJ
energy from ammonia has lower emissions than gasoline, LPG, diesel and natural gas.
Figure 39 Comparison of global warming potential of 1 MJ energy production from various
resources
2. Transport of Natural Gas or Ammonia
Much of this natural gas is considered “stranded” as it is located in regions distant from consuming
markets. Liquefying natural gas and shipping it overseas provides an opportunity for these regions
to economically develop their natural gas reserves. As unconventional gas production increases,
the U.S. is becoming increasingly self-sufficient with respect to natural gas. Pipeline exports from
Canada to the U.S. are decreasing. With plenty unconventional resources, industry is shifting its
focus from importing LNG into North America to exporting LNG from North America. The export
of LNG could facilitate Canadian natural gas production growth and result in significant
investment, jobs and economic growth.
LNG is primarily composed of Methane (85.6% – 96.6%), Ethane (3.2% – 8.5%), and
Propane (0.0% – 3.0%). The transportation of liquefied natural gas (LNG) refers to any movement
or shipping of natural gas while in its liquid form. The two major methods of transporting LNG
are by pipeline and vessel. As LNG requires a temperature of -160°C to remain in its liquid form,
significant insulation must be incorporated into LNG pipelines in order to maintain this low
temperature and ensure no re-gasification occurs. This normally includes a combination of
mechanical insulation, for example glass foam and a vacuum layer. This complex insulation
system makes LNG pipelines significantly more difficult and expensive to manufacture than
standard natural gas pipelines [45].
Figure 40 LNG transport processes
0 0.1 0.2 0.3 0.4 0.5 0.6 0.7
Liquefied petroleum gas (combusted in industrial boiler)
Gasoline (combusted in equipment)
Electricity production from diesel
Electricity production from natural gas
Ammonia from steam reforming
Heat production from light fuel oil at industrial furnace
Ammonia from hydrocarbon cracking
Ammonia from PV electrolysis
Ammonia from Wind electrolysis
Ammonia from Hydropower Electrolysis
Global warming potential (kg CO2 eq/MJ)
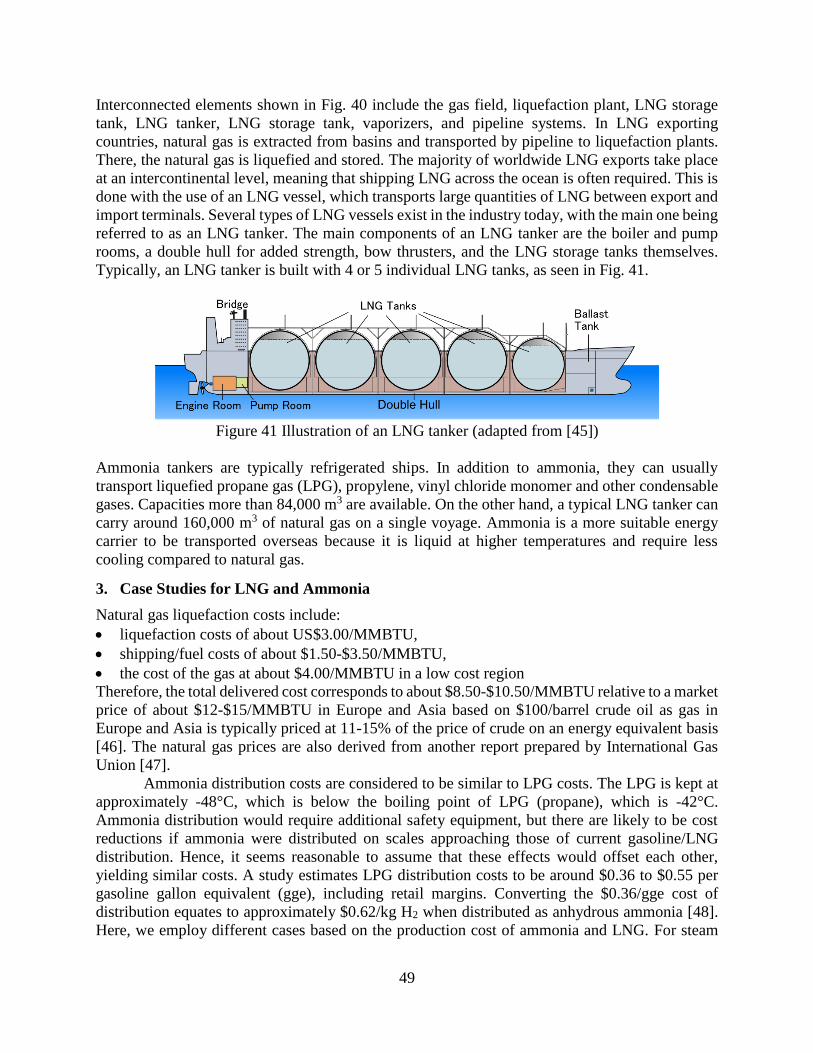
49
Interconnected elements shown in Fig. 40 include the gas field, liquefaction plant, LNG storage
tank, LNG tanker, LNG storage tank, vaporizers, and pipeline systems. In LNG exporting
countries, natural gas is extracted from basins and transported by pipeline to liquefaction plants.
There, the natural gas is liquefied and stored. The majority of worldwide LNG exports take place
at an intercontinental level, meaning that shipping LNG across the ocean is often required. This is
done with the use of an LNG vessel, which transports large quantities of LNG between export and
import terminals. Several types of LNG vessels exist in the industry today, with the main one being
referred to as an LNG tanker. The main components of an LNG tanker are the boiler and pump
rooms, a double hull for added strength, bow thrusters, and the LNG storage tanks themselves.
Typically, an LNG tanker is built with 4 or 5 individual LNG tanks, as seen in Fig. 41.
Figure 41 Illustration of an LNG tanker (adapted from [45])
Ammonia tankers are typically refrigerated ships. In addition to ammonia, they can usually
transport liquefied propane gas (LPG), propylene, vinyl chloride monomer and other condensable
gases. Capacities more than 84,000 m3 are available. On the other hand, a typical LNG tanker can
carry around 160,000 m3 of natural gas on a single voyage. Ammonia is a more suitable energy
carrier to be transported overseas because it is liquid at higher temperatures and require less
cooling compared to natural gas.
3. Case Studies for LNG and Ammonia
Natural gas liquefaction costs include:
liquefaction costs of about US$3.00/MMBTU,
shipping/fuel costs of about $1.50-$3.50/MMBTU,
the cost of the gas at about $4.00/MMBTU in a low cost region
Therefore, the total delivered cost corresponds to about $8.50-$10.50/MMBTU relative to a market
price of about $12-$15/MMBTU in Europe and Asia based on $100/barrel crude oil as gas in
Europe and Asia is typically priced at 11-15% of the price of crude on an energy equivalent basis
[46]. The natural gas prices are also derived from another report prepared by International Gas
Union [47].
Ammonia distribution costs are considered to be similar to LPG costs. The LPG is kept at
approximately -48°C, which is below the boiling point of LPG (propane), which is -42°C.
Ammonia distribution would require additional safety equipment, but there are likely to be cost
reductions if ammonia were distributed on scales approaching those of current gasoline/LNG
distribution. Hence, it seems reasonable to assume that these effects would offset each other,
yielding similar costs. A study estimates LPG distribution costs to be around $0.36 to $0.55 per
gasoline gallon equivalent (gge), including retail margins. Converting the $0.36/gge cost of
distribution equates to approximately $0.62/kg H2 when distributed as anhydrous ammonia [48].
Here, we employ different cases based on the production cost of ammonia and LNG. For steam
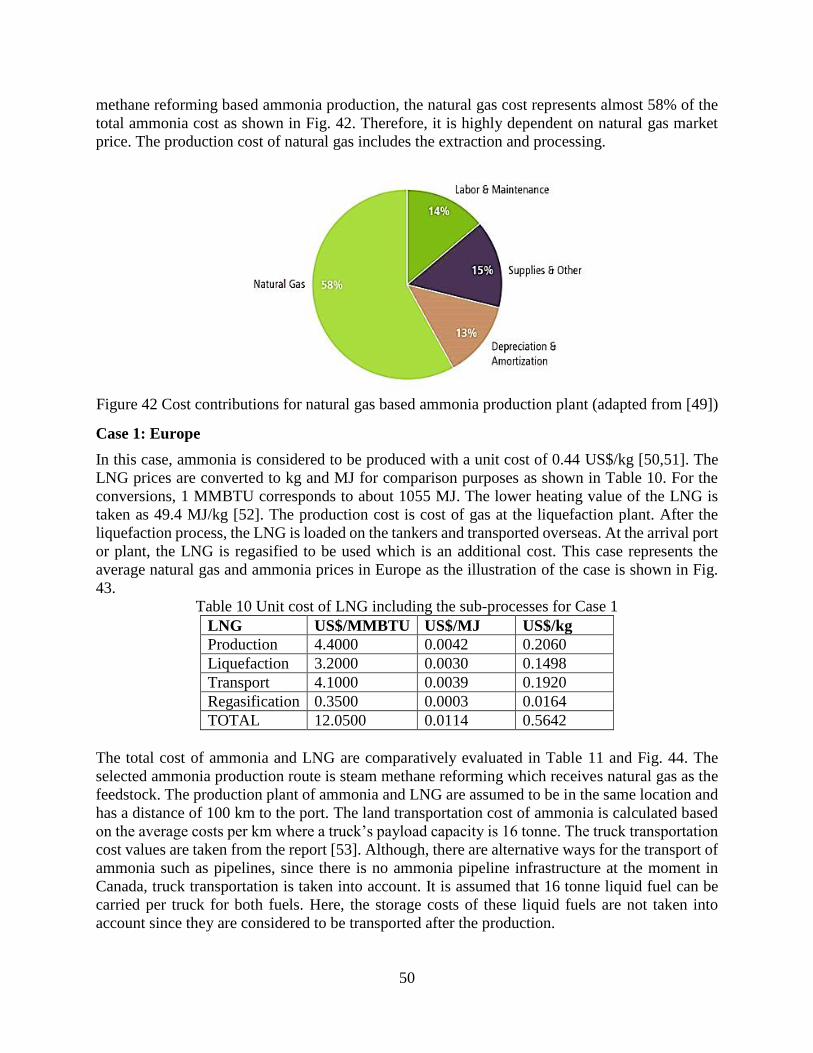
50
methane reforming based ammonia production, the natural gas cost represents almost 58% of the
total ammonia cost as shown in Fig. 42. Therefore, it is highly dependent on natural gas market
price. The production cost of natural gas includes the extraction and processing.
Figure 42 Cost contributions for natural gas based ammonia production plant (adapted from [49])
Case 1: Europe
In this case, ammonia is considered to be produced with a unit cost of 0.44 US$/kg [50,51]. The
LNG prices are converted to kg and MJ for comparison purposes as shown in Table 10. For the
conversions, 1 MMBTU corresponds to about 1055 MJ. The lower heating value of the LNG is
taken as 49.4 MJ/kg [52]. The production cost is cost of gas at the liquefaction plant. After the
liquefaction process, the LNG is loaded on the tankers and transported overseas. At the arrival port
or plant, the LNG is regasified to be used which is an additional cost. This case represents the
average natural gas and ammonia prices in Europe as the illustration of the case is shown in Fig.
43.
Table 10 Unit cost of LNG including the sub-processes for Case 1
LNG US$/MMBTU US$/MJ US$/kg
Production 4.4000 0.0042 0.2060
Liquefaction 3.2000 0.0030 0.1498
Transport 4.1000 0.0039 0.1920
Regasification 0.3500 0.0003 0.0164
TOTAL 12.0500 0.0114 0.5642
The total cost of ammonia and LNG are comparatively evaluated in Table 11 and Fig. 44. The
selected ammonia production route is steam methane reforming which receives natural gas as the
feedstock. The production plant of ammonia and LNG are assumed to be in the same location and
has a distance of 100 km to the port. The land transportation cost of ammonia is calculated based
on the average costs per km where a truck’s payload capacity is 16 tonne. The truck transportation
cost values are taken from the report [53]. Although, there are alternative ways for the transport of
ammonia such as pipelines, since there is no ammonia pipeline infrastructure at the moment in
Canada, truck transportation is taken into account. It is assumed that 16 tonne liquid fuel can be
carried per truck for both fuels. Here, the storage costs of these liquid fuels are not taken into
account since they are considered to be transported after the production.
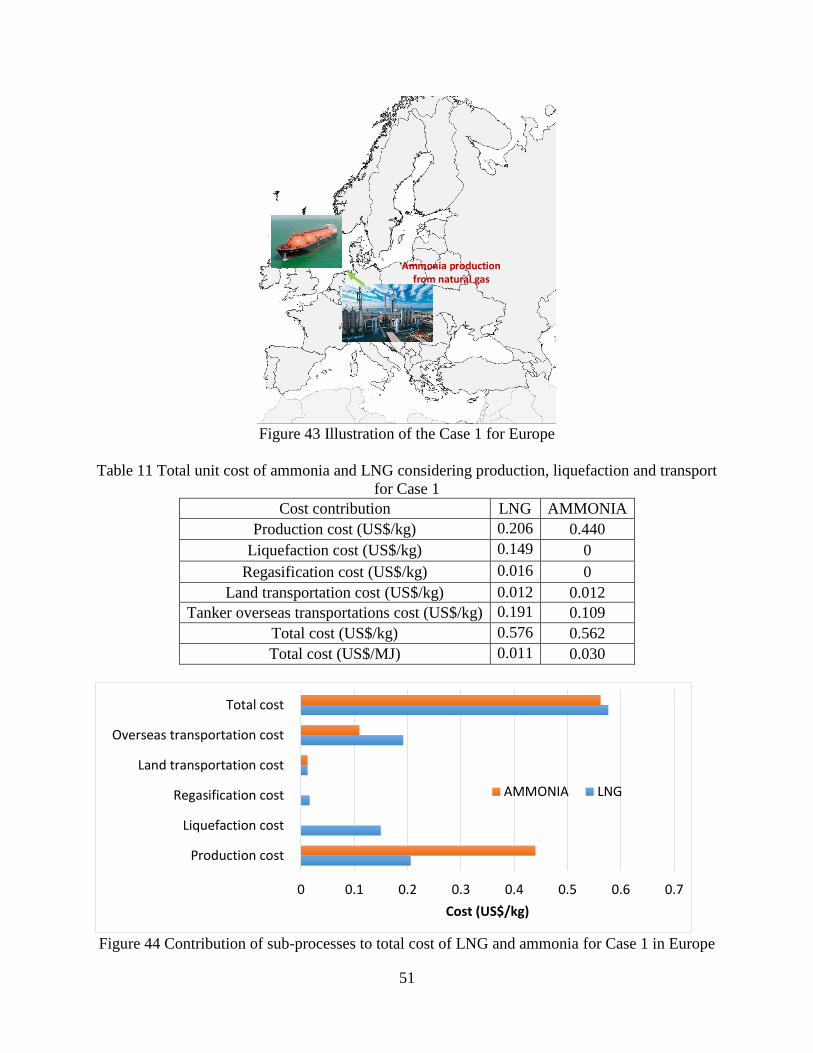
51
Ammonia productionfrom natural gas
Figure 43 Illustration of the Case 1 for Europe
Table 11 Total unit cost of ammonia and LNG considering production, liquefaction and transport
for Case 1
Cost contribution LNG AMMONIA
Production cost (US$/kg) 0.206 0.440
Liquefaction cost (US$/kg) 0.149 0
Regasification cost (US$/kg) 0.016 0
Land transportation cost (US$/kg) 0.012 0.012
Tanker overseas transportations cost (US$/kg) 0.191 0.109
Total cost (US$/kg) 0.576 0.562
Total cost (US$/MJ) 0.011 0.030
Figure 44 Contribution of sub-processes to total cost of LNG and ammonia for Case 1 in Europe
0 0.1 0.2 0.3 0.4 0.5 0.6 0.7
Production cost
Liquefaction cost
Regasification cost
Land transportation cost
Overseas transportation cost
Total cost
Cost (US$/kg)
AMMONIA LNG
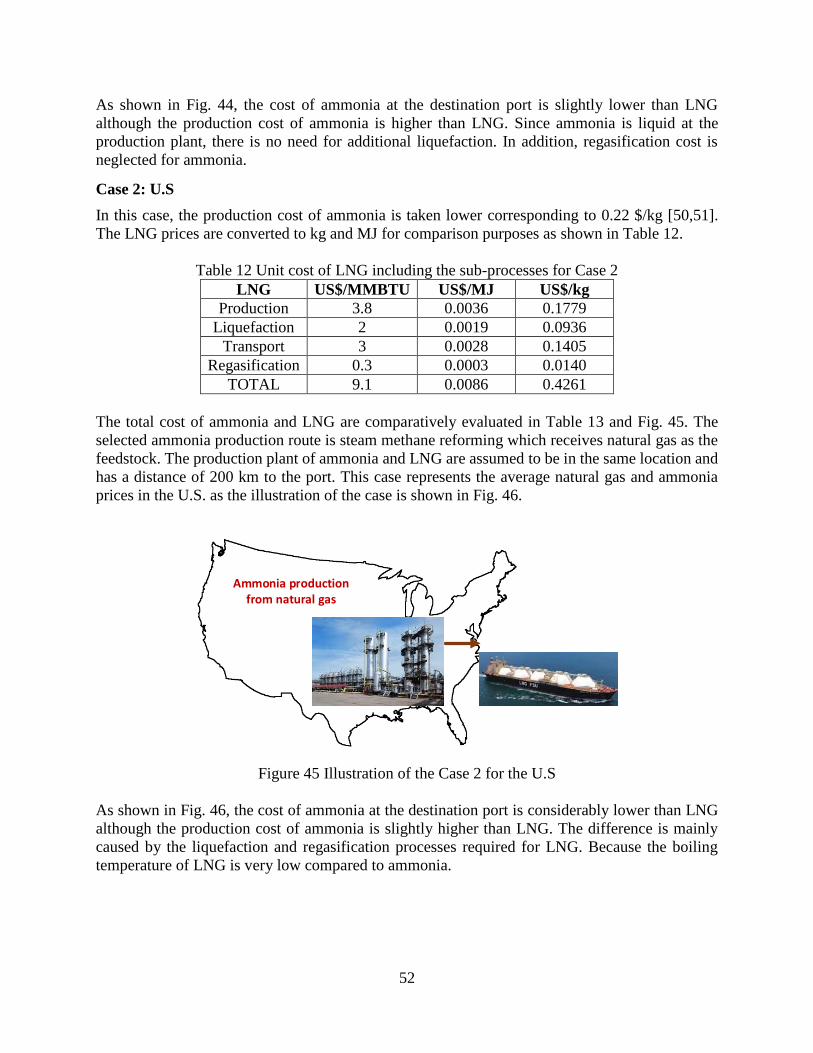
52
As shown in Fig. 44, the cost of ammonia at the destination port is slightly lower than LNG
although the production cost of ammonia is higher than LNG. Since ammonia is liquid at the
production plant, there is no need for additional liquefaction. In addition, regasification cost is
neglected for ammonia.
Case 2: U.S
In this case, the production cost of ammonia is taken lower corresponding to 0.22 $/kg [50,51].
The LNG prices are converted to kg and MJ for comparison purposes as shown in Table 12.
Table 12 Unit cost of LNG including the sub-processes for Case 2
LNG US$/MMBTU US$/MJ US$/kg
Production 3.8 0.0036 0.1779
Liquefaction 2 0.0019 0.0936
Transport 3 0.0028 0.1405
Regasification 0.3 0.0003 0.0140
TOTAL 9.1 0.0086 0.4261
The total cost of ammonia and LNG are comparatively evaluated in Table 13 and Fig. 45. The
selected ammonia production route is steam methane reforming which receives natural gas as the
feedstock. The production plant of ammonia and LNG are assumed to be in the same location and
has a distance of 200 km to the port. This case represents the average natural gas and ammonia
prices in the U.S. as the illustration of the case is shown in Fig. 46.
Ammonia productionfrom natural gas
Figure 45 Illustration of the Case 2 for the U.S
As shown in Fig. 46, the cost of ammonia at the destination port is considerably lower than LNG
although the production cost of ammonia is slightly higher than LNG. The difference is mainly
caused by the liquefaction and regasification processes required for LNG. Because the boiling
temperature of LNG is very low compared to ammonia.
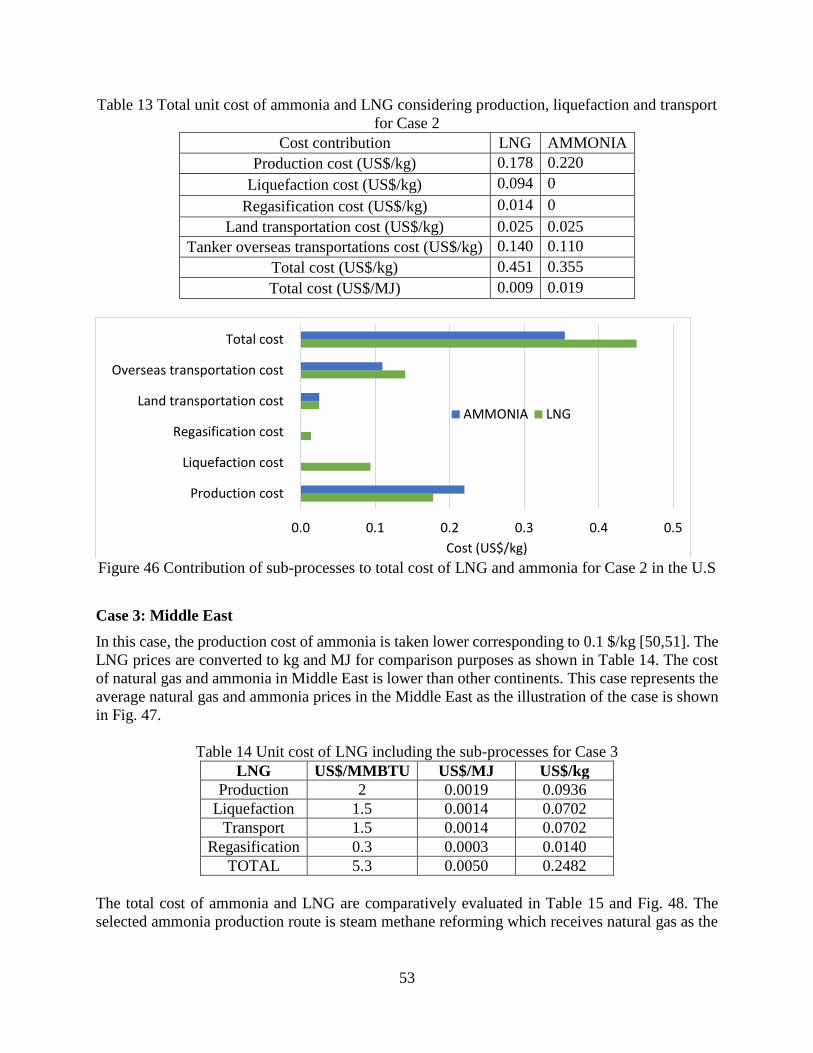
53
Table 13 Total unit cost of ammonia and LNG considering production, liquefaction and transport
for Case 2
Cost contribution LNG AMMONIA
Production cost (US$/kg) 0.178 0.220
Liquefaction cost (US$/kg) 0.094 0
Regasification cost (US$/kg) 0.014 0
Land transportation cost (US$/kg) 0.025 0.025
Tanker overseas transportations cost (US$/kg) 0.140 0.110
Total cost (US$/kg) 0.451 0.355
Total cost (US$/MJ) 0.009 0.019
Figure 46 Contribution of sub-processes to total cost of LNG and ammonia for Case 2 in the U.S
Case 3: Middle East
In this case, the production cost of ammonia is taken lower corresponding to 0.1 $/kg [50,51]. The
LNG prices are converted to kg and MJ for comparison purposes as shown in Table 14. The cost
of natural gas and ammonia in Middle East is lower than other continents. This case represents the
average natural gas and ammonia prices in the Middle East as the illustration of the case is shown
in Fig. 47.
Table 14 Unit cost of LNG including the sub-processes for Case 3
LNG US$/MMBTU US$/MJ US$/kg
Production 2 0.0019 0.0936
Liquefaction 1.5 0.0014 0.0702
Transport 1.5 0.0014 0.0702
Regasification 0.3 0.0003 0.0140
TOTAL 5.3 0.0050 0.2482
The total cost of ammonia and LNG are comparatively evaluated in Table 15 and Fig. 48. The
selected ammonia production route is steam methane reforming which receives natural gas as the
0.0 0.1 0.2 0.3 0.4 0.5
Production cost
Liquefaction cost
Regasification cost
Land transportation cost
Overseas transportation cost
Total cost
Cost (US$/kg)
AMMONIA LNG
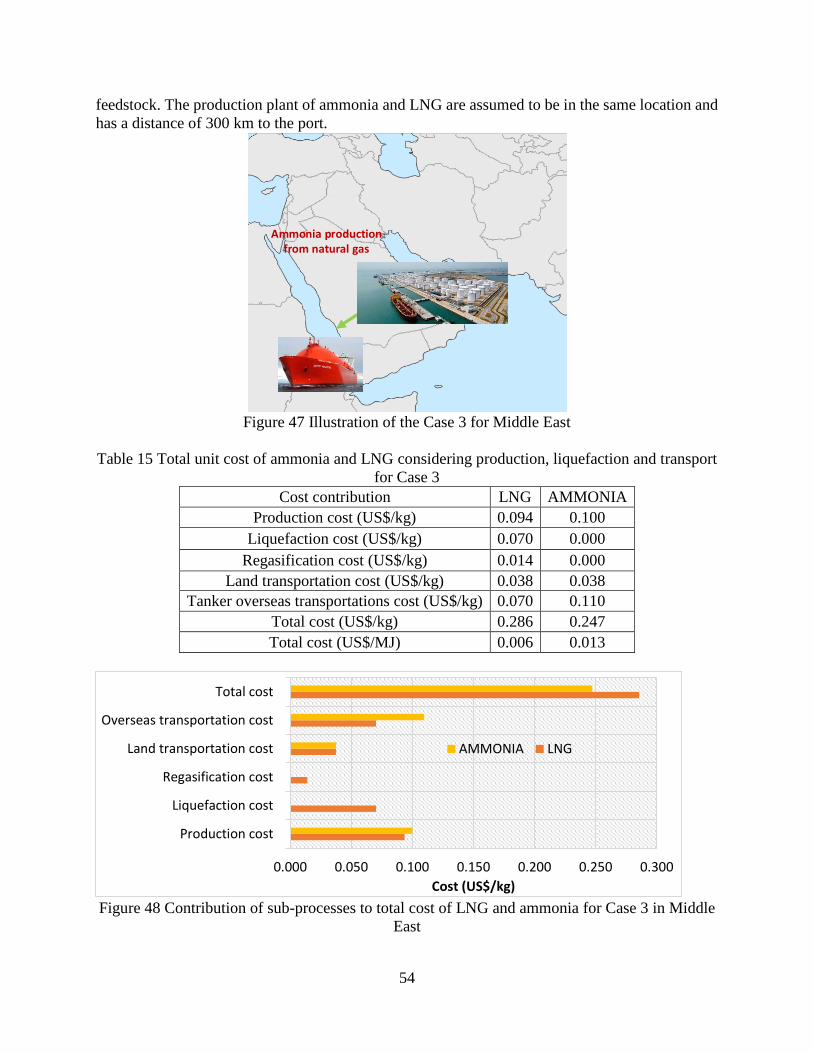
54
feedstock. The production plant of ammonia and LNG are assumed to be in the same location and
has a distance of 300 km to the port.
Ammonia productionfrom natural gas
Figure 47 Illustration of the Case 3 for Middle East
Table 15 Total unit cost of ammonia and LNG considering production, liquefaction and transport
for Case 3
Cost contribution LNG AMMONIA
Production cost (US$/kg) 0.094 0.100
Liquefaction cost (US$/kg) 0.070 0.000
Regasification cost (US$/kg) 0.014 0.000
Land transportation cost (US$/kg) 0.038 0.038
Tanker overseas transportations cost (US$/kg) 0.070 0.110
Total cost (US$/kg) 0.286 0.247
Total cost (US$/MJ) 0.006 0.013
Figure 48 Contribution of sub-processes to total cost of LNG and ammonia for Case 3 in Middle
East
0.000 0.050 0.100 0.150 0.200 0.250 0.300
Production cost
Liquefaction cost
Regasification cost
Land transportation cost
Overseas transportation cost
Total cost
Cost (US$/kg)
AMMONIA LNG
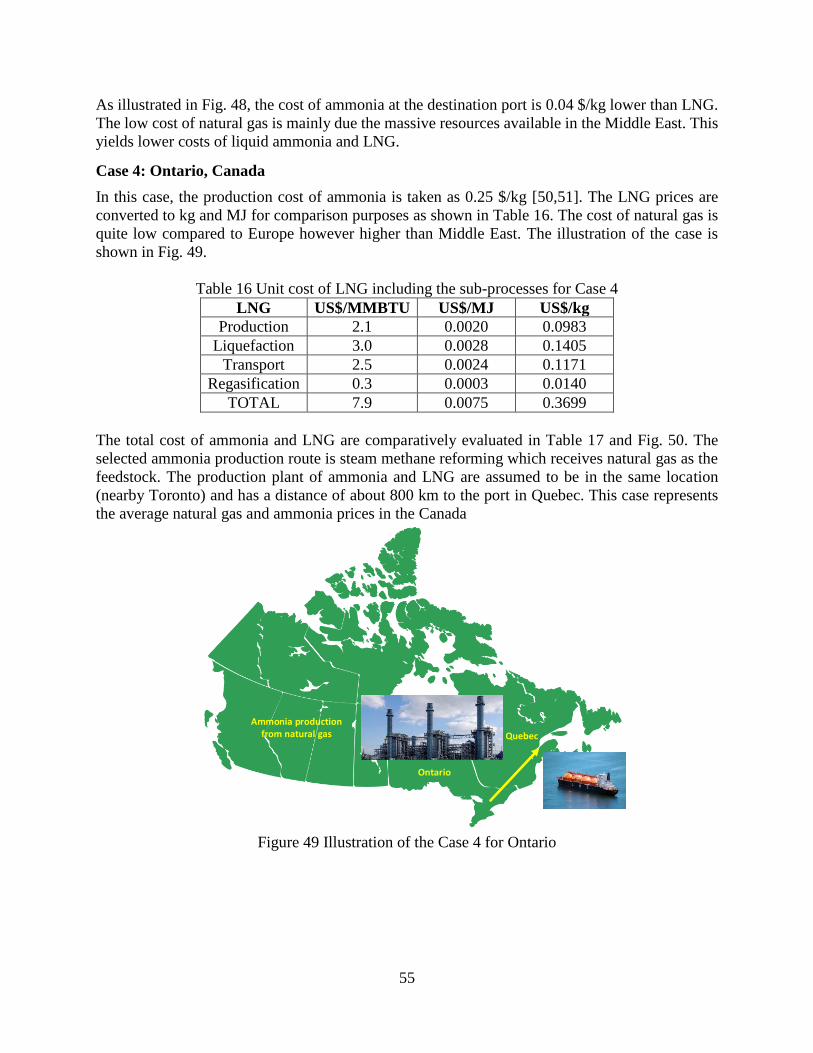
55
As illustrated in Fig. 48, the cost of ammonia at the destination port is 0.04 $/kg lower than LNG.
The low cost of natural gas is mainly due the massive resources available in the Middle East. This
yields lower costs of liquid ammonia and LNG.
Case 4: Ontario, Canada
In this case, the production cost of ammonia is taken as 0.25 $/kg [50,51]. The LNG prices are
converted to kg and MJ for comparison purposes as shown in Table 16. The cost of natural gas is
quite low compared to Europe however higher than Middle East. The illustration of the case is
shown in Fig. 49.
Table 16 Unit cost of LNG including the sub-processes for Case 4
LNG US$/MMBTU US$/MJ US$/kg
Production 2.1 0.0020 0.0983
Liquefaction 3.0 0.0028 0.1405
Transport 2.5 0.0024 0.1171
Regasification 0.3 0.0003 0.0140
TOTAL 7.9 0.0075 0.3699
The total cost of ammonia and LNG are comparatively evaluated in Table 17 and Fig. 50. The
selected ammonia production route is steam methane reforming which receives natural gas as the
feedstock. The production plant of ammonia and LNG are assumed to be in the same location
(nearby Toronto) and has a distance of about 800 km to the port in Quebec. This case represents
the average natural gas and ammonia prices in the Canada
Ammonia productionfrom natural gas
Ontario
Quebec
Figure 49 Illustration of the Case 4 for Ontario
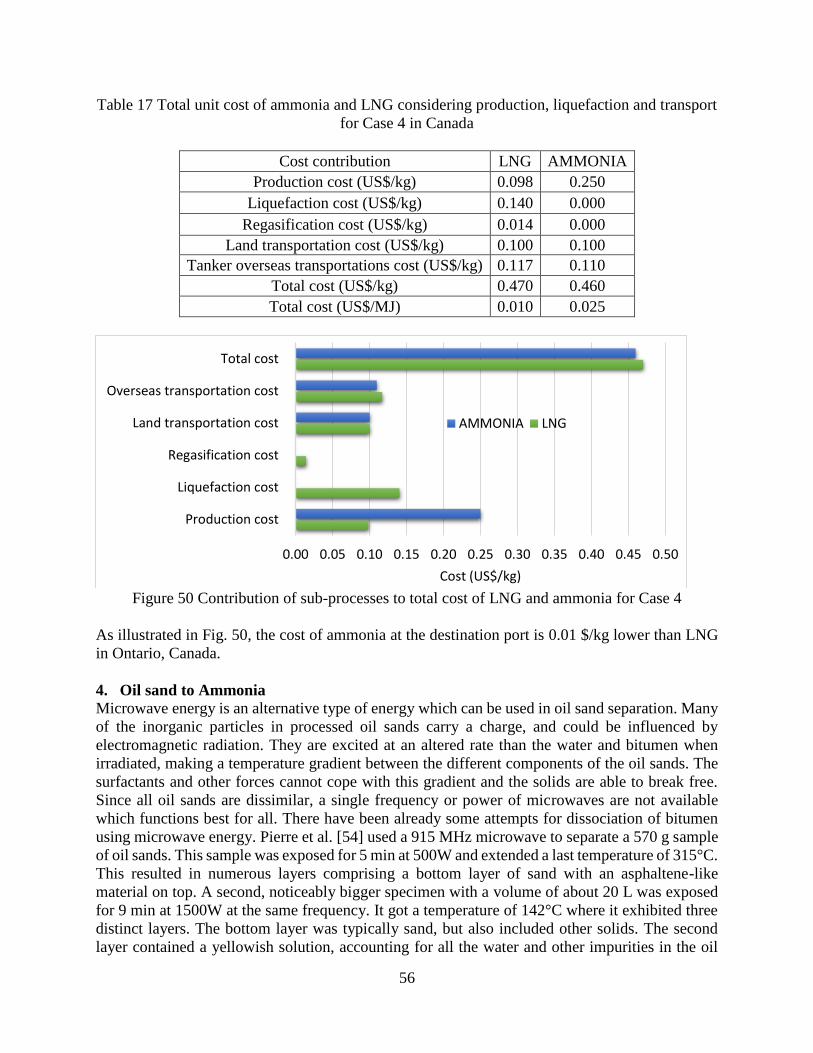
56
Table 17 Total unit cost of ammonia and LNG considering production, liquefaction and transport
for Case 4 in Canada
Cost contribution LNG AMMONIA
Production cost (US$/kg) 0.098 0.250
Liquefaction cost (US$/kg) 0.140 0.000
Regasification cost (US$/kg) 0.014 0.000
Land transportation cost (US$/kg) 0.100 0.100
Tanker overseas transportations cost (US$/kg) 0.117 0.110
Total cost (US$/kg) 0.470 0.460
Total cost (US$/MJ) 0.010 0.025
Figure 50 Contribution of sub-processes to total cost of LNG and ammonia for Case 4
As illustrated in Fig. 50, the cost of ammonia at the destination port is 0.01 $/kg lower than LNG
in Ontario, Canada.
4. Oil sand to Ammonia
Microwave energy is an alternative type of energy which can be used in oil sand separation. Many
of the inorganic particles in processed oil sands carry a charge, and could be influenced by
electromagnetic radiation. They are excited at an altered rate than the water and bitumen when
irradiated, making a temperature gradient between the different components of the oil sands. The
surfactants and other forces cannot cope with this gradient and the solids are able to break free.
Since all oil sands are dissimilar, a single frequency or power of microwaves are not available
which functions best for all. There have been already some attempts for dissociation of bitumen
using microwave energy. Pierre et al. [54] used a 915 MHz microwave to separate a 570 g sample
of oil sands. This sample was exposed for 5 min at 500W and extended a last temperature of 315°C.
This resulted in numerous layers comprising a bottom layer of sand with an asphaltene-like
material on top. A second, noticeably bigger specimen with a volume of about 20 L was exposed
for 9 min at 1500W at the same frequency. It got a temperature of 142°C where it exhibited three
distinct layers. The bottom layer was typically sand, but also included other solids. The second
layer contained a yellowish solution, accounting for all the water and other impurities in the oil
0.00 0.05 0.10 0.15 0.20 0.25 0.30 0.35 0.40 0.45 0.50
Production cost
Liquefaction cost
Regasification cost
Land transportation cost
Overseas transportation cost
Total cost
Cost (US$/kg)
AMMONIA LNG
57
sand. The top layer was black, viscous oil. Bosisio et al. [55] considered microwave-assisted
extraction of oil sands. They conducted oil sand extraction experiments under inert atmosphere in
a quartz reactor which was located in a rectangular microwave guide (WR 284 wave guide) built-
in with a coupling iris and modifiable short circuit. Instance microwave power of 100W at 2450
MHz frequency was realized to the oil sands samples and the different phases of reaction were
perceived. The duration of first was 10 to 15s and second-third step were 15s to 15 min. Microwave
radiation of oil sands created a crude oil and also small quantities of gaseous yields. Therefore,
electromagnetic heating also proved to increase yields of crude oil from 70% to 86%. Lately,
Global Research Corporation technologies declared a method using over 8,700 RF microwave
frequencies essential to hydrocarbon elements. About 1.2 gal of diesel fuel was extracted from a
tire after microwave radiation under vacuum at different frequencies. The company requested to
extract oil and gas from diverse feedstocks by microwave radiation such as oil sands, oil shale,
used plastics, or rubber with little or no additional processing. Initial testing results formed great
amounts of hydrogen and methane gases without CO or CO2 contaminants [56]. Samples of
Lloydminster oil sands (oil–water–solids ratio of 19:40:41) considered principally stubborn to
separation were tested with exposure to adjustable frequency microwaves [57]. The tests were able
to avoid the FCC regulations because of distinct apparatus to comprise the electromagnetic waves.
The aim was to explore what microwave frequency is best for this type of oil sands. All samples
separated into a liquid upper layer and a mostly solid lower layer. The degree of separation was
calculated by evaluating the oil content of the lower layer. The lower layer of the control specimen,
which was not irradiated, had 27% oil content by weight. Tests were achieved by changing
frequency and exposure time. Most of the samples presented marginally lower oil content. The
best result occurred when the sample was irradiated for a duration of 10 min at 6400±100 MHz,
where the lower layer only had 19% oil content. It was described microwave assisted extraction to
recover hydrocarbon substances from oil shale, oil sands and lignite in the U.S. Patent 4.419.214
[58][6]. The patent describes how oil sand, oil shale rock and lignite samples were irradiated in a
pressure vessel with gaseous or liquefied carbon dioxide and other gaseous or vapor hydrocarbon
solvents. For example, oil sand was taken into a microwave feeder pipe and irradiated at 5.8 GHz
frequency. Further, BTX (benzene-toluenexylene-ethylbenzene) was pumped through the sand.
The extraction solution contained green oil on the top and bitumen was obtained at the bottom. In
another example, crushed oil shale rock was irradiated at 915 MHz frequency. After radiation,
carbon tetrachloride was injected to extract kerogen and the projected isolated kerogen was 65%
of initial organic content of the rock. It is also specified in the review article [59] that oil sands
and oil shale samples irradiated to microwaves produced the required heat to dissociate bitumen
components to produce a crude oil and distilled kerogen. A laboratory microwave oven was
utilized to test oil sand samples from Athabasca and oil shale specimens from Green River and
Sunnyside. The authors found that a 128 g sample of oil sand separated into its components when
irradiated at 800W for 10 min, followed by 1500W for 15 min.
Microwave energy is environmentally friendly since it has no harmful effect during
hydrocarbon cracking process. Optimized ammonia synthesis using the excess heat in Haber-
Bosch (which is the most common method for ammonia production) ammonia plant for oil sand
bitumen extraction which is used for hydrogen production via microwave dissociation process is
possible as shown in Fig. 51.
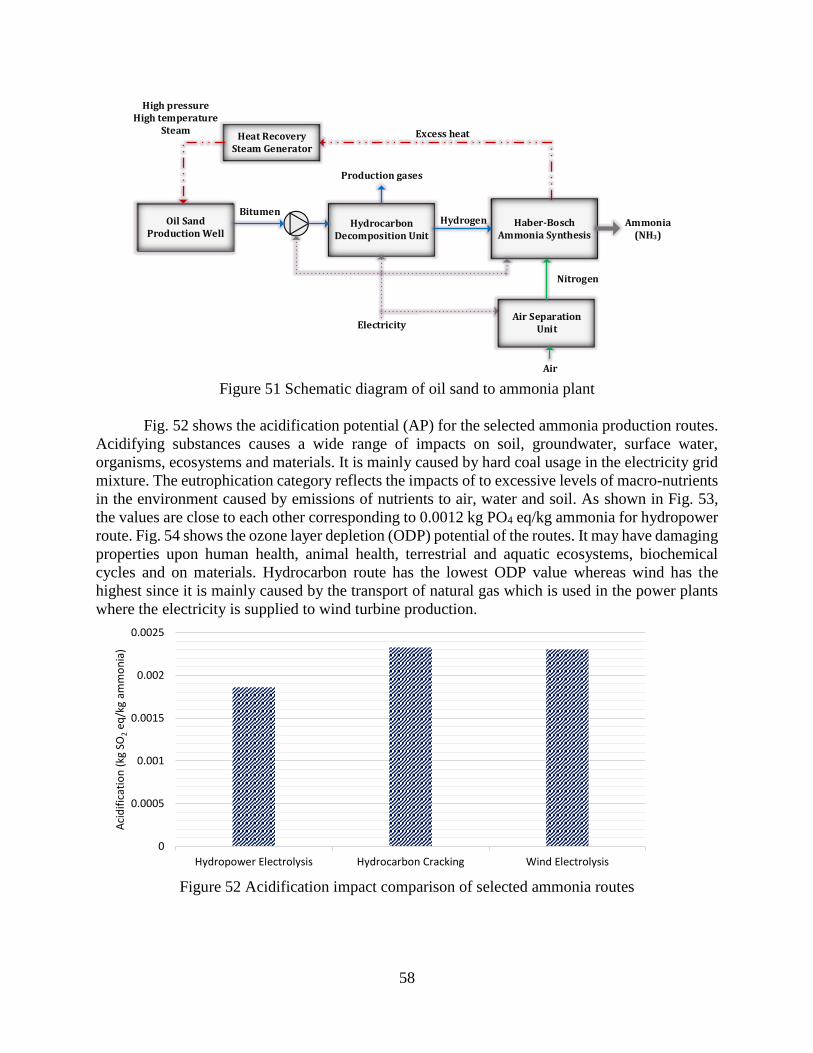
58
Haber-Bosch Ammonia Synthesis
Electricity
BitumenAmmonia
(NH3)
Oil Sand Production Well
Excess heat
Hydrocarbon Decomposition Unit
Hydrogen
Air Separation Unit
Air
Nitrogen
Production gases
Heat Recovery Steam Generator
High pressure High temperature
Steam
Figure 51 Schematic diagram of oil sand to ammonia plant
Fig. 52 shows the acidification potential (AP) for the selected ammonia production routes.
Acidifying substances causes a wide range of impacts on soil, groundwater, surface water,
organisms, ecosystems and materials. It is mainly caused by hard coal usage in the electricity grid
mixture. The eutrophication category reflects the impacts of to excessive levels of macro-nutrients
in the environment caused by emissions of nutrients to air, water and soil. As shown in Fig. 53,
the values are close to each other corresponding to 0.0012 kg PO4 eq/kg ammonia for hydropower
route. Fig. 54 shows the ozone layer depletion (ODP) potential of the routes. It may have damaging
properties upon human health, animal health, terrestrial and aquatic ecosystems, biochemical
cycles and on materials. Hydrocarbon route has the lowest ODP value whereas wind has the
highest since it is mainly caused by the transport of natural gas which is used in the power plants
where the electricity is supplied to wind turbine production.
Figure 52 Acidification impact comparison of selected ammonia routes
0
0.0005
0.001
0.0015
0.002
0.0025
Hydropower Electrolysis Hydrocarbon Cracking Wind Electrolysis
Aci
dif
icat
ion
(kg
SO
2eq
/kg
amm
on
ia)
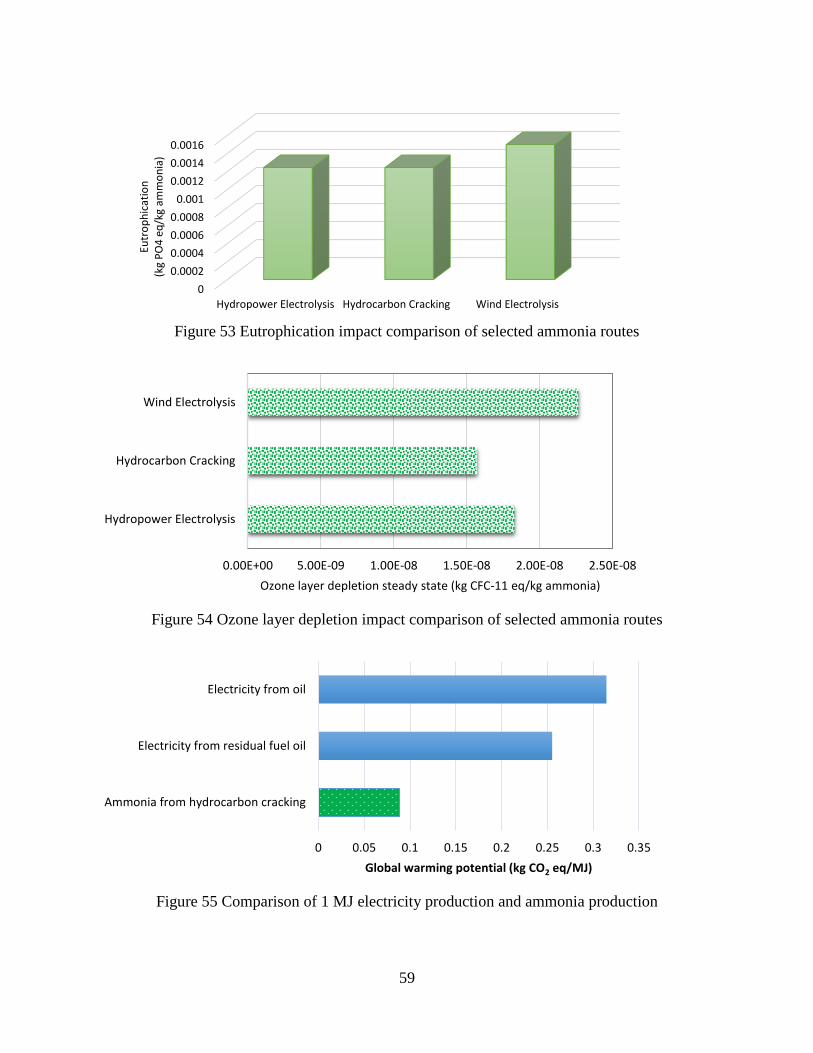
59
Figure 53 Eutrophication impact comparison of selected ammonia routes
Figure 54 Ozone layer depletion impact comparison of selected ammonia routes
Figure 55 Comparison of 1 MJ electricity production and ammonia production
0
0.0002
0.0004
0.0006
0.0008
0.001
0.0012
0.0014
0.0016
Hydropower Electrolysis Hydrocarbon Cracking Wind Electrolysis
Eutr
op
hic
atio
n
(kg
PO
4 e
q/k
g am
mo
nia
)
0.00E+00 5.00E-09 1.00E-08 1.50E-08 2.00E-08 2.50E-08
Hydropower Electrolysis
Hydrocarbon Cracking
Wind Electrolysis
Ozone layer depletion steady state (kg CFC-11 eq/kg ammonia)
0 0.05 0.1 0.15 0.2 0.25 0.3 0.35
Ammonia from hydrocarbon cracking
Electricity from residual fuel oil
Electricity from oil
Global warming potential (kg CO2 eq/MJ)
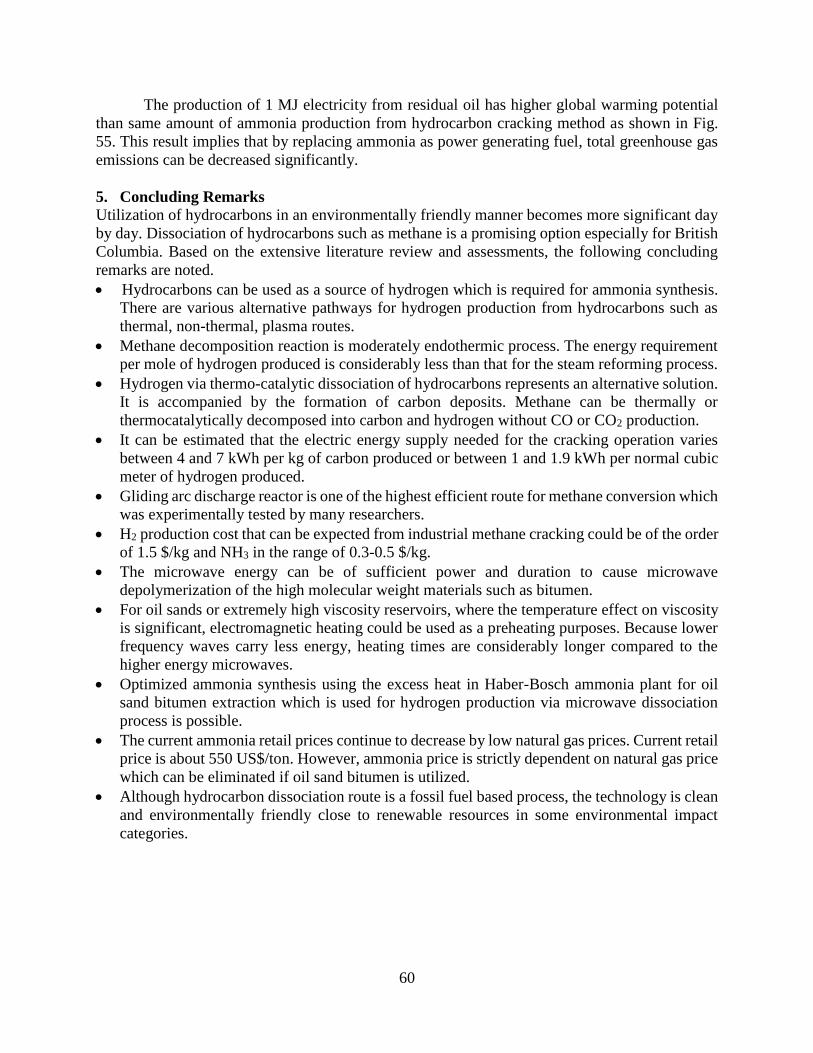
60
The production of 1 MJ electricity from residual oil has higher global warming potential
than same amount of ammonia production from hydrocarbon cracking method as shown in Fig.
55. This result implies that by replacing ammonia as power generating fuel, total greenhouse gas
emissions can be decreased significantly.
5. Concluding Remarks
Utilization of hydrocarbons in an environmentally friendly manner becomes more significant day
by day. Dissociation of hydrocarbons such as methane is a promising option especially for British
Columbia. Based on the extensive literature review and assessments, the following concluding
remarks are noted.
Hydrocarbons can be used as a source of hydrogen which is required for ammonia synthesis.
There are various alternative pathways for hydrogen production from hydrocarbons such as
thermal, non-thermal, plasma routes.
Methane decomposition reaction is moderately endothermic process. The energy requirement
per mole of hydrogen produced is considerably less than that for the steam reforming process.
Hydrogen via thermo-catalytic dissociation of hydrocarbons represents an alternative solution.
It is accompanied by the formation of carbon deposits. Methane can be thermally or
thermocatalytically decomposed into carbon and hydrogen without CO or CO2 production.
It can be estimated that the electric energy supply needed for the cracking operation varies
between 4 and 7 kWh per kg of carbon produced or between 1 and 1.9 kWh per normal cubic
meter of hydrogen produced.
Gliding arc discharge reactor is one of the highest efficient route for methane conversion which
was experimentally tested by many researchers.
H2 production cost that can be expected from industrial methane cracking could be of the order
of 1.5 $/kg and NH3 in the range of 0.3-0.5 $/kg.
The microwave energy can be of sufficient power and duration to cause microwave
depolymerization of the high molecular weight materials such as bitumen.
For oil sands or extremely high viscosity reservoirs, where the temperature effect on viscosity
is significant, electromagnetic heating could be used as a preheating purposes. Because lower
frequency waves carry less energy, heating times are considerably longer compared to the
higher energy microwaves.
Optimized ammonia synthesis using the excess heat in Haber-Bosch ammonia plant for oil
sand bitumen extraction which is used for hydrogen production via microwave dissociation
process is possible.
The current ammonia retail prices continue to decrease by low natural gas prices. Current retail
price is about 550 US$/ton. However, ammonia price is strictly dependent on natural gas price
which can be eliminated if oil sand bitumen is utilized.
Although hydrocarbon dissociation route is a fossil fuel based process, the technology is clean
and environmentally friendly close to renewable resources in some environmental impact
categories.
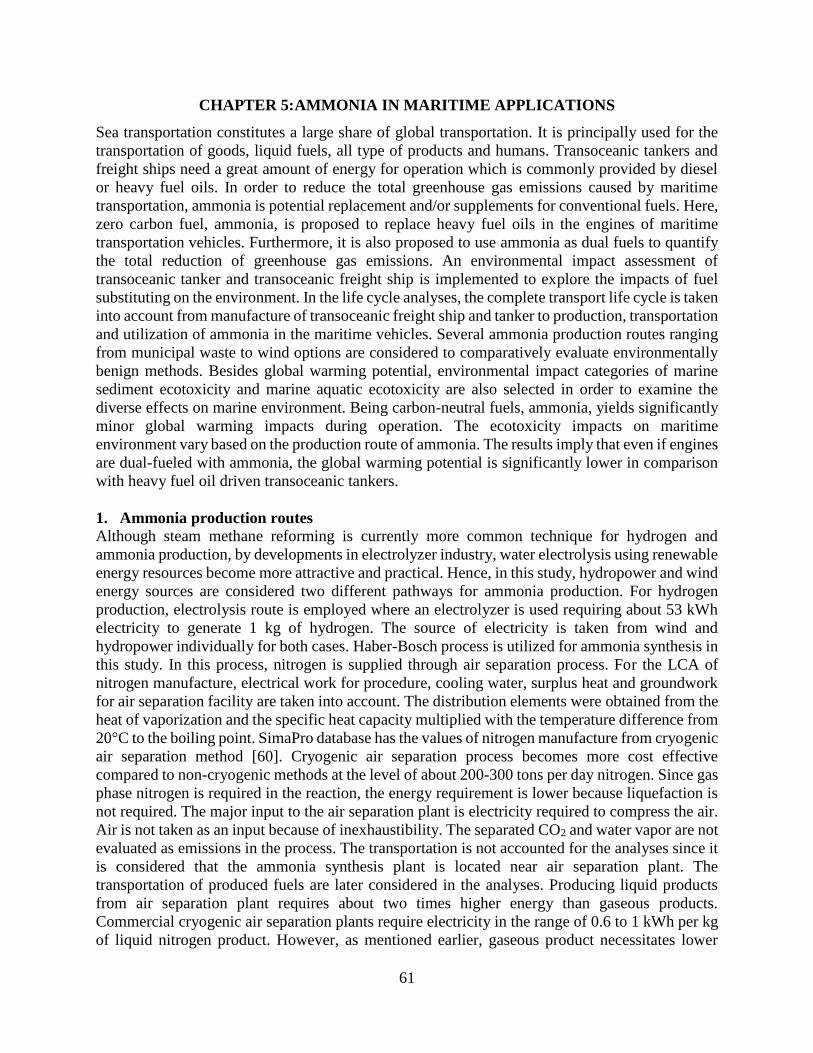
61
CHAPTER 5: AMMONIA IN MARITIME APPLICATIONS
Sea transportation constitutes a large share of global transportation. It is principally used for the
transportation of goods, liquid fuels, all type of products and humans. Transoceanic tankers and
freight ships need a great amount of energy for operation which is commonly provided by diesel
or heavy fuel oils. In order to reduce the total greenhouse gas emissions caused by maritime
transportation, ammonia is potential replacement and/or supplements for conventional fuels. Here,
zero carbon fuel, ammonia, is proposed to replace heavy fuel oils in the engines of maritime
transportation vehicles. Furthermore, it is also proposed to use ammonia as dual fuels to quantify
the total reduction of greenhouse gas emissions. An environmental impact assessment of
transoceanic tanker and transoceanic freight ship is implemented to explore the impacts of fuel
substituting on the environment. In the life cycle analyses, the complete transport life cycle is taken
into account from manufacture of transoceanic freight ship and tanker to production, transportation
and utilization of ammonia in the maritime vehicles. Several ammonia production routes ranging
from municipal waste to wind options are considered to comparatively evaluate environmentally
benign methods. Besides global warming potential, environmental impact categories of marine
sediment ecotoxicity and marine aquatic ecotoxicity are also selected in order to examine the
diverse effects on marine environment. Being carbon-neutral fuels, ammonia, yields significantly
minor global warming impacts during operation. The ecotoxicity impacts on maritime
environment vary based on the production route of ammonia. The results imply that even if engines
are dual-fueled with ammonia, the global warming potential is significantly lower in comparison
with heavy fuel oil driven transoceanic tankers.
1. Ammonia production routes
Although steam methane reforming is currently more common technique for hydrogen and
ammonia production, by developments in electrolyzer industry, water electrolysis using renewable
energy resources become more attractive and practical. Hence, in this study, hydropower and wind
energy sources are considered two different pathways for ammonia production. For hydrogen
production, electrolysis route is employed where an electrolyzer is used requiring about 53 kWh
electricity to generate 1 kg of hydrogen. The source of electricity is taken from wind and
hydropower individually for both cases. Haber-Bosch process is utilized for ammonia synthesis in
this study. In this process, nitrogen is supplied through air separation process. For the LCA of
nitrogen manufacture, electrical work for procedure, cooling water, surplus heat and groundwork
for air separation facility are taken into account. The distribution elements were obtained from the
heat of vaporization and the specific heat capacity multiplied with the temperature difference from
20°C to the boiling point. SimaPro database has the values of nitrogen manufacture from cryogenic
air separation method [60]. Cryogenic air separation process becomes more cost effective
compared to non-cryogenic methods at the level of about 200-300 tons per day nitrogen. Since gas
phase nitrogen is required in the reaction, the energy requirement is lower because liquefaction is
not required. The major input to the air separation plant is electricity required to compress the air.
Air is not taken as an input because of inexhaustibility. The separated CO2 and water vapor are not
evaluated as emissions in the process. The transportation is not accounted for the analyses since it
is considered that the ammonia synthesis plant is located near air separation plant. The
transportation of produced fuels are later considered in the analyses. Producing liquid products
from air separation plant requires about two times higher energy than gaseous products.
Commercial cryogenic air separation plants require electricity in the range of 0.6 to 1 kWh per kg
of liquid nitrogen product. However, as mentioned earlier, gaseous product necessitates lower
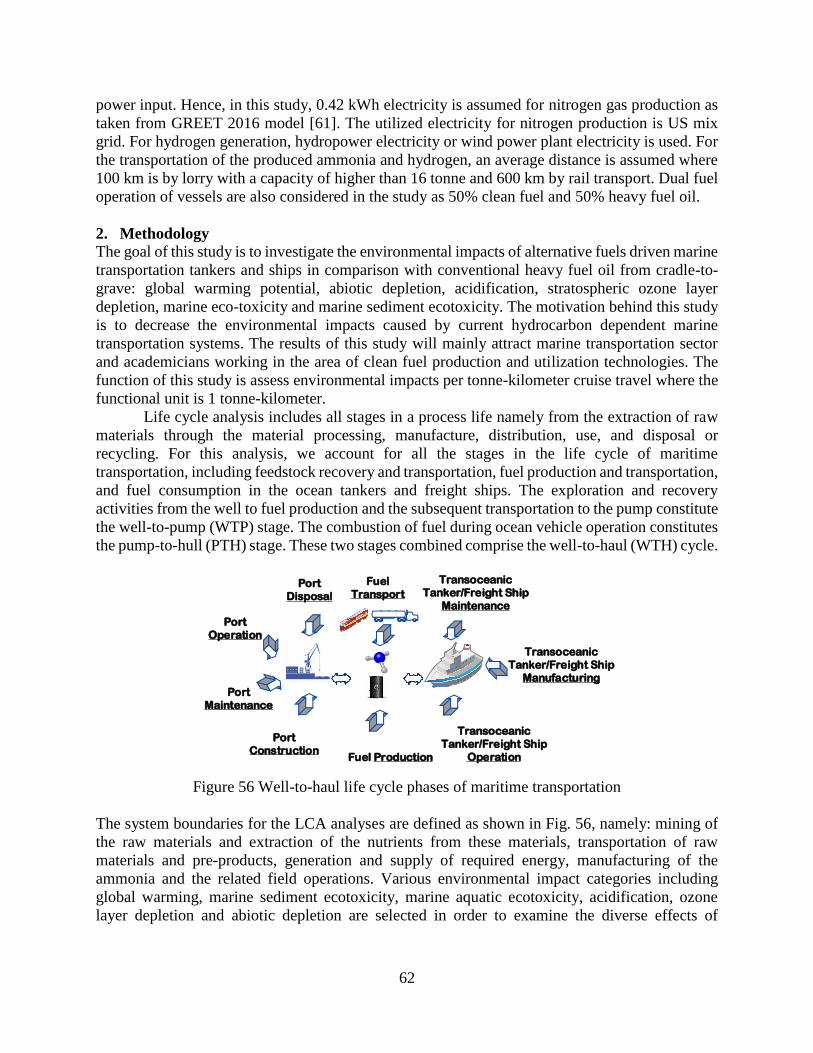
62
power input. Hence, in this study, 0.42 kWh electricity is assumed for nitrogen gas production as
taken from GREET 2016 model [61]. The utilized electricity for nitrogen production is US mix
grid. For hydrogen generation, hydropower electricity or wind power plant electricity is used. For
the transportation of the produced ammonia and hydrogen, an average distance is assumed where
100 km is by lorry with a capacity of higher than 16 tonne and 600 km by rail transport. Dual fuel
operation of vessels are also considered in the study as 50% clean fuel and 50% heavy fuel oil.
2. Methodology
The goal of this study is to investigate the environmental impacts of alternative fuels driven marine
transportation tankers and ships in comparison with conventional heavy fuel oil from cradle-to-
grave: global warming potential, abiotic depletion, acidification, stratospheric ozone layer
depletion, marine eco-toxicity and marine sediment ecotoxicity. The motivation behind this study
is to decrease the environmental impacts caused by current hydrocarbon dependent marine
transportation systems. The results of this study will mainly attract marine transportation sector
and academicians working in the area of clean fuel production and utilization technologies. The
function of this study is assess environmental impacts per tonne-kilometer cruise travel where the
functional unit is 1 tonne-kilometer.
Life cycle analysis includes all stages in a process life namely from the extraction of raw
materials through the material processing, manufacture, distribution, use, and disposal or
recycling. For this analysis, we account for all the stages in the life cycle of maritime
transportation, including feedstock recovery and transportation, fuel production and transportation,
and fuel consumption in the ocean tankers and freight ships. The exploration and recovery
activities from the well to fuel production and the subsequent transportation to the pump constitute
the well-to-pump (WTP) stage. The combustion of fuel during ocean vehicle operation constitutes
the pump-to-hull (PTH) stage. These two stages combined comprise the well-to-haul (WTH) cycle.
Transoceanic
Tanker/Freight Ship
Manufacturing
Transoceanic
Tanker/Freight Ship
Operation
Port
Construction
Transoceanic
Tanker/Freight Ship
Maintenance
Port
Disposal
Port
Operation
Port
Maintenance
Fuel Production
Fuel
Transport
Figure 56 Well-to-haul life cycle phases of maritime transportation
The system boundaries for the LCA analyses are defined as shown in Fig. 56, namely: mining of
the raw materials and extraction of the nutrients from these materials, transportation of raw
materials and pre-products, generation and supply of required energy, manufacturing of the
ammonia and the related field operations. Various environmental impact categories including
global warming, marine sediment ecotoxicity, marine aquatic ecotoxicity, acidification, ozone
layer depletion and abiotic depletion are selected in order to examine the diverse effects of
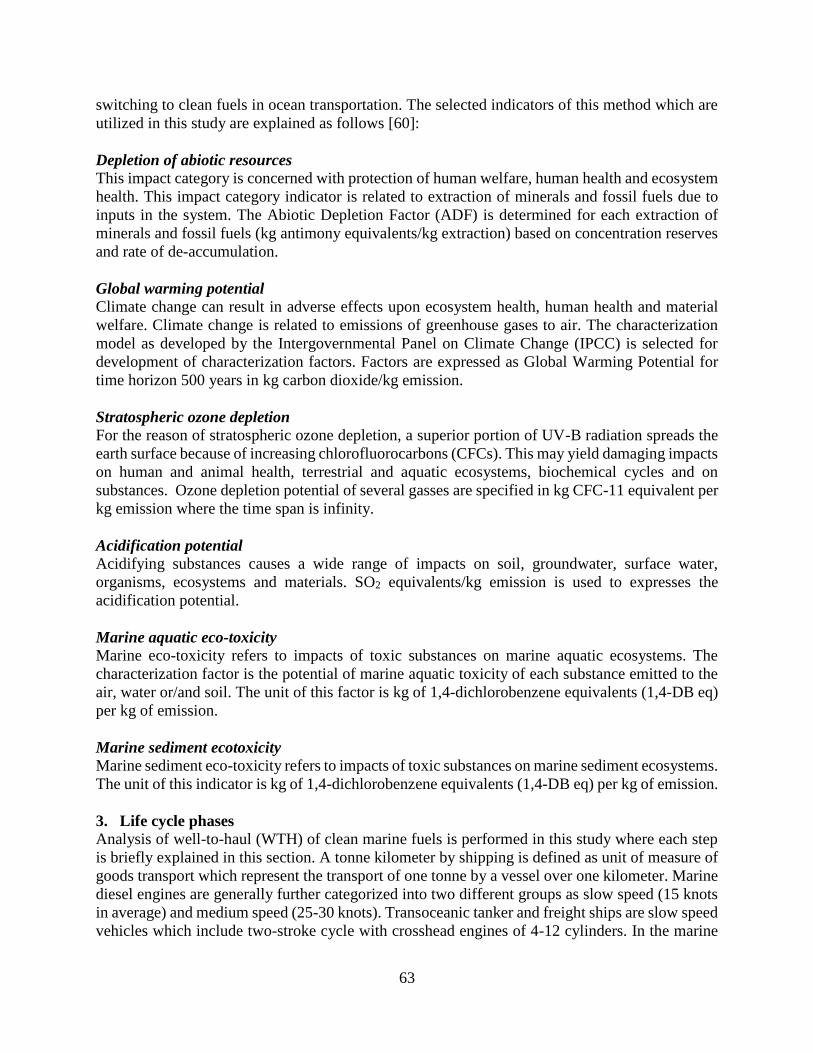
63
switching to clean fuels in ocean transportation. The selected indicators of this method which are
utilized in this study are explained as follows [60]:
Depletion of abiotic resources
This impact category is concerned with protection of human welfare, human health and ecosystem
health. This impact category indicator is related to extraction of minerals and fossil fuels due to
inputs in the system. The Abiotic Depletion Factor (ADF) is determined for each extraction of
minerals and fossil fuels (kg antimony equivalents/kg extraction) based on concentration reserves
and rate of de-accumulation.
Global warming potential
Climate change can result in adverse effects upon ecosystem health, human health and material
welfare. Climate change is related to emissions of greenhouse gases to air. The characterization
model as developed by the Intergovernmental Panel on Climate Change (IPCC) is selected for
development of characterization factors. Factors are expressed as Global Warming Potential for
time horizon 500 years in kg carbon dioxide/kg emission.
Stratospheric ozone depletion
For the reason of stratospheric ozone depletion, a superior portion of UV-B radiation spreads the
earth surface because of increasing chlorofluorocarbons (CFCs). This may yield damaging impacts
on human and animal health, terrestrial and aquatic ecosystems, biochemical cycles and on
substances. Ozone depletion potential of several gasses are specified in kg CFC-11 equivalent per
kg emission where the time span is infinity.
Acidification potential
Acidifying substances causes a wide range of impacts on soil, groundwater, surface water,
organisms, ecosystems and materials. SO2 equivalents/kg emission is used to expresses the
acidification potential.
Marine aquatic eco-toxicity
Marine eco-toxicity refers to impacts of toxic substances on marine aquatic ecosystems. The
characterization factor is the potential of marine aquatic toxicity of each substance emitted to the
air, water or/and soil. The unit of this factor is kg of 1,4-dichlorobenzene equivalents (1,4-DB eq)
per kg of emission.
Marine sediment ecotoxicity
Marine sediment eco-toxicity refers to impacts of toxic substances on marine sediment ecosystems.
The unit of this indicator is kg of 1,4-dichlorobenzene equivalents (1,4-DB eq) per kg of emission.
3. Life cycle phases
Analysis of well-to-haul (WTH) of clean marine fuels is performed in this study where each step
is briefly explained in this section. A tonne kilometer by shipping is defined as unit of measure of
goods transport which represent the transport of one tonne by a vessel over one kilometer. Marine
diesel engines are generally further categorized into two different groups as slow speed (15 knots
in average) and medium speed (25-30 knots). Transoceanic tanker and freight ships are slow speed
vehicles which include two-stroke cycle with crosshead engines of 4-12 cylinders. In the marine
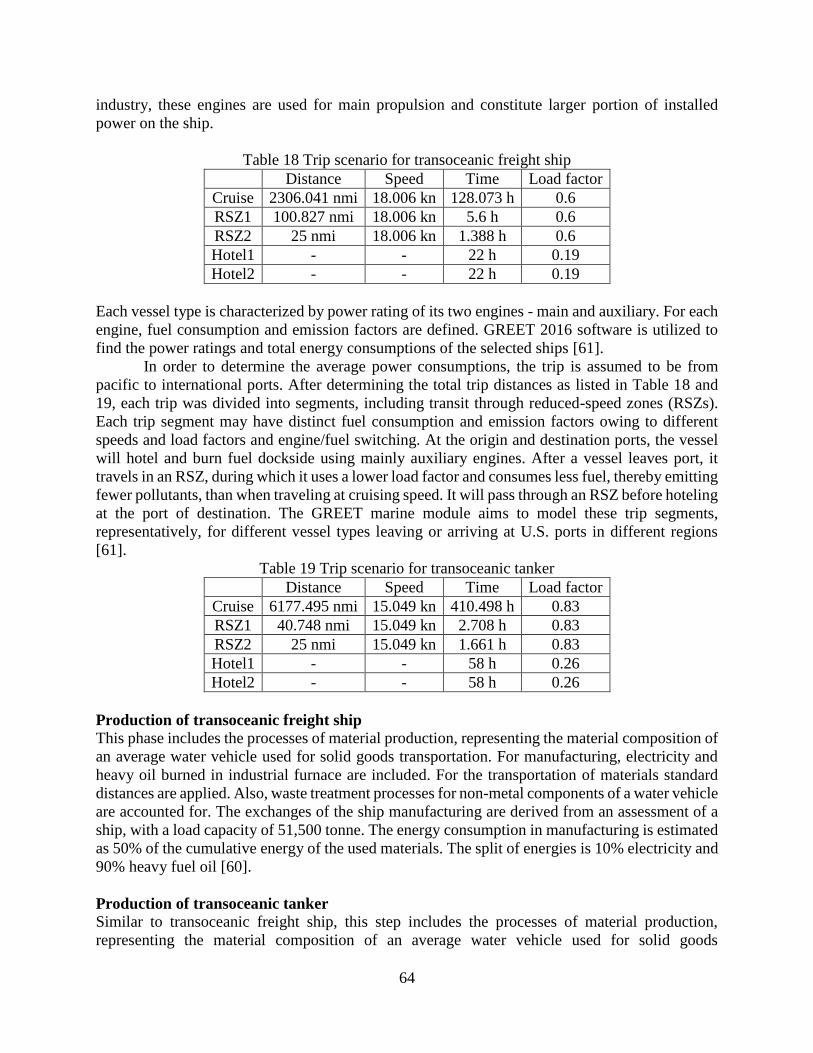
64
industry, these engines are used for main propulsion and constitute larger portion of installed
power on the ship.
Table 18 Trip scenario for transoceanic freight ship Distance Speed Time Load factor
Cruise 2306.041 nmi 18.006 kn 128.073 h 0.6
RSZ1 100.827 nmi 18.006 kn 5.6 h 0.6
RSZ2 25 nmi 18.006 kn 1.388 h 0.6
Hotel1 - - 22 h 0.19
Hotel2 - - 22 h 0.19
Each vessel type is characterized by power rating of its two engines - main and auxiliary. For each
engine, fuel consumption and emission factors are defined. GREET 2016 software is utilized to
find the power ratings and total energy consumptions of the selected ships [61].
In order to determine the average power consumptions, the trip is assumed to be from
pacific to international ports. After determining the total trip distances as listed in Table 18 and
19, each trip was divided into segments, including transit through reduced-speed zones (RSZs).
Each trip segment may have distinct fuel consumption and emission factors owing to different
speeds and load factors and engine/fuel switching. At the origin and destination ports, the vessel
will hotel and burn fuel dockside using mainly auxiliary engines. After a vessel leaves port, it
travels in an RSZ, during which it uses a lower load factor and consumes less fuel, thereby emitting
fewer pollutants, than when traveling at cruising speed. It will pass through an RSZ before hoteling
at the port of destination. The GREET marine module aims to model these trip segments,
representatively, for different vessel types leaving or arriving at U.S. ports in different regions
[61].
Table 19 Trip scenario for transoceanic tanker Distance Speed Time Load factor
Cruise 6177.495 nmi 15.049 kn 410.498 h 0.83
RSZ1 40.748 nmi 15.049 kn 2.708 h 0.83
RSZ2 25 nmi 15.049 kn 1.661 h 0.83
Hotel1 - - 58 h 0.26
Hotel2 - - 58 h 0.26
Production of transoceanic freight ship
This phase includes the processes of material production, representing the material composition of
an average water vehicle used for solid goods transportation. For manufacturing, electricity and
heavy oil burned in industrial furnace are included. For the transportation of materials standard
distances are applied. Also, waste treatment processes for non-metal components of a water vehicle
are accounted for. The exchanges of the ship manufacturing are derived from an assessment of a
ship, with a load capacity of 51,500 tonne. The energy consumption in manufacturing is estimated
as 50% of the cumulative energy of the used materials. The split of energies is 10% electricity and
90% heavy fuel oil [60].
Production of transoceanic tanker
Similar to transoceanic freight ship, this step includes the processes of material production,
representing the material composition of an average water vehicle used for solid goods
65
transportation. This type of vehicle has higher load capacity corresponding to 100,000 tonne. The
energy consumption in manufacturing is estimated as 50% of the cumulative energy of the used
materials. The split of energies is 10% electricity and 90% heavy fuel oil [60].
Maintenance freight ship and tanker
This step of the inventory includes the use of paint and emissions of the solvent of the paint as
NMVOC. Consumption of lubricates are excluded. It is assumed that the ship is painted 6 times in
its entire life span of 25 years. The consumption of lubricates is included in the fuel consumption
for vessel operation [60].
Port facilities
Seaport facilities comprise of the construction and disposal of one of the world’s biggest port in
Rotterdam, Netherlands. The inventory contains the processes of material production, representing
the material used in the construction phase of the port. The building activities and electricity
consumption are accounted for construction and disposal phases. Emission of NMVOC are
included. Also lorry transport of materials to the constructions site are taken into account. The
expenditures due to construction and disposal are addressed. The data represent one seaport for
both, sea and inland shipping. The material composition of the sealed industrial area is derived
from the construction and disposal expenditures of a European highway. The built up is modelled
as a steel building. The life time of port is assumed to be 100 years [60].
Operation and maintenance of the port
This inventory includes emissions of to water due to non-removed oil spills. In this step, the land
occupation and transformation due to seaport are taken into account. The energy consumption at
the port is based on assumptions for the specific electricity consumption at the port in Hamburg,
Germany. The land use is further distinguished in built up area (0.6%), road area (45.6%) and
water bodies (54.29%). Emission to waters include emission from production sites on the port
site, which are not directly connected to the transport activities [60].
Transportation and operation of the transoceanic freight ship
In this step, the full cycle is represented by supply of the fuel, operation of the ship and transport
of the goods as 1 tkm. Direct airborne emissions of gaseous substances, particulate matters,
dioxins, PAHs, halogens and heavy metals are accounted for. These emissions are caused by heavy
oil burning in the engines, hence they are mostly eliminated in ammonia driven ships. Also, the
disposal of bilge oil and emissions of tributyltin compounds are included. Individual hydrocarbons
are estimated based on the share of diesel engines of road vehicles. Heavy metals are estimated
from trace elements in fuel. A distinction between distilled (28%) and residual fuel (72%) is
applied. The amount of disposed bilge oil is estimated as 0.6% of the consumed fuel. The average
data for steam turbine (5%) and diesel engine (95%) propulsion are considered in the study. The
fuel used is for conventional ships is heavy fuel oil and is representative for slow speed engine
types about 15 knots. The data represents solid bulk transport of about 40,000 dwt (deadweight
tonnage) where the ship is driven by steam turbine and diesel engines [60]. The power ratings of
the main engine and auxiliary engines are about 37.5 MW and 8.3 MW, respectively. The average
energy consumption for the freight ship is calculated to be 0.214 MJ per mile ton [61].
This step refers to the entire transport life cycle namely; the operation of vessel; production
of vessel; construction and land use of port; operation, maintenance and disposal of port;
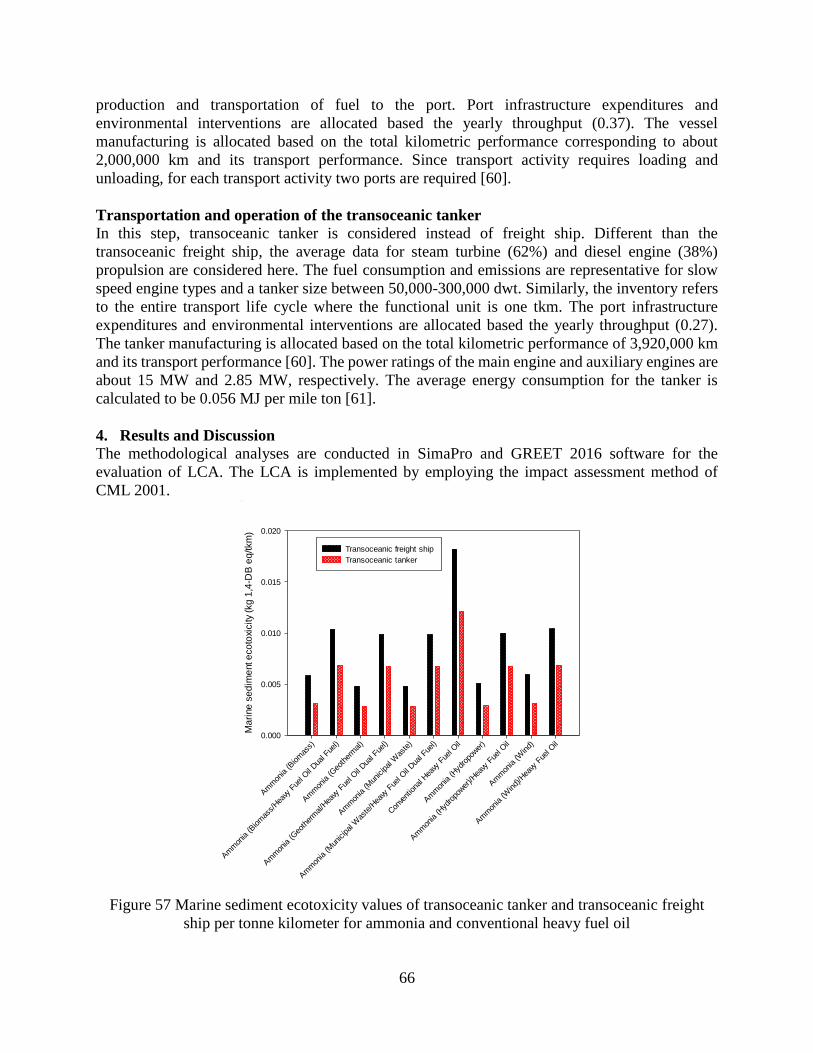
66
production and transportation of fuel to the port. Port infrastructure expenditures and
environmental interventions are allocated based the yearly throughput (0.37). The vessel
manufacturing is allocated based on the total kilometric performance corresponding to about
2,000,000 km and its transport performance. Since transport activity requires loading and
unloading, for each transport activity two ports are required [60].
Transportation and operation of the transoceanic tanker
In this step, transoceanic tanker is considered instead of freight ship. Different than the
transoceanic freight ship, the average data for steam turbine (62%) and diesel engine (38%)
propulsion are considered here. The fuel consumption and emissions are representative for slow
speed engine types and a tanker size between 50,000-300,000 dwt. Similarly, the inventory refers
to the entire transport life cycle where the functional unit is one tkm. The port infrastructure
expenditures and environmental interventions are allocated based the yearly throughput (0.27).
The tanker manufacturing is allocated based on the total kilometric performance of 3,920,000 km
and its transport performance [60]. The power ratings of the main engine and auxiliary engines are
about 15 MW and 2.85 MW, respectively. The average energy consumption for the tanker is
calculated to be 0.056 MJ per mile ton [61].
4. Results and Discussion
The methodological analyses are conducted in SimaPro and GREET 2016 software for the
evaluation of LCA. The LCA is implemented by employing the impact assessment method of
CML 2001.
Am
mon
ia (B
iom
ass)
Am
mon
ia (B
iom
ass/
Hea
vy F
uel O
il Dua
l Fue
l)
Am
mon
ia (G
eoth
erm
al)
Am
mon
ia (G
eoth
erm
al/H
eavy
Fue
l Oil Dua
l Fue
l)
Am
mon
ia (M
unicipal W
aste
)
Am
mon
ia (M
unicipal W
aste
/Hea
vy F
uel O
il Dua
l Fue
l)
Con
vent
iona
l Hea
vy F
uel O
il
Am
mon
ia (H
ydro
power
)
Am
mon
ia (H
ydro
power
)/Hea
vy F
uel O
il
Am
mon
ia (W
ind)
Am
mon
ia (W
ind)
/Hea
vy F
uel O
il
Ma
rine
se
dim
ent e
co
toxi
city
(kg
1,4
-DB
eq
/tkm
)
0.000
0.005
0.010
0.015
0.020
Transoceanic freight ship
Transoceanic tanker
Figure 57 Marine sediment ecotoxicity values of transoceanic tanker and transoceanic freight
ship per tonne kilometer for ammonia and conventional heavy fuel oil
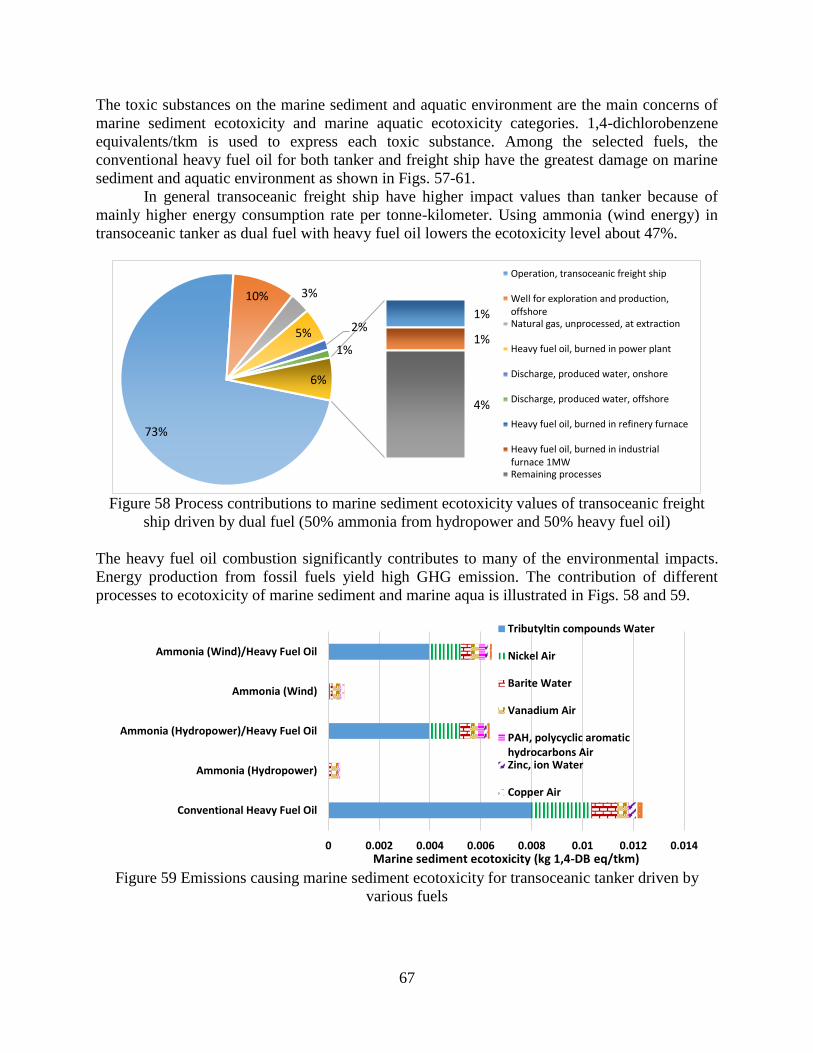
67
The toxic substances on the marine sediment and aquatic environment are the main concerns of
marine sediment ecotoxicity and marine aquatic ecotoxicity categories. 1,4-dichlorobenzene
equivalents/tkm is used to express each toxic substance. Among the selected fuels, the
conventional heavy fuel oil for both tanker and freight ship have the greatest damage on marine
sediment and aquatic environment as shown in Figs. 57-61.
In general transoceanic freight ship have higher impact values than tanker because of
mainly higher energy consumption rate per tonne-kilometer. Using ammonia (wind energy) in
transoceanic tanker as dual fuel with heavy fuel oil lowers the ecotoxicity level about 47%.
Figure 58 Process contributions to marine sediment ecotoxicity values of transoceanic freight
ship driven by dual fuel (50% ammonia from hydropower and 50% heavy fuel oil)
The heavy fuel oil combustion significantly contributes to many of the environmental impacts.
Energy production from fossil fuels yield high GHG emission. The contribution of different
processes to ecotoxicity of marine sediment and marine aqua is illustrated in Figs. 58 and 59.
Figure 59 Emissions causing marine sediment ecotoxicity for transoceanic tanker driven by
various fuels
73%
10% 3%
5% 2%
1%
1%
1%
4%
6%
Operation, transoceanic freight ship
Well for exploration and production,offshoreNatural gas, unprocessed, at extraction
Heavy fuel oil, burned in power plant
Discharge, produced water, onshore
Discharge, produced water, offshore
Heavy fuel oil, burned in refinery furnace
Heavy fuel oil, burned in industrialfurnace 1MWRemaining processes
0 0.002 0.004 0.006 0.008 0.01 0.012 0.014
Conventional Heavy Fuel Oil
Ammonia (Hydropower)
Ammonia (Hydropower)/Heavy Fuel Oil
Ammonia (Wind)
Ammonia (Wind)/Heavy Fuel Oil
Marine sediment ecotoxicity (kg 1,4-DB eq/tkm)
Tributyltin compounds Water
Nickel Air
Barite Water
Vanadium Air
PAH, polycyclic aromatichydrocarbons AirZinc, ion Water
Copper Air
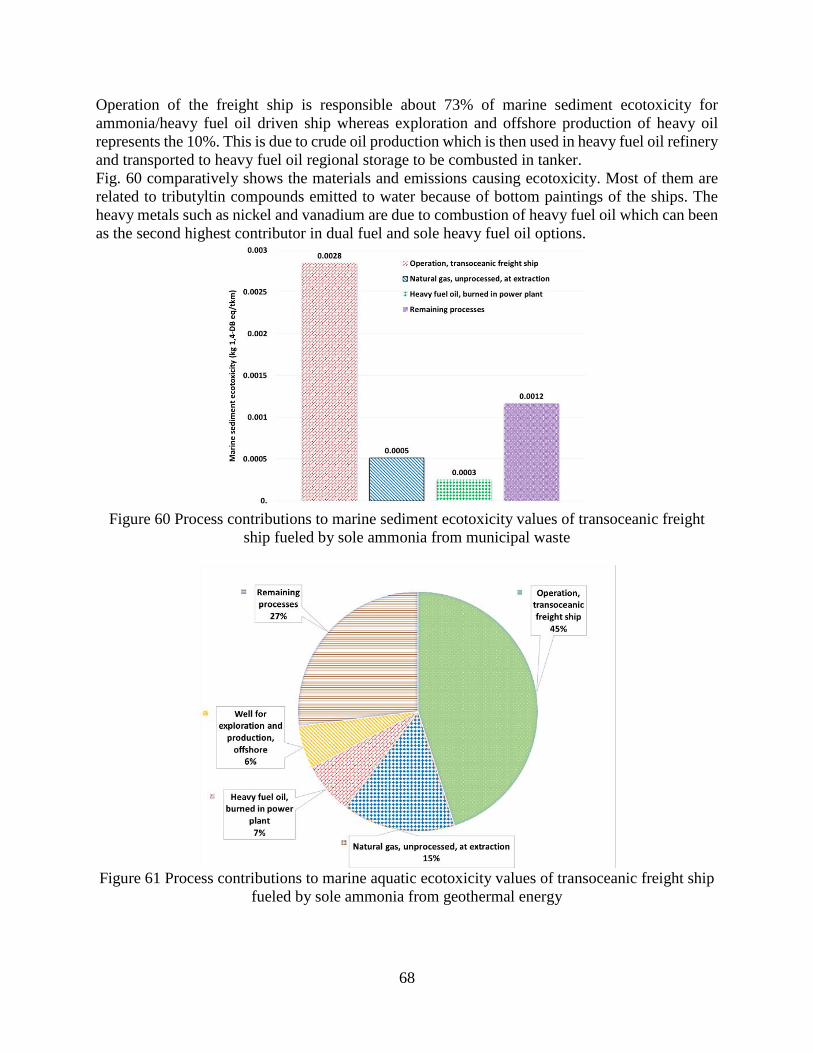
68
Operation of the freight ship is responsible about 73% of marine sediment ecotoxicity for
ammonia/heavy fuel oil driven ship whereas exploration and offshore production of heavy oil
represents the 10%. This is due to crude oil production which is then used in heavy fuel oil refinery
and transported to heavy fuel oil regional storage to be combusted in tanker.
Fig. 60 comparatively shows the materials and emissions causing ecotoxicity. Most of them are
related to tributyltin compounds emitted to water because of bottom paintings of the ships. The
heavy metals such as nickel and vanadium are due to combustion of heavy fuel oil which can been
as the second highest contributor in dual fuel and sole heavy fuel oil options.
Figure 60 Process contributions to marine sediment ecotoxicity values of transoceanic freight
ship fueled by sole ammonia from municipal waste
Figure 61 Process contributions to marine aquatic ecotoxicity values of transoceanic freight ship
fueled by sole ammonia from geothermal energy
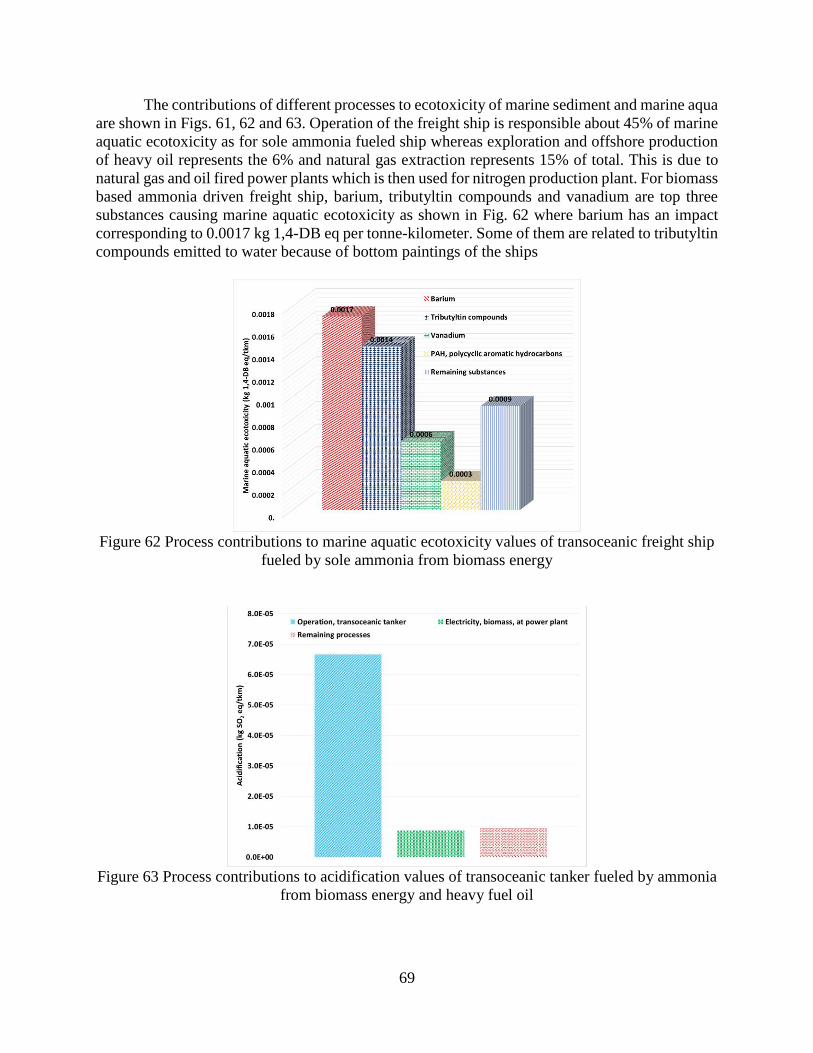
69
The contributions of different processes to ecotoxicity of marine sediment and marine aqua
are shown in Figs. 61, 62 and 63. Operation of the freight ship is responsible about 45% of marine
aquatic ecotoxicity as for sole ammonia fueled ship whereas exploration and offshore production
of heavy oil represents the 6% and natural gas extraction represents 15% of total. This is due to
natural gas and oil fired power plants which is then used for nitrogen production plant. For biomass
based ammonia driven freight ship, barium, tributyltin compounds and vanadium are top three
substances causing marine aquatic ecotoxicity as shown in Fig. 62 where barium has an impact
corresponding to 0.0017 kg 1,4-DB eq per tonne-kilometer. Some of them are related to tributyltin
compounds emitted to water because of bottom paintings of the ships
Figure 62 Process contributions to marine aquatic ecotoxicity values of transoceanic freight ship
fueled by sole ammonia from biomass energy
Figure 63 Process contributions to acidification values of transoceanic tanker fueled by ammonia
from biomass energy and heavy fuel oil
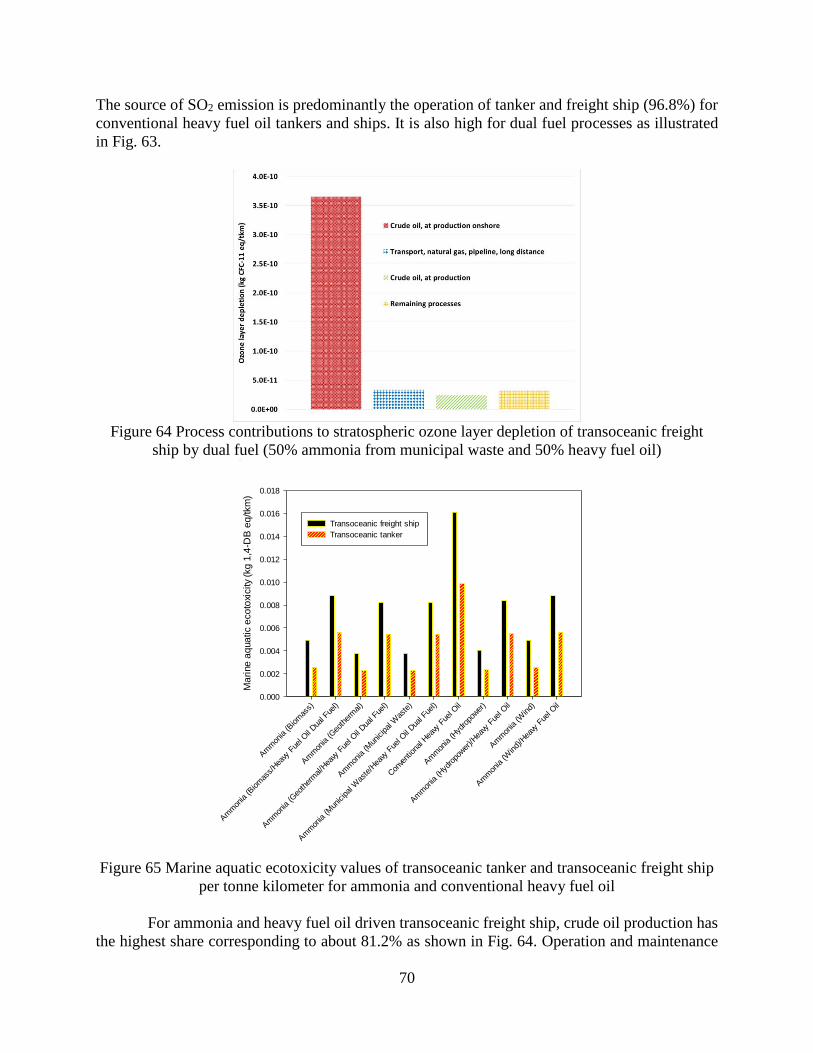
70
The source of SO2 emission is predominantly the operation of tanker and freight ship (96.8%) for
conventional heavy fuel oil tankers and ships. It is also high for dual fuel processes as illustrated
in Fig. 63.
Figure 64 Process contributions to stratospheric ozone layer depletion of transoceanic freight
ship by dual fuel (50% ammonia from municipal waste and 50% heavy fuel oil)
Am
mon
ia (B
iom
ass)
Am
mon
ia (B
iom
ass/
Hea
vy F
uel O
il Dua
l Fue
l)
Am
mon
ia (G
eoth
erm
al)
Am
mon
ia (G
eoth
erm
al/H
eavy
Fue
l Oil Dua
l Fue
l)
Am
mon
ia (M
unicipal W
aste
)
Am
mon
ia (M
unicipal W
aste
/Hea
vy F
uel O
il Dua
l Fue
l)
Con
vent
iona
l Hea
vy F
uel O
il
Am
mon
ia (H
ydro
power
)
Am
mon
ia (H
ydro
power
)/Hea
vy F
uel O
il
Am
mon
ia (W
ind)
Am
mon
ia (W
ind)
/Hea
vy F
uel O
il
Ma
rine
aq
ua
tic e
co
toxi
city
(kg
1,4
-DB
eq
/tkm
)
0.000
0.002
0.004
0.006
0.008
0.010
0.012
0.014
0.016
0.018
Transoceanic freight ship
Transoceanic tanker
Figure 65 Marine aquatic ecotoxicity values of transoceanic tanker and transoceanic freight ship
per tonne kilometer for ammonia and conventional heavy fuel oil
For ammonia and heavy fuel oil driven transoceanic freight ship, crude oil production has
the highest share corresponding to about 81.2% as shown in Fig. 64. Operation and maintenance
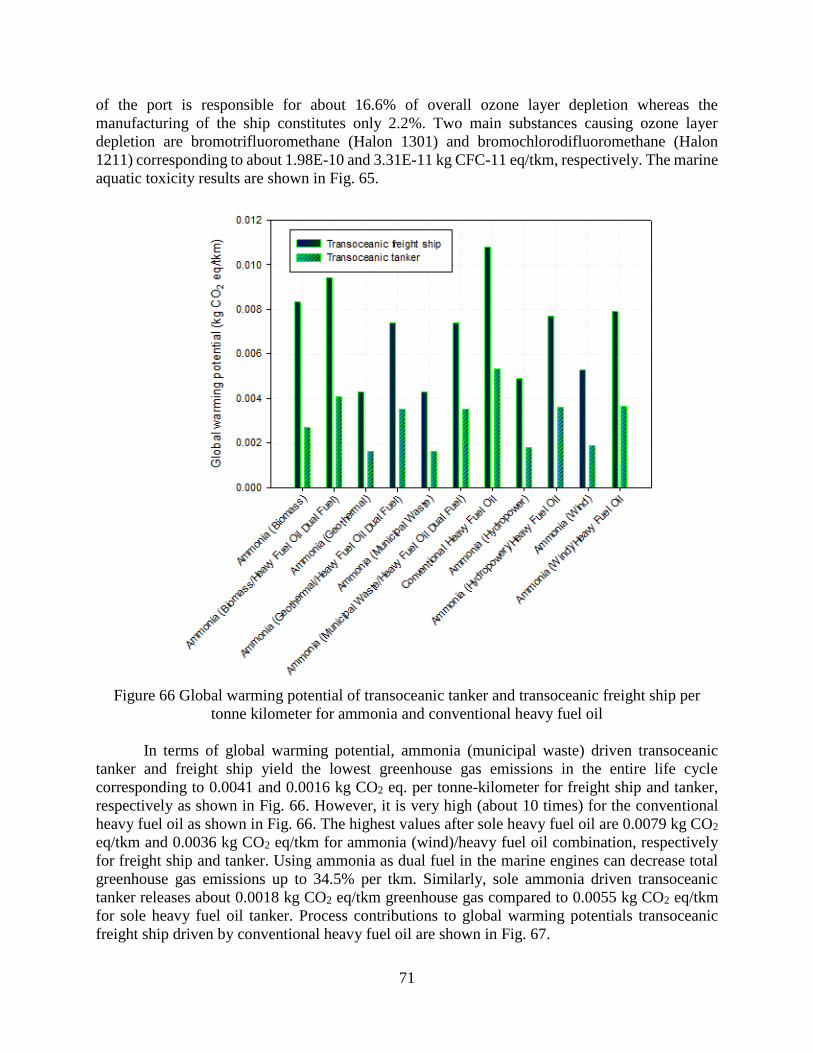
71
of the port is responsible for about 16.6% of overall ozone layer depletion whereas the
manufacturing of the ship constitutes only 2.2%. Two main substances causing ozone layer
depletion are bromotrifluoromethane (Halon 1301) and bromochlorodifluoromethane (Halon
1211) corresponding to about 1.98E-10 and 3.31E-11 kg CFC-11 eq/tkm, respectively. The marine
aquatic toxicity results are shown in Fig. 65.
Figure 66 Global warming potential of transoceanic tanker and transoceanic freight ship per
tonne kilometer for ammonia and conventional heavy fuel oil
In terms of global warming potential, ammonia (municipal waste) driven transoceanic
tanker and freight ship yield the lowest greenhouse gas emissions in the entire life cycle
corresponding to 0.0041 and 0.0016 kg CO2 eq. per tonne-kilometer for freight ship and tanker,
respectively as shown in Fig. 66. However, it is very high (about 10 times) for the conventional
heavy fuel oil as shown in Fig. 66. The highest values after sole heavy fuel oil are 0.0079 kg CO2
eq/tkm and 0.0036 kg CO2 eq/tkm for ammonia (wind)/heavy fuel oil combination, respectively
for freight ship and tanker. Using ammonia as dual fuel in the marine engines can decrease total
greenhouse gas emissions up to 34.5% per tkm. Similarly, sole ammonia driven transoceanic
tanker releases about 0.0018 kg CO2 eq/tkm greenhouse gas compared to 0.0055 kg CO2 eq/tkm
for sole heavy fuel oil tanker. Process contributions to global warming potentials transoceanic
freight ship driven by conventional heavy fuel oil are shown in Fig. 67.
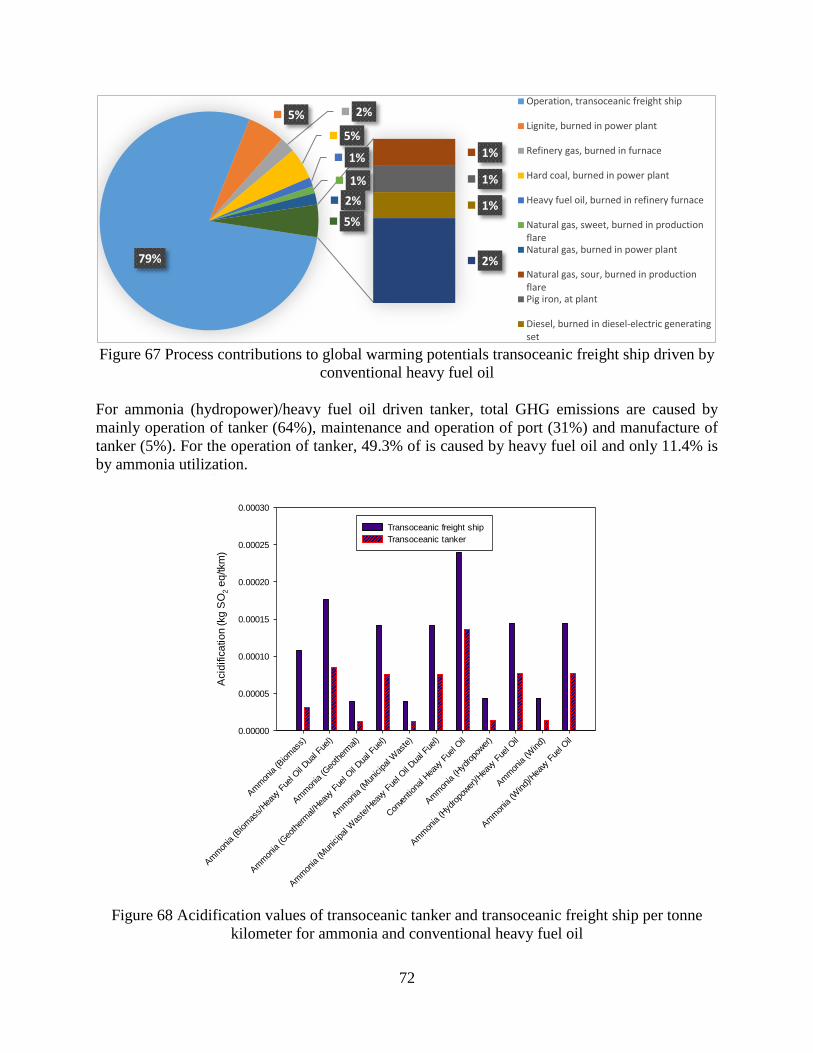
72
Figure 67 Process contributions to global warming potentials transoceanic freight ship driven by
conventional heavy fuel oil
For ammonia (hydropower)/heavy fuel oil driven tanker, total GHG emissions are caused by
mainly operation of tanker (64%), maintenance and operation of port (31%) and manufacture of
tanker (5%). For the operation of tanker, 49.3% of is caused by heavy fuel oil and only 11.4% is
by ammonia utilization.
Am
mon
ia (B
iom
ass)
Am
mon
ia (B
iom
ass/
Hea
vy F
uel O
il Dua
l Fue
l)
Am
mon
ia (G
eoth
erm
al)
Am
mon
ia (G
eoth
erm
al/H
eavy
Fue
l Oil Dua
l Fue
l)
Am
mon
ia (M
unicipal W
aste
)
Am
mon
ia (M
unicipal W
aste
/Hea
vy F
uel O
il Dua
l Fue
l)
Con
vent
iona
l Hea
vy F
uel O
il
Am
mon
ia (H
ydro
power
)
Am
mon
ia (H
ydro
power
)/Hea
vy F
uel O
il
Am
mon
ia (W
ind)
Am
mon
ia (W
ind)
/Hea
vy F
uel O
il
Acid
ific
atio
n (
kg
SO
2 e
q/tkm
)
0.00000
0.00005
0.00010
0.00015
0.00020
0.00025
0.00030
Transoceanic freight ship
Transoceanic tanker
Figure 68 Acidification values of transoceanic tanker and transoceanic freight ship per tonne
kilometer for ammonia and conventional heavy fuel oil
79%
5% 2%
5%
1%
1%
2%
1%
1%
1%
2%
5%
Operation, transoceanic freight ship
Lignite, burned in power plant
Refinery gas, burned in furnace
Hard coal, burned in power plant
Heavy fuel oil, burned in refinery furnace
Natural gas, sweet, burned in productionflareNatural gas, burned in power plant
Natural gas, sour, burned in productionflarePig iron, at plant
Diesel, burned in diesel-electric generatingset
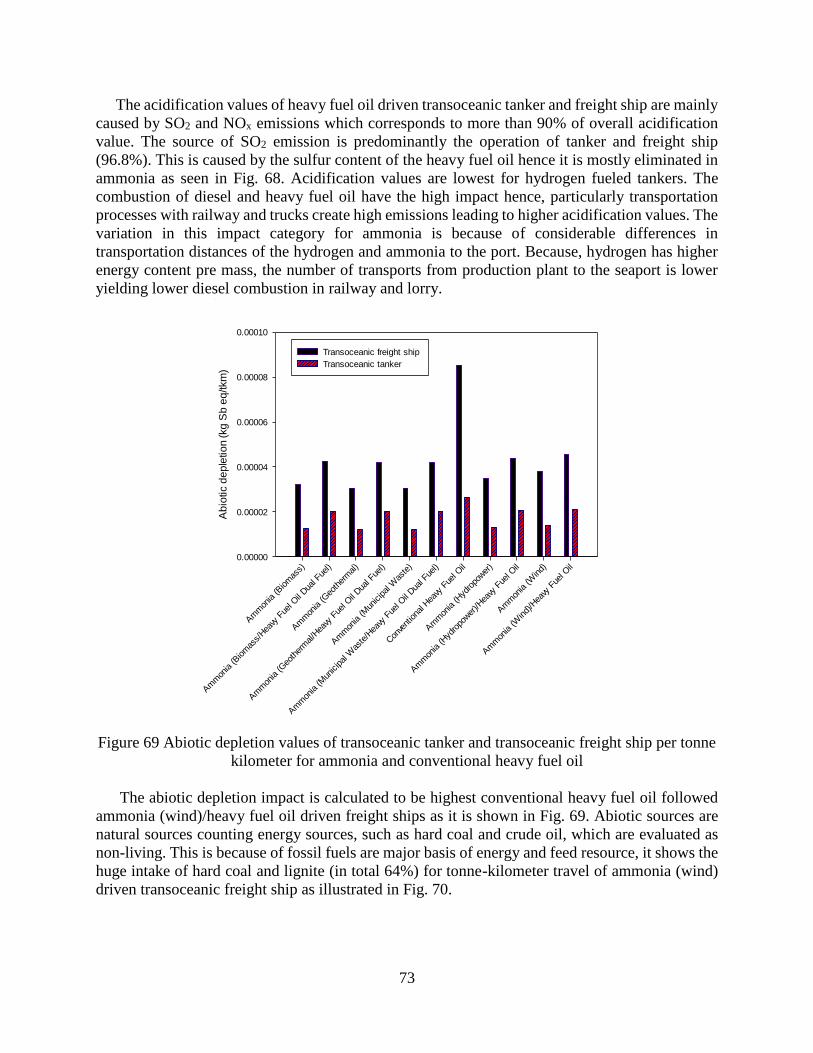
73
The acidification values of heavy fuel oil driven transoceanic tanker and freight ship are mainly
caused by SO2 and NOx emissions which corresponds to more than 90% of overall acidification
value. The source of SO2 emission is predominantly the operation of tanker and freight ship
(96.8%). This is caused by the sulfur content of the heavy fuel oil hence it is mostly eliminated in
ammonia as seen in Fig. 68. Acidification values are lowest for hydrogen fueled tankers. The
combustion of diesel and heavy fuel oil have the high impact hence, particularly transportation
processes with railway and trucks create high emissions leading to higher acidification values. The
variation in this impact category for ammonia is because of considerable differences in
transportation distances of the hydrogen and ammonia to the port. Because, hydrogen has higher
energy content pre mass, the number of transports from production plant to the seaport is lower
yielding lower diesel combustion in railway and lorry.
Am
mon
ia (B
iom
ass)
Am
mon
ia (B
iom
ass/
Hea
vy F
uel O
il Dua
l Fue
l)
Am
mon
ia (G
eoth
erm
al)
Am
mon
ia (G
eoth
erm
al/H
eavy
Fue
l Oil Dua
l Fue
l)
Am
mon
ia (M
unicipal W
aste
)
Am
mon
ia (M
unicipal W
aste
/Hea
vy F
uel O
il Dua
l Fue
l)
Con
vent
iona
l Hea
vy F
uel O
il
Am
mon
ia (H
ydro
power
)
Am
mon
ia (H
ydro
power
)/Hea
vy F
uel O
il
Am
mon
ia (W
ind)
Am
mon
ia (W
ind)
/Hea
vy F
uel O
il
Ab
iotic d
ep
letio
n (
kg
Sb
eq
/tkm
)
0.00000
0.00002
0.00004
0.00006
0.00008
0.00010
Transoceanic freight ship
Transoceanic tanker
Figure 69 Abiotic depletion values of transoceanic tanker and transoceanic freight ship per tonne
kilometer for ammonia and conventional heavy fuel oil
The abiotic depletion impact is calculated to be highest conventional heavy fuel oil followed
ammonia (wind)/heavy fuel oil driven freight ships as it is shown in Fig. 69. Abiotic sources are
natural sources counting energy sources, such as hard coal and crude oil, which are evaluated as
non-living. This is because of fossil fuels are major basis of energy and feed resource, it shows the
huge intake of hard coal and lignite (in total 64%) for tonne-kilometer travel of ammonia (wind)
driven transoceanic freight ship as illustrated in Fig. 70.
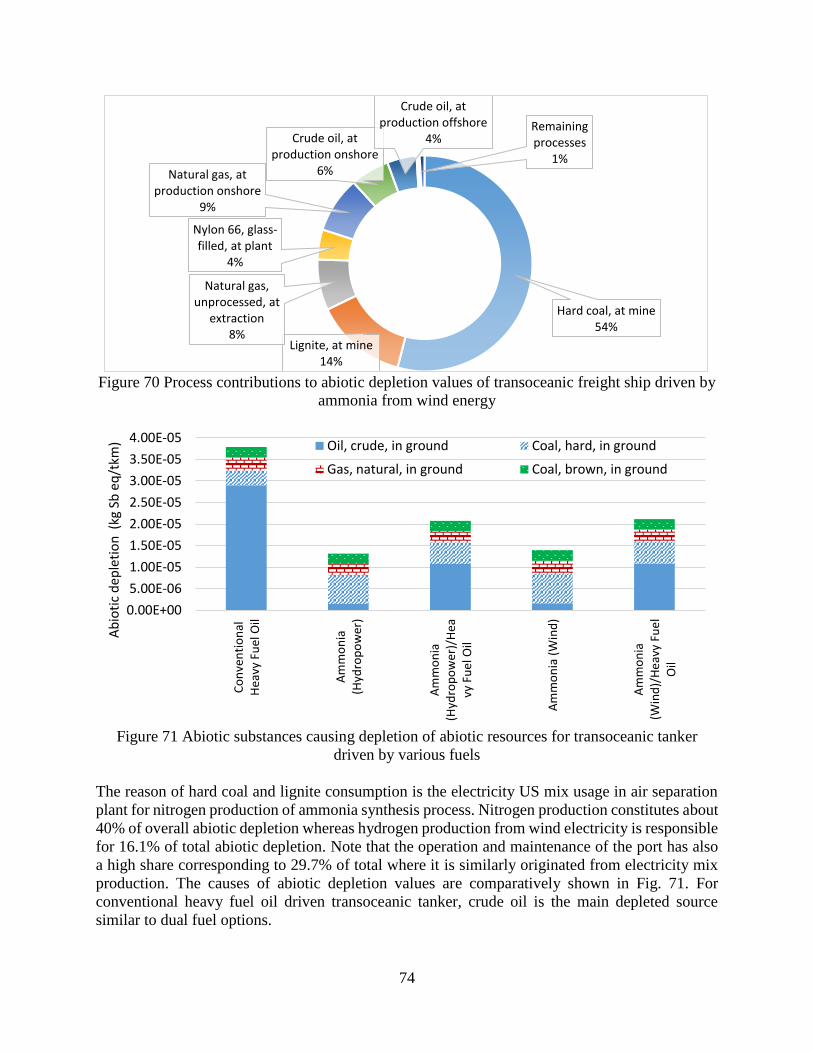
74
Figure 70 Process contributions to abiotic depletion values of transoceanic freight ship driven by
ammonia from wind energy
Figure 71 Abiotic substances causing depletion of abiotic resources for transoceanic tanker
driven by various fuels
The reason of hard coal and lignite consumption is the electricity US mix usage in air separation
plant for nitrogen production of ammonia synthesis process. Nitrogen production constitutes about
40% of overall abiotic depletion whereas hydrogen production from wind electricity is responsible
for 16.1% of total abiotic depletion. Note that the operation and maintenance of the port has also
a high share corresponding to 29.7% of total where it is similarly originated from electricity mix
production. The causes of abiotic depletion values are comparatively shown in Fig. 71. For
conventional heavy fuel oil driven transoceanic tanker, crude oil is the main depleted source
similar to dual fuel options.
Hard coal, at mine54%
Lignite, at mine14%
Natural gas, unprocessed, at
extraction8%
Nylon 66, glass-filled, at plant
4%
Natural gas, at production onshore
9%
Crude oil, at production onshore
6%
Crude oil, at production offshore
4%Remaining processes
1%
0.00E+00
5.00E-06
1.00E-05
1.50E-05
2.00E-05
2.50E-05
3.00E-05
3.50E-05
4.00E-05
Co
nve
nti
on
alH
eavy
Fu
el O
il
Am
mo
nia
(Hyd
rop
ow
er)
Am
mo
nia
(Hyd
rop
ow
er)/
Hea
vy F
ue
l Oil
Am
mo
nia
(W
ind
)
Am
mo
nia
(Win
d)/
He
avy
Fue
lO
il
Ab
ioti
c d
eple
tio
n(k
g Sb
eq
/tkm
) Oil, crude, in ground Coal, hard, in ground
Gas, natural, in ground Coal, brown, in ground
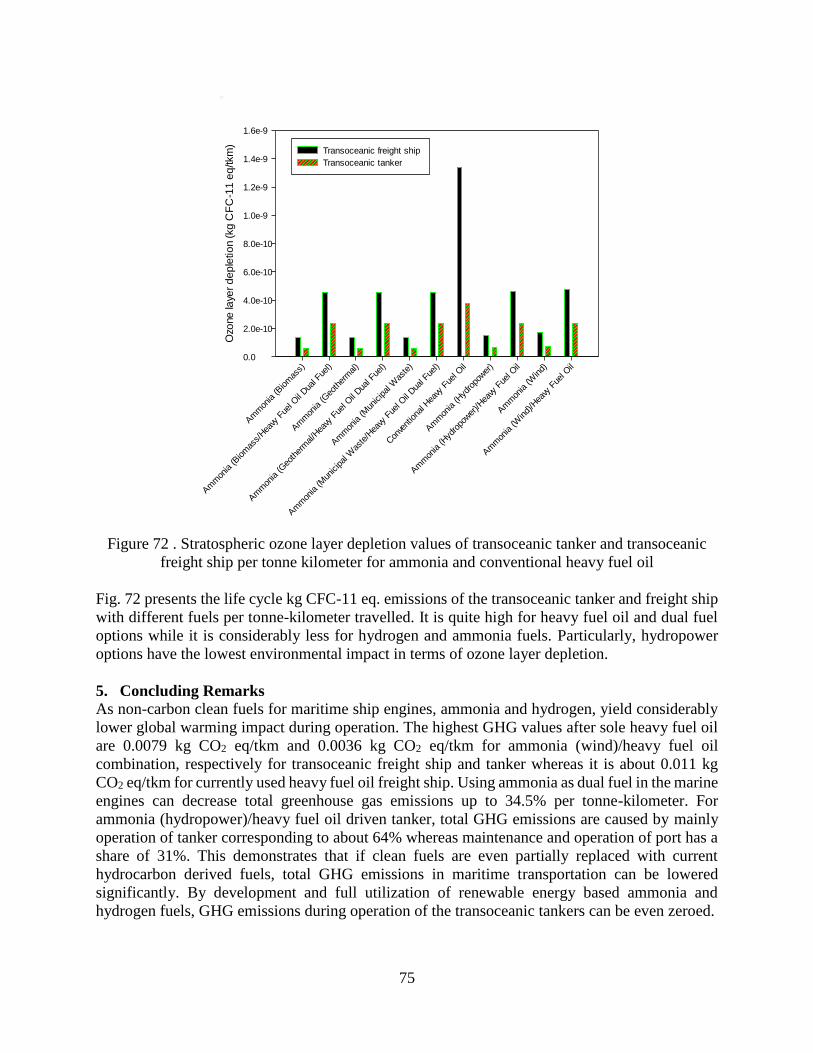
75
Am
mon
ia (B
iom
ass)
Am
mon
ia (B
iom
ass/
Hea
vy F
uel O
il Dua
l Fue
l)
Am
mon
ia (G
eoth
erm
al)
Am
mon
ia (G
eoth
erm
al/H
eavy
Fue
l Oil Dua
l Fue
l)
Am
mon
ia (M
unicipal W
aste
)
Am
mon
ia (M
unicipal W
aste
/Hea
vy F
uel O
il Dua
l Fue
l)
Con
vent
iona
l Hea
vy F
uel O
il
Am
mon
ia (H
ydro
power
)
Am
mon
ia (H
ydro
power
)/Hea
vy F
uel O
il
Am
mon
ia (W
ind)
Am
mon
ia (W
ind)
/Hea
vy F
uel O
il
Ozo
ne
laye
r d
ep
letio
n (
kg
CF
C-1
1 e
q/tkm
)
0.0
2.0e-10
4.0e-10
6.0e-10
8.0e-10
1.0e-9
1.2e-9
1.4e-9
1.6e-9
Transoceanic freight ship
Transoceanic tanker
Figure 72 . Stratospheric ozone layer depletion values of transoceanic tanker and transoceanic
freight ship per tonne kilometer for ammonia and conventional heavy fuel oil
Fig. 72 presents the life cycle kg CFC-11 eq. emissions of the transoceanic tanker and freight ship
with different fuels per tonne-kilometer travelled. It is quite high for heavy fuel oil and dual fuel
options while it is considerably less for hydrogen and ammonia fuels. Particularly, hydropower
options have the lowest environmental impact in terms of ozone layer depletion.
5. Concluding Remarks
As non-carbon clean fuels for maritime ship engines, ammonia and hydrogen, yield considerably
lower global warming impact during operation. The highest GHG values after sole heavy fuel oil
are 0.0079 kg CO2 eq/tkm and 0.0036 kg CO2 eq/tkm for ammonia (wind)/heavy fuel oil
combination, respectively for transoceanic freight ship and tanker whereas it is about 0.011 kg
CO2 eq/tkm for currently used heavy fuel oil freight ship. Using ammonia as dual fuel in the marine
engines can decrease total greenhouse gas emissions up to 34.5% per tonne-kilometer. For
ammonia (hydropower)/heavy fuel oil driven tanker, total GHG emissions are caused by mainly
operation of tanker corresponding to about 64% whereas maintenance and operation of port has a
share of 31%. This demonstrates that if clean fuels are even partially replaced with current
hydrocarbon derived fuels, total GHG emissions in maritime transportation can be lowered
significantly. By development and full utilization of renewable energy based ammonia and
hydrogen fuels, GHG emissions during operation of the transoceanic tankers can be even zeroed.
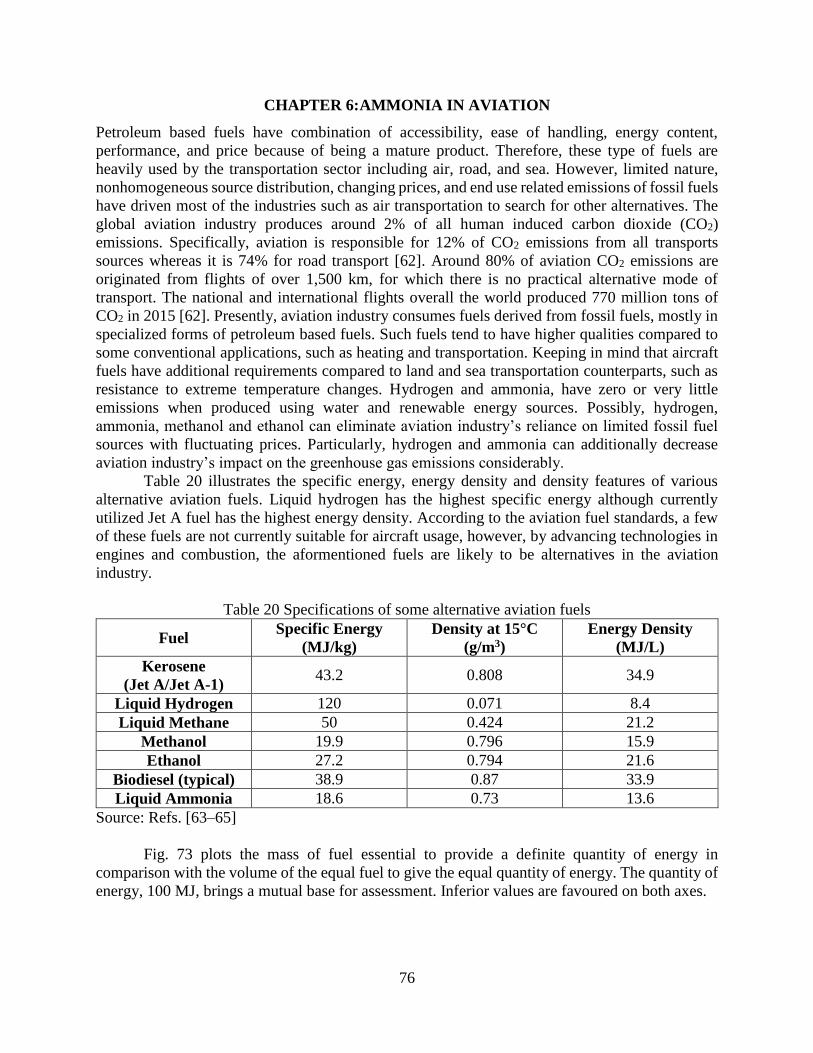
76
CHAPTER 6: AMMONIA IN AVIATION
Petroleum based fuels have combination of accessibility, ease of handling, energy content,
performance, and price because of being a mature product. Therefore, these type of fuels are
heavily used by the transportation sector including air, road, and sea. However, limited nature,
nonhomogeneous source distribution, changing prices, and end use related emissions of fossil fuels
have driven most of the industries such as air transportation to search for other alternatives. The
global aviation industry produces around 2% of all human induced carbon dioxide (CO2)
emissions. Specifically, aviation is responsible for 12% of CO2 emissions from all transports
sources whereas it is 74% for road transport [62]. Around 80% of aviation CO2 emissions are
originated from flights of over 1,500 km, for which there is no practical alternative mode of
transport. The national and international flights overall the world produced 770 million tons of
CO2 in 2015 [62]. Presently, aviation industry consumes fuels derived from fossil fuels, mostly in
specialized forms of petroleum based fuels. Such fuels tend to have higher qualities compared to
some conventional applications, such as heating and transportation. Keeping in mind that aircraft
fuels have additional requirements compared to land and sea transportation counterparts, such as
resistance to extreme temperature changes. Hydrogen and ammonia, have zero or very little
emissions when produced using water and renewable energy sources. Possibly, hydrogen,
ammonia, methanol and ethanol can eliminate aviation industry’s reliance on limited fossil fuel
sources with fluctuating prices. Particularly, hydrogen and ammonia can additionally decrease
aviation industry’s impact on the greenhouse gas emissions considerably.
Table 20 illustrates the specific energy, energy density and density features of various
alternative aviation fuels. Liquid hydrogen has the highest specific energy although currently
utilized Jet A fuel has the highest energy density. According to the aviation fuel standards, a few
of these fuels are not currently suitable for aircraft usage, however, by advancing technologies in
engines and combustion, the aformentioned fuels are likely to be alternatives in the aviation
industry.
Table 20 Specifications of some alternative aviation fuels
Fuel Specific Energy
(MJ/kg)
Density at 15°C
(g/m3)
Energy Density
(MJ/L)
Kerosene
(Jet A/Jet A-1) 43.2 0.808 34.9
Liquid Hydrogen 120 0.071 8.4
Liquid Methane 50 0.424 21.2
Methanol 19.9 0.796 15.9
Ethanol 27.2 0.794 21.6
Biodiesel (typical) 38.9 0.87 33.9
Liquid Ammonia 18.6 0.73 13.6
Source: Refs. [63–65]
Fig. 73 plots the mass of fuel essential to provide a definite quantity of energy in
comparison with the volume of the equal fuel to give the equal quantity of energy. The quantity of
energy, 100 MJ, brings a mutual base for assessment. Inferior values are favoured on both axes.
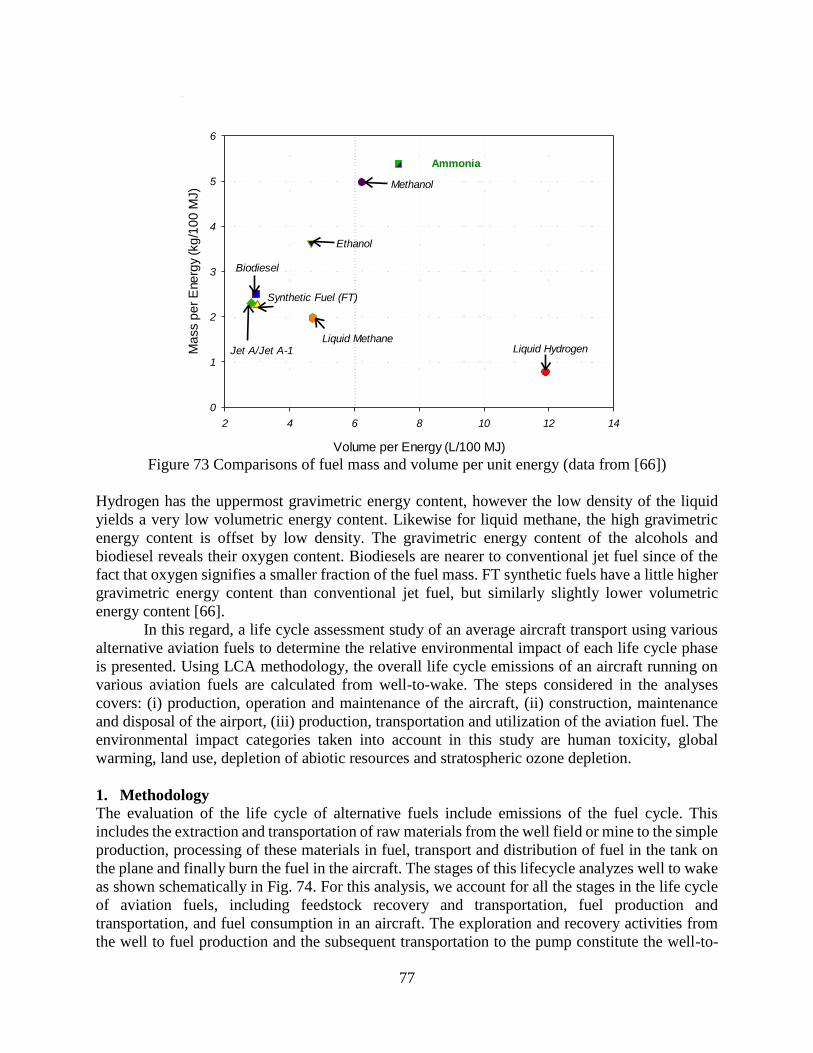
77
Volume per Energy (L/100 MJ)
2 4 6 8 10 12 14
Ma
ss p
er
Ene
rgy
(kg
/10
0 M
J)
0
1
2
3
4
5
6
Methanol
Ethanol
Liquid Methane
Biodiesel
Synthetic Fuel (FT)
Jet A/Jet A-1 Liquid Hydrogen
Ammonia
Figure 73 Comparisons of fuel mass and volume per unit energy (data from [66])
Hydrogen has the uppermost gravimetric energy content, however the low density of the liquid
yields a very low volumetric energy content. Likewise for liquid methane, the high gravimetric
energy content is offset by low density. The gravimetric energy content of the alcohols and
biodiesel reveals their oxygen content. Biodiesels are nearer to conventional jet fuel since of the
fact that oxygen signifies a smaller fraction of the fuel mass. FT synthetic fuels have a little higher
gravimetric energy content than conventional jet fuel, but similarly slightly lower volumetric
energy content [66].
In this regard, a life cycle assessment study of an average aircraft transport using various
alternative aviation fuels to determine the relative environmental impact of each life cycle phase
is presented. Using LCA methodology, the overall life cycle emissions of an aircraft running on
various aviation fuels are calculated from well-to-wake. The steps considered in the analyses
covers: (i) production, operation and maintenance of the aircraft, (ii) construction, maintenance
and disposal of the airport, (iii) production, transportation and utilization of the aviation fuel. The
environmental impact categories taken into account in this study are human toxicity, global
warming, land use, depletion of abiotic resources and stratospheric ozone depletion.
1. Methodology
The evaluation of the life cycle of alternative fuels include emissions of the fuel cycle. This
includes the extraction and transportation of raw materials from the well field or mine to the simple
production, processing of these materials in fuel, transport and distribution of fuel in the tank on
the plane and finally burn the fuel in the aircraft. The stages of this lifecycle analyzes well to wake
as shown schematically in Fig. 74. For this analysis, we account for all the stages in the life cycle
of aviation fuels, including feedstock recovery and transportation, fuel production and
transportation, and fuel consumption in an aircraft. The exploration and recovery activities from
the well to fuel production and the subsequent transportation to the pump constitute the well-to-
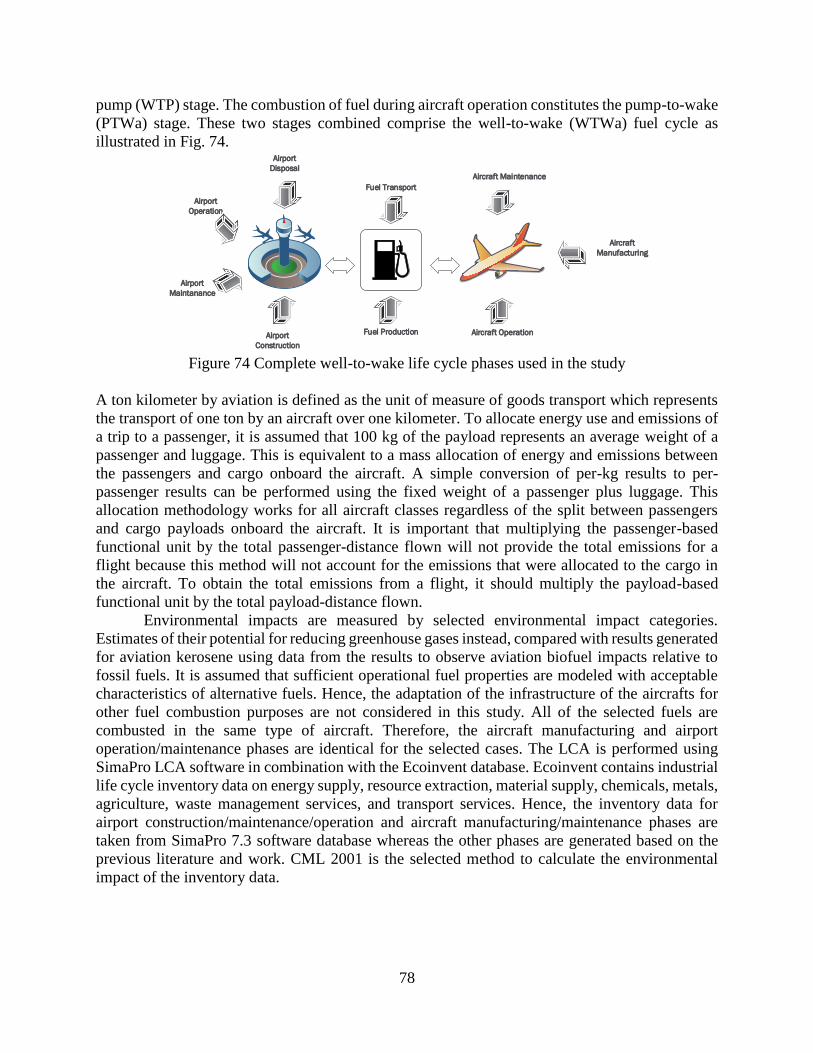
78
pump (WTP) stage. The combustion of fuel during aircraft operation constitutes the pump-to-wake
(PTWa) stage. These two stages combined comprise the well-to-wake (WTWa) fuel cycle as
illustrated in Fig. 74.
Aircraft
Manufacturing
Aircraft OperationAirport
Construction
Aircraft Maintenance
Airport
Disposal
Airport
Operation
Airport
Maintanance
Fuel Production
Fuel Transport
Figure 74 Complete well-to-wake life cycle phases used in the study
A ton kilometer by aviation is defined as the unit of measure of goods transport which represents
the transport of one ton by an aircraft over one kilometer. To allocate energy use and emissions of
a trip to a passenger, it is assumed that 100 kg of the payload represents an average weight of a
passenger and luggage. This is equivalent to a mass allocation of energy and emissions between
the passengers and cargo onboard the aircraft. A simple conversion of per-kg results to per-
passenger results can be performed using the fixed weight of a passenger plus luggage. This
allocation methodology works for all aircraft classes regardless of the split between passengers
and cargo payloads onboard the aircraft. It is important that multiplying the passenger-based
functional unit by the total passenger-distance flown will not provide the total emissions for a
flight because this method will not account for the emissions that were allocated to the cargo in
the aircraft. To obtain the total emissions from a flight, it should multiply the payload-based
functional unit by the total payload-distance flown.
Environmental impacts are measured by selected environmental impact categories.
Estimates of their potential for reducing greenhouse gases instead, compared with results generated
for aviation kerosene using data from the results to observe aviation biofuel impacts relative to
fossil fuels. It is assumed that sufficient operational fuel properties are modeled with acceptable
characteristics of alternative fuels. Hence, the adaptation of the infrastructure of the aircrafts for
other fuel combustion purposes are not considered in this study. All of the selected fuels are
combusted in the same type of aircraft. Therefore, the aircraft manufacturing and airport
operation/maintenance phases are identical for the selected cases. The LCA is performed using
SimaPro LCA software in combination with the Ecoinvent database. Ecoinvent contains industrial
life cycle inventory data on energy supply, resource extraction, material supply, chemicals, metals,
agriculture, waste management services, and transport services. Hence, the inventory data for
airport construction/maintenance/operation and aircraft manufacturing/maintenance phases are
taken from SimaPro 7.3 software database whereas the other phases are generated based on the
previous literature and work. CML 2001 is the selected method to calculate the environmental
impact of the inventory data.
79
2. Description of the Processes
The LCA is divided into three main phases namely; manufacturing of the aircraft, construction and
maintenance of the airport and operation of the aircraft.
Aircraft manufacturing
Material consumption values denote the production of one average aircraft in the referring class
where the net weight of the aircraft is about 234 tonnes. Interventions for production processes of
vehicles are derived from specific exchanges per seat. The aircraft is assumed to have about 367
seats. Inventory data represent 16 European production sites of Airbus company where they are
located in Germany, France, Spain and the UK [60]. The inventory data of aircraft include
processes of material, energy and water use in vehicle manufacturing. Rail and road transport of
materials are considered together with VOC emissions. However, plant infrastructure is not
included. Energy consumption for deionized water is included in the electricity value. Material
expenditures are not accounted for. Transport of vehicle parts between the different sites is
excluded.
Construction and maintenance of airport
In this step, maintenance, construction and disposal of airports are considered. The inventory data
for construction and maintenance of the airport include material consumption and energy
expenditures related with the construction sealed area such as aircraft parking, runways, etc. at
airports. Furthermore, expenditures for buildings are considered. The data include expenditures
due to refurbishment and demolition. The airport is chosen as a major one in Zurich, Switzerland
and has the following specifications: Foundation layer is 40 cm gravel and a life span of 100 years
is considered. Concrete floor is 22 cm with a concrete reinforcement of 1.8 kg steel/m2 and a
lifespan of 30 years is considered. The distance for transport is 25 km. In order to facilitate a first
estimate, the following assumptions are made:
70% of the built up area is occupied with building halls.
30% are multi storey buildings with an average of 5 floors.
The height between the floors is 2.7 m.
Operation of the aircraft
The fuel consumption and airborne emissions are especially significant for this process. For the
airborne emissions, the location of emissions are separated into three main categories; low
population density area, stratosphere and unspecified region. The inventory data include
consumption of selected fuel, which is jet fuel kerosene in conventional applications, and direct
emissions to air as gaseous emissions, particulate emissions, emissions of heavy metals. The
results show the average fuel consumption and emission data caused by an average flight. The
allocation between intercontinental (94.6%) and intra-European (5.4%) transport performance is
made on basis of the yearly transport performance of aircraft departing from Swiss airports. Data
refers to average transport conditions of aircraft departure from Swiss airports.
The aviation transportation segment necessitates fuels with great density of energy and
hence it is primarily dependent on liquid hydrocarbon fuels. Alternative aircraft fuels need to carry
around definite abilities such as good cold flow possessions, thermal steadiness and low freezing
point. The fuel needs to be well matched for the current scheme of the aircraft engine. Sustainable
aircraft fuels should satisfy low carbon emission in the complete life cycles. The energy crops used
80
as the production source should not encounter the food manufacture and ecosystem and also do
not damage the atmosphere and do not cause deforestation.
As alternative fuels, the following options are taken into account in the operation of the
aircraft. The production method of the alternative fuels are also given here
Hydrogen: 95% hydrocarbon cracking and 5% salt brine electrolysis as conventional methods,
hydropower as renewable resource
Methanol: Steam reforming process of methane
Ethanol: Direct hydration of ethylene
Ammonia: Heavy fuel oil and natural gas reforming as conventional methods, hydropower as
renewable resource
Liquefied natural gas: Liquefaction of natural gas in a liquefaction plant
Jet Fuel (Kerosene): Production from crude oil
Kerosene
In the production of kerosene, all procedures on the refinery site discounting the emissions from
combustion services, comprising waste water treatment, process emissions and direct releases to
rivers are accounted for. Explanation of all streams of materials and energy because of the
throughput of 1 kg crude oil in the refinery. The multioutput process crude oil in refinery delivers
the co-products petrol, bitumen, diesel, light fuel oil, heavy fuel oil, kerosene, naphtha, propane/
butane, refinery gas, secondary sulphur and electricity. The influences of handling are allocated to
the different products. Main pointers like energy use were projected based on a survey in European
refineries. Inventory represents the distribution of petroleum product to the final consumer
including all necessary transports. Transportation of product from the refinery to the end user is
the full cycle. Operation of storage tanks and petrol stations are also considered. Emissions from
evaporation and treatment of effluents are taken into account.
Ethanol
Though technical aspects are available to decrease the dangers throughout usual aircraft
operations, important costs would be related with retrofitting present aircraft to admit on ethanol.
Furthermore, the usage of ethanol or butanol would yield decreased operative competences and a
lower energy efficiency of aircraft processes. The specific energy and energy density of ethanol
are each about 40% lesser than the energy density of conventional jet fuel [67]. The production of
ethanol in this study is considered from direct hydration of ethylene including materials, energy
uses, infrastructure and emissions. The inventory is modelled with data from plants in Europe and
India.
LNG
Liquefied natural gas is natural gas that is refrigerated to the liquid phase at around -162.1°C.
Natural gas involves typically of methane, with minor quantities of ethane, propane, and butane,
along with other hydrocarbons. LNG is utilized as an intermediate for natural gas transportation
for over 50 years where the usage continues to grow. Natural gas is one of the greatest plentiful
energy sources with considerable new unconventional resources, such as coal bed methane and
shale gas, being established around the world. Additionally, methane hydrates can deliver more
energy, in the form of methane, than is included in all other fossil fuels. Methane hydrates are
methane particles covered in ice and are possibly accessible about the world. Presently, the
extraction of methane hydrates is problematic because of the position of deposits. Moreover,
81
treatment of the ice needs to be completed with attention so that the methane is not emitted into
the air. The key benefit of LNG comparative to conventional jet fuel is the possible magnitude of
the reserves. The chief drawback is the storing condition in terms of allocating with a fuel that not
only has lower energy density than conventional jet fuel, but that is also cryogenic [67]. LNG
could not be well-suited with current aircraft and it would also necessitate substantial expansion
of the present worldwide distribution network as all of the airports that service LNG-fueled aircraft
would need this fuel. Nevertheless, it is also probable that Fischer-Tropsch synthesis of natural gas
to a synthetic fuel would be both financially and ecologically superior to LNG [67]. The carbon
dioxide emission can be reduced about 25% by the usage of LNG fuel. Engine scheme is a trouble
that has to be taken into account for the commercialization of the LNG fuels. The combustion of
LNG fuel releases methane, which is one of the main GHG. The dataset in this study defines the
liquefaction of natural gas in a liquefaction plant.
Liquid hydrogen
Liquid hydrogen is considered as alternative jet fuel in the last decades. Liquid hydrogen generated
more energy per mass in comparison to conventional aviation fuel, however obliges great storage
volume. The combustion of liquid hydrogen fuel origins low emission of GHG in comparison to
petroleum based jet fuels. There are likewise a few drawbacks of liquid hydrogen. The generation
cost, creation of char and tar as by-products are besides to be faced. The other problematic issue
related with the usage of liquid hydrogen is that when mixed with air, it can burn in low
concentration which will reason safety complications and the storage of hydrogen as liquid is
challenging because it needs low temperature. The emission of moderately high volume of water
vapor is a problem related with hydrogen aircrafts [67]. For the hydrogen generation in this study,
it is assumed that 95% of hydrogen is produced from cracking of fossil fuels, the remaining 5% is
from electrolysis of salt brine. The data represent from raw material extraction until delivery at
plant for all processes. To compare the production of hydrogen from renewable raw materials, the
methods of electrolysis of water from wind, hydropower, geothermal and solar energy are also
evaluated. In renewable cases, the hydrogen production is conducted using electrolyzer consuming
53 kWh per kg of hydrogen.
Liquid ammonia
In terms of conventional resources, naphtha, heavy fuel oil, coal, natural gas coke oven gas and
refinery gas can be used as feedstock in ammonia production. Natural gas is the primary feedstock
used for producing ammonia worldwide. Hence in the current study, it is assumed that 85% of
ammonia is produced via steam methane reforming and 15% is produced via partial oxidation of
heavy fuel oil. The values represent mostly present state of the art technology used in European
ammonia production plants. In order to compare the production of ammonia based on renewable
resources, hydraulic, wind, solar and geothermal energy paths are considered in the analysis. For
renewables based ammonia production, the hydrogen is initially produced from electrolysis as
performed in previous step of hydrogen production and then it is combined with nitrogen in a
Haber-Bosch ammonia plant. Manufacturing process starting with heavy fuel oil and natural gas,
air and electricity is considered including the auxiliaries, energy, transportation, infrastructure and
land use, as well as wastes and emissions into air and water. Transport of the raw materials,
auxiliaries and wastes is include. Carbon dioxide is the by-product generated. Transient or unstable
operations are not considered, but the production is assumed to be during stable operation

82
conditions. Emissions to air are considered as emanating in a high population density area.
Emissions into water are assumed to be emitted into rivers.
Methanol
The production of methanol also offers an important market for the use of otherwise flared natural
gas. Modern natural gas-to-methanol plants are characterized by methanol selectivity above 99%
and energy efficiencies higher than 70%. The raw materials, processing energy, estimate on
catalyst use, and emissions to air and water from process, plant infrastructure are included. The
process describes the production of methanol from natural gas via steam reforming process to
obtain syngas for the production of methanol. There is no CO2 use and hydrogen is assumed as
burned in the furnace. Raw materials, average transportation, emissions to air from tank storage,
estimation for storage infrastructure are included for the distribution part where 40% of the
methanol is assumed to be transported from overseas. The subject matter particulate emissions
cover exhaust- and abrasions emissions. Data for distances from production places to Switzerland
are estimated with actual plant capacities. Similar overseas distances assumed. Additional 13% is
assumed to be from Norway including tanker transport. Other production is within Europe
continent.
Maintenance and operation of the airport
Operation of aircraft infrastructure contains the heat and electricity consumption for aircraft
maintenance and buildings in the airport. A high amount of the heat is consumed at the airport is
produced on-site via natural gas and oil. Additionally, consumption of water, waste of water and
disposal of the wastes are considered. The inventory includes energy expenditures and airport
energy infrastructure. Transport services on airport site are included. The use and emissions of
de-icing materials are taken into account in addition to land transformation and occupation. The
data represent a major airport in Europe. The use of de-icing materials is calculated as the
geometric mean of 3 years.
Transportation via aircraft
In this step, all the previous processes are included for determining the overall life cycle results
per tkm (tonne-kilometer) by considering the operation of aircraft, production of aircraft,
construction and land use of airport, operation, maintenance and disposal of airport. Therefore,
inventory refers to the entire transport life cycle.
Table 21 Fuel and energy requirements of various fueled aircrafts
Fuel Energy Consumption
(MJ/tkm)
Energy Consumption
(MJ/km)
Fuel Consumption
(kg/tkm)
Kerosene (Jet Fuel A) 9.35 343.5 0.21
Hydrogen 8.62 316.5 0.07
Ammonia 9.53 350 0.51
Methanol 9.80 360 0.49
Ethanol 9.80 360 0.33
Natural Gas 12.53 460 0.25
Airport infrastructure expenditures and environmental interventions are accounted for using a
weighted average of Intra-European and intercontinental freight transport performance at the
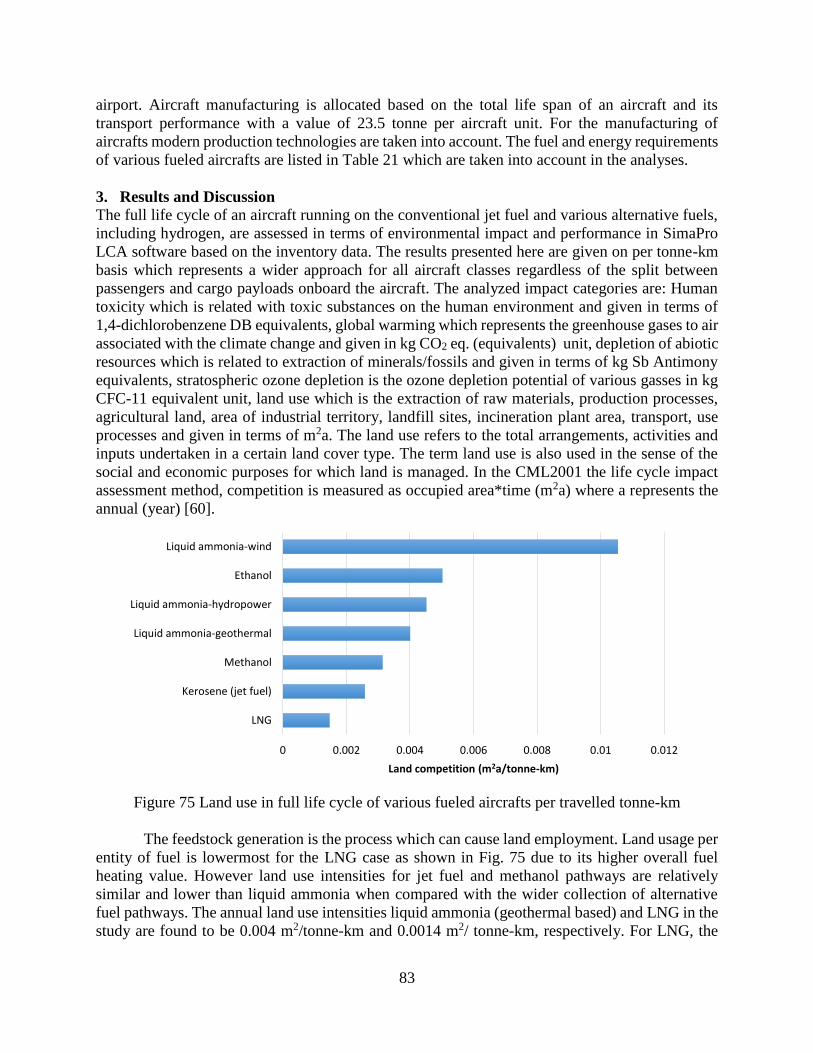
83
airport. Aircraft manufacturing is allocated based on the total life span of an aircraft and its
transport performance with a value of 23.5 tonne per aircraft unit. For the manufacturing of
aircrafts modern production technologies are taken into account. The fuel and energy requirements
of various fueled aircrafts are listed in Table 21 which are taken into account in the analyses.
3. Results and Discussion
The full life cycle of an aircraft running on the conventional jet fuel and various alternative fuels,
including hydrogen, are assessed in terms of environmental impact and performance in SimaPro
LCA software based on the inventory data. The results presented here are given on per tonne-km
basis which represents a wider approach for all aircraft classes regardless of the split between
passengers and cargo payloads onboard the aircraft. The analyzed impact categories are: Human
toxicity which is related with toxic substances on the human environment and given in terms of
1,4-dichlorobenzene DB equivalents, global warming which represents the greenhouse gases to air
associated with the climate change and given in kg CO2 eq. (equivalents) unit, depletion of abiotic
resources which is related to extraction of minerals/fossils and given in terms of kg Sb Antimony
equivalents, stratospheric ozone depletion is the ozone depletion potential of various gasses in kg
CFC-11 equivalent unit, land use which is the extraction of raw materials, production processes,
agricultural land, area of industrial territory, landfill sites, incineration plant area, transport, use
processes and given in terms of m2a. The land use refers to the total arrangements, activities and
inputs undertaken in a certain land cover type. The term land use is also used in the sense of the
social and economic purposes for which land is managed. In the CML2001 the life cycle impact
assessment method, competition is measured as occupied area*time (m2a) where a represents the
annual (year) [60].
Figure 75 Land use in full life cycle of various fueled aircrafts per travelled tonne-km
The feedstock generation is the process which can cause land employment. Land usage per
entity of fuel is lowermost for the LNG case as shown in Fig. 75 due to its higher overall fuel
heating value. However land use intensities for jet fuel and methanol pathways are relatively
similar and lower than liquid ammonia when compared with the wider collection of alternative
fuel pathways. The annual land use intensities liquid ammonia (geothermal based) and LNG in the
study are found to be 0.004 m2/tonne-km and 0.0014 m2/ tonne-km, respectively. For LNG, the
0 0.002 0.004 0.006 0.008 0.01 0.012
LNG
Kerosene (jet fuel)
Methanol
Liquid ammonia-geothermal
Liquid ammonia-hydropower
Ethanol
Liquid ammonia-wind
Land competition (m2a/tonne-km)
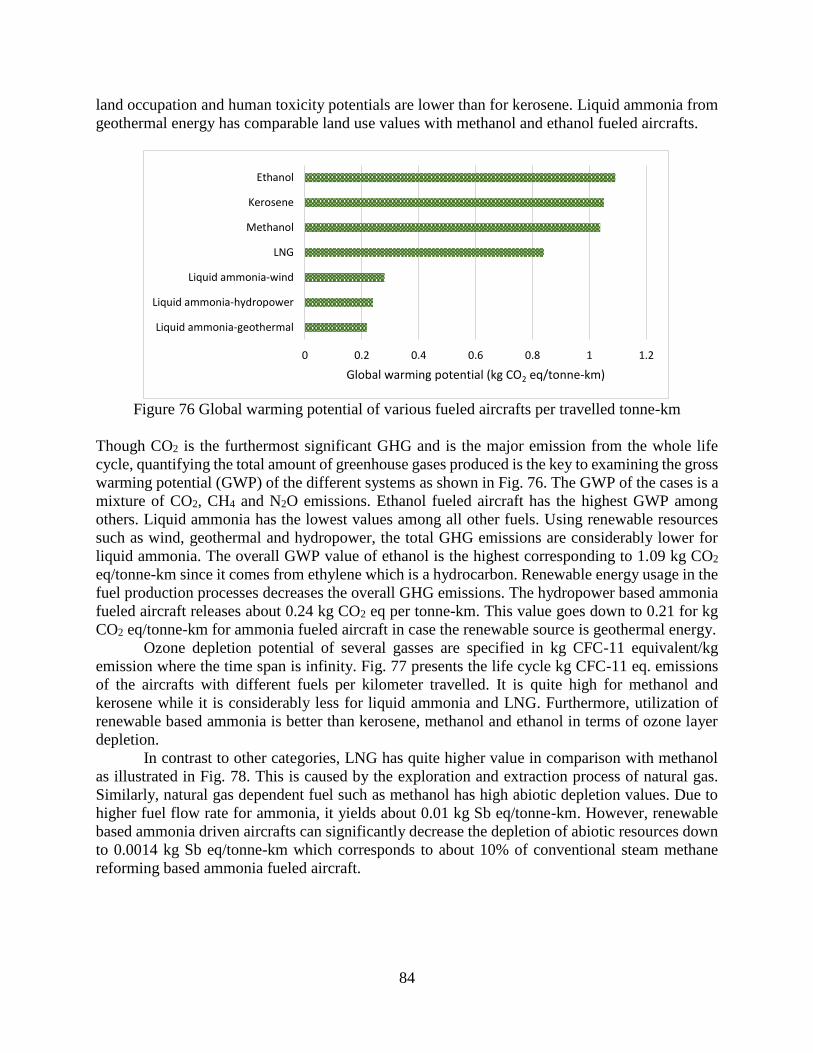
84
land occupation and human toxicity potentials are lower than for kerosene. Liquid ammonia from
geothermal energy has comparable land use values with methanol and ethanol fueled aircrafts.
Figure 76 Global warming potential of various fueled aircrafts per travelled tonne-km
Though CO2 is the furthermost significant GHG and is the major emission from the whole life
cycle, quantifying the total amount of greenhouse gases produced is the key to examining the gross
warming potential (GWP) of the different systems as shown in Fig. 76. The GWP of the cases is a
mixture of CO2, CH4 and N2O emissions. Ethanol fueled aircraft has the highest GWP among
others. Liquid ammonia has the lowest values among all other fuels. Using renewable resources
such as wind, geothermal and hydropower, the total GHG emissions are considerably lower for
liquid ammonia. The overall GWP value of ethanol is the highest corresponding to 1.09 kg CO2
eq/tonne-km since it comes from ethylene which is a hydrocarbon. Renewable energy usage in the
fuel production processes decreases the overall GHG emissions. The hydropower based ammonia
fueled aircraft releases about 0.24 kg CO2 eq per tonne-km. This value goes down to 0.21 for kg
CO2 eq/tonne-km for ammonia fueled aircraft in case the renewable source is geothermal energy.
Ozone depletion potential of several gasses are specified in kg CFC-11 equivalent/kg
emission where the time span is infinity. Fig. 77 presents the life cycle kg CFC-11 eq. emissions
of the aircrafts with different fuels per kilometer travelled. It is quite high for methanol and
kerosene while it is considerably less for liquid ammonia and LNG. Furthermore, utilization of
renewable based ammonia is better than kerosene, methanol and ethanol in terms of ozone layer
depletion.
In contrast to other categories, LNG has quite higher value in comparison with methanol
as illustrated in Fig. 78. This is caused by the exploration and extraction process of natural gas.
Similarly, natural gas dependent fuel such as methanol has high abiotic depletion values. Due to
higher fuel flow rate for ammonia, it yields about 0.01 kg Sb eq/tonne-km. However, renewable
based ammonia driven aircrafts can significantly decrease the depletion of abiotic resources down
to 0.0014 kg Sb eq/tonne-km which corresponds to about 10% of conventional steam methane
reforming based ammonia fueled aircraft.
0 0.2 0.4 0.6 0.8 1 1.2
Liquid ammonia-geothermal
Liquid ammonia-hydropower
Liquid ammonia-wind
LNG
Methanol
Kerosene
Ethanol
Global warming potential (kg CO2 eq/tonne-km)
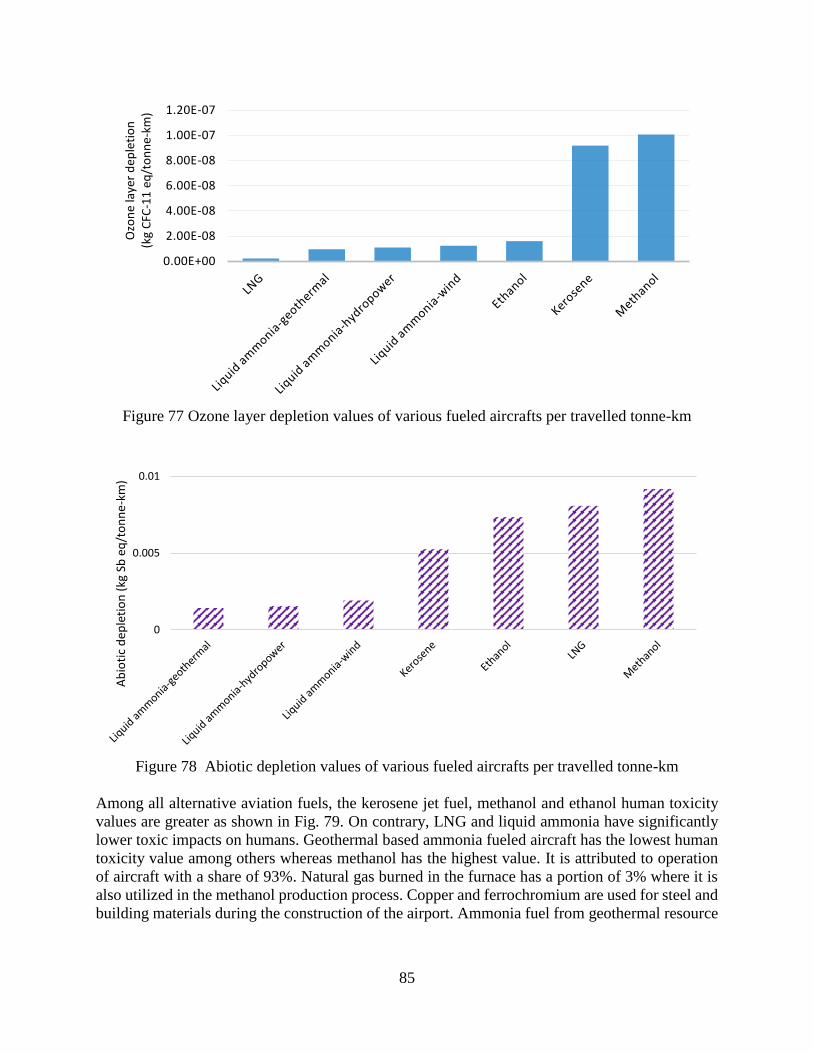
85
Figure 77 Ozone layer depletion values of various fueled aircrafts per travelled tonne-km
Figure 78 Abiotic depletion values of various fueled aircrafts per travelled tonne-km
Among all alternative aviation fuels, the kerosene jet fuel, methanol and ethanol human toxicity
values are greater as shown in Fig. 79. On contrary, LNG and liquid ammonia have significantly
lower toxic impacts on humans. Geothermal based ammonia fueled aircraft has the lowest human
toxicity value among others whereas methanol has the highest value. It is attributed to operation
of aircraft with a share of 93%. Natural gas burned in the furnace has a portion of 3% where it is
also utilized in the methanol production process. Copper and ferrochromium are used for steel and
building materials during the construction of the airport. Ammonia fuel from geothermal resource
0.00E+00
2.00E-08
4.00E-08
6.00E-08
8.00E-08
1.00E-07
1.20E-07
Ozo
ne
laye
r d
eple
tio
n
(kg
CFC
-11
eq
/to
nn
e-km
)
0
0.005
0.01
Ab
ioti
c d
eple
tio
n (
kg S
b e
q/t
on
ne
-km
)
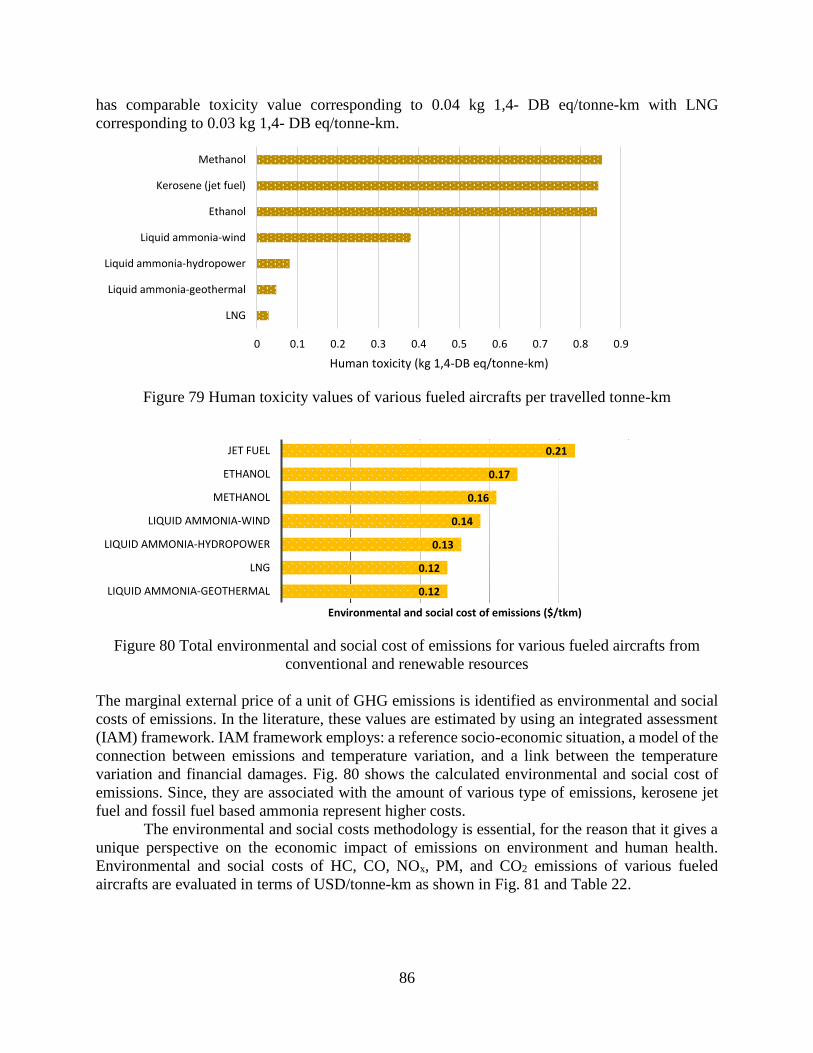
86
has comparable toxicity value corresponding to 0.04 kg 1,4- DB eq/tonne-km with LNG
corresponding to 0.03 kg 1,4- DB eq/tonne-km.
Figure 79 Human toxicity values of various fueled aircrafts per travelled tonne-km
Figure 80 Total environmental and social cost of emissions for various fueled aircrafts from
conventional and renewable resources
The marginal external price of a unit of GHG emissions is identified as environmental and social
costs of emissions. In the literature, these values are estimated by using an integrated assessment
(IAM) framework. IAM framework employs: a reference socio-economic situation, a model of the
connection between emissions and temperature variation, and a link between the temperature
variation and financial damages. Fig. 80 shows the calculated environmental and social cost of
emissions. Since, they are associated with the amount of various type of emissions, kerosene jet
fuel and fossil fuel based ammonia represent higher costs.
The environmental and social costs methodology is essential, for the reason that it gives a
unique perspective on the economic impact of emissions on environment and human health.
Environmental and social costs of HC, CO, NOx, PM, and CO2 emissions of various fueled
aircrafts are evaluated in terms of USD/tonne-km as shown in Fig. 81 and Table 22.
0 0.1 0.2 0.3 0.4 0.5 0.6 0.7 0.8 0.9
LNG
Liquid ammonia-geothermal
Liquid ammonia-hydropower
Liquid ammonia-wind
Ethanol
Kerosene (jet fuel)
Methanol
Human toxicity (kg 1,4-DB eq/tonne-km)
0.12
0.12
0.13
0.14
0.16
0.17
0.21
LIQUID AMMONIA-GEOTHERMAL
LNG
LIQUID AMMONIA-HYDROPOWER
LIQUID AMMONIA-WIND
METHANOL
ETHANOL
JET FUEL
Environmental and social cost of emissions ($/tkm)
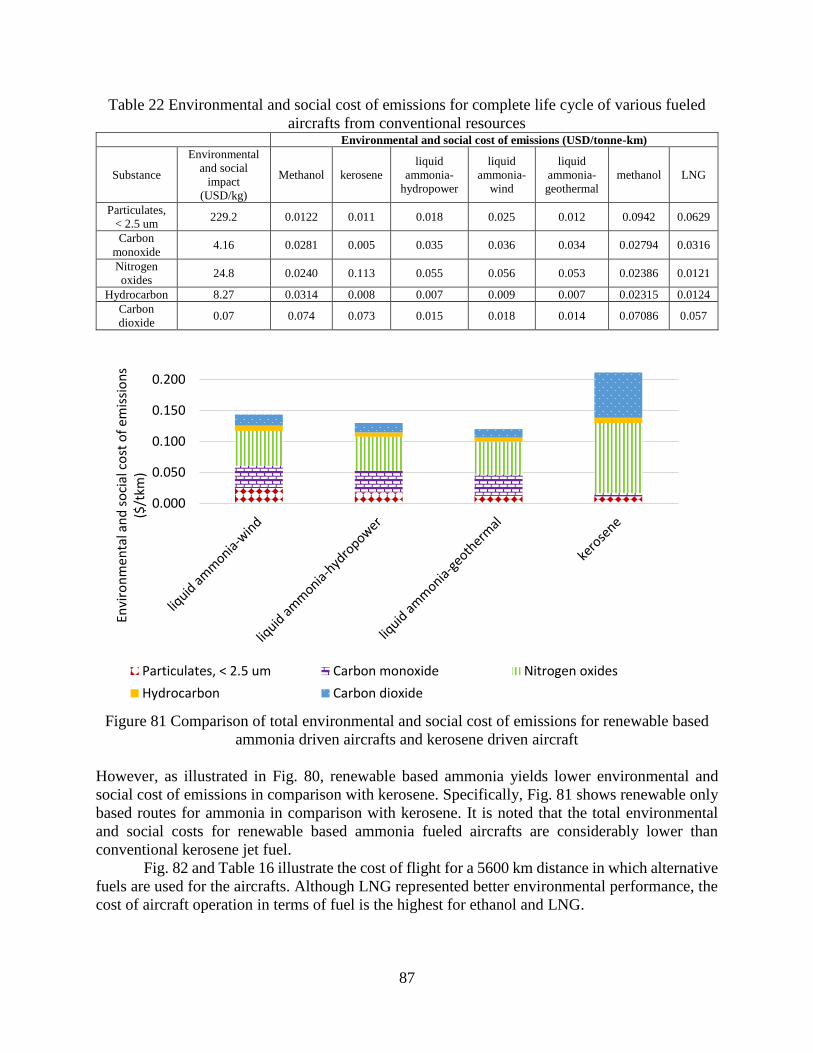
87
Table 22 Environmental and social cost of emissions for complete life cycle of various fueled
aircrafts from conventional resources Environmental and social cost of emissions (USD/tonne-km)
Substance
Environmental
and social
impact
(USD/kg)
Methanol kerosene
liquid
ammonia-
hydropower
liquid
ammonia-
wind
liquid
ammonia-
geothermal
methanol LNG
Particulates,
< 2.5 um 229.2 0.0122 0.011 0.018 0.025 0.012 0.0942 0.0629
Carbon
monoxide 4.16 0.0281 0.005 0.035 0.036 0.034 0.02794 0.0316
Nitrogen
oxides 24.8 0.0240 0.113 0.055 0.056 0.053 0.02386 0.0121
Hydrocarbon 8.27 0.0314 0.008 0.007 0.009 0.007 0.02315 0.0124
Carbon
dioxide 0.07 0.074 0.073 0.015 0.018 0.014 0.07086 0.057
Figure 81 Comparison of total environmental and social cost of emissions for renewable based
ammonia driven aircrafts and kerosene driven aircraft
However, as illustrated in Fig. 80, renewable based ammonia yields lower environmental and
social cost of emissions in comparison with kerosene. Specifically, Fig. 81 shows renewable only
based routes for ammonia in comparison with kerosene. It is noted that the total environmental
and social costs for renewable based ammonia fueled aircrafts are considerably lower than
conventional kerosene jet fuel.
Fig. 82 and Table 16 illustrate the cost of flight for a 5600 km distance in which alternative
fuels are used for the aircrafts. Although LNG represented better environmental performance, the
cost of aircraft operation in terms of fuel is the highest for ethanol and LNG.
0.000
0.050
0.100
0.150
0.200
Envi
ron
men
tal a
nd
so
cial
co
st o
f em
issi
on
s ($
/tkm
)
Particulates, < 2.5 um Carbon monoxide Nitrogen oxides
Hydrocarbon Carbon dioxide
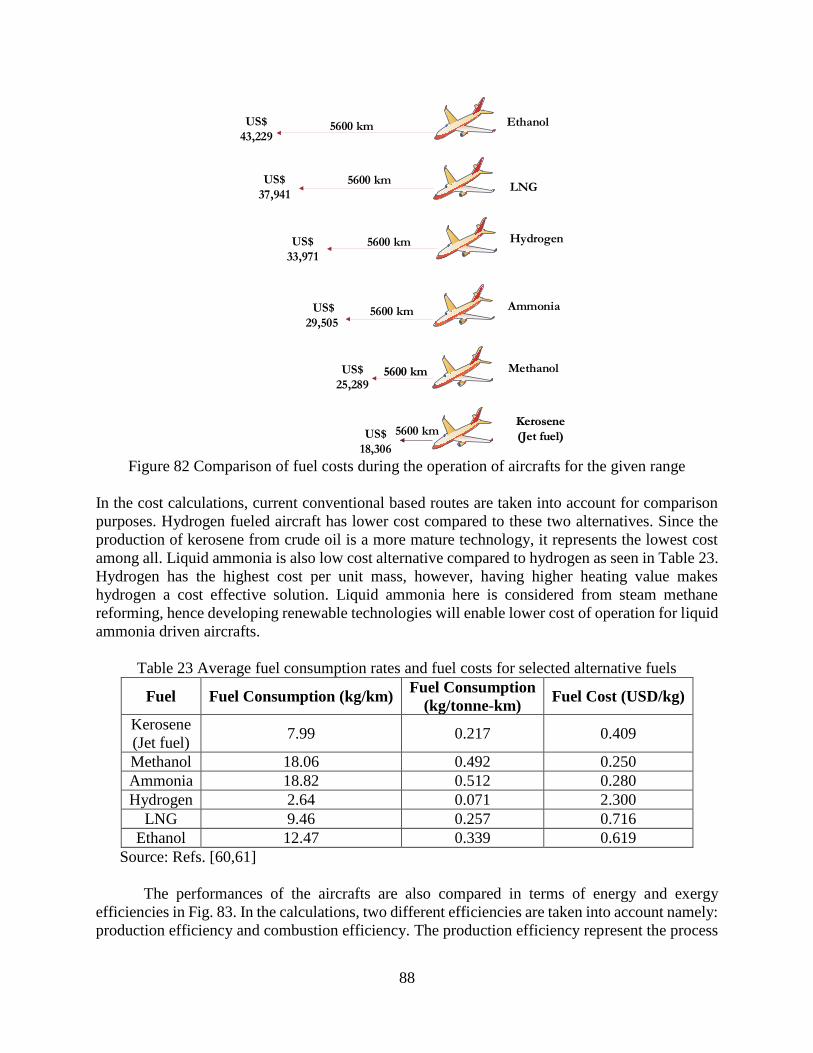
88
5600 km
5600 km
5600 km
5600 km
5600 km
Ethanol
Ammonia
Hydrogen
LNG
Kerosene
(Jet fuel)
US$
43,229
US$
29,505
US$
33,971
US$
37,941
US$
18,306
5600 km
MethanolUS$
25,289
Figure 82 Comparison of fuel costs during the operation of aircrafts for the given range
In the cost calculations, current conventional based routes are taken into account for comparison
purposes. Hydrogen fueled aircraft has lower cost compared to these two alternatives. Since the
production of kerosene from crude oil is a more mature technology, it represents the lowest cost
among all. Liquid ammonia is also low cost alternative compared to hydrogen as seen in Table 23.
Hydrogen has the highest cost per unit mass, however, having higher heating value makes
hydrogen a cost effective solution. Liquid ammonia here is considered from steam methane
reforming, hence developing renewable technologies will enable lower cost of operation for liquid
ammonia driven aircrafts.
Table 23 Average fuel consumption rates and fuel costs for selected alternative fuels
Fuel Fuel Consumption (kg/km) Fuel Consumption
(kg/tonne-km) Fuel Cost (USD/kg)
Kerosene
(Jet fuel) 7.99 0.217 0.409
Methanol 18.06 0.492 0.250
Ammonia 18.82 0.512 0.280
Hydrogen 2.64 0.071 2.300
LNG 9.46 0.257 0.716
Ethanol 12.47 0.339 0.619
Source: Refs. [60,61]
The performances of the aircrafts are also compared in terms of energy and exergy
efficiencies in Fig. 83. In the calculations, two different efficiencies are taken into account namely:
production efficiency and combustion efficiency. The production efficiency represent the process
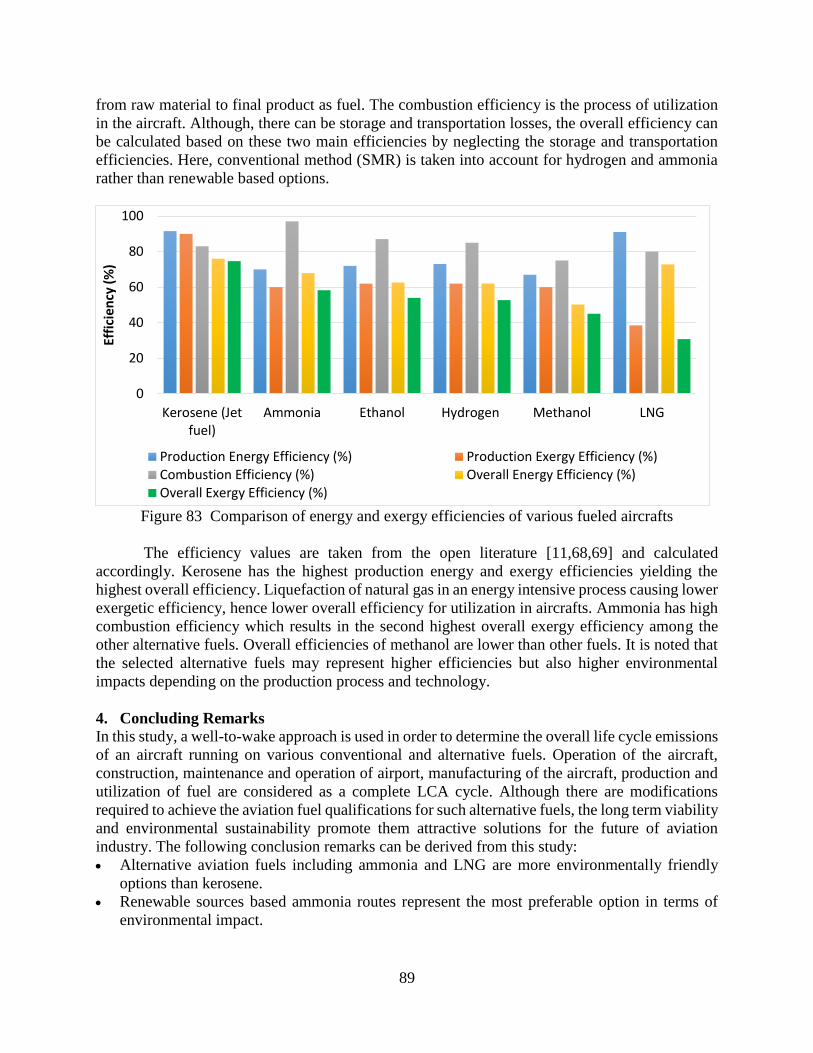
89
from raw material to final product as fuel. The combustion efficiency is the process of utilization
in the aircraft. Although, there can be storage and transportation losses, the overall efficiency can
be calculated based on these two main efficiencies by neglecting the storage and transportation
efficiencies. Here, conventional method (SMR) is taken into account for hydrogen and ammonia
rather than renewable based options.
Figure 83 Comparison of energy and exergy efficiencies of various fueled aircrafts
The efficiency values are taken from the open literature [11,68,69] and calculated
accordingly. Kerosene has the highest production energy and exergy efficiencies yielding the
highest overall efficiency. Liquefaction of natural gas in an energy intensive process causing lower
exergetic efficiency, hence lower overall efficiency for utilization in aircrafts. Ammonia has high
combustion efficiency which results in the second highest overall exergy efficiency among the
other alternative fuels. Overall efficiencies of methanol are lower than other fuels. It is noted that
the selected alternative fuels may represent higher efficiencies but also higher environmental
impacts depending on the production process and technology.
4. Concluding Remarks
In this study, a well-to-wake approach is used in order to determine the overall life cycle emissions
of an aircraft running on various conventional and alternative fuels. Operation of the aircraft,
construction, maintenance and operation of airport, manufacturing of the aircraft, production and
utilization of fuel are considered as a complete LCA cycle. Although there are modifications
required to achieve the aviation fuel qualifications for such alternative fuels, the long term viability
and environmental sustainability promote them attractive solutions for the future of aviation
industry. The following conclusion remarks can be derived from this study:
Alternative aviation fuels including ammonia and LNG are more environmentally friendly
options than kerosene.
Renewable sources based ammonia routes represent the most preferable option in terms of
environmental impact.
0
20
40
60
80
100
Kerosene (Jetfuel)
Ammonia Ethanol Hydrogen Methanol LNG
Effi
cien
cy (
%)
Production Energy Efficiency (%) Production Exergy Efficiency (%)Combustion Efficiency (%) Overall Energy Efficiency (%)Overall Exergy Efficiency (%)

90
Global warming potential of LNG (0.84 kg CO2 per tonne-km) and methanol (1.03 kg CO2 per
tonne-km) driven aircrafts are lower than currently used kerosene based jet fuels.
Renewable resources based ammonia production considerably lowers the environmental
impacts corresponding to 0.23 kg CO2 per tonne-km for hydropower route.
Operation of the aircraft has almost equivalent share (40.7%) with operation and maintenance
of the airport (44.6%) in total GHG emissions. Hence, the energy supply of airport facilities
are also critical when complete life cycle is evaluated.
The environmental cost analyses reveal that nitrogen oxides are the highest contributor
followed by carbon dioxides.
The cost of flight is currently lower for kerosene jet fuels however by developing technologies
the cost of flight for ammonia can compete with conventional jet fuels.
91
CHAPTER 7: AMMONIA IN ROAD TRANSPORTATION
Current vehicles can be converted to run on ammonia by minor modifications. The general
requirements for the conversion of a diesel vehicle engine to dual fuel ammonia engine can be
written as follows:
Installation of separate low pressure ammonia injectors
Replacement of copper and brass parts with stainless steel parts.
Specific arrangement to reduce the injected flow rate of diesel
Replacement of gaskets, nuts and bolts interacting with ammonia with stainless steel.
Installation of control unit for ammonia injection
Installation of temperature and pressure measurement units at intake manifold, engine cooling
fluid, ammonia flow regulator and exhaust.
In case of on-board hydrogen production, a decomposition unit which reduces total diesel
consumption to increase the ammonia combustion performance.
Installation of non-corrosive fuel ammonia tank
Ammonia can be used for multiple purposes in the vehicle. It is a fuel, refrigerant and reduction
agent. The patent developed by UOIT proposes the utilization of ammonia in these major areas.
The requirements for patent US8272353 B2 “Apparatus for using ammonia as a sustainable fuel,
refrigerant and NOx reduction agent” [70] can be summarized as follows:
1. Configuration: ammonia-fueled system for vehicular power and cooling generation
Adaptation of fuel storage tank to store ammonia
A heat exchanger operably connected to the fuel tank
A decomposition and separation unit operably connected to the heat exchangers and having
a hydrogen conduit and a nitrogen conduit,
The decomposition and separation unit is adapted to separate the heated ammonia into
hydrogen and nitrogen and stream them into the hydrogen and nitrogen conduits
an internal combustion engine operably connected to the hydrogen conduit.
2. Configuration: ammonia-fueled hybrid system for propulsion, power, heating and air-
conditioning
a thermally insulated fuel tank adapted to receive ammonia;
a condenser operably connected to the fuel tank;
an evaporator operably connected to the fuel tank,
the condenser and the linear piston;
a selective catalytic reductor operably connected to the fuel tank and operably connected
to the generator,
the selective catalytic reductor is adapted to combine ammonia with nitrogen to reduce the
production of nitrogen oxides.
3. Configuration: ammonia based fuel-cell system with combined power, heating and
refrigeration
the fuel tank adapted to receive ammonia;
a heater operably connected to the fuel tank;
a fuel-cell operably connected to the heater;
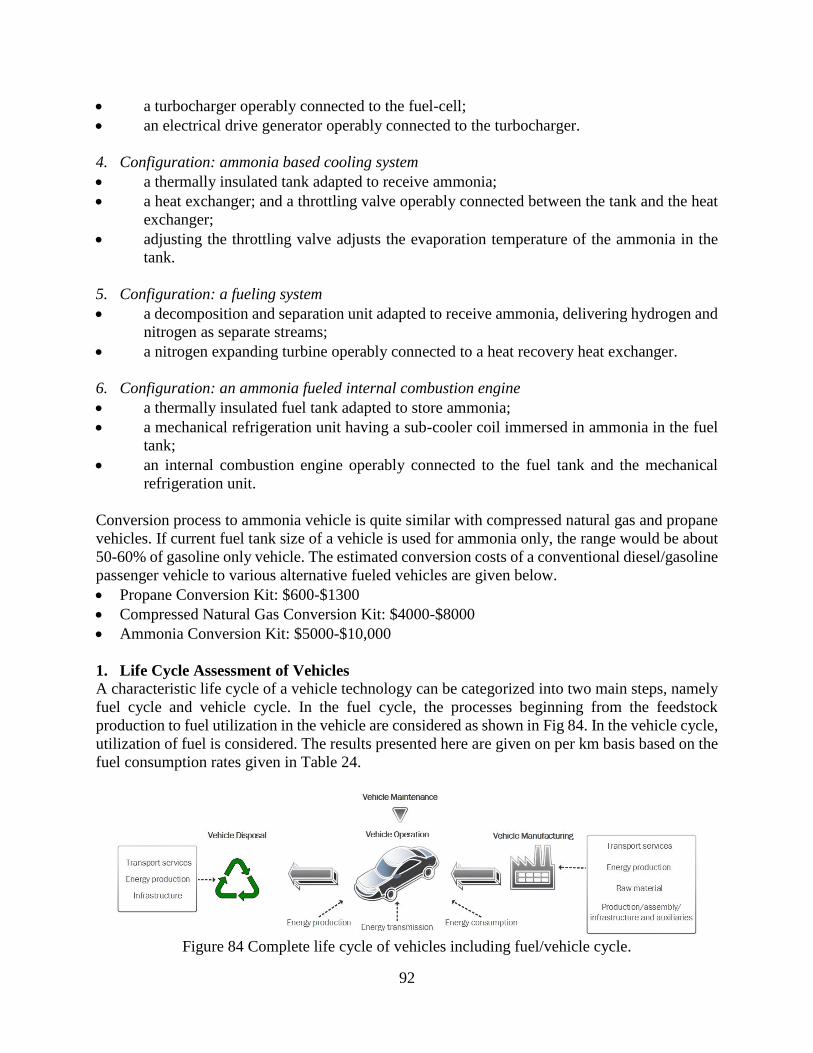
92
a turbocharger operably connected to the fuel-cell;
an electrical drive generator operably connected to the turbocharger.
4. Configuration: ammonia based cooling system
a thermally insulated tank adapted to receive ammonia;
a heat exchanger; and a throttling valve operably connected between the tank and the heat
exchanger;
adjusting the throttling valve adjusts the evaporation temperature of the ammonia in the
tank.
5. Configuration: a fueling system
a decomposition and separation unit adapted to receive ammonia, delivering hydrogen and
nitrogen as separate streams;
a nitrogen expanding turbine operably connected to a heat recovery heat exchanger.
6. Configuration: an ammonia fueled internal combustion engine
a thermally insulated fuel tank adapted to store ammonia;
a mechanical refrigeration unit having a sub-cooler coil immersed in ammonia in the fuel
tank;
an internal combustion engine operably connected to the fuel tank and the mechanical
refrigeration unit.
Conversion process to ammonia vehicle is quite similar with compressed natural gas and propane
vehicles. If current fuel tank size of a vehicle is used for ammonia only, the range would be about
50-60% of gasoline only vehicle. The estimated conversion costs of a conventional diesel/gasoline
passenger vehicle to various alternative fueled vehicles are given below.
Propane Conversion Kit: $600-$1300
Compressed Natural Gas Conversion Kit: $4000-$8000
Ammonia Conversion Kit: $5000-$10,000
1. Life Cycle Assessment of Vehicles
A characteristic life cycle of a vehicle technology can be categorized into two main steps, namely
fuel cycle and vehicle cycle. In the fuel cycle, the processes beginning from the feedstock
production to fuel utilization in the vehicle are considered as shown in Fig 84. In the vehicle cycle,
utilization of fuel is considered. The results presented here are given on per km basis based on the
fuel consumption rates given in Table 24.
Figure 84 Complete life cycle of vehicles including fuel/vehicle cycle.
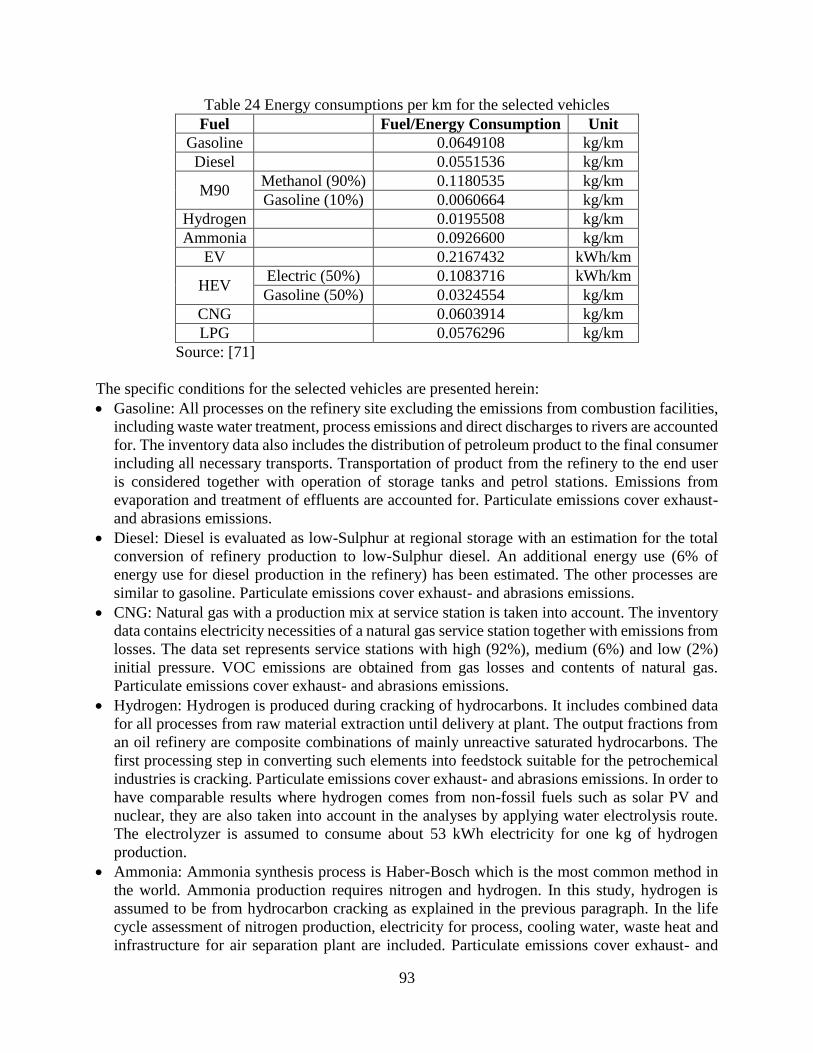
93
Table 24 Energy consumptions per km for the selected vehicles
Fuel Fuel/Energy Consumption Unit
Gasoline 0.0649108 kg/km
Diesel 0.0551536 kg/km
M90 Methanol (90%) 0.1180535 kg/km
Gasoline (10%) 0.0060664 kg/km
Hydrogen 0.0195508 kg/km
Ammonia 0.0926600 kg/km
EV 0.2167432 kWh/km
HEV Electric (50%) 0.1083716 kWh/km
Gasoline (50%) 0.0324554 kg/km
CNG 0.0603914 kg/km
LPG 0.0576296 kg/km
Source: [71]
The specific conditions for the selected vehicles are presented herein:
Gasoline: All processes on the refinery site excluding the emissions from combustion facilities,
including waste water treatment, process emissions and direct discharges to rivers are accounted
for. The inventory data also includes the distribution of petroleum product to the final consumer
including all necessary transports. Transportation of product from the refinery to the end user
is considered together with operation of storage tanks and petrol stations. Emissions from
evaporation and treatment of effluents are accounted for. Particulate emissions cover exhaust-
and abrasions emissions.
Diesel: Diesel is evaluated as low-Sulphur at regional storage with an estimation for the total
conversion of refinery production to low-Sulphur diesel. An additional energy use (6% of
energy use for diesel production in the refinery) has been estimated. The other processes are
similar to gasoline. Particulate emissions cover exhaust- and abrasions emissions.
CNG: Natural gas with a production mix at service station is taken into account. The inventory
data contains electricity necessities of a natural gas service station together with emissions from
losses. The data set represents service stations with high (92%), medium (6%) and low (2%)
initial pressure. VOC emissions are obtained from gas losses and contents of natural gas.
Particulate emissions cover exhaust- and abrasions emissions.
Hydrogen: Hydrogen is produced during cracking of hydrocarbons. It includes combined data
for all processes from raw material extraction until delivery at plant. The output fractions from
an oil refinery are composite combinations of mainly unreactive saturated hydrocarbons. The
first processing step in converting such elements into feedstock suitable for the petrochemical
industries is cracking. Particulate emissions cover exhaust- and abrasions emissions. In order to
have comparable results where hydrogen comes from non-fossil fuels such as solar PV and
nuclear, they are also taken into account in the analyses by applying water electrolysis route.
The electrolyzer is assumed to consume about 53 kWh electricity for one kg of hydrogen
production.
Ammonia: Ammonia synthesis process is Haber-Bosch which is the most common method in
the world. Ammonia production requires nitrogen and hydrogen. In this study, hydrogen is
assumed to be from hydrocarbon cracking as explained in the previous paragraph. In the life
cycle assessment of nitrogen production, electricity for process, cooling water, waste heat and
infrastructure for air separation plant are included. Particulate emissions cover exhaust- and
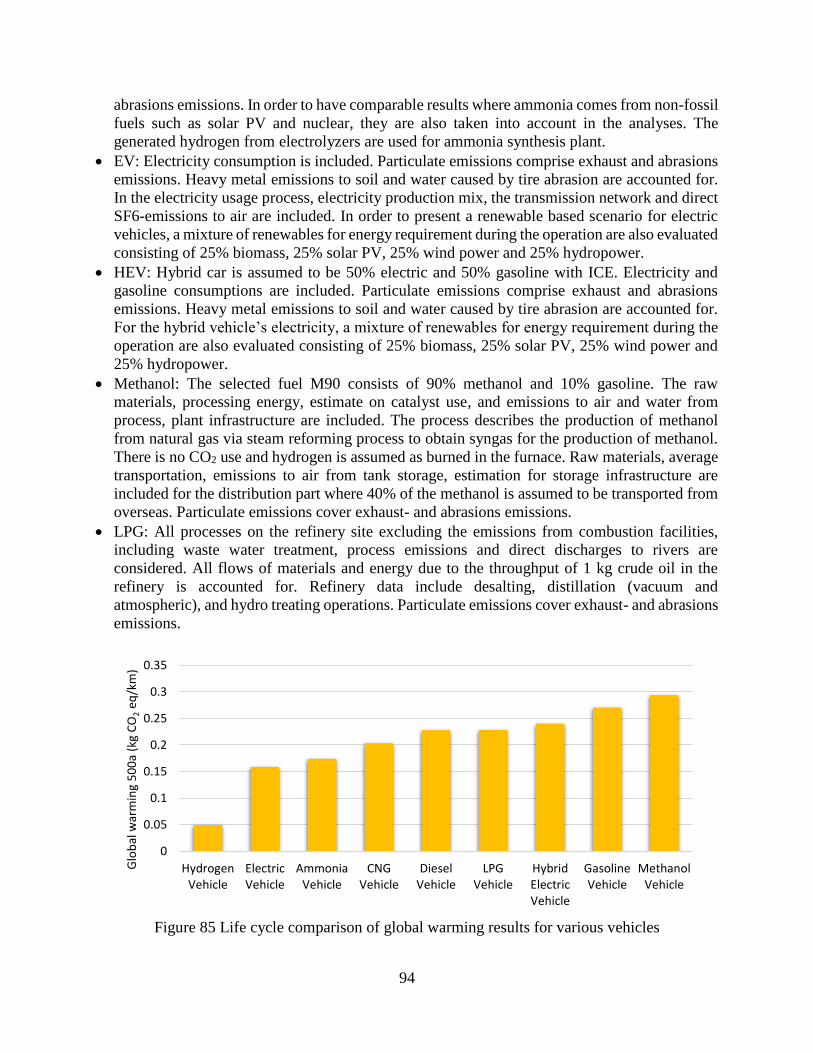
94
abrasions emissions. In order to have comparable results where ammonia comes from non-fossil
fuels such as solar PV and nuclear, they are also taken into account in the analyses. The
generated hydrogen from electrolyzers are used for ammonia synthesis plant.
EV: Electricity consumption is included. Particulate emissions comprise exhaust and abrasions
emissions. Heavy metal emissions to soil and water caused by tire abrasion are accounted for.
In the electricity usage process, electricity production mix, the transmission network and direct
SF6-emissions to air are included. In order to present a renewable based scenario for electric
vehicles, a mixture of renewables for energy requirement during the operation are also evaluated
consisting of 25% biomass, 25% solar PV, 25% wind power and 25% hydropower.
HEV: Hybrid car is assumed to be 50% electric and 50% gasoline with ICE. Electricity and
gasoline consumptions are included. Particulate emissions comprise exhaust and abrasions
emissions. Heavy metal emissions to soil and water caused by tire abrasion are accounted for.
For the hybrid vehicle’s electricity, a mixture of renewables for energy requirement during the
operation are also evaluated consisting of 25% biomass, 25% solar PV, 25% wind power and
25% hydropower.
Methanol: The selected fuel M90 consists of 90% methanol and 10% gasoline. The raw
materials, processing energy, estimate on catalyst use, and emissions to air and water from
process, plant infrastructure are included. The process describes the production of methanol
from natural gas via steam reforming process to obtain syngas for the production of methanol.
There is no CO2 use and hydrogen is assumed as burned in the furnace. Raw materials, average
transportation, emissions to air from tank storage, estimation for storage infrastructure are
included for the distribution part where 40% of the methanol is assumed to be transported from
overseas. Particulate emissions cover exhaust- and abrasions emissions.
LPG: All processes on the refinery site excluding the emissions from combustion facilities,
including waste water treatment, process emissions and direct discharges to rivers are
considered. All flows of materials and energy due to the throughput of 1 kg crude oil in the
refinery is accounted for. Refinery data include desalting, distillation (vacuum and
atmospheric), and hydro treating operations. Particulate emissions cover exhaust- and abrasions
emissions.
Figure 85 Life cycle comparison of global warming results for various vehicles
0
0.05
0.1
0.15
0.2
0.25
0.3
0.35
HydrogenVehicle
ElectricVehicle
AmmoniaVehicle
CNGVehicle
DieselVehicle
LPGVehicle
HybridElectricVehicle
GasolineVehicle
MethanolVehicle
Glo
bal
war
min
g 5
00
a (k
g C
O2
eq/k
m)
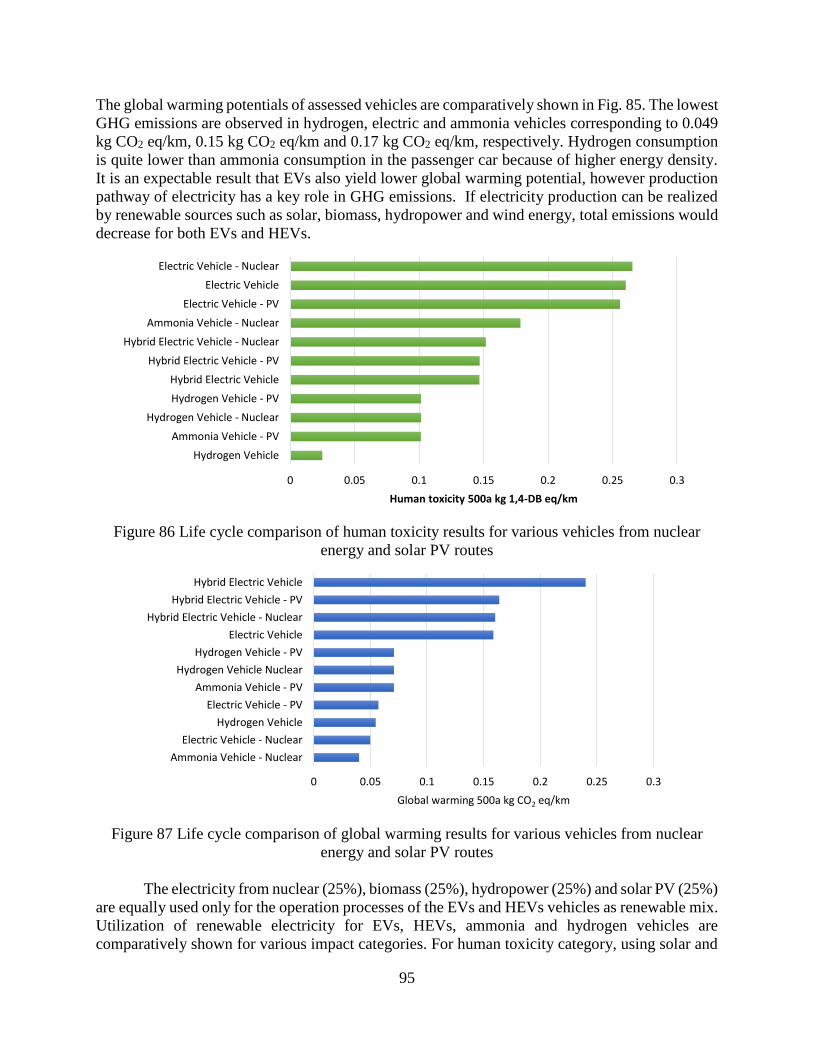
95
The global warming potentials of assessed vehicles are comparatively shown in Fig. 85. The lowest
GHG emissions are observed in hydrogen, electric and ammonia vehicles corresponding to 0.049
kg CO2 eq/km, 0.15 kg CO2 eq/km and 0.17 kg CO2 eq/km, respectively. Hydrogen consumption
is quite lower than ammonia consumption in the passenger car because of higher energy density.
It is an expectable result that EVs also yield lower global warming potential, however production
pathway of electricity has a key role in GHG emissions. If electricity production can be realized
by renewable sources such as solar, biomass, hydropower and wind energy, total emissions would
decrease for both EVs and HEVs.
Figure 86 Life cycle comparison of human toxicity results for various vehicles from nuclear
energy and solar PV routes
Figure 87 Life cycle comparison of global warming results for various vehicles from nuclear
energy and solar PV routes
The electricity from nuclear (25%), biomass (25%), hydropower (25%) and solar PV (25%)
are equally used only for the operation processes of the EVs and HEVs vehicles as renewable mix.
Utilization of renewable electricity for EVs, HEVs, ammonia and hydrogen vehicles are
comparatively shown for various impact categories. For human toxicity category, using solar and
0 0.05 0.1 0.15 0.2 0.25 0.3
Hydrogen Vehicle
Ammonia Vehicle - PV
Hydrogen Vehicle - Nuclear
Hydrogen Vehicle - PV
Hybrid Electric Vehicle
Hybrid Electric Vehicle - PV
Hybrid Electric Vehicle - Nuclear
Ammonia Vehicle - Nuclear
Electric Vehicle - PV
Electric Vehicle
Electric Vehicle - Nuclear
Human toxicity 500a kg 1,4-DB eq/km
0 0.05 0.1 0.15 0.2 0.25 0.3
Ammonia Vehicle - Nuclear
Electric Vehicle - Nuclear
Hydrogen Vehicle
Electric Vehicle - PV
Ammonia Vehicle - PV
Hydrogen Vehicle Nuclear
Hydrogen Vehicle - PV
Electric Vehicle
Hybrid Electric Vehicle - Nuclear
Hybrid Electric Vehicle - PV
Hybrid Electric Vehicle
Global warming 500a kg CO2 eq/km
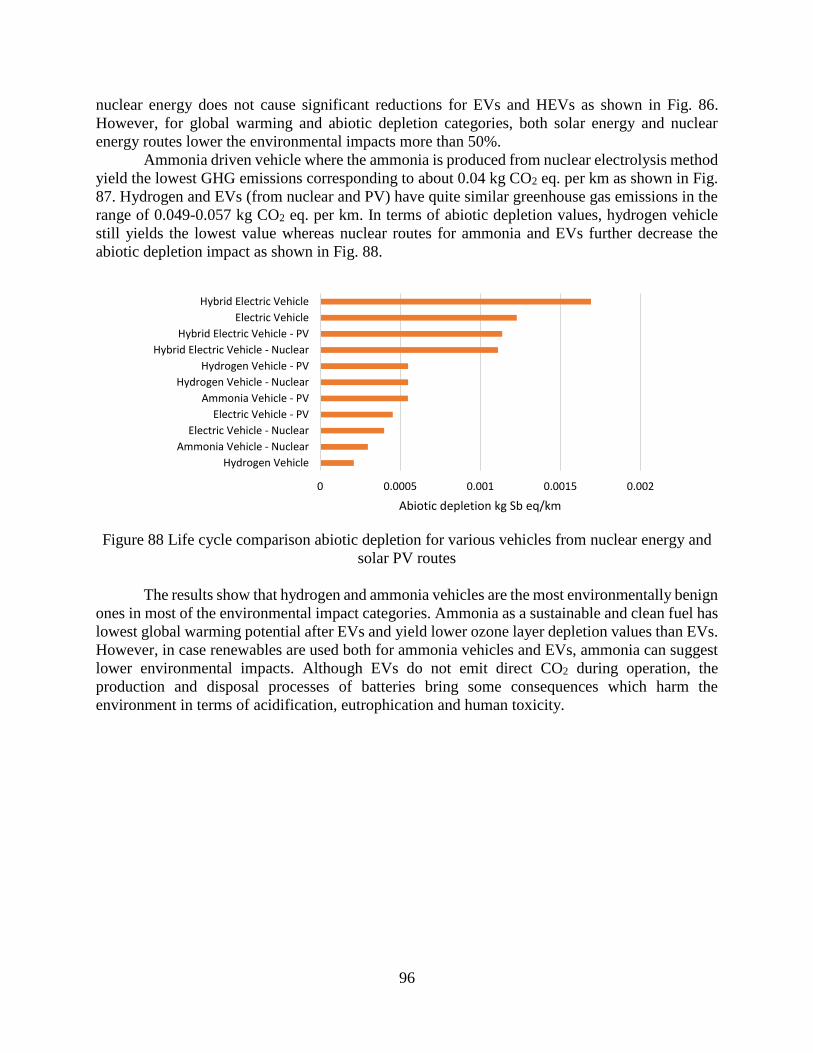
96
nuclear energy does not cause significant reductions for EVs and HEVs as shown in Fig. 86.
However, for global warming and abiotic depletion categories, both solar energy and nuclear
energy routes lower the environmental impacts more than 50%.
Ammonia driven vehicle where the ammonia is produced from nuclear electrolysis method
yield the lowest GHG emissions corresponding to about 0.04 kg CO2 eq. per km as shown in Fig.
87. Hydrogen and EVs (from nuclear and PV) have quite similar greenhouse gas emissions in the
range of 0.049-0.057 kg CO2 eq. per km. In terms of abiotic depletion values, hydrogen vehicle
still yields the lowest value whereas nuclear routes for ammonia and EVs further decrease the
abiotic depletion impact as shown in Fig. 88.
Figure 88 Life cycle comparison abiotic depletion for various vehicles from nuclear energy and
solar PV routes
The results show that hydrogen and ammonia vehicles are the most environmentally benign
ones in most of the environmental impact categories. Ammonia as a sustainable and clean fuel has
lowest global warming potential after EVs and yield lower ozone layer depletion values than EVs.
However, in case renewables are used both for ammonia vehicles and EVs, ammonia can suggest
lower environmental impacts. Although EVs do not emit direct CO2 during operation, the
production and disposal processes of batteries bring some consequences which harm the
environment in terms of acidification, eutrophication and human toxicity.
0 0.0005 0.001 0.0015 0.002
Hydrogen Vehicle
Ammonia Vehicle - Nuclear
Electric Vehicle - Nuclear
Electric Vehicle - PV
Ammonia Vehicle - PV
Hydrogen Vehicle - Nuclear
Hydrogen Vehicle - PV
Hybrid Electric Vehicle - Nuclear
Hybrid Electric Vehicle - PV
Electric Vehicle
Hybrid Electric Vehicle
Abiotic depletion kg Sb eq/km
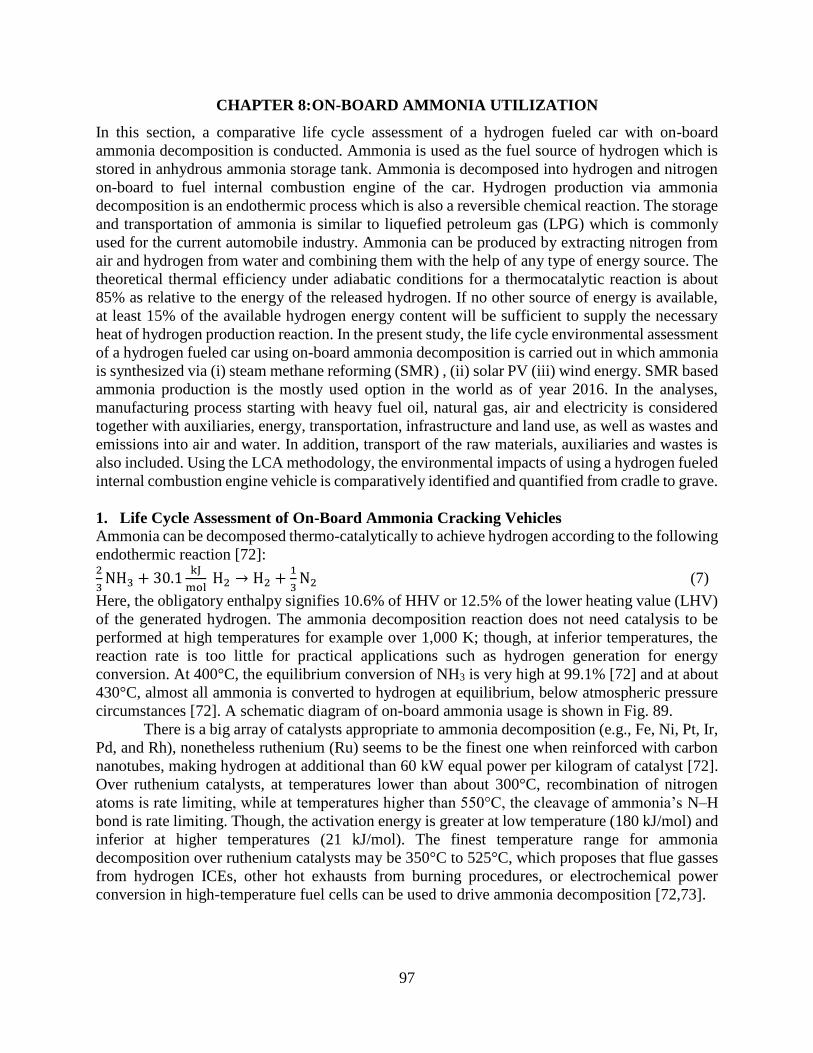
97
CHAPTER 8: ON-BOARD AMMONIA UTILIZATION
In this section, a comparative life cycle assessment of a hydrogen fueled car with on-board
ammonia decomposition is conducted. Ammonia is used as the fuel source of hydrogen which is
stored in anhydrous ammonia storage tank. Ammonia is decomposed into hydrogen and nitrogen
on-board to fuel internal combustion engine of the car. Hydrogen production via ammonia
decomposition is an endothermic process which is also a reversible chemical reaction. The storage
and transportation of ammonia is similar to liquefied petroleum gas (LPG) which is commonly
used for the current automobile industry. Ammonia can be produced by extracting nitrogen from
air and hydrogen from water and combining them with the help of any type of energy source. The
theoretical thermal efficiency under adiabatic conditions for a thermocatalytic reaction is about
85% as relative to the energy of the released hydrogen. If no other source of energy is available,
at least 15% of the available hydrogen energy content will be sufficient to supply the necessary
heat of hydrogen production reaction. In the present study, the life cycle environmental assessment
of a hydrogen fueled car using on-board ammonia decomposition is carried out in which ammonia
is synthesized via (i) steam methane reforming (SMR) , (ii) solar PV (iii) wind energy. SMR based
ammonia production is the mostly used option in the world as of year 2016. In the analyses,
manufacturing process starting with heavy fuel oil, natural gas, air and electricity is considered
together with auxiliaries, energy, transportation, infrastructure and land use, as well as wastes and
emissions into air and water. In addition, transport of the raw materials, auxiliaries and wastes is
also included. Using the LCA methodology, the environmental impacts of using a hydrogen fueled
internal combustion engine vehicle is comparatively identified and quantified from cradle to grave.
1. Life Cycle Assessment of On-Board Ammonia Cracking Vehicles
Ammonia can be decomposed thermo-catalytically to achieve hydrogen according to the following
endothermic reaction [72]: 2
3NH3 + 30.1
kJ
mol H2 → H2 +
1
3N2 (7)
Here, the obligatory enthalpy signifies 10.6% of HHV or 12.5% of the lower heating value (LHV)
of the generated hydrogen. The ammonia decomposition reaction does not need catalysis to be
performed at high temperatures for example over 1,000 K; though, at inferior temperatures, the
reaction rate is too little for practical applications such as hydrogen generation for energy
conversion. At 400°C, the equilibrium conversion of NH3 is very high at 99.1% [72] and at about
430°C, almost all ammonia is converted to hydrogen at equilibrium, below atmospheric pressure
circumstances [72]. A schematic diagram of on-board ammonia usage is shown in Fig. 89.
There is a big array of catalysts appropriate to ammonia decomposition (e.g., Fe, Ni, Pt, Ir,
Pd, and Rh), nonetheless ruthenium (Ru) seems to be the finest one when reinforced with carbon
nanotubes, making hydrogen at additional than 60 kW equal power per kilogram of catalyst [72].
Over ruthenium catalysts, at temperatures lower than about 300°C, recombination of nitrogen
atoms is rate limiting, while at temperatures higher than 550°C, the cleavage of ammonia’s N–H
bond is rate limiting. Though, the activation energy is greater at low temperature (180 kJ/mol) and
inferior at higher temperatures (21 kJ/mol). The finest temperature range for ammonia
decomposition over ruthenium catalysts may be 350°C to 525°C, which proposes that flue gasses
from hydrogen ICEs, other hot exhausts from burning procedures, or electrochemical power
conversion in high-temperature fuel cells can be used to drive ammonia decomposition [72,73].
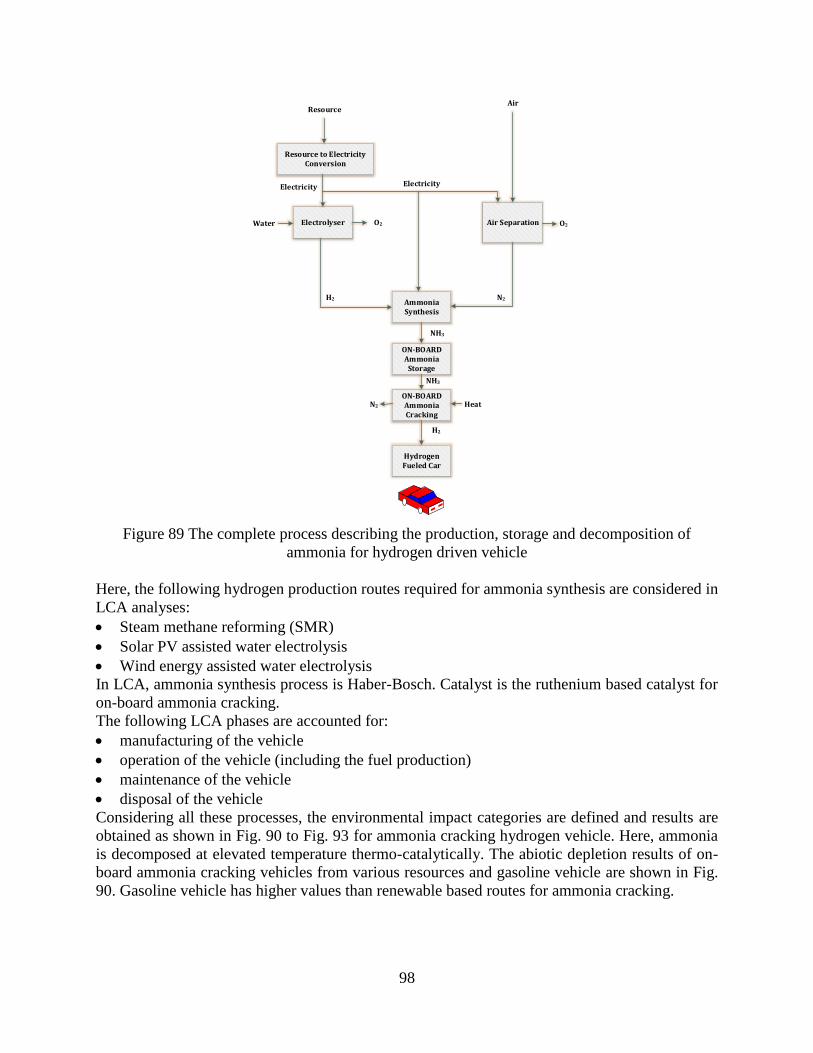
98
Resource to Electricity Conversion
Electrolyser Air Separation
ResourceAir
ElectricityElectricity
H2 N2Ammonia Synthesis
ON-BOARDAmmonia
Storage
NH3
Water O2 O2
ON-BOARDAmmonia Cracking
Hydrogen Fueled Car
NH3
H2
Heat N2
Figure 89 The complete process describing the production, storage and decomposition of
ammonia for hydrogen driven vehicle
Here, the following hydrogen production routes required for ammonia synthesis are considered in
LCA analyses:
Steam methane reforming (SMR)
Solar PV assisted water electrolysis
Wind energy assisted water electrolysis
In LCA, ammonia synthesis process is Haber-Bosch. Catalyst is the ruthenium based catalyst for
on-board ammonia cracking.
The following LCA phases are accounted for:
manufacturing of the vehicle
operation of the vehicle (including the fuel production)
maintenance of the vehicle
disposal of the vehicle
Considering all these processes, the environmental impact categories are defined and results are
obtained as shown in Fig. 90 to Fig. 93 for ammonia cracking hydrogen vehicle. Here, ammonia
is decomposed at elevated temperature thermo-catalytically. The abiotic depletion results of on-
board ammonia cracking vehicles from various resources and gasoline vehicle are shown in Fig.
90. Gasoline vehicle has higher values than renewable based routes for ammonia cracking.
99
Figure 90 Abiotic depletion results of on-board ammonia cracking vehicles from various
resources and gasoline vehicle
Figure 91 Acidification depletion results of on-board ammonia cracking vehicles from various
resources and gasoline vehicle
Figure 92 Global warming results of on-board ammonia cracking vehicles from various
resources and gasoline vehicle
0 0.0005 0.001 0.0015 0.002 0.0025 0.003 0.0035
Ammonia Cracking Hydrogen Vehicle - Wind
Ammonia Cracking Hydrogen Vehicle - Solar
Gasoline Vehicle
Ammonia Cracking Hydrogen Vehicle - SMR
Abiotic depletion (kg Sb eq/km)
0
0.0001
0.0002
0.0003
0.0004
0.0005
0.0006
0.0007
0.0008
Ammonia CrackingHydrogen Vehicle - Wind
Ammonia CrackingHydrogen Vehicle - SMR
Ammonia CrackingHydrogen Vehicle - Solar
Gasoline Vehicle
Aci
dif
icat
ion
(kg
SO
2e
q/k
m)
0 0.05 0.1 0.15 0.2 0.25 0.3
Ammonia Cracking Hydrogen Vehicle - Wind
Ammonia Cracking Hydrogen Vehicle - Solar
Ammonia Cracking Hydrogen Vehicle - SMR
Gasoline Vehicle
Global warming 500a (kg CO2 eq/km)
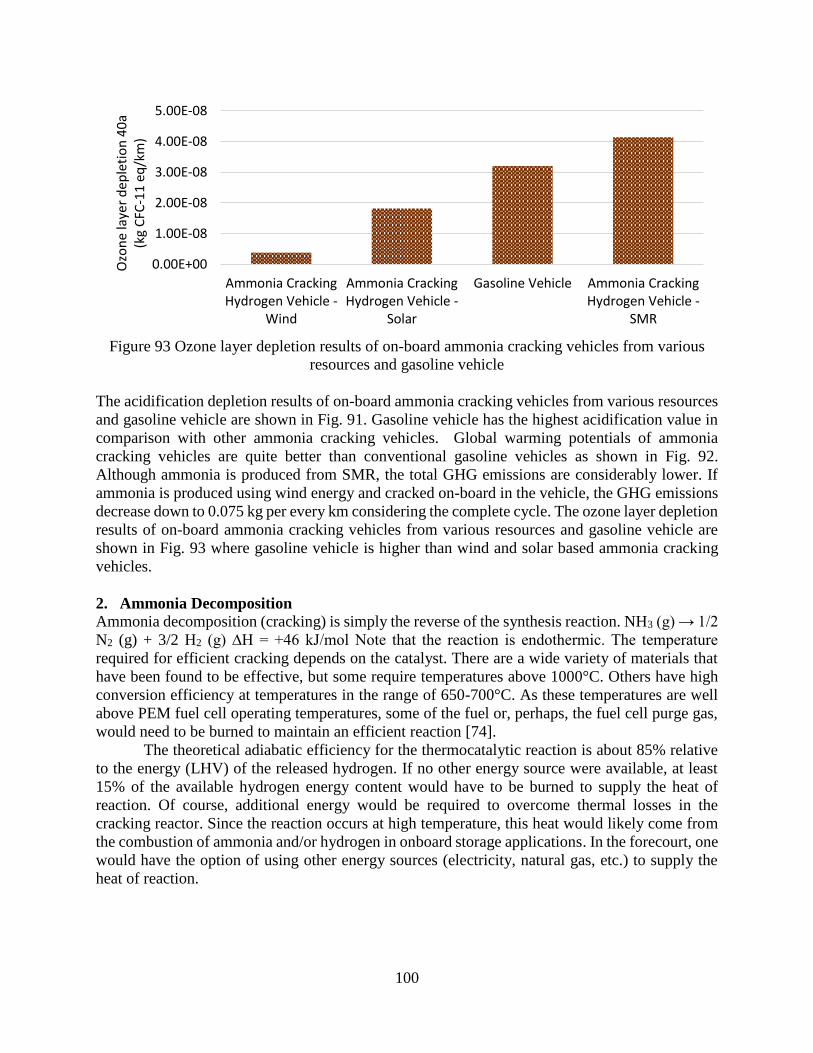
100
Figure 93 Ozone layer depletion results of on-board ammonia cracking vehicles from various
resources and gasoline vehicle
The acidification depletion results of on-board ammonia cracking vehicles from various resources
and gasoline vehicle are shown in Fig. 91. Gasoline vehicle has the highest acidification value in
comparison with other ammonia cracking vehicles. Global warming potentials of ammonia
cracking vehicles are quite better than conventional gasoline vehicles as shown in Fig. 92.
Although ammonia is produced from SMR, the total GHG emissions are considerably lower. If
ammonia is produced using wind energy and cracked on-board in the vehicle, the GHG emissions
decrease down to 0.075 kg per every km considering the complete cycle. The ozone layer depletion
results of on-board ammonia cracking vehicles from various resources and gasoline vehicle are
shown in Fig. 93 where gasoline vehicle is higher than wind and solar based ammonia cracking
vehicles.
2. Ammonia Decomposition
Ammonia decomposition (cracking) is simply the reverse of the synthesis reaction. NH3 (g) → 1/2
N2 (g) + 3/2 H2 (g) ∆H = +46 kJ/mol Note that the reaction is endothermic. The temperature
required for efficient cracking depends on the catalyst. There are a wide variety of materials that
have been found to be effective, but some require temperatures above 1000°C. Others have high
conversion efficiency at temperatures in the range of 650-700°C. As these temperatures are well
above PEM fuel cell operating temperatures, some of the fuel or, perhaps, the fuel cell purge gas,
would need to be burned to maintain an efficient reaction [74].
The theoretical adiabatic efficiency for the thermocatalytic reaction is about 85% relative
to the energy (LHV) of the released hydrogen. If no other energy source were available, at least
15% of the available hydrogen energy content would have to be burned to supply the heat of
reaction. Of course, additional energy would be required to overcome thermal losses in the
cracking reactor. Since the reaction occurs at high temperature, this heat would likely come from
the combustion of ammonia and/or hydrogen in onboard storage applications. In the forecourt, one
would have the option of using other energy sources (electricity, natural gas, etc.) to supply the
heat of reaction.
0.00E+00
1.00E-08
2.00E-08
3.00E-08
4.00E-08
5.00E-08
Ammonia CrackingHydrogen Vehicle -
Wind
Ammonia CrackingHydrogen Vehicle -
Solar
Gasoline Vehicle Ammonia CrackingHydrogen Vehicle -
SMR
Ozo
ne
laye
r d
eple
tio
n 4
0a
(kg
CFC
-11
eq
/km
)
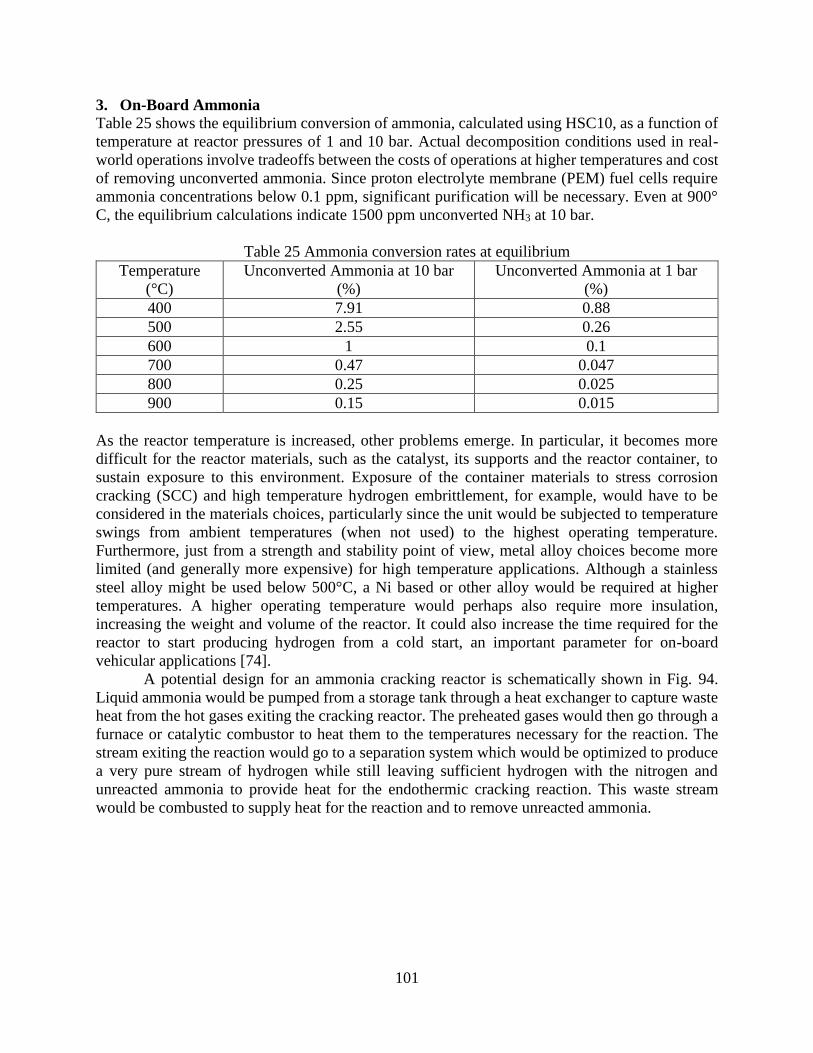
101
3. On-Board Ammonia
Table 25 shows the equilibrium conversion of ammonia, calculated using HSC10, as a function of
temperature at reactor pressures of 1 and 10 bar. Actual decomposition conditions used in real-
world operations involve tradeoffs between the costs of operations at higher temperatures and cost
of removing unconverted ammonia. Since proton electrolyte membrane (PEM) fuel cells require
ammonia concentrations below 0.1 ppm, significant purification will be necessary. Even at 900°
C, the equilibrium calculations indicate 1500 ppm unconverted NH3 at 10 bar.
Table 25 Ammonia conversion rates at equilibrium
Temperature
(°C)
Unconverted Ammonia at 10 bar
(%)
Unconverted Ammonia at 1 bar
(%)
400 7.91 0.88
500 2.55 0.26
600 1 0.1
700 0.47 0.047
800 0.25 0.025
900 0.15 0.015
As the reactor temperature is increased, other problems emerge. In particular, it becomes more
difficult for the reactor materials, such as the catalyst, its supports and the reactor container, to
sustain exposure to this environment. Exposure of the container materials to stress corrosion
cracking (SCC) and high temperature hydrogen embrittlement, for example, would have to be
considered in the materials choices, particularly since the unit would be subjected to temperature
swings from ambient temperatures (when not used) to the highest operating temperature.
Furthermore, just from a strength and stability point of view, metal alloy choices become more
limited (and generally more expensive) for high temperature applications. Although a stainless
steel alloy might be used below 500°C, a Ni based or other alloy would be required at higher
temperatures. A higher operating temperature would perhaps also require more insulation,
increasing the weight and volume of the reactor. It could also increase the time required for the
reactor to start producing hydrogen from a cold start, an important parameter for on-board
vehicular applications [74].
A potential design for an ammonia cracking reactor is schematically shown in Fig. 94.
Liquid ammonia would be pumped from a storage tank through a heat exchanger to capture waste
heat from the hot gases exiting the cracking reactor. The preheated gases would then go through a
furnace or catalytic combustor to heat them to the temperatures necessary for the reaction. The
stream exiting the reaction would go to a separation system which would be optimized to produce
a very pure stream of hydrogen while still leaving sufficient hydrogen with the nitrogen and
unreacted ammonia to provide heat for the endothermic cracking reaction. This waste stream
would be combusted to supply heat for the reaction and to remove unreacted ammonia.
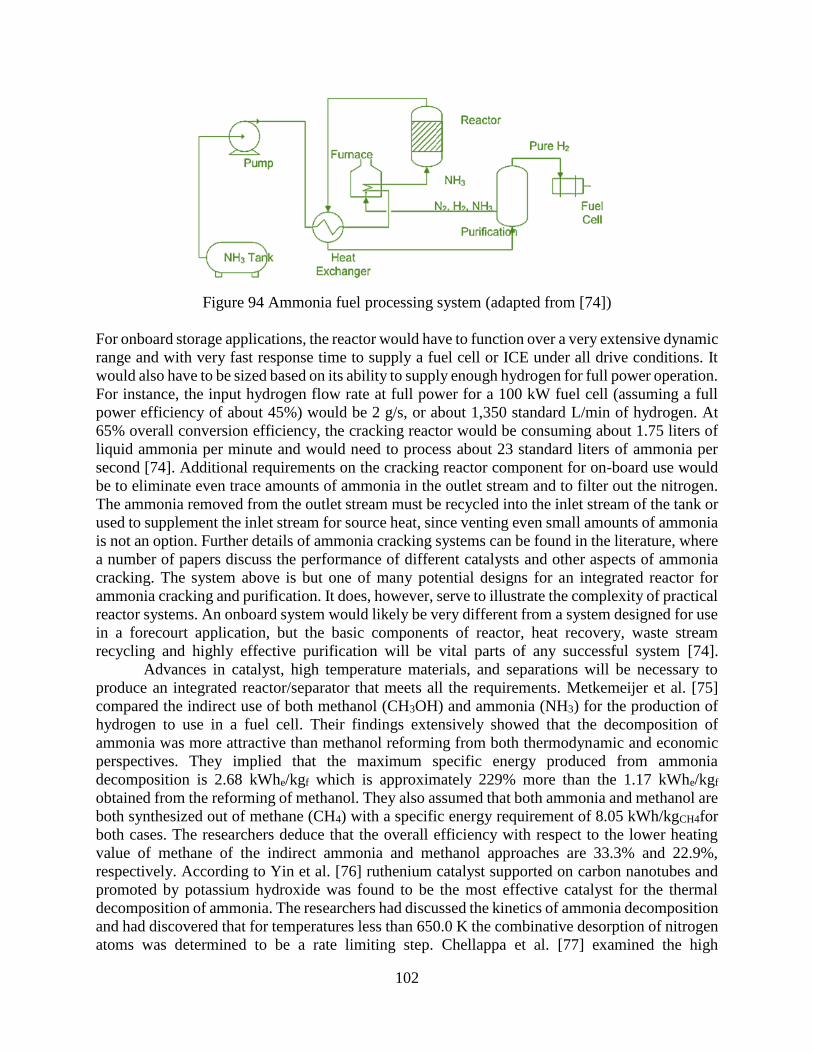
102
Figure 94 Ammonia fuel processing system (adapted from [74])
For onboard storage applications, the reactor would have to function over a very extensive dynamic
range and with very fast response time to supply a fuel cell or ICE under all drive conditions. It
would also have to be sized based on its ability to supply enough hydrogen for full power operation.
For instance, the input hydrogen flow rate at full power for a 100 kW fuel cell (assuming a full
power efficiency of about 45%) would be 2 g/s, or about 1,350 standard L/min of hydrogen. At
65% overall conversion efficiency, the cracking reactor would be consuming about 1.75 liters of
liquid ammonia per minute and would need to process about 23 standard liters of ammonia per
second [74]. Additional requirements on the cracking reactor component for on-board use would
be to eliminate even trace amounts of ammonia in the outlet stream and to filter out the nitrogen.
The ammonia removed from the outlet stream must be recycled into the inlet stream of the tank or
used to supplement the inlet stream for source heat, since venting even small amounts of ammonia
is not an option. Further details of ammonia cracking systems can be found in the literature, where
a number of papers discuss the performance of different catalysts and other aspects of ammonia
cracking. The system above is but one of many potential designs for an integrated reactor for
ammonia cracking and purification. It does, however, serve to illustrate the complexity of practical
reactor systems. An onboard system would likely be very different from a system designed for use
in a forecourt application, but the basic components of reactor, heat recovery, waste stream
recycling and highly effective purification will be vital parts of any successful system [74].
Advances in catalyst, high temperature materials, and separations will be necessary to
produce an integrated reactor/separator that meets all the requirements. Metkemeijer et al. [75]
compared the indirect use of both methanol (CH3OH) and ammonia (NH3) for the production of
hydrogen to use in a fuel cell. Their findings extensively showed that the decomposition of
ammonia was more attractive than methanol reforming from both thermodynamic and economic
perspectives. They implied that the maximum specific energy produced from ammonia
decomposition is 2.68 kWhe/kgf which is approximately 229% more than the 1.17 kWhe/kgf
obtained from the reforming of methanol. They also assumed that both ammonia and methanol are
both synthesized out of methane (CH4) with a specific energy requirement of 8.05 kWh/kgCH4for
both cases. The researchers deduce that the overall efficiency with respect to the lower heating
value of methane of the indirect ammonia and methanol approaches are 33.3% and 22.9%,
respectively. According to Yin et al. [76] ruthenium catalyst supported on carbon nanotubes and
promoted by potassium hydroxide was found to be the most effective catalyst for the thermal
decomposition of ammonia. The researchers had discussed the kinetics of ammonia decomposition
and had discovered that for temperatures less than 650.0 K the combinative desorption of nitrogen
atoms was determined to be a rate limiting step. Chellappa et al. [77] examined the high
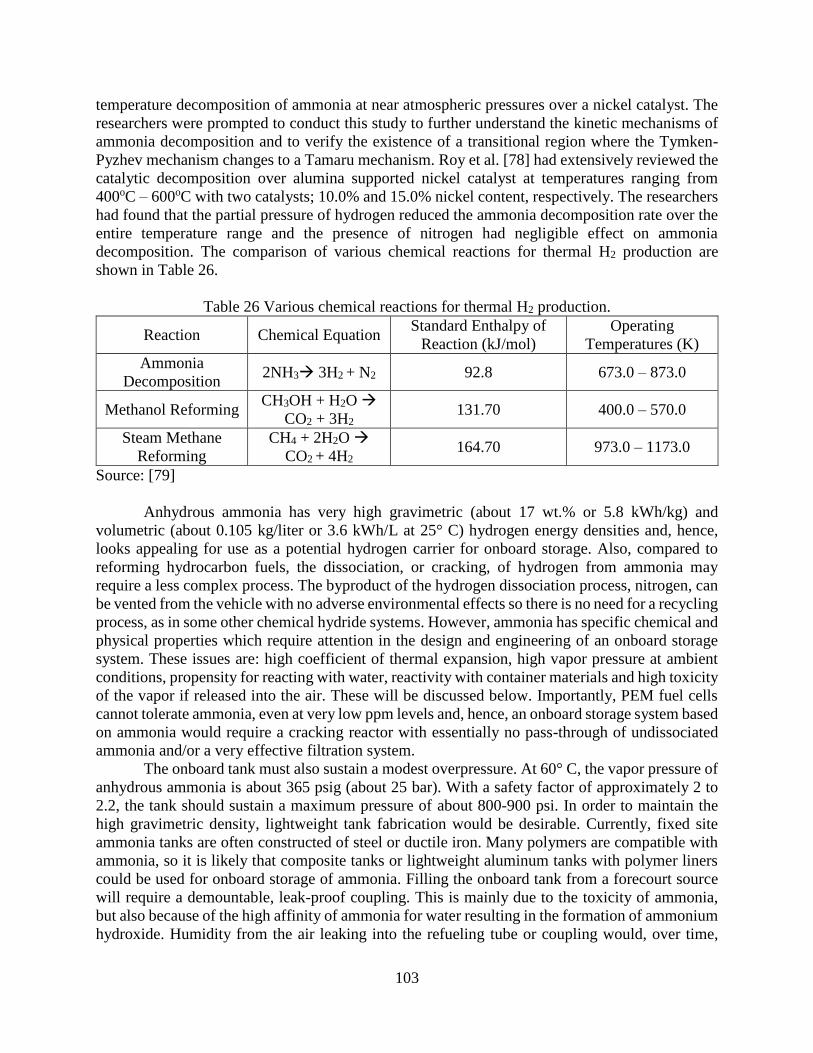
103
temperature decomposition of ammonia at near atmospheric pressures over a nickel catalyst. The
researchers were prompted to conduct this study to further understand the kinetic mechanisms of
ammonia decomposition and to verify the existence of a transitional region where the Tymken-
Pyzhev mechanism changes to a Tamaru mechanism. Roy et al. [78] had extensively reviewed the
catalytic decomposition over alumina supported nickel catalyst at temperatures ranging from
400oC – 600oC with two catalysts; 10.0% and 15.0% nickel content, respectively. The researchers
had found that the partial pressure of hydrogen reduced the ammonia decomposition rate over the
entire temperature range and the presence of nitrogen had negligible effect on ammonia
decomposition. The comparison of various chemical reactions for thermal H2 production are
shown in Table 26.
Table 26 Various chemical reactions for thermal H2 production.
Reaction Chemical Equation Standard Enthalpy of
Reaction (kJ/mol)
Operating
Temperatures (K)
Ammonia
Decomposition 2NH3 3H2 + N2 92.8 673.0 – 873.0
Methanol Reforming CH3OH + H2O
CO2 + 3H2 131.70 400.0 – 570.0
Steam Methane
Reforming
CH4 + 2H2O
CO2 + 4H2 164.70 973.0 – 1173.0
Source: [79]
Anhydrous ammonia has very high gravimetric (about 17 wt.% or 5.8 kWh/kg) and
volumetric (about 0.105 kg/liter or 3.6 kWh/L at 25° C) hydrogen energy densities and, hence,
looks appealing for use as a potential hydrogen carrier for onboard storage. Also, compared to
reforming hydrocarbon fuels, the dissociation, or cracking, of hydrogen from ammonia may
require a less complex process. The byproduct of the hydrogen dissociation process, nitrogen, can
be vented from the vehicle with no adverse environmental effects so there is no need for a recycling
process, as in some other chemical hydride systems. However, ammonia has specific chemical and
physical properties which require attention in the design and engineering of an onboard storage
system. These issues are: high coefficient of thermal expansion, high vapor pressure at ambient
conditions, propensity for reacting with water, reactivity with container materials and high toxicity
of the vapor if released into the air. These will be discussed below. Importantly, PEM fuel cells
cannot tolerate ammonia, even at very low ppm levels and, hence, an onboard storage system based
on ammonia would require a cracking reactor with essentially no pass-through of undissociated
ammonia and/or a very effective filtration system.
The onboard tank must also sustain a modest overpressure. At 60° C, the vapor pressure of
anhydrous ammonia is about 365 psig (about 25 bar). With a safety factor of approximately 2 to
2.2, the tank should sustain a maximum pressure of about 800-900 psi. In order to maintain the
high gravimetric density, lightweight tank fabrication would be desirable. Currently, fixed site
ammonia tanks are often constructed of steel or ductile iron. Many polymers are compatible with
ammonia, so it is likely that composite tanks or lightweight aluminum tanks with polymer liners
could be used for onboard storage of ammonia. Filling the onboard tank from a forecourt source
will require a demountable, leak-proof coupling. This is mainly due to the toxicity of ammonia,
but also because of the high affinity of ammonia for water resulting in the formation of ammonium
hydroxide. Humidity from the air leaking into the refueling tube or coupling would, over time,
104
lead to corrosion of the piping and tank by the hydroxide. The byproduct of the ammonia
dissociation process, nitrogen, can be vented from the vehicle with no adverse environmental
effects so there is no need for a recycling process, as in some other chemical hydride systems,
Hydrogen production via ammonia decomposition is an endothermic process which is also a
reversible chemical reaction. At 400°C, the equilibrium conversion of NH3 is very high 99.1%
[76]. Fe, Ni, Pt, Ir, Pd, Rh are a few of the possible catalysts whereas Ru and Ir appears to be more
appropriate power per kg of catalyst. The waste heat could be supplied from sources such as: gas
turbine, SOFC, or diesel power plants. All of these power plants have exhausts at temperatures of
or greater than 600oC and would be able to meet the thermal energy requirement of an NH3
decomposition and separation reactor. For this scenario to be realized, an exhaust gas to reactor
heat exchanger must be designed and built to facilitate efficient heat transfer to the reactor. A
membrane reactor system to produce hydrogen by the thermal decomposition of ammonia could
also take place in either large scale marine or rail applications. This is envisioned to be a process
where a fraction of the hydrogen energy produced would be used to decompose additional
ammonia for hydrogen. A major point of interest pertaining to this scenario would be the very high
energy ratio of the ammonia decomposition reaction. Thermodynamically, the ammonia
decomposition reaction only requires approximately 13.0% - 15.0% of the hydrogen’s calorific
value.
4. On-Board Ammonia Electrolysis
Ammonia stored in the tank of the vehicle can be electrolyzed to generate hydrogen and use in the
fuel cell or engines. Ammonia electrolysis is a method by which ammonia is electrochemically
oxidized on a suitable electrocatalyst to nitrogen and hydrogen. Based on thermodynamics, the
energy required to produce hydrogen by ammonia electrolysis is 97% lower than that required by
electrolyzing water [80].
The reactions for an ammonia electrolytic cell comprise of ammonia electro oxidation at the anode
and alkaline water reduction at the cathode as shown in the following equations [80]:
Anode: 2NH3+ 6OH- →N2+ 6H2O + 6e- , E0= -0.770 V vs SHE (8)
Cathode: 6H2O + 6e- →3H2+ 6OH- , E0= -0.828 V vs SHE (9)
Overall: 2NH3→N2+3H2 , E0= 0.058 V (10)
Therefore, thermodynamic values are much in favor of the production of hydrogen coupled to the
oxidation of ammonia compared to hydrogen production by electrolysis of water, for which the
theoretical cell voltage is 1.223V. The advantage of this process is its ease of integration with
renewable energy (electricity) sources. Because the energy consumption is low, the cell could
operate with renewable energy.
The theoretical energy consumption during ammonia electrolysis (assuming that there are
not kinetics limitations for the reaction to take place at the thermodynamics conditions) can be
calculated from the standard potential of the cell and is equal to 1.55Wh/g H2 while the electrolysis
of water requires at least 33 Wh/g H2 at standard conditions; this means that theoretically the
electrolysis of ammonia consumes 95% lower energy than a water electrolyzer [80]. The
commercialization of the technology depends on the development of effective electrodes for the
electro-oxidation of ammonia. The development of superior electrolytes and electrocatalysts for
ammonia electrolysis are vital for the improvement of the electrolysis efficiency. Vitse et al. [81]
stated that hydrogen produced from the electrolysis of ammonia costs 0.89 US$ /kg of H2 opposed
to 7.10 US$/kg of H2 from water electrolysis. These numbers were based on an ammonia cost of
275 US$/ton and a solar energy cost of 0.214 US$/kWh. Thermodynamically for 1 g of H2,
105
ammonia electrolysis consumes 1.55 Wh. For this same gram of H2, a PEMFC, which is the reverse
reaction of water electrolysis, generates 33 Wh. After sending 1.55 Wh back to the ammonia
electrolysis cell (AEC) from the PEMFC, making the system self-sustaining, there is potential for
a net energy of 31.45 Wh that can be used to recharge the batteries used for system start-up, to
power a motor, or for any other applications. However, PEM fuel cells have efficiencies that range
from 50 to 70% [82,83]. Additionally, ammonia is converted to hydrogen with 100% Faradaic
efficiency, but kinetic problems creating large ammonia oxidation overpotentials exist. Boggs and
Botte [84] integrated proton exchange membrane fuel cell with ammonia electrolyte cell (AEC),
the electricity generated from the PEM fuel cell is utilized to feed the AEC with electricity. The
study shows that using 203 L of aqueous ammonia will allow a hybrid fuel cell vehicle to travel
483 km before demanding another ammonia refill.
5. Case Study for Ammonia Electrolysis Vehicle
In this section, a case study is employed to show the practicability of the ammonia electrolysis
vehicle for a 500 km driving range. Here, we follow the same procedure for AEC calculations as
explained in the study by Boggs and Botte [84].The storage system costs, gravimetric, and
volumetric capacities of an ammonia electrolysis vehicle are performed. A lightweight hydrogen
fuel cell vehicle is considered. The driving range of the vehicle is taken as 500 km. A lightweight
vehicle can consume about 5.3 km/L which is 2.5 less efficient than a hydrogen fuel cell vehicle.
A gallon of gasoline is equivalent (gge) to a kg of hydrogen. Hence, the energy required for internal
combustion engine (ICE) is found as 12.5 gal × 33.3 kWh/gal= 416.25 kWh [84].
Using this value, the amount of hydrogen is calculated as follows:
𝑚𝐻2= 416.25 𝑘𝑊ℎ/(2.5 × 33 𝑘𝑊ℎ/𝑘𝑔) = 5 𝑘𝑔 (11)
In order to travel about 500 km with this vehicle, about 5 kg of hydrogen is required. On average,
if the vehicle is driven with the speed of 80 km/h, it will require refilling in every 6 hours. The
nominal fuel cell power required to move a lightweight fuel cell vehicle is:
��𝑃𝐸𝑀𝐹𝐶 =416.25 𝑘𝑊ℎ
(6ℎ × 2.5)= 27.75 𝑘𝑊 (12)
The generated electricity from the fuel cell is both used for vehicle propulsion and ammonia
electrolysis. Therefore, the PEM fuel cell is required to be higher power rate. Ammonia electrolysis
consumes about 60% of the energy. The increase of 60% in fuel cell cost, weight, and volume is
considered as part the storage system.
To find the total PEM fuel cell power, the following calculation is used:
��𝑇𝑂𝑇𝐴𝐿,𝑃𝐸𝑀𝐹𝐶 = 27.75 𝑘𝑊
(1 −0.6)= 69.38 𝑘𝑊 (13)
For the storage of the ammonia on-board, the ammonia storage vessel, Teflon tubing, centrifugal
pump, start-up hydrogen drum, compressor, and controller are mostly common and commercially
available devices. Based on the market, the estimated cost of ammonia storage unit is taken as US$
3,633 (inflated to 2017) based on the study by Boggs and Botte [84]. The cost, weight, and volume
of the ammonia electrolysis unit and PEM fuel cell modules are affected by many factors. Since
there is an increase in power required from the PEM fuel cell, an increase in the amount of
hydrogen is required between refueling.
𝑚𝐻2=
69.375 𝑘𝑊× 6ℎ
(33𝑘𝑊ℎ
𝑘𝑔× 0.6)
= 21.2 𝑘𝑔 (14)
In order to find the current required for ammonia electrolysis, under the assumption of 100%
Faradaic efficiency, the Faraday law can be used:
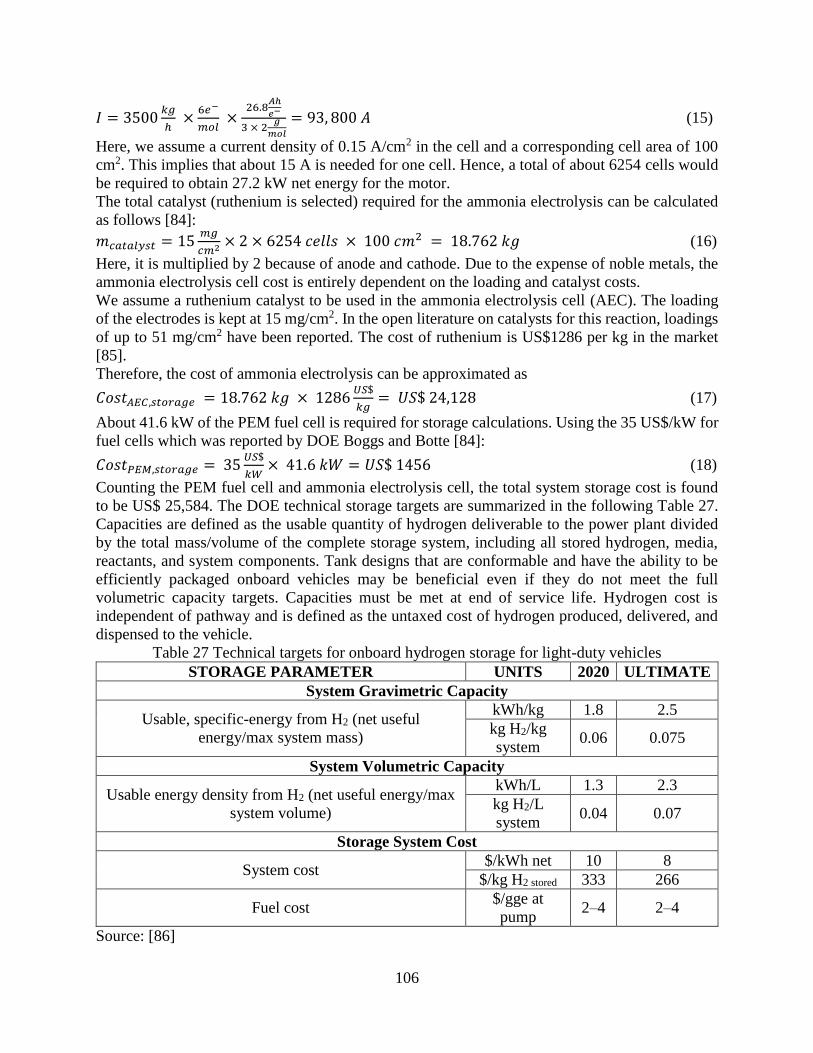
106
𝐼 = 3500𝑘𝑔
ℎ ×
6𝑒−
𝑚𝑜𝑙 ×
26.8𝐴ℎ
𝑒−
3 × 2𝑔
𝑚𝑜𝑙
= 93, 800 𝐴 (15)
Here, we assume a current density of 0.15 A/cm2 in the cell and a corresponding cell area of 100
cm2. This implies that about 15 A is needed for one cell. Hence, a total of about 6254 cells would
be required to obtain 27.2 kW net energy for the motor.
The total catalyst (ruthenium is selected) required for the ammonia electrolysis can be calculated
as follows [84]:
𝑚𝑐𝑎𝑡𝑎𝑙𝑦𝑠𝑡 = 15𝑚𝑔
𝑐𝑚2× 2 × 6254 𝑐𝑒𝑙𝑙𝑠 × 100 𝑐𝑚2 = 18.762 𝑘𝑔 (16)
Here, it is multiplied by 2 because of anode and cathode. Due to the expense of noble metals, the
ammonia electrolysis cell cost is entirely dependent on the loading and catalyst costs.
We assume a ruthenium catalyst to be used in the ammonia electrolysis cell (AEC). The loading
of the electrodes is kept at 15 mg/cm2. In the open literature on catalysts for this reaction, loadings
of up to 51 mg/cm2 have been reported. The cost of ruthenium is US$1286 per kg in the market
[85].
Therefore, the cost of ammonia electrolysis can be approximated as
𝐶𝑜𝑠𝑡𝐴𝐸𝐶,𝑠𝑡𝑜𝑟𝑎𝑔𝑒 = 18.762 𝑘𝑔 × 1286𝑈𝑆$
𝑘𝑔= 𝑈𝑆$ 24,128 (17)
About 41.6 kW of the PEM fuel cell is required for storage calculations. Using the 35 US$/kW for
fuel cells which was reported by DOE Boggs and Botte [84]:
𝐶𝑜𝑠𝑡𝑃𝐸𝑀,𝑠𝑡𝑜𝑟𝑎𝑔𝑒 = 35𝑈𝑆$
𝑘𝑊× 41.6 𝑘𝑊 = 𝑈𝑆$ 1456 (18)
Counting the PEM fuel cell and ammonia electrolysis cell, the total system storage cost is found
to be US$ 25,584. The DOE technical storage targets are summarized in the following Table 27.
Capacities are defined as the usable quantity of hydrogen deliverable to the power plant divided
by the total mass/volume of the complete storage system, including all stored hydrogen, media,
reactants, and system components. Tank designs that are conformable and have the ability to be
efficiently packaged onboard vehicles may be beneficial even if they do not meet the full
volumetric capacity targets. Capacities must be met at end of service life. Hydrogen cost is
independent of pathway and is defined as the untaxed cost of hydrogen produced, delivered, and
dispensed to the vehicle.
Table 27 Technical targets for onboard hydrogen storage for light-duty vehicles
STORAGE PARAMETER UNITS 2020 ULTIMATE
System Gravimetric Capacity
Usable, specific-energy from H2 (net useful
energy/max system mass)
kWh/kg 1.8 2.5
kg H2/kg
system 0.06 0.075
System Volumetric Capacity
Usable energy density from H2 (net useful energy/max
system volume)
kWh/L 1.3 2.3
kg H2/L
system 0.04 0.07
Storage System Cost
System cost $/kWh net 10 8
$/kg H2 stored 333 266
Fuel cost $/gge at
pump 2–4 2–4
Source: [86]
107
𝐶𝑜𝑠𝑡𝑝𝑒𝑟 𝑘𝑔 = 𝑈𝑆$ 25,584
21.2 𝑘𝑔 𝐻2= 1206.8
𝑈𝑆$
𝑘𝑔 (19)
𝐶𝑜𝑠𝑡𝑝𝑒𝑟 𝑘𝑊ℎ = 𝑈𝑆$ 25,584
33𝑘𝑊ℎ
𝑘𝑔× 60% × 21.2 𝑘𝑔
= 60.95𝑈𝑆$
𝑘𝑊ℎ (20)
The ammonia storage vessel, Teflon tubing, start-up drum, compressor, and process controller are
estimated to weigh about 26.5 kg based on commercially available products. The weight of fuel,
storage part of the fuel cell, and AEC are calculated.
The required ammonia mass can be found using molecular weight and percentage of hydrogen in
ammonia:
𝑚𝑁𝐻3=
21.2 𝑘𝑔 𝐻2 × 1 𝑘𝑔 𝑁𝐻3
0.177 𝑘𝑔 𝐻2= 119.8 𝑘𝑔 (21)
According to Satyapal et al. [87], the target power density for PEM fuel cell is 2000 W/kg. As a
result, the storage part of the fuel cell would weigh about 41.6 𝑘𝑊
2𝑘𝑊
𝑘𝑔
= 20.8 𝑘𝑔. It is assumed that the
ammonia electrolysis unit is twice as heavy as the fuel cell that means 69.4 kg.
𝑚𝐴𝐸𝐶 =2×69.4 𝑘𝑊
2𝑘𝑊
𝑘𝑔
= 69.4 𝑘𝑔 (22)
The total gravimetric capacity is determined using the total estimated storage system weight, which
is 249.9 kg.
𝐶𝑎𝑝𝑎𝑐𝑖𝑡𝑦𝐺𝑟𝑎𝑣𝑖𝑚𝑒𝑡𝑟𝑖𝑐 (𝑝𝑒𝑟 𝑘𝑔 𝑠𝑦𝑠𝑡𝑒𝑚) = 21.2 𝑘𝑔
249.9 𝑘𝑔= 0.0.084 (23)
𝐶𝑎𝑝𝑎𝑐𝑖𝑡𝑦𝐺𝑟𝑎𝑣𝑖𝑚𝑒𝑡𝑟𝑖𝑐 (
𝑘𝑊ℎ
𝑘𝑔)
= 21.2 𝑘𝑔 × 33𝑘𝑊ℎ
𝑘𝑔×
60%
249.9 𝑘𝑔 = 1.68
𝑘𝑊ℎ
𝑘𝑔 (24)
Similarly, the volumes of the tubing, start-up drum, compressor, and process control are estimated
to occupy about 100 L. Using the fact that 119.8 kg of ammonia is required and considering a
density of 682 kg/m3, the storage vessel volume is 174 L. The targeted power/volume density for
PEM fuel cell is 2000 W/L according to the DOE. Based on the 41.6 kW of fuel cell power that is
used for storage, the storage part of the PEM fuel cell requires 20.8 L. Using the 2 times relation
for ammonia : PEM fuel cell for volume and weight, the AEC occupies:
𝑉𝐴𝐸𝐶 =2 × 69.4 𝑘𝑊
2𝑘𝑊
𝐿
= 69.4 𝐿 (25)
Total storage system volume required is calculated to be 364.2 L. The volumetric storage
parameters are as follows:
𝐶𝑎𝑝𝑎𝑐𝑖𝑡𝑦𝑉𝑜𝑙𝑢𝑚𝑒𝑡𝑟𝑖𝑐(kg
H2L system
)=
21.2 𝑘𝑔
364.2 𝐿= 0.058
𝑘𝑔
𝐿 (26)
𝐶𝑎𝑝𝑎𝑐𝑖𝑡𝑦𝑉𝑜𝑙𝑢𝑚𝑒𝑡𝑟𝑖𝑐 (
kWh
L)
= 21.2 𝑘𝑔 × 33𝑘𝑊ℎ
𝑘𝑔×
60%
364.2 𝐿= 1.15
𝑘𝑊ℎ
𝐿 (27)
6. Thermodynamic Analyses of On-Board Ammonia Electrolysis
The theoretical electrolysis voltage of liquid NH3 at any temperature is evaluated from Nernst's
equation as follows [88]:
𝐸𝑟,𝐴𝐸𝐶 = −∆𝐺
3 𝐹+
𝑅 𝑇𝑜𝑝𝑒𝑟𝑎𝑡𝑖𝑜𝑛
3 𝐹ln (𝑃𝑁2
0.5𝑃𝐻2
1.5) (28)
where, 𝑃𝐻2 is the partial pressure of H2, and 𝑃𝑁2
is the partial pressure of N2.
To obtain the required practical cell voltage, it is necessary to add all the cell losses (activation,
concentration, ohmic overpotentials) to reversible cell voltage as below:
𝐸𝑎𝑐𝑡𝑢𝑎𝑙 = 𝐸𝑜𝑝𝑒𝑛 + 𝐸𝑎𝑐𝑡 + 𝐸𝑜ℎ𝑚 + 𝐸𝑐𝑜𝑛𝑐 (29)
The ohmic overpotential is identified as
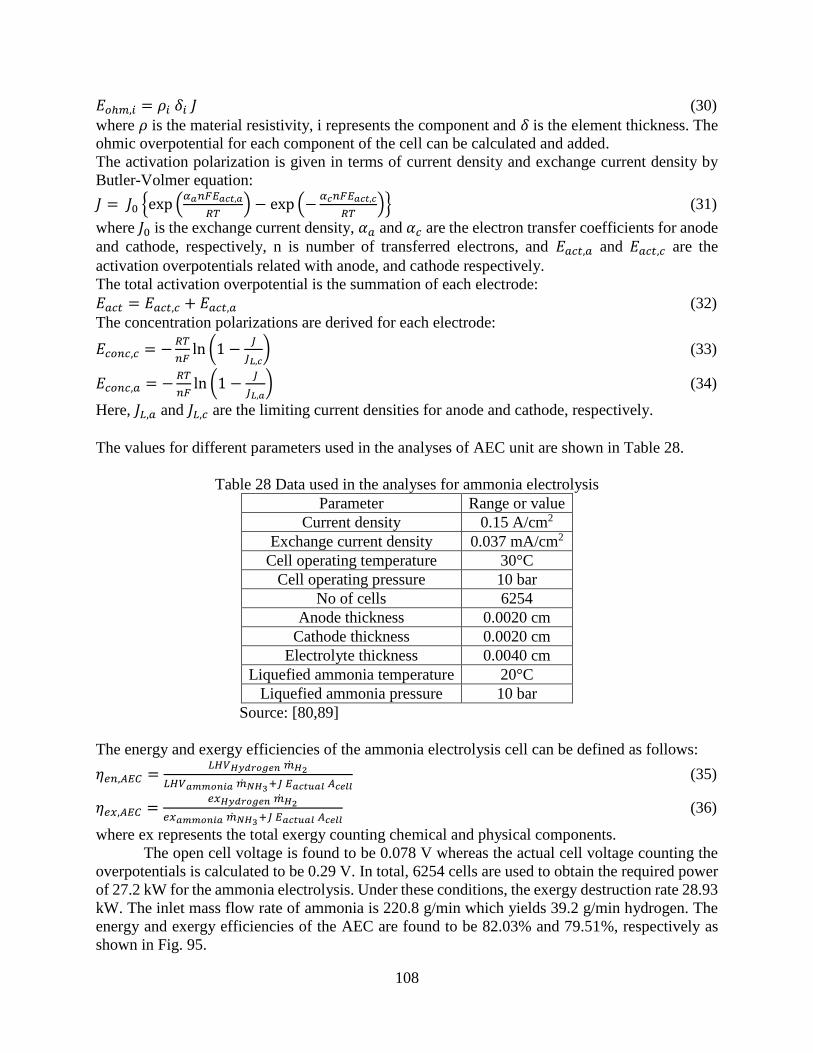
108
𝐸𝑜ℎ𝑚,𝑖 = 𝜌𝑖 𝛿𝑖 𝐽 (30)
where 𝜌 is the material resistivity, i represents the component and 𝛿 is the element thickness. The
ohmic overpotential for each component of the cell can be calculated and added.
The activation polarization is given in terms of current density and exchange current density by
Butler-Volmer equation:
𝐽 = 𝐽0 {exp (𝛼𝑎𝑛𝐹𝐸𝑎𝑐𝑡,𝑎
𝑅𝑇) − exp (−
𝛼𝑐𝑛𝐹𝐸𝑎𝑐𝑡,𝑐
𝑅𝑇)} (31)
where 𝐽0 is the exchange current density, 𝛼𝑎 and 𝛼𝑐 are the electron transfer coefficients for anode
and cathode, respectively, n is number of transferred electrons, and 𝐸𝑎𝑐𝑡,𝑎 and 𝐸𝑎𝑐𝑡,𝑐 are the
activation overpotentials related with anode, and cathode respectively.
The total activation overpotential is the summation of each electrode:
𝐸𝑎𝑐𝑡 = 𝐸𝑎𝑐𝑡,𝑐 + 𝐸𝑎𝑐𝑡,𝑎 (32)
The concentration polarizations are derived for each electrode:
𝐸𝑐𝑜𝑛𝑐,𝑐 = −𝑅𝑇
𝑛𝐹ln (1 −
𝐽
𝐽𝐿,𝑐) (33)
𝐸𝑐𝑜𝑛𝑐,𝑎 = −𝑅𝑇
𝑛𝐹ln (1 −
𝐽
𝐽𝐿,𝑎) (34)
Here, 𝐽𝐿,𝑎 and 𝐽𝐿,𝑐 are the limiting current densities for anode and cathode, respectively.
The values for different parameters used in the analyses of AEC unit are shown in Table 28.
Table 28 Data used in the analyses for ammonia electrolysis
Parameter Range or value
Current density 0.15 A/cm2
Exchange current density 0.037 mA/cm2
Cell operating temperature 30°C
Cell operating pressure 10 bar
No of cells 6254
Anode thickness 0.0020 cm
Cathode thickness 0.0020 cm
Electrolyte thickness 0.0040 cm
Liquefied ammonia temperature 20°C
Liquefied ammonia pressure 10 bar
Source: [80,89]
The energy and exergy efficiencies of the ammonia electrolysis cell can be defined as follows:
𝜂𝑒𝑛,𝐴𝐸𝐶 =𝐿𝐻𝑉𝐻𝑦𝑑𝑟𝑜𝑔𝑒𝑛 ��𝐻2
𝐿𝐻𝑉𝑎𝑚𝑚𝑜𝑛𝑖𝑎 ��𝑁𝐻3+𝐽 𝐸𝑎𝑐𝑡𝑢𝑎𝑙 𝐴𝑐𝑒𝑙𝑙 (35)
𝜂𝑒𝑥,𝐴𝐸𝐶 =𝑒𝑥𝐻𝑦𝑑𝑟𝑜𝑔𝑒𝑛 ��𝐻2
𝑒𝑥𝑎𝑚𝑚𝑜𝑛𝑖𝑎 ��𝑁𝐻3+𝐽 𝐸𝑎𝑐𝑡𝑢𝑎𝑙 𝐴𝑐𝑒𝑙𝑙 (36)
where ex represents the total exergy counting chemical and physical components.
The open cell voltage is found to be 0.078 V whereas the actual cell voltage counting the
overpotentials is calculated to be 0.29 V. In total, 6254 cells are used to obtain the required power
of 27.2 kW for the ammonia electrolysis. Under these conditions, the exergy destruction rate 28.93
kW. The inlet mass flow rate of ammonia is 220.8 g/min which yields 39.2 g/min hydrogen. The
energy and exergy efficiencies of the AEC are found to be 82.03% and 79.51%, respectively as
shown in Fig. 95.
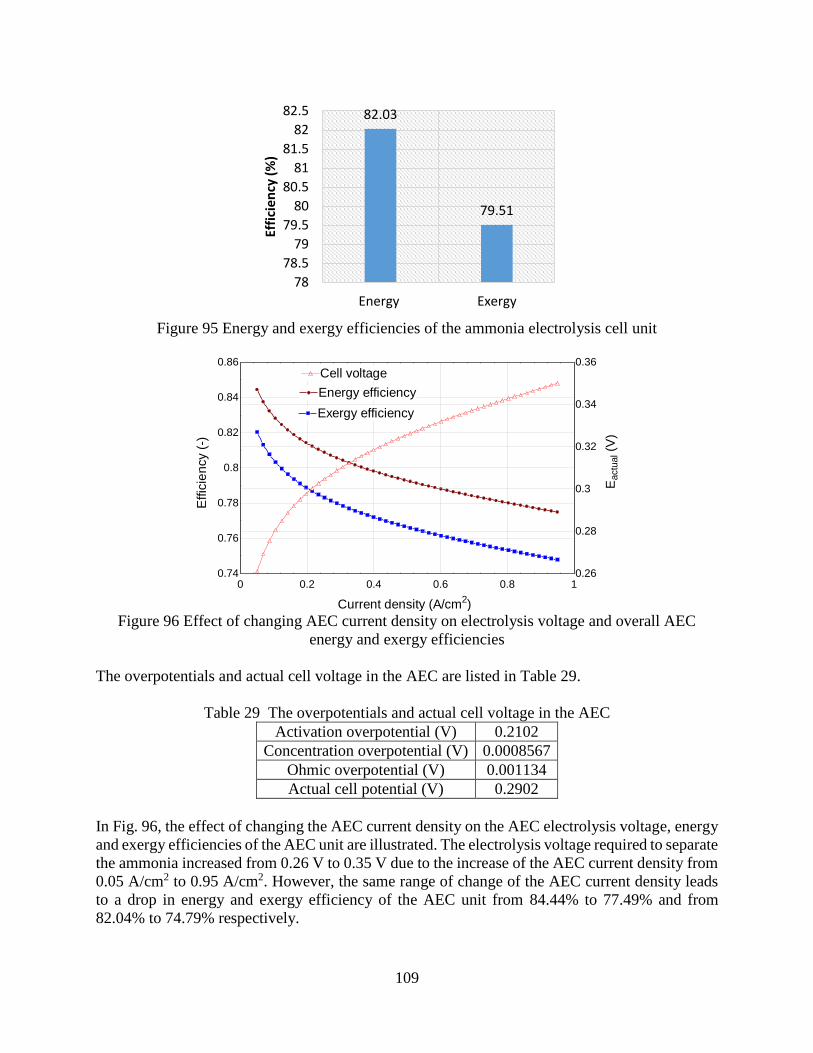
109
Figure 95 Energy and exergy efficiencies of the ammonia electrolysis cell unit
Figure 96 Effect of changing AEC current density on electrolysis voltage and overall AEC
energy and exergy efficiencies
The overpotentials and actual cell voltage in the AEC are listed in Table 29.
Table 29 The overpotentials and actual cell voltage in the AEC
Activation overpotential (V) 0.2102
Concentration overpotential (V) 0.0008567
Ohmic overpotential (V) 0.001134
Actual cell potential (V) 0.2902
In Fig. 96, the effect of changing the AEC current density on the AEC electrolysis voltage, energy
and exergy efficiencies of the AEC unit are illustrated. The electrolysis voltage required to separate
the ammonia increased from 0.26 V to 0.35 V due to the increase of the AEC current density from
0.05 A/cm2 to 0.95 A/cm2. However, the same range of change of the AEC current density leads
to a drop in energy and exergy efficiency of the AEC unit from 84.44% to 77.49% and from
82.04% to 74.79% respectively.
82.03
79.51
78
78.5
79
79.5
80
80.5
81
81.5
82
82.5
Energy Exergy
Effi
cien
cy (
%)
0 0.2 0.4 0.6 0.8 10.74
0.76
0.78
0.8
0.82
0.84
0.86
0.26
0.28
0.3
0.32
0.34
0.36
Effic
ien
cy (
-)
Energy efficiencyEnergy efficiency
Current density (A/cm2)
Exergy efficiencyExergy efficiency
Cell voltageCell voltage
Eactu
al (
V)
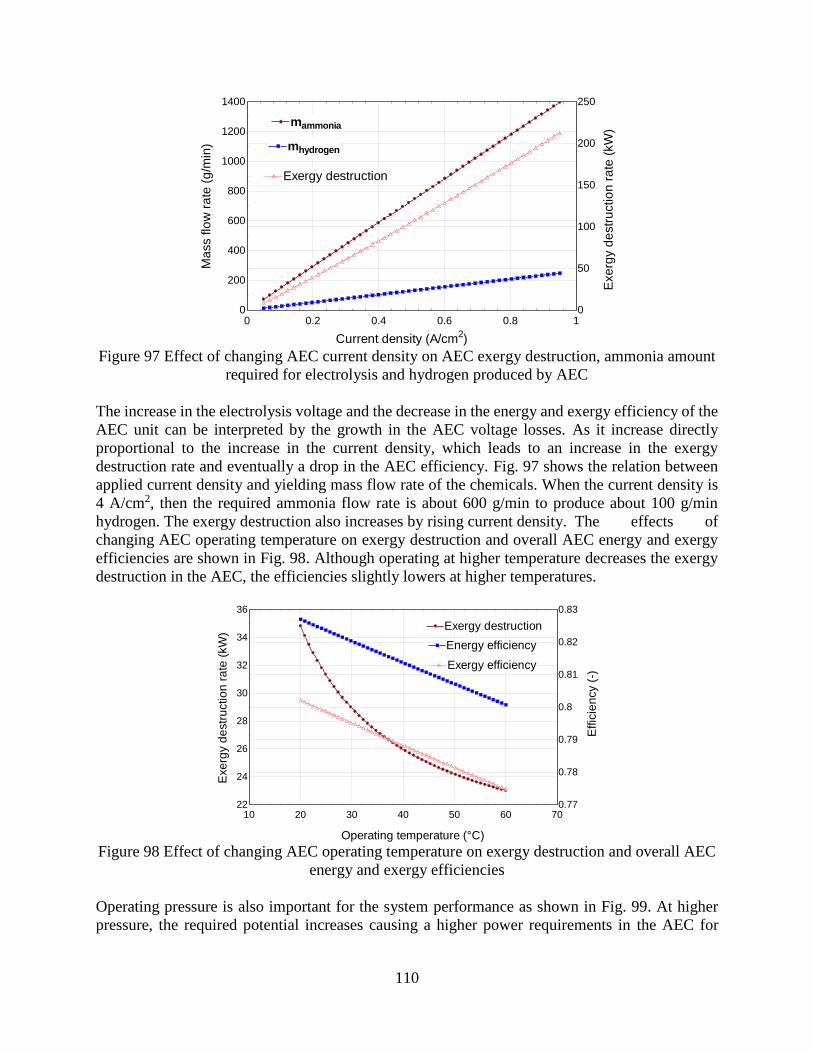
110
Figure 97 Effect of changing AEC current density on AEC exergy destruction, ammonia amount
required for electrolysis and hydrogen produced by AEC
The increase in the electrolysis voltage and the decrease in the energy and exergy efficiency of the
AEC unit can be interpreted by the growth in the AEC voltage losses. As it increase directly
proportional to the increase in the current density, which leads to an increase in the exergy
destruction rate and eventually a drop in the AEC efficiency. Fig. 97 shows the relation between
applied current density and yielding mass flow rate of the chemicals. When the current density is
4 A/cm2, then the required ammonia flow rate is about 600 g/min to produce about 100 g/min
hydrogen. The exergy destruction also increases by rising current density. The effects of
changing AEC operating temperature on exergy destruction and overall AEC energy and exergy
efficiencies are shown in Fig. 98. Although operating at higher temperature decreases the exergy
destruction in the AEC, the efficiencies slightly lowers at higher temperatures.
Figure 98 Effect of changing AEC operating temperature on exergy destruction and overall AEC
energy and exergy efficiencies
Operating pressure is also important for the system performance as shown in Fig. 99. At higher
pressure, the required potential increases causing a higher power requirements in the AEC for
0 0.2 0.4 0.6 0.8 10
200
400
600
800
1000
1200
1400
0
50
100
150
200
250
Ma
ss flo
w r
ate
(g
/min
)
mammoniamammonia
mhydrogenmhydrogen
Exergy destructionExergy destruction
Exe
rgy d
estr
uctio
n r
ate
(kW
)
Current density (A/cm2)
10 20 30 40 50 60 7022
24
26
28
30
32
34
36
0.77
0.78
0.79
0.8
0.81
0.82
0.83
Operating temperature (°C)
Exergy destructionExergy destruction
Energy efficiency
Exergy efficiencyExergy efficiency
Exe
rgy d
estr
uctio
n r
ate
(kW
)
Effic
ien
cy (
-)
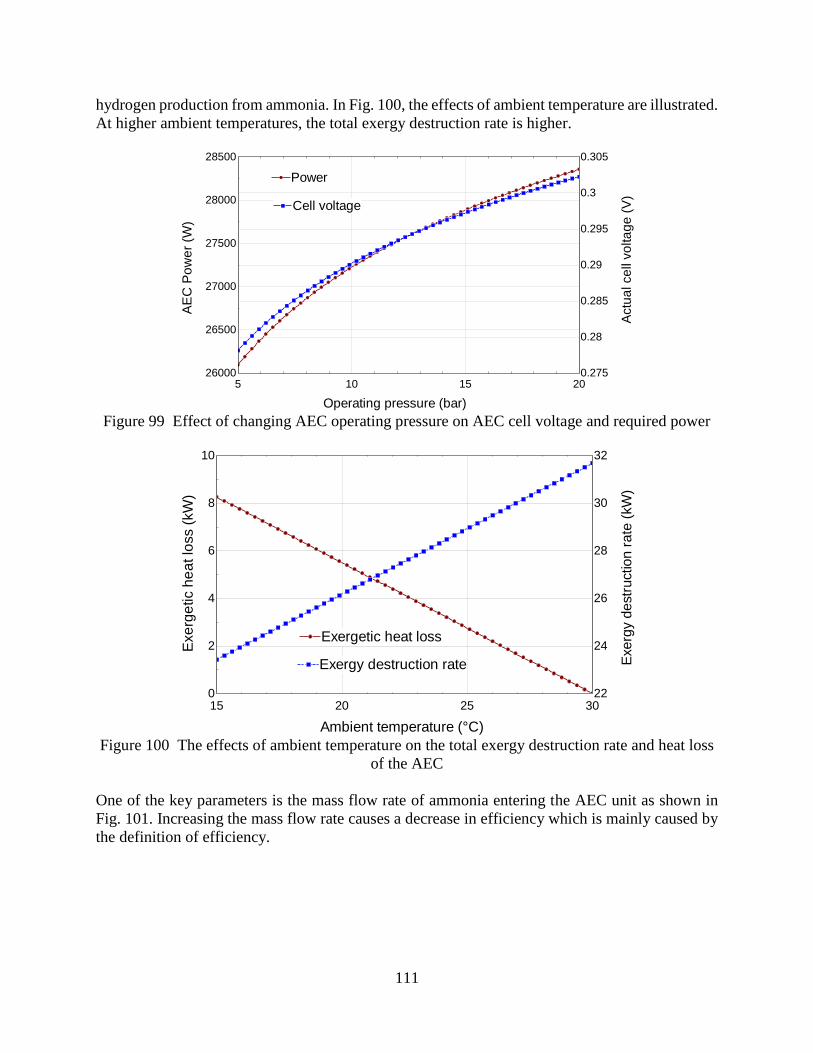
111
hydrogen production from ammonia. In Fig. 100, the effects of ambient temperature are illustrated.
At higher ambient temperatures, the total exergy destruction rate is higher.
Figure 99 Effect of changing AEC operating pressure on AEC cell voltage and required power
Figure 100 The effects of ambient temperature on the total exergy destruction rate and heat loss
of the AEC
One of the key parameters is the mass flow rate of ammonia entering the AEC unit as shown in
Fig. 101. Increasing the mass flow rate causes a decrease in efficiency which is mainly caused by
the definition of efficiency.
5 10 15 2026000
26500
27000
27500
28000
28500
0.275
0.28
0.285
0.29
0.295
0.3
0.305
Operating pressure (bar)
AE
C P
ow
er
(W)
PowerPower
Cell voltageCell voltage
Actu
al ce
ll vo
lta
ge
(V
)
15 20 25 300
2
4
6
8
10
22
24
26
28
30
32
Ambient temperature (°C)
Exe
rge
tic h
ea
t lo
ss (
kW
)
Exergetic heat lossExergetic heat loss
Exergy destruction rateExergy destruction rate Exerg
y d
estr
uction r
ate
(kW
)
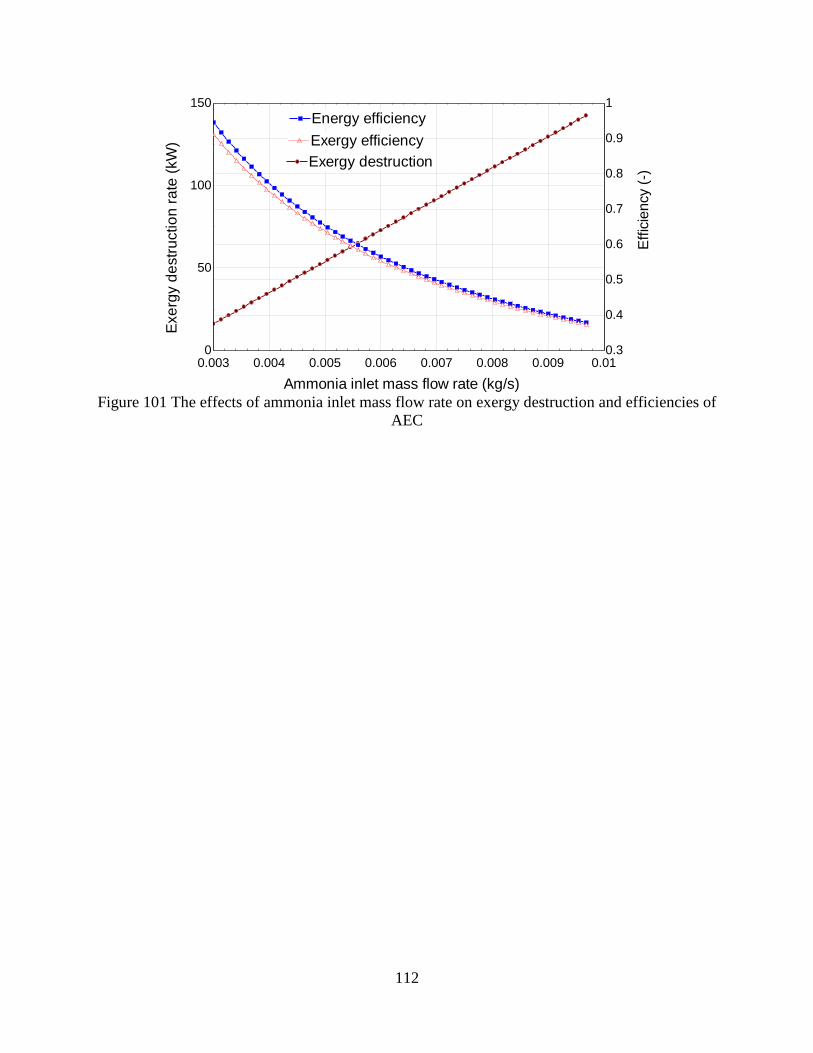
112
Figure 101 The effects of ammonia inlet mass flow rate on exergy destruction and efficiencies of
AEC
0.003 0.004 0.005 0.006 0.007 0.008 0.009 0.010
50
100
150
0.3
0.4
0.5
0.6
0.7
0.8
0.9
1
Ammonia inlet mass flow rate (kg/s)
Exe
rgy d
estr
uctio
n r
ate
(kW
)Exergy destructionExergy destruction
Energy efficiencyEnergy efficiency
Exergy efficiencyExergy efficiency
Effic
iency (
-)
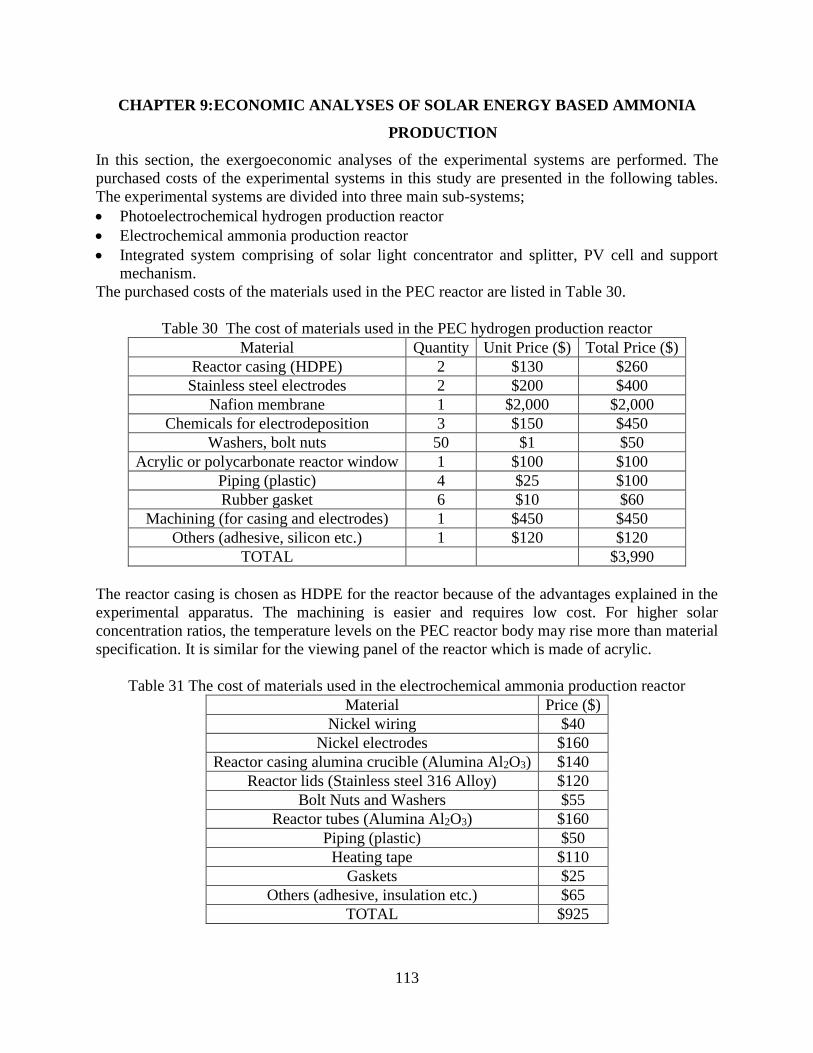
113
CHAPTER 9: ECONOMIC ANALYSES OF SOLAR ENERGY BASED AMMONIA
PRODUCTION
In this section, the exergoeconomic analyses of the experimental systems are performed. The
purchased costs of the experimental systems in this study are presented in the following tables.
The experimental systems are divided into three main sub-systems;
Photoelectrochemical hydrogen production reactor
Electrochemical ammonia production reactor
Integrated system comprising of solar light concentrator and splitter, PV cell and support
mechanism.
The purchased costs of the materials used in the PEC reactor are listed in Table 30.
Table 30 The cost of materials used in the PEC hydrogen production reactor
Material Quantity Unit Price ($) Total Price ($)
Reactor casing (HDPE) 2 $130 $260
Stainless steel electrodes 2 $200 $400
Nafion membrane 1 $2,000 $2,000
Chemicals for electrodeposition 3 $150 $450
Washers, bolt nuts 50 $1 $50
Acrylic or polycarbonate reactor window 1 $100 $100
Piping (plastic) 4 $25 $100
Rubber gasket 6 $10 $60
Machining (for casing and electrodes) 1 $450 $450
Others (adhesive, silicon etc.) 1 $120 $120
TOTAL $3,990
The reactor casing is chosen as HDPE for the reactor because of the advantages explained in the
experimental apparatus. The machining is easier and requires low cost. For higher solar
concentration ratios, the temperature levels on the PEC reactor body may rise more than material
specification. It is similar for the viewing panel of the reactor which is made of acrylic.
Table 31 The cost of materials used in the electrochemical ammonia production reactor
Material Price ($)
Nickel wiring $40
Nickel electrodes $160
Reactor casing alumina crucible (Alumina Al2O3) $140
Reactor lids (Stainless steel 316 Alloy) $120
Bolt Nuts and Washers $55
Reactor tubes (Alumina Al2O3) $160
Piping (plastic) $50
Heating tape $110
Gaskets $25
Others (adhesive, insulation etc.) $65
TOTAL $925
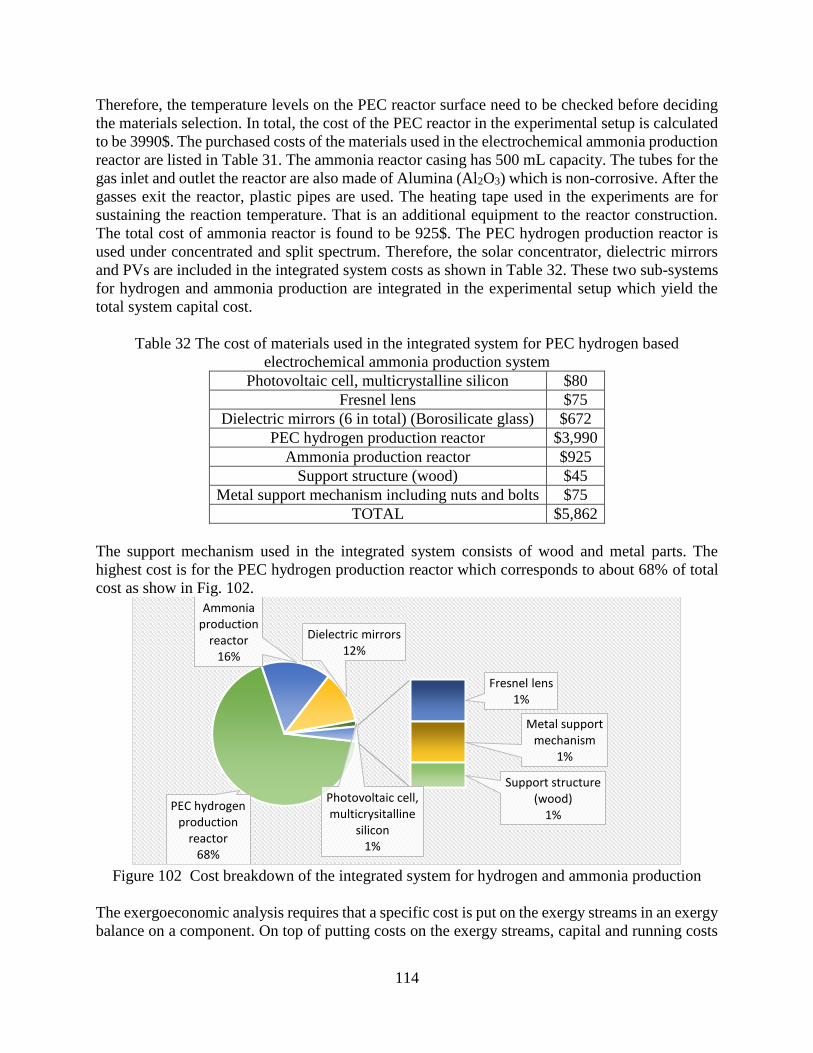
114
Therefore, the temperature levels on the PEC reactor surface need to be checked before deciding
the materials selection. In total, the cost of the PEC reactor in the experimental setup is calculated
to be 3990$. The purchased costs of the materials used in the electrochemical ammonia production
reactor are listed in Table 31. The ammonia reactor casing has 500 mL capacity. The tubes for the
gas inlet and outlet the reactor are also made of Alumina (Al2O3) which is non-corrosive. After the
gasses exit the reactor, plastic pipes are used. The heating tape used in the experiments are for
sustaining the reaction temperature. That is an additional equipment to the reactor construction.
The total cost of ammonia reactor is found to be 925$. The PEC hydrogen production reactor is
used under concentrated and split spectrum. Therefore, the solar concentrator, dielectric mirrors
and PVs are included in the integrated system costs as shown in Table 32. These two sub-systems
for hydrogen and ammonia production are integrated in the experimental setup which yield the
total system capital cost.
Table 32 The cost of materials used in the integrated system for PEC hydrogen based
electrochemical ammonia production system
Photovoltaic cell, multicrystalline silicon $80
Fresnel lens $75
Dielectric mirrors (6 in total) (Borosilicate glass) $672
PEC hydrogen production reactor $3,990
Ammonia production reactor $925
Support structure (wood) $45
Metal support mechanism including nuts and bolts $75
TOTAL $5,862
The support mechanism used in the integrated system consists of wood and metal parts. The
highest cost is for the PEC hydrogen production reactor which corresponds to about 68% of total
cost as show in Fig. 102.
Figure 102 Cost breakdown of the integrated system for hydrogen and ammonia production
The exergoeconomic analysis requires that a specific cost is put on the exergy streams in an exergy
balance on a component. On top of putting costs on the exergy streams, capital and running costs
PEC hydrogen production
reactor68%
Ammonia production
reactor16%
Dielectric mirrors 12%
Photovoltaic cell, multicrysitalline
silicon1%
Fresnel lens 1%
Metal support mechanism
1%
Support structure (wood)
1%
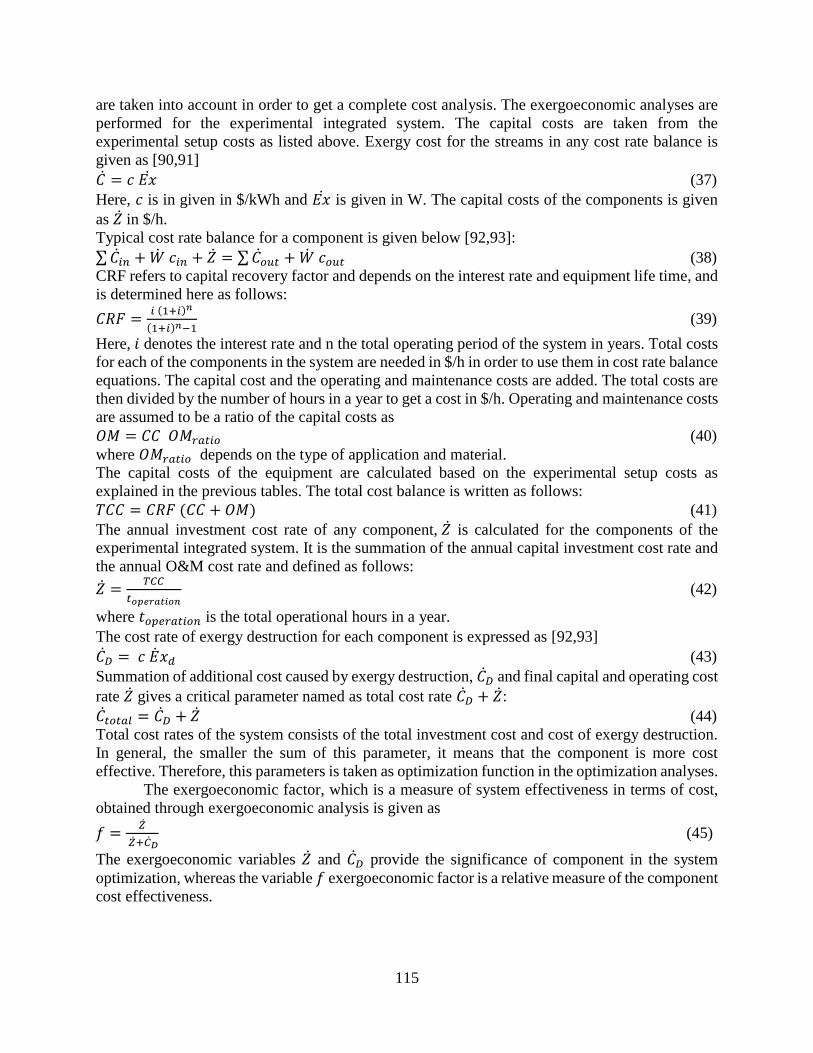
115
are taken into account in order to get a complete cost analysis. The exergoeconomic analyses are
performed for the experimental integrated system. The capital costs are taken from the
experimental setup costs as listed above. Exergy cost for the streams in any cost rate balance is
given as [90,91]
�� = 𝑐 𝐸�� (37)
Here, 𝑐 is in given in $/kWh and 𝐸�� is given in W. The capital costs of the components is given
as �� in $/h.
Typical cost rate balance for a component is given below [92,93]:
∑ ��𝑖𝑛 + �� 𝑐𝑖𝑛 + �� = ∑ ��𝑜𝑢𝑡 + �� 𝑐𝑜𝑢𝑡 (38)
CRF refers to capital recovery factor and depends on the interest rate and equipment life time, and
is determined here as follows:
𝐶𝑅𝐹 =𝑖 (1+𝑖)𝑛
(1+𝑖)𝑛−1 (39)
Here, 𝑖 denotes the interest rate and n the total operating period of the system in years. Total costs
for each of the components in the system are needed in $/h in order to use them in cost rate balance
equations. The capital cost and the operating and maintenance costs are added. The total costs are
then divided by the number of hours in a year to get a cost in $/h. Operating and maintenance costs
are assumed to be a ratio of the capital costs as
𝑂𝑀 = 𝐶𝐶 𝑂𝑀𝑟𝑎𝑡𝑖𝑜 (40)
where 𝑂𝑀𝑟𝑎𝑡𝑖𝑜 depends on the type of application and material.
The capital costs of the equipment are calculated based on the experimental setup costs as
explained in the previous tables. The total cost balance is written as follows:
𝑇𝐶𝐶 = 𝐶𝑅𝐹 (𝐶𝐶 + 𝑂𝑀) (41)
The annual investment cost rate of any component, �� is calculated for the components of the
experimental integrated system. It is the summation of the annual capital investment cost rate and
the annual O&M cost rate and defined as follows:
�� =𝑇𝐶𝐶
𝑡𝑜𝑝𝑒𝑟𝑎𝑡𝑖𝑜𝑛 (42)
where 𝑡𝑜𝑝𝑒𝑟𝑎𝑡𝑖𝑜𝑛 is the total operational hours in a year.
The cost rate of exergy destruction for each component is expressed as [92,93]
��𝐷 = 𝑐 ��𝑥𝑑 (43)
Summation of additional cost caused by exergy destruction, ��𝐷 and final capital and operating cost
rate �� gives a critical parameter named as total cost rate ��𝐷 + ��:
��𝑡𝑜𝑡𝑎𝑙 = ��𝐷 + �� (44)
Total cost rates of the system consists of the total investment cost and cost of exergy destruction.
In general, the smaller the sum of this parameter, it means that the component is more cost
effective. Therefore, this parameters is taken as optimization function in the optimization analyses.
The exergoeconomic factor, which is a measure of system effectiveness in terms of cost,
obtained through exergoeconomic analysis is given as
𝑓 =��
��+��𝐷 (45)
The exergoeconomic variables �� and ��𝐷 provide the significance of component in the system
optimization, whereas the variable 𝑓 exergoeconomic factor is a relative measure of the component
cost effectiveness.
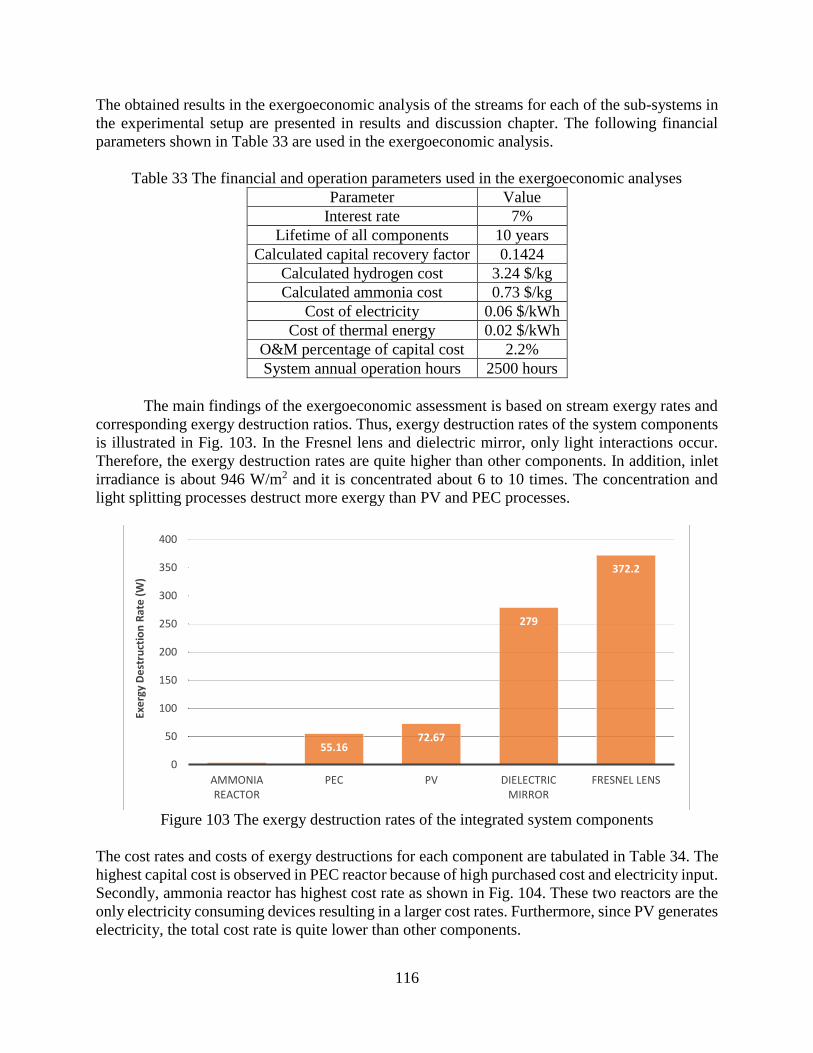
116
The obtained results in the exergoeconomic analysis of the streams for each of the sub-systems in
the experimental setup are presented in results and discussion chapter. The following financial
parameters shown in Table 33 are used in the exergoeconomic analysis.
Table 33 The financial and operation parameters used in the exergoeconomic analyses
Parameter Value
Interest rate 7%
Lifetime of all components 10 years
Calculated capital recovery factor 0.1424
Calculated hydrogen cost 3.24 $/kg
Calculated ammonia cost 0.73 $/kg
Cost of electricity 0.06 $/kWh
Cost of thermal energy 0.02 $/kWh
O&M percentage of capital cost 2.2%
System annual operation hours 2500 hours
The main findings of the exergoeconomic assessment is based on stream exergy rates and
corresponding exergy destruction ratios. Thus, exergy destruction rates of the system components
is illustrated in Fig. 103. In the Fresnel lens and dielectric mirror, only light interactions occur.
Therefore, the exergy destruction rates are quite higher than other components. In addition, inlet
irradiance is about 946 W/m2 and it is concentrated about 6 to 10 times. The concentration and
light splitting processes destruct more exergy than PV and PEC processes.
Figure 103 The exergy destruction rates of the integrated system components
The cost rates and costs of exergy destructions for each component are tabulated in Table 34. The
highest capital cost is observed in PEC reactor because of high purchased cost and electricity input.
Secondly, ammonia reactor has highest cost rate as shown in Fig. 104. These two reactors are the
only electricity consuming devices resulting in a larger cost rates. Furthermore, since PV generates
electricity, the total cost rate is quite lower than other components.
3.84 55.1672.67
279
372.2
0
50
100
150
200
250
300
350
400
AMMONIA REACTOR
PEC PV DIELECTRIC MIRROR
FRESNEL LENS
Exe
rgy
De
stru
ctio
n R
ate
(W
)
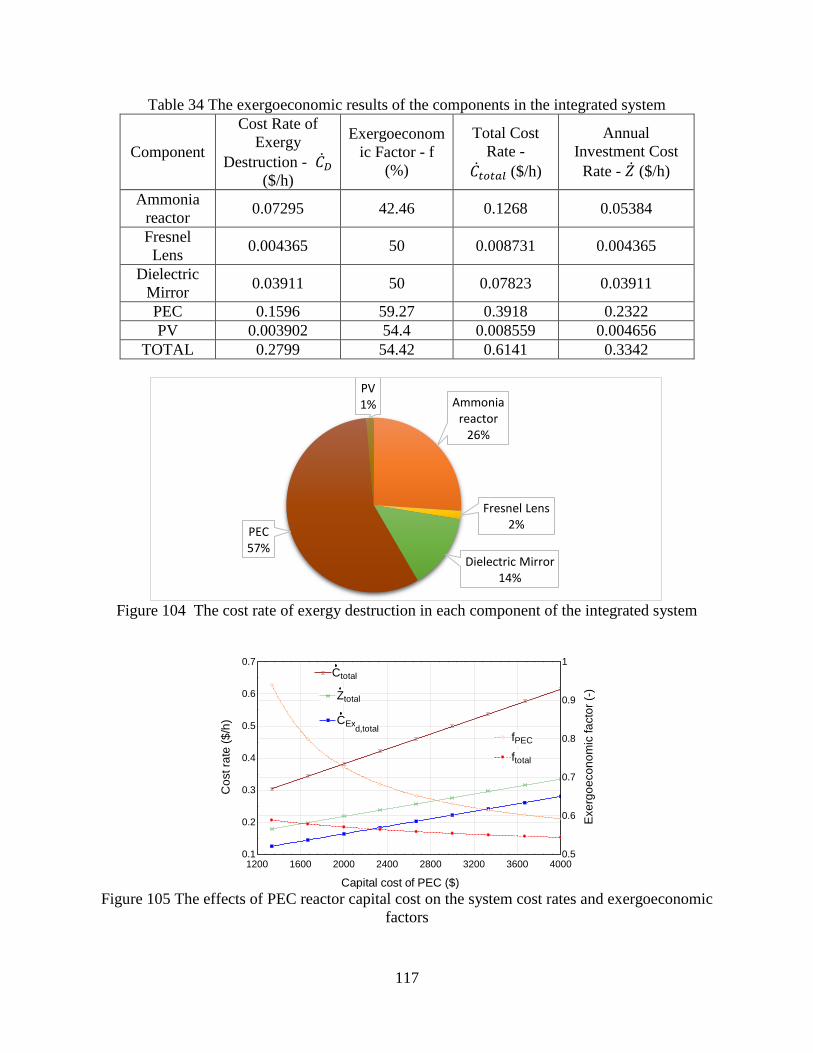
117
Table 34 The exergoeconomic results of the components in the integrated system
Component
Cost Rate of
Exergy
Destruction - ��𝐷
($/h)
Exergoeconom
ic Factor - f
(%)
Total Cost
Rate -
��𝑡𝑜𝑡𝑎𝑙 ($/h)
Annual
Investment Cost
Rate - �� ($/h)
Ammonia
reactor 0.07295 42.46 0.1268 0.05384
Fresnel
Lens 0.004365 50 0.008731 0.004365
Dielectric
Mirror 0.03911 50 0.07823 0.03911
PEC 0.1596 59.27 0.3918 0.2322
PV 0.003902 54.4 0.008559 0.004656
TOTAL 0.2799 54.42 0.6141 0.3342
Figure 104 The cost rate of exergy destruction in each component of the integrated system
Figure 105 The effects of PEC reactor capital cost on the system cost rates and exergoeconomic
factors
Ammonia reactor
26%
Fresnel Lens2%
Dielectric Mirror14%
PEC57%
PV1%
1200 1600 2000 2400 2800 3200 3600 40000.1
0.2
0.3
0.4
0.5
0.6
0.7
0.5
0.6
0.7
0.8
0.9
1
Capital cost of PEC ($)
Co
st ra
te (
$/h
) CExd,total
CExd,total
ZtotalZtotal
CtotalCtotal
fPECfPEC
ftotalftotal
Exe
rgo
eco
no
mic
fa
cto
r (-
)
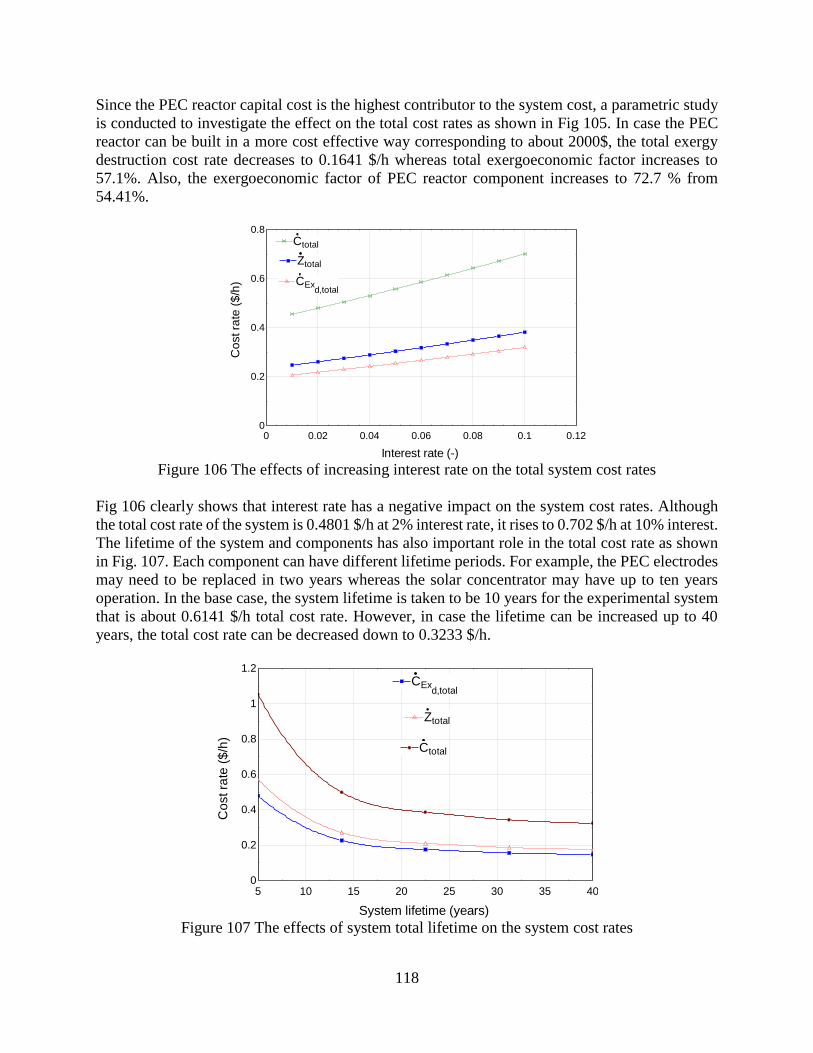
118
Since the PEC reactor capital cost is the highest contributor to the system cost, a parametric study
is conducted to investigate the effect on the total cost rates as shown in Fig 105. In case the PEC
reactor can be built in a more cost effective way corresponding to about 2000$, the total exergy
destruction cost rate decreases to 0.1641 $/h whereas total exergoeconomic factor increases to
57.1%. Also, the exergoeconomic factor of PEC reactor component increases to 72.7 % from
54.41%.
Figure 106 The effects of increasing interest rate on the total system cost rates
Fig 106 clearly shows that interest rate has a negative impact on the system cost rates. Although
the total cost rate of the system is 0.4801 $/h at 2% interest rate, it rises to 0.702 $/h at 10% interest.
The lifetime of the system and components has also important role in the total cost rate as shown
in Fig. 107. Each component can have different lifetime periods. For example, the PEC electrodes
may need to be replaced in two years whereas the solar concentrator may have up to ten years
operation. In the base case, the system lifetime is taken to be 10 years for the experimental system
that is about 0.6141 $/h total cost rate. However, in case the lifetime can be increased up to 40
years, the total cost rate can be decreased down to 0.3233 $/h.
Figure 107 The effects of system total lifetime on the system cost rates
0 0.02 0.04 0.06 0.08 0.1 0.120
0.2
0.4
0.6
0.8
Interest rate (-)
Co
st ra
te (
$/h
)
ZtotalZtotal
CExd,total
CExd,total
CtotalCtotal
5 10 15 20 25 30 35 400
0.2
0.4
0.6
0.8
1
1.2
System lifetime (years)
Co
st ra
te (
$/h
)
CtotalCtotal
ZtotalZtotal
CExd,total
CExd,total
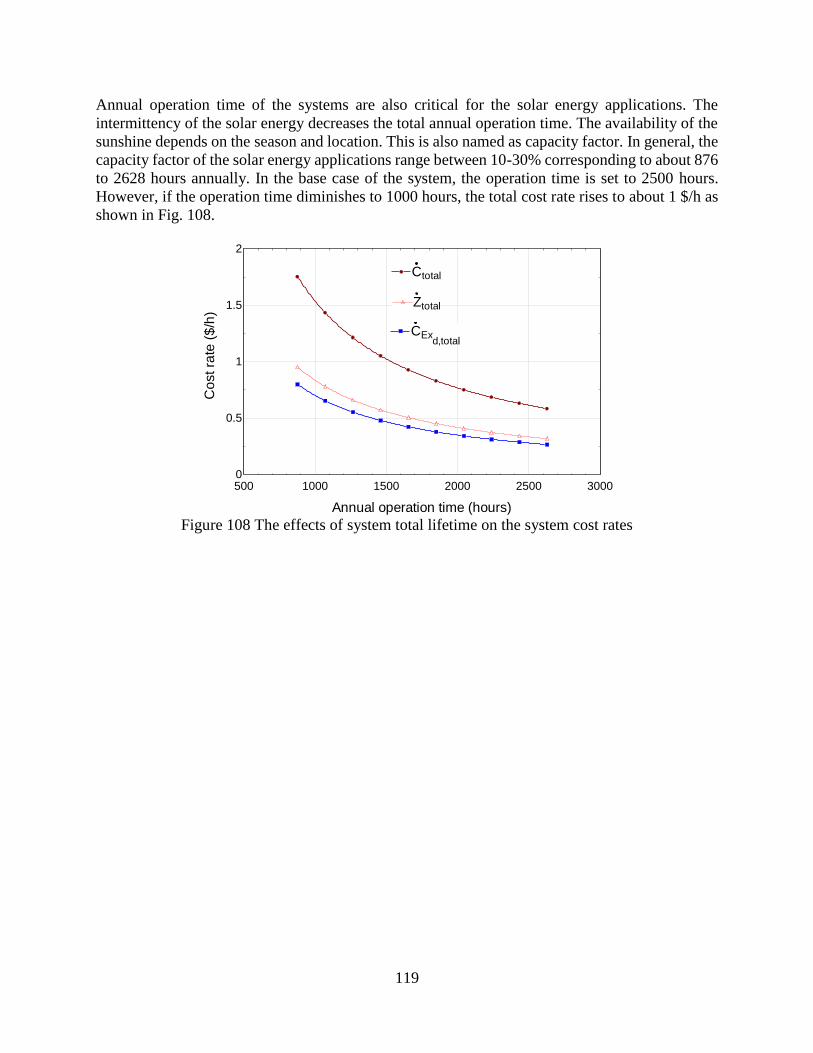
119
Annual operation time of the systems are also critical for the solar energy applications. The
intermittency of the solar energy decreases the total annual operation time. The availability of the
sunshine depends on the season and location. This is also named as capacity factor. In general, the
capacity factor of the solar energy applications range between 10-30% corresponding to about 876
to 2628 hours annually. In the base case of the system, the operation time is set to 2500 hours.
However, if the operation time diminishes to 1000 hours, the total cost rate rises to about 1 $/h as
shown in Fig. 108.
Figure 108 The effects of system total lifetime on the system cost rates
500 1000 1500 2000 2500 30000
0.5
1
1.5
2
Annual operation time (hours)
Co
st ra
te (
$/h
)
CtotalCtotal
CExd,total
CExd,total
ZtotalZtotal
120
CHAPTER 10: SCALE-UP ANALYSES FOR SOLAR ENERGY BASED AMMONIA
PRODUCTION
In case of larger production scales, the mass manufacturing of these equipment will be
considerably lower. In order to analyze the cost of hydrogen and ammonia at larger production
capacities such as 1000 kg/day, the scale up analyses are conducted as explained in the following
paragraphs. PEC systems use solar photons to generate a voltage in an electrolysis cell sufficient
to electrolyze water, producing H2 and O2 gases. For the economic analyses of the
photoelectrochemical hydrogen production system, the Hydrogen Analysis (H2A) production
model [94] is used which is developed by U.S. DOE Hydrogen & Fuel Cells Program. The H2A
Production Model analyzes the technical and economic aspects of central and forecourt hydrogen
production systems. Using a standard discounted cash flow rate of return methodology, it
determines the minimum hydrogen levelized cost, including a specified after-tax internal rate of
return from the production technology. The employed scenario models a PEC solar concentrator
system using reflectors to focus the solar flux with a concentration ratio of 10 intensity ratio onto
multi-junction PEC cell receivers immersed in an electrolyte reservoir and pressurized to 300 psi.
The PEC cells are in electrical contact with a small electrolyte reservoir and produce oxygen gas
on the anode side and hydrogen gas on the cathode side. The start-up year of the plant is taken as
2020. The Chemical Engineering Plant Cost Index (CEPCI) is used to adjust the capital cost of the
H2 Production facility from the basis year to the current year. The Consumer Price Inflator (CPI)
is used to deflate all dollars from the current year to the Reference Year. The available model is
quite similar to the designed and tested concentrated PEC system except for the solar light splitting
part. Hence, the solar splitting mechanism is not considered in the scaled-up cost assessment. A
solar tracking system is employed to make best use of direct radiation capture. Solar concentrators,
which can use reflectors or lenses to concentrate the solar energy, considerably lessen the cost
influence of the PV component of the system, but add the costs of the concentrators and directing
systems. For the concentrator PEC system, the water reservoir and the H2 and O2 collected are
pressurized by the inlet water pump at relatively low added cost. Pressurization to 300 psi avoids
the need for a separate compressor, minimizes water vapor loss by the reactor, and reduces O2 gas
bubble size, which minimizes potential bubble scattering of incident photons at the anode face.
The H2A Costing Model [94] delivers an organized layout to enter factors which impact
cash inflows and outflows associated with the construction and operation of a hydrogen production
plant. The system practices a solar concentrator reflector to focus solar direct radiation onto the
PEC cell. A PEC concentrator system can possibly use a concentration ratio of 10-50 suns;
nonetheless, since the experimentally tested system uses about a concentration ratio of 6 to 10, the
scale-up analyses are considered for 10 suns. Plant control arrangements perform many duties
including local and remote monitoring, alarming and controlling of plant equipment and functions.
The model comprises the control and instrumentation mechanisms including the functionality and
safety. In the scaled up analyses for hydrogen production, the capacity factor and plant outputs are
listed in Table 35. The main financial parameters used in the cost analyses are shown in Table 36.
Industrial electricity prices are taken in the calculations as $0.06/kWh [95]. The overall solar-to-
hydrogen conversion efficiency of the concentrated PEC hydrogen production system is taken as
16% which is the expected efficiency by 2020 as mentioned in the literature review section. It is
assumed that the average solar irradiance is 6.55 kWh/m2/day.
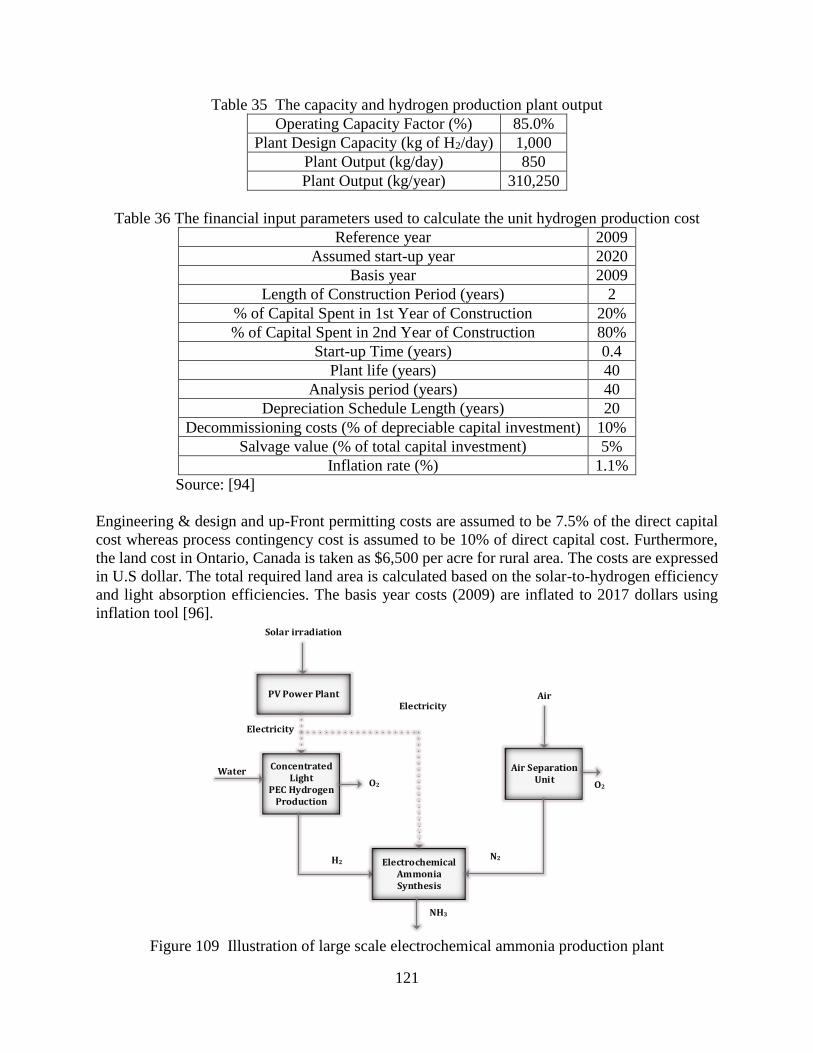
121
Table 35 The capacity and hydrogen production plant output
Operating Capacity Factor (%) 85.0%
Plant Design Capacity (kg of H2/day) 1,000
Plant Output (kg/day) 850
Plant Output (kg/year) 310,250
Table 36 The financial input parameters used to calculate the unit hydrogen production cost
Reference year 2009
Assumed start-up year 2020
Basis year 2009
Length of Construction Period (years) 2
% of Capital Spent in 1st Year of Construction 20%
% of Capital Spent in 2nd Year of Construction 80%
Start-up Time (years) 0.4
Plant life (years) 40
Analysis period (years) 40
Depreciation Schedule Length (years) 20
Decommissioning costs (% of depreciable capital investment) 10%
Salvage value (% of total capital investment) 5%
Inflation rate (%) 1.1%
Source: [94]
Engineering & design and up-Front permitting costs are assumed to be 7.5% of the direct capital
cost whereas process contingency cost is assumed to be 10% of direct capital cost. Furthermore,
the land cost in Ontario, Canada is taken as $6,500 per acre for rural area. The costs are expressed
in U.S dollar. The total required land area is calculated based on the solar-to-hydrogen efficiency
and light absorption efficiencies. The basis year costs (2009) are inflated to 2017 dollars using
inflation tool [96].
PV Power Plant
Concentrated Light
PEC Hydrogen Production
Air Separation Unit
Solar irradiation
AirElectricity
Electricity
H2N2
Electrochemical Ammonia Synthesis
NH3
WaterO2 O2
Figure 109 Illustration of large scale electrochemical ammonia production plant
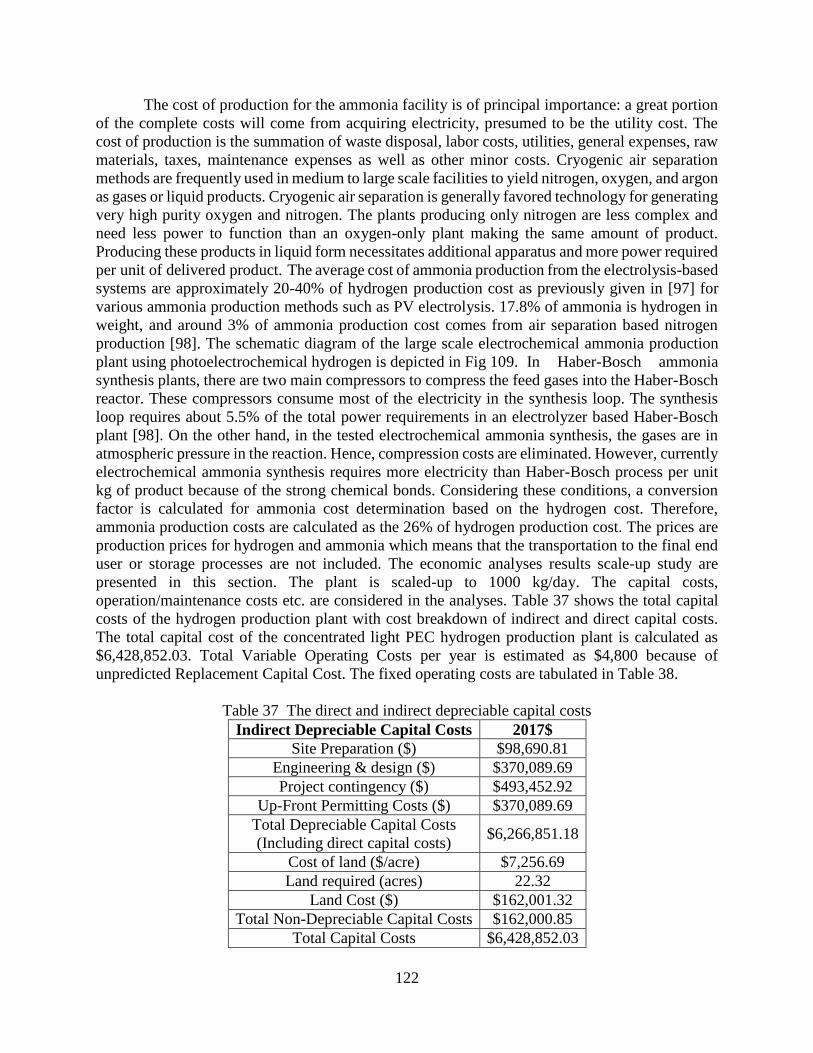
122
The cost of production for the ammonia facility is of principal importance: a great portion
of the complete costs will come from acquiring electricity, presumed to be the utility cost. The
cost of production is the summation of waste disposal, labor costs, utilities, general expenses, raw
materials, taxes, maintenance expenses as well as other minor costs. Cryogenic air separation
methods are frequently used in medium to large scale facilities to yield nitrogen, oxygen, and argon
as gases or liquid products. Cryogenic air separation is generally favored technology for generating
very high purity oxygen and nitrogen. The plants producing only nitrogen are less complex and
need less power to function than an oxygen-only plant making the same amount of product.
Producing these products in liquid form necessitates additional apparatus and more power required
per unit of delivered product. The average cost of ammonia production from the electrolysis-based
systems are approximately 20-40% of hydrogen production cost as previously given in [97] for
various ammonia production methods such as PV electrolysis. 17.8% of ammonia is hydrogen in
weight, and around 3% of ammonia production cost comes from air separation based nitrogen
production [98]. The schematic diagram of the large scale electrochemical ammonia production
plant using photoelectrochemical hydrogen is depicted in Fig 109. In Haber-Bosch ammonia
synthesis plants, there are two main compressors to compress the feed gases into the Haber-Bosch
reactor. These compressors consume most of the electricity in the synthesis loop. The synthesis
loop requires about 5.5% of the total power requirements in an electrolyzer based Haber-Bosch
plant [98]. On the other hand, in the tested electrochemical ammonia synthesis, the gases are in
atmospheric pressure in the reaction. Hence, compression costs are eliminated. However, currently
electrochemical ammonia synthesis requires more electricity than Haber-Bosch process per unit
kg of product because of the strong chemical bonds. Considering these conditions, a conversion
factor is calculated for ammonia cost determination based on the hydrogen cost. Therefore,
ammonia production costs are calculated as the 26% of hydrogen production cost. The prices are
production prices for hydrogen and ammonia which means that the transportation to the final end
user or storage processes are not included. The economic analyses results scale-up study are
presented in this section. The plant is scaled-up to 1000 kg/day. The capital costs,
operation/maintenance costs etc. are considered in the analyses. Table 37 shows the total capital
costs of the hydrogen production plant with cost breakdown of indirect and direct capital costs.
The total capital cost of the concentrated light PEC hydrogen production plant is calculated as
$6,428,852.03. Total Variable Operating Costs per year is estimated as $4,800 because of
unpredicted Replacement Capital Cost. The fixed operating costs are tabulated in Table 38.
Table 37 The direct and indirect depreciable capital costs
Indirect Depreciable Capital Costs 2017$
Site Preparation ($) $98,690.81
Engineering & design ($) $370,089.69
Project contingency ($) $493,452.92
Up-Front Permitting Costs ($) $370,089.69
Total Depreciable Capital Costs
(Including direct capital costs) $6,266,851.18
Cost of land ($/acre) $7,256.69
Land required (acres) 22.32
Land Cost ($) $162,001.32
Total Non-Depreciable Capital Costs $162,000.85
Total Capital Costs $6,428,852.03
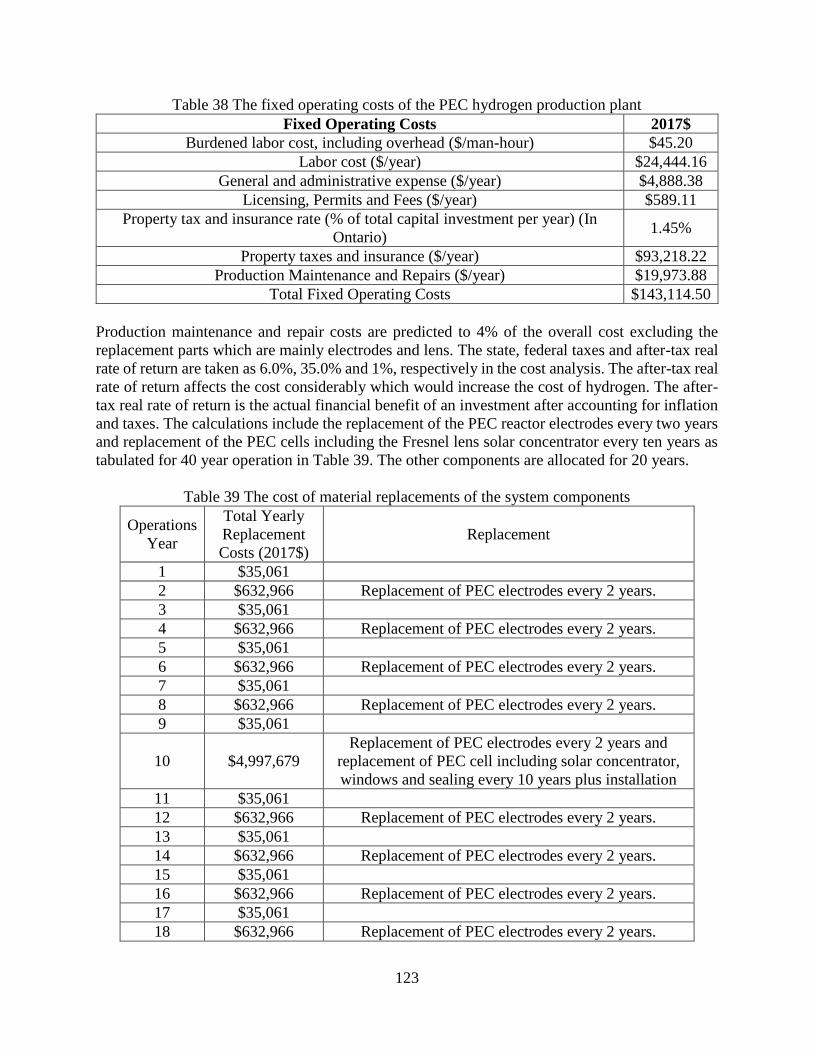
123
Table 38 The fixed operating costs of the PEC hydrogen production plant
Fixed Operating Costs 2017$
Burdened labor cost, including overhead ($/man-hour) $45.20
Labor cost ($/year) $24,444.16
General and administrative expense ($/year) $4,888.38
Licensing, Permits and Fees ($/year) $589.11
Property tax and insurance rate (% of total capital investment per year) (In
Ontario) 1.45%
Property taxes and insurance ($/year) $93,218.22
Production Maintenance and Repairs ($/year) $19,973.88
Total Fixed Operating Costs $143,114.50
Production maintenance and repair costs are predicted to 4% of the overall cost excluding the
replacement parts which are mainly electrodes and lens. The state, federal taxes and after-tax real
rate of return are taken as 6.0%, 35.0% and 1%, respectively in the cost analysis. The after-tax real
rate of return affects the cost considerably which would increase the cost of hydrogen. The after-
tax real rate of return is the actual financial benefit of an investment after accounting for inflation
and taxes. The calculations include the replacement of the PEC reactor electrodes every two years
and replacement of the PEC cells including the Fresnel lens solar concentrator every ten years as
tabulated for 40 year operation in Table 39. The other components are allocated for 20 years.
Table 39 The cost of material replacements of the system components
Operations
Year
Total Yearly
Replacement
Costs (2017$)
Replacement
1 $35,061
2 $632,966 Replacement of PEC electrodes every 2 years.
3 $35,061
4 $632,966 Replacement of PEC electrodes every 2 years.
5 $35,061
6 $632,966 Replacement of PEC electrodes every 2 years.
7 $35,061
8 $632,966 Replacement of PEC electrodes every 2 years.
9 $35,061
10 $4,997,679
Replacement of PEC electrodes every 2 years and
replacement of PEC cell including solar concentrator,
windows and sealing every 10 years plus installation
11 $35,061
12 $632,966 Replacement of PEC electrodes every 2 years.
13 $35,061
14 $632,966 Replacement of PEC electrodes every 2 years.
15 $35,061
16 $632,966 Replacement of PEC electrodes every 2 years.
17 $35,061
18 $632,966 Replacement of PEC electrodes every 2 years.
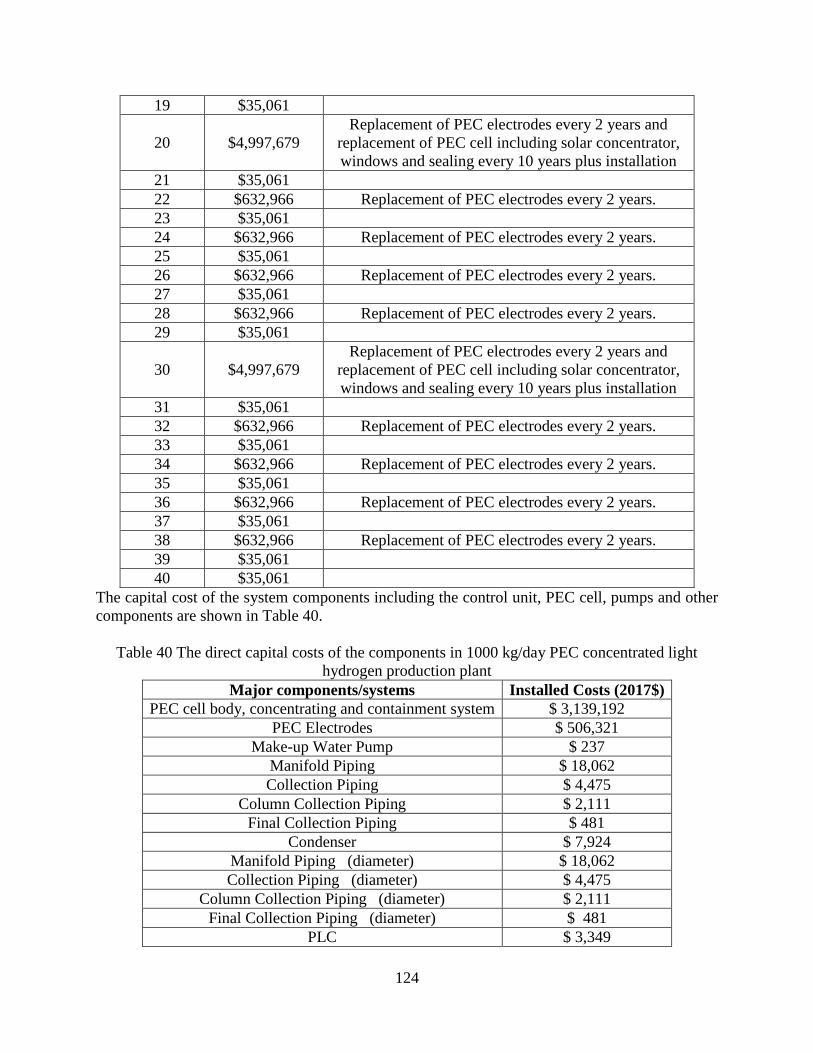
124
19 $35,061
20 $4,997,679
Replacement of PEC electrodes every 2 years and
replacement of PEC cell including solar concentrator,
windows and sealing every 10 years plus installation
21 $35,061
22 $632,966 Replacement of PEC electrodes every 2 years.
23 $35,061
24 $632,966 Replacement of PEC electrodes every 2 years.
25 $35,061
26 $632,966 Replacement of PEC electrodes every 2 years.
27 $35,061
28 $632,966 Replacement of PEC electrodes every 2 years.
29 $35,061
30 $4,997,679
Replacement of PEC electrodes every 2 years and
replacement of PEC cell including solar concentrator,
windows and sealing every 10 years plus installation
31 $35,061
32 $632,966 Replacement of PEC electrodes every 2 years.
33 $35,061
34 $632,966 Replacement of PEC electrodes every 2 years.
35 $35,061
36 $632,966 Replacement of PEC electrodes every 2 years.
37 $35,061
38 $632,966 Replacement of PEC electrodes every 2 years.
39 $35,061
40 $35,061
The capital cost of the system components including the control unit, PEC cell, pumps and other
components are shown in Table 40.
Table 40 The direct capital costs of the components in 1000 kg/day PEC concentrated light
hydrogen production plant
Major components/systems Installed Costs (2017$)
PEC cell body, concentrating and containment system $ 3,139,192
PEC Electrodes $ 506,321
Make-up Water Pump $ 237
Manifold Piping $ 18,062
Collection Piping $ 4,475
Column Collection Piping $ 2,111
Final Collection Piping $ 481
Condenser $ 7,924
Manifold Piping (diameter) $ 18,062
Collection Piping (diameter) $ 4,475
Column Collection Piping (diameter) $ 2,111
Final Collection Piping (diameter) $ 481
PLC $ 3,349
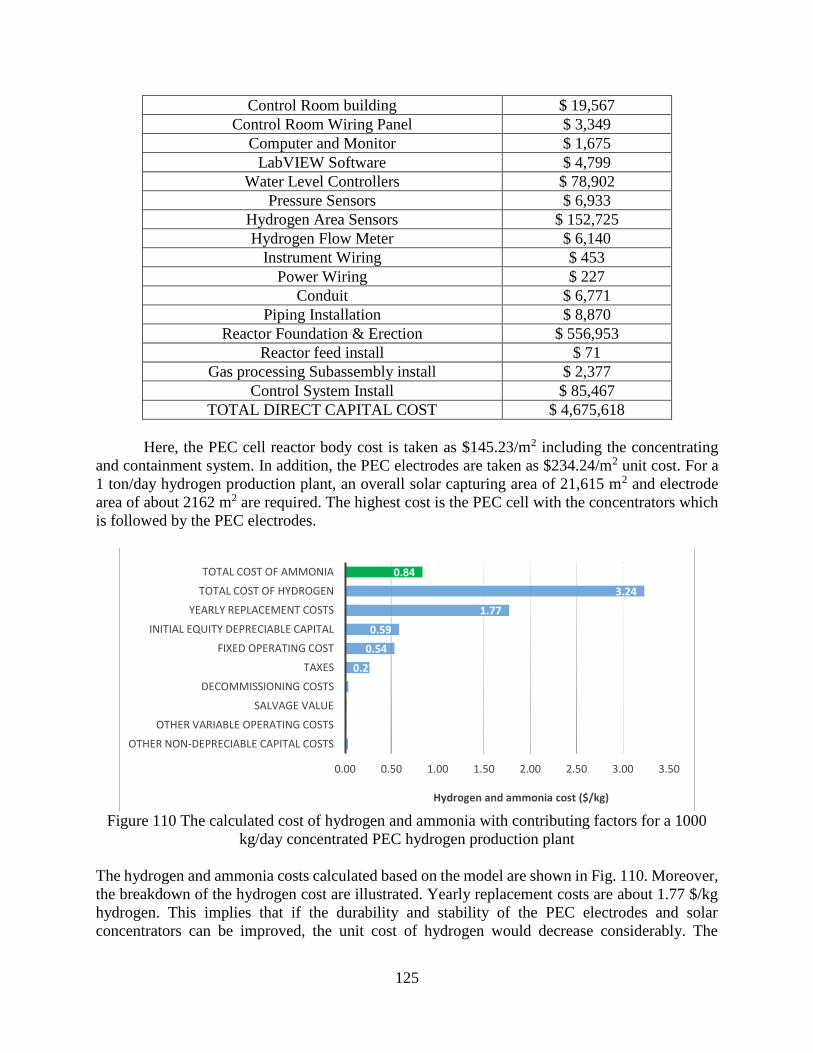
125
Control Room building $ 19,567
Control Room Wiring Panel $ 3,349
Computer and Monitor $ 1,675
LabVIEW Software $ 4,799
Water Level Controllers $ 78,902
Pressure Sensors $ 6,933
Hydrogen Area Sensors $ 152,725
Hydrogen Flow Meter $ 6,140
Instrument Wiring $ 453
Power Wiring $ 227
Conduit $ 6,771
Piping Installation $ 8,870
Reactor Foundation & Erection $ 556,953
Reactor feed install $ 71
Gas processing Subassembly install $ 2,377
Control System Install $ 85,467
TOTAL DIRECT CAPITAL COST $ 4,675,618
Here, the PEC cell reactor body cost is taken as $145.23/m2 including the concentrating
and containment system. In addition, the PEC electrodes are taken as $234.24/m2 unit cost. For a
1 ton/day hydrogen production plant, an overall solar capturing area of 21,615 m2 and electrode
area of about 2162 m2 are required. The highest cost is the PEC cell with the concentrators which
is followed by the PEC electrodes.
Figure 110 The calculated cost of hydrogen and ammonia with contributing factors for a 1000
kg/day concentrated PEC hydrogen production plant
The hydrogen and ammonia costs calculated based on the model are shown in Fig. 110. Moreover,
the breakdown of the hydrogen cost are illustrated. Yearly replacement costs are about 1.77 $/kg
hydrogen. This implies that if the durability and stability of the PEC electrodes and solar
concentrators can be improved, the unit cost of hydrogen would decrease considerably. The
0.03
0.02
0.02
0.04
0.27
0.54
0.59
1.77
3.24
0.84
0.00 0.50 1.00 1.50 2.00 2.50 3.00 3.50
OTHER NON-DEPRECIABLE CAPITAL COSTS
OTHER VARIABLE OPERATING COSTS
SALVAGE VALUE
DECOMMISSIONING COSTS
TAXES
FIXED OPERATING COST
INITIAL EQUITY DEPRECIABLE CAPITAL
YEARLY REPLACEMENT COSTS
TOTAL COST OF HYDROGEN
TOTAL COST OF AMMONIA
Hydrogen and ammonia cost ($/kg)
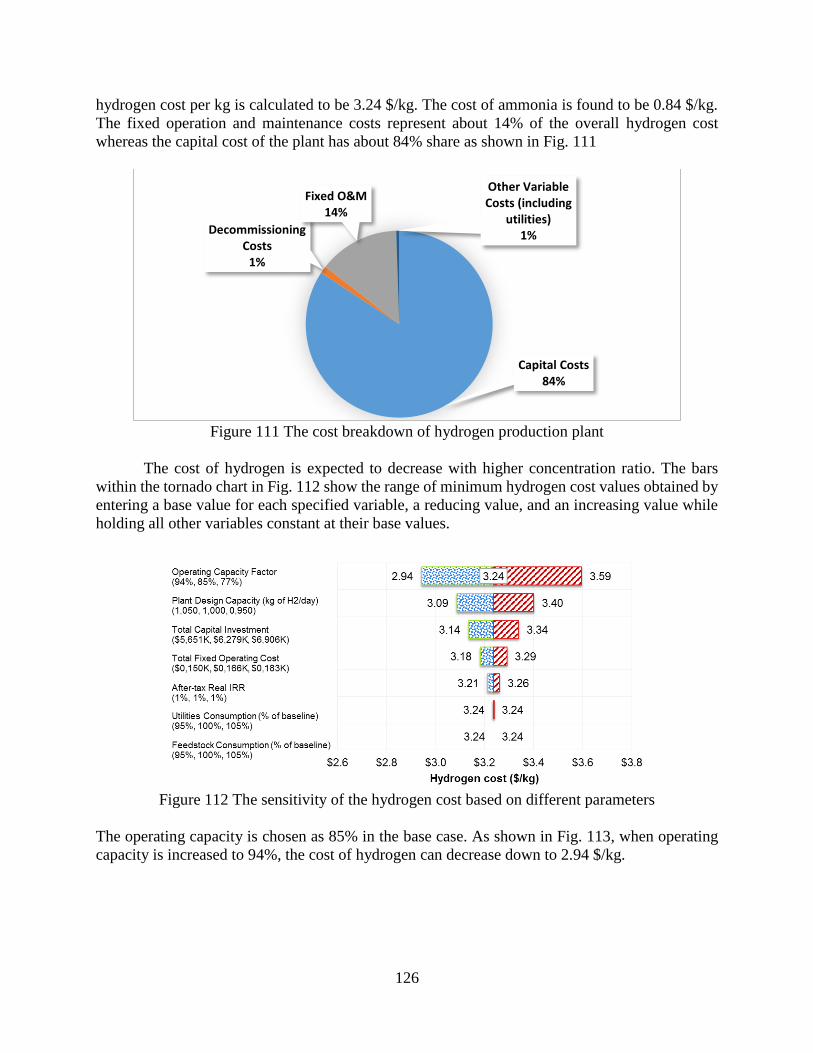
126
hydrogen cost per kg is calculated to be 3.24 $/kg. The cost of ammonia is found to be 0.84 $/kg.
The fixed operation and maintenance costs represent about 14% of the overall hydrogen cost
whereas the capital cost of the plant has about 84% share as shown in Fig. 111
Figure 111 The cost breakdown of hydrogen production plant
The cost of hydrogen is expected to decrease with higher concentration ratio. The bars
within the tornado chart in Fig. 112 show the range of minimum hydrogen cost values obtained by
entering a base value for each specified variable, a reducing value, and an increasing value while
holding all other variables constant at their base values.
Figure 112 The sensitivity of the hydrogen cost based on different parameters
The operating capacity is chosen as 85% in the base case. As shown in Fig. 113, when operating
capacity is increased to 94%, the cost of hydrogen can decrease down to 2.94 $/kg.
Capital Costs84%
Decommissioning Costs
1%
Fixed O&M14%
Other Variable Costs (including
utilities)1%
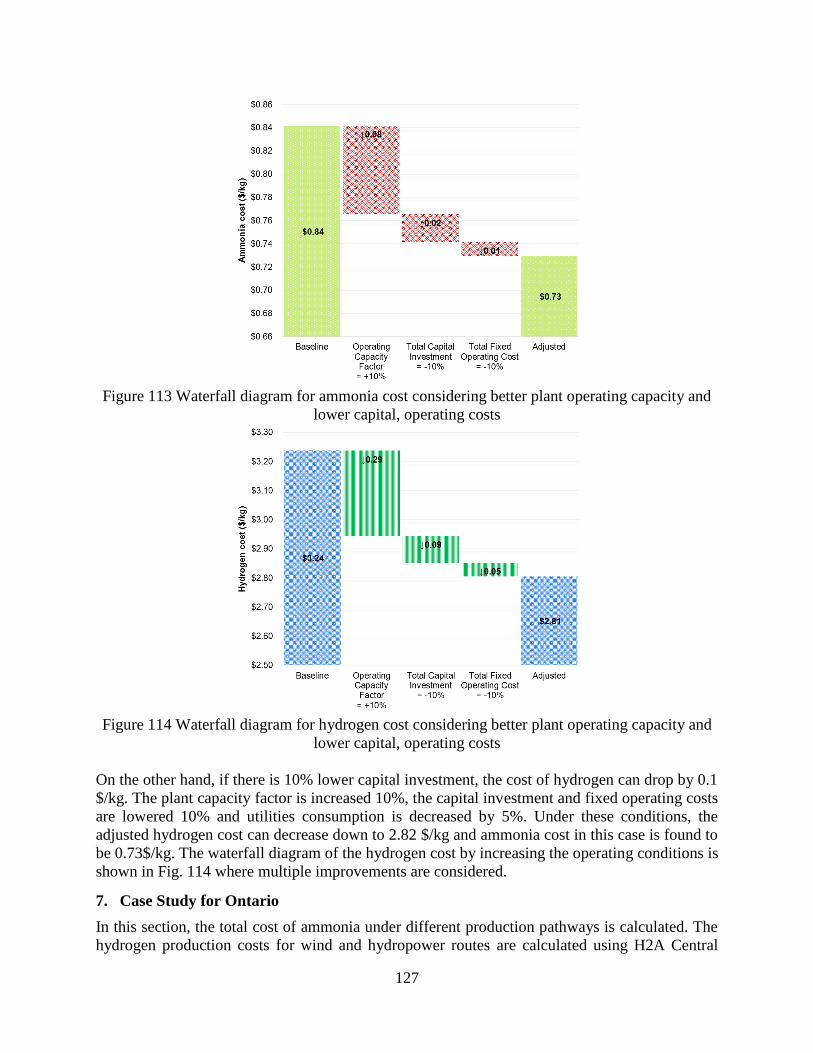
127
Figure 113 Waterfall diagram for ammonia cost considering better plant operating capacity and
lower capital, operating costs
Figure 114 Waterfall diagram for hydrogen cost considering better plant operating capacity and
lower capital, operating costs
On the other hand, if there is 10% lower capital investment, the cost of hydrogen can drop by 0.1
$/kg. The plant capacity factor is increased 10%, the capital investment and fixed operating costs
are lowered 10% and utilities consumption is decreased by 5%. Under these conditions, the
adjusted hydrogen cost can decrease down to 2.82 $/kg and ammonia cost in this case is found to
be 0.73$/kg. The waterfall diagram of the hydrogen cost by increasing the operating conditions is
shown in Fig. 114 where multiple improvements are considered.
7. Case Study for Ontario
In this section, the total cost of ammonia under different production pathways is calculated. The
hydrogen production costs for wind and hydropower routes are calculated using H2A Central
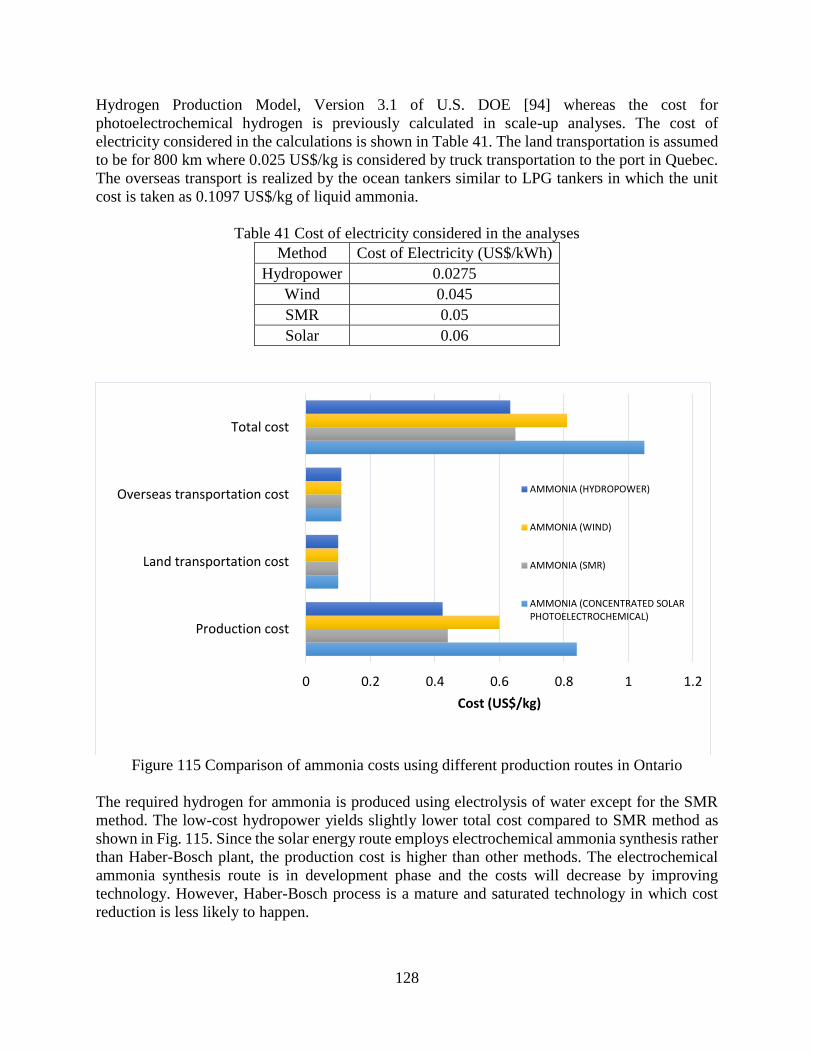
128
Hydrogen Production Model, Version 3.1 of U.S. DOE [94] whereas the cost for
photoelectrochemical hydrogen is previously calculated in scale-up analyses. The cost of
electricity considered in the calculations is shown in Table 41. The land transportation is assumed
to be for 800 km where 0.025 US$/kg is considered by truck transportation to the port in Quebec.
The overseas transport is realized by the ocean tankers similar to LPG tankers in which the unit
cost is taken as 0.1097 US$/kg of liquid ammonia.
Table 41 Cost of electricity considered in the analyses
Method Cost of Electricity (US$/kWh)
Hydropower 0.0275
Wind 0.045
SMR 0.05
Solar 0.06
Figure 115 Comparison of ammonia costs using different production routes in Ontario
The required hydrogen for ammonia is produced using electrolysis of water except for the SMR
method. The low-cost hydropower yields slightly lower total cost compared to SMR method as
shown in Fig. 115. Since the solar energy route employs electrochemical ammonia synthesis rather
than Haber-Bosch plant, the production cost is higher than other methods. The electrochemical
ammonia synthesis route is in development phase and the costs will decrease by improving
technology. However, Haber-Bosch process is a mature and saturated technology in which cost
reduction is less likely to happen.
0 0.2 0.4 0.6 0.8 1 1.2
Production cost
Land transportation cost
Overseas transportation cost
Total cost
Cost (US$/kg)
AMMONIA (HYDROPOWER)
AMMONIA (WIND)
AMMONIA (SMR)
AMMONIA (CONCENTRATED SOLARPHOTOELECTROCHEMICAL)
129
CHAPTER 11: CONCLUDING REMARKS
Ammonia is a carbon-free fuel suitable for use in transportation sector. It has a well-established
production and distribution infrastructure, and has zero global warming potential during operation.
In addition to its attractive qualities as a fuel, ammonia is widely used as a NOx reducing agent
for combustion exhaust gases using selective catalytic reduction (SCR), and its capacity as a
refrigerant can be applied to recover and further utilize engine heat that would otherwise be lost.
Renewable ammonia (NH3), which is a carbon-free fuel, refrigerant and working fluid; and storage
media of hydrogen, are unique solutions to Canada’s energy and environmental challenges.
Renewable ammonia and hydrogen can serve almost all economic sectors, ranging from
transportation to residential, industrial to commercial, public to utility, and agricultural to
chemical. Ammonia as a potential fuel for vehicles or power generation can also be economically
produced using conventional hydrocarbons in a cleaner manner by implying current technologies
and developments. Ammonia can be produced using fossil fuels, or any renewable energy source
using heat and/or electricity. Ammonia and hydrogen applications have been developed for sectors
including but not limited to: transportation, industrial, commercial, utility, agricultural, and the
chemical industries.
High-efficiency ammonia/urea plants using natural gas and other hydrocarbon feed stocks
can be built beside natural gas power plants and oil sand extraction sites. Utilizing the waste, low-
grade heat and excess oxygen results in a significant reduction of costs and emissions. The 200
million metric tonnes of ammonia produced globally each year comes from combining nitrogen
from air with the hydrogen in coal and natural gas. The carbon in these hydrocarbons is usually
emitted as carbon dioxide (CO2), but about 40 per cent of the ammonia produced is combined with
CO2 sequestered in the a well-known Haber-Bosch synthesis process to make urea.
Dissociation of hydrocarbons such as methane and oil sand bitumen into hydrogen which
can be then converted to ammonia is a promising option for oil sand and natural gas reserves in
Western Canada and stranded gas reserves in Newfoundland and Labrador. Ammonia has
significant environmental advantages. Even if ammonia is produced from hydrocarbons, it has
similar greenhouse gas emissions with a solar energy based route.
In terms of environmental sustainability, ammonia can be produced using either fossil
fuels, or any renewable energy source, using heat and/or electricity, which allows for evolution of
ammonia production methods and technologies in parallel with sustainable development.
Ammonia as a sustainable fuel can be used in all types of combustion engines, gas turbines, burners
with only small modifications and directly in fuel cells which is a very significant advantage
compared to another type of fuels. Reducing the total greenhouse gas emissions from marine
transportation is possible by using ammonia which is carbon-free fuel. When ammonia is produced
using renewable energy such as wind (versus conventional unleaded gasoline), a further 30 per
cent greenhouse gas reduction is possible. When compared to propane, greenhouse gas emissions
decrease about 18 per cent. An ammonia-driven passenger vehicle emits less greenhouse gas than
compressed natural gas (CNG), liquefied petroleum gas (LPG), diesel, gasoline, and even hybrid
electric vehicles. They can be utilized for maritime ship engines directly as supplementary fuels
or individual fuels. Ammonia fueled ships yield considerably lower global warming impact during
operation. Ammonia as a sustainable and clean fuel in road vehicles yield also the lowest global
warming potential after electric and hydrogen vehicles. As a result, ammonia usage in the
communities for transportation sector will bring significant cost and environmental benefits
together with public satisfaction.
130
REFERENCES
1. Yara Fertilizer Industry Handbook. 2017.
2. Weekly Fertilizer Review [Internet]. Ammonia prices. [cited 2017 Jan 7]. Available from:
http://www.farmfutures.com/story-weekly-fertilizer-review-0-30765
3. U.S., Mexico to source 50% of electricity from clean energy by 2025 - Politics - CBC News
[Internet]. [cited 2017 Mar 24]. Available from: http://www.cbc.ca/news/politics/three-
amigos-summit-climate-policies-1.3654166
4. Muradov NZ, Veziroǧlu TN. From hydrocarbon to hydrogen–carbon to hydrogen economy.
Int J Hydrogen Energy. 2005;30(3):225–37.
5. Muradov N. Hydrogen via methane decomposition: an application for decarbonization of
fossil fuels. Int J Hydrogen Energy. 2001;26(11):1165–75.
6. Muradov NZ. How to produce hydrogen from fossil fuels without CO2 emission. Int J
Hydrogen Energy. 1993;18(3):211–5.
7. Brohi EA. Ammonia as fuel for internal combustion engines ? An evaluation of the
feasibility of using nitrogen-based fuels in ICE. CHALMERS UNIVERSITY OF
TECHNOLOGY; 2014.
8. Iki N, Kurata O, Matsunuma T, Inoue T, Suzuki M, Tsujimura T, et al. Micro Gas Turbine
Firing Kerosene and Ammonia. In: ASME Turbo Expo 2015: Turbine Technical
Conference and Exposition. American Society of Mechanical Engineers; 2015. p.
V008T23A023-V008T23A023.
9. Haputhanthri SO, Maxwell TT, Fleming J, Austin C. Ammonia and Gasoline Fuel Blends
for Spark Ignited Internal Combustion Engines. J Energy Resour Technol.
2015;137(6):62201.
10. Nozari H, Karabeyoğlu A. Numerical study of combustion characteristics of ammonia as a
renewable fuel and establishment of reduced reaction mechanisms. Fuel. 2015;159:223–33.
11. Reiter AJ, Kong S-C. Combustion and emissions characteristics of compression-ignition
engine using dual ammonia-diesel fuel. Fuel. 2011;90(1):87–97.
12. Ryu K, Zacharakis-Jutz GE, Kong S-C. Performance enhancement of ammonia-fueled
engine by using dissociation catalyst for hydrogen generation. Int J Hydrogen Energy.
2014;39(5):2390–8.
13. Zamfirescu C, Dincer I. Using ammonia as a sustainable fuel. J Power Sources.
2008;185(1):459–65.
14. Zamfirescu C, Dincer I. Ammonia as a green fuel and hydrogen source for vehicular
applications. Fuel Process Technol. 2009;90(5):729–37.
15. Hinnemann B, Nørskov JK. Catalysis by Enzymes: The Biological Ammonia Synthesis.
Top Catal. 2006 Mar;37(1):55–70.
16. Lan R, Irvine JTS, Tao S. Synthesis of ammonia directly from air and water at ambient
temperature and pressure. Sci Rep. 2013;3:1145.
17. Li F-F, Licht S. Advances in Understanding the Mechanism and Improved Stability of the
Synthesis of Ammonia from Air and Water in Hydroxide Suspensions of Nanoscale Fe2O3.
Inorg Chem. 2014;53(19):10042–4.
18. Licht S, Cui B, Wang B, Li F-F, Lau J, Liu S. Ammonia synthesis by N2 and steam
electrolysis in molten hydroxide suspensions of nanoscale Fe2O3. Science (80- ).
2014;345(6197):637–40.
19. Paschkewitz TM. Ammonia Production at Ambient Temperature and Pressure: An
131
Electrochemical and Biological Approach. PhD (Doctor of Philosophy) thesis. University
of Iowa; 2012.
20. Skodra A, Stoukides M. Electrocatalytic synthesis of ammonia from steam and nitrogen at
atmospheric pressure. Solid State Ionics. 2009;180(23–25):1332–6.
21. Kordali V, Kyriacou G, Lambrou C. Electrochemical synthesis of ammonia at atmospheric
pressure and low temperature in a solid polymer electrolyte cell. Chem Commun.
2000;(17):1673–4.
22. Ganley JC. An intermediate-temperature direct ammonia fuel cell with a molten alkaline
hydroxide electrolyte. J Power Sources. 2008;178(1):44–7.
23. Serizawa N, Miyashiro H, Takei K, Ikezumi T, Nishikiori T, Ito Y. Dissolution Behavior
of Ammonia Electrosynthesized in Molten LiCl–KCl–CsCl System. J Electrochem Soc.
2012;159(4):E87–91.
24. Amar I, Lan R, Petit CG, Tao S. Solid-state electrochemical synthesis of ammonia: a review.
J Solid State Electrochem. 2011;15(9):1845–60.
25. Murakami T, Nohira T, Ogata YH, Ito Y. Electrolytic Ammonia Synthesis in Molten Salts
under Atmospheric Pressure Using Methane as a Hydrogen Source. Electrochem Solid-
State Lett. 2005;8(4):D12–4.
26. Yiokari CG, Pitselis GE, Polydoros DG, Katsaounis AD, Vayenas CG. High-Pressure
Electrochemical Promotion of Ammonia Synthesis over an Industrial Iron Catalyst. J Phys
Chem A. 2000;104(46):10600–2.
27. Marnellos G, Stoukides M. Ammonia Synthesis at Atmospheric Pressure. Science (80- ).
1998;282(5386):98–100.
28. Zhang Z, Zhong Z, Liu R. Cathode catalysis performance of SmBaCuMO5+δ (M=Fe, Co,
Ni) in ammonia synthesis. J Rare Earths. 2010;28(4):556–9.
29. Wang WB, Cao XB, Gao WJ, Zhang F, Wang HT, Ma GL. Ammonia synthesis at
atmospheric pressure using a reactor with thin solid electrolyte BaCe0.85Y0.15O3−α
membrane. J Memb Sci. 2010;360(1–2):397–403.
30. Marnellos G, Zisekas S, Stoukides M. Synthesis of Ammonia at Atmospheric Pressure with
the Use of Solid State Proton Conductors. J Catal. 2000;193(1):80–7.
31. Goto T, Ito Y. Electrochemical reduction of nitrogen gas in a molten chloride system.
Electrochim Acta. 1998;43(21–22):3379–84.
32. Kugler K, Luhn M, Schramm JA, Rahimi K, Wessling M. Galvanic deposition of Rh and
Ru on randomly structured Ti felts for the electrochemical NH3 synthesis. Phys Chem
Chem Phys. 2015;17(5):3768–82.
33. Yun DS, Joo JH, Yu JH, Yoon HC, Kim J-N, Yoo C-Y. Electrochemical ammonia synthesis
from steam and nitrogen using proton conducting yttrium doped barium zirconate
electrolyte with silver, platinum, and lanthanum strontium cobalt ferrite electrocatalyst. J
Power Sources. 2015;284:245–51.
34. Xu G, Liu R, Wang J. Electrochemical synthesis of ammonia using a cell with a Nafion
membrane and SmFe0. 7Cu0. 3− xNixO3 (x= 0− 0.3) cathode at atmospheric pressure and
lower temperature. Sci China Ser B Chem. 2009;52(8):1171–5.
35. Garagounis I, Kyriakou V, Skodra A, Vasileiou E, Stoukides M. Electrochemical Synthesis
of Ammonia in Solid Electrolyte Cells. Front Energy Res. 2014;2.
36. Skodras G, Kaldis S, Topis S, Koutsonikolas D, Grammelis P, Sakellaropoulos G. NH3
decomposition and simultaneous H 2 separation with a commercial Pd-Cu-Ag/V
membrane. In: Proceedings of the Second International Green Energy Conference June.
132
2006. p. 25–9.
37. Norby T. Solid-state protonic conductors: principles, properties, progress and prospects.
Solid State Ionics. 1999;125(1–4):1–11.
38. Iwahara H, Esaka T, Uchida H, Maeda N. Proton conduction in sintered oxides and its
application to steam electrolysis for hydrogen production. Solid State Ionics. 1981;3:359–
63.
39. Zhai Y, Ye C, Xiao J, Dai L. A microwave-induced solution-polymerization synthesis of
doped LaGaO3 powders. J Power Sources. 2006;163(1):316–22.
40. Nowick AS, Du Y, Liang KC. Some factors that determine proton conductivity in
nonstoichiometric complex perovskites. Solid State Ionics. 1999;125(1–4):303–11.
41. Giddey S, Badwal SPS, Kulkarni A. Review of electrochemical ammonia production
technologies and materials. Int J Hydrogen Energy. 2013;38(34):14576–94.
42. Kyriakou V, Garagounis I, Vasileiou E, Vourros A, Stoukides M. Progress in the
Electrochemical Synthesis of Ammonia. Catal Today.
43. Shipman MA, Symes MD. Recent progress towards the electrosynthesis of ammonia from
sustainable resources. Catal Today.
44. Muradov NZ, Veziroğlu TN. “Green” path from fossil-based to hydrogen economy: An
overview of carbon-neutral technologies. Int J Hydrogen Energy. 2008;33(23):6804–39.
45. Transportation of liquefied natural gas - Energy Education [Internet]. [cited 2017 Mar 23].
Available from:
http://energyeducation.ca/encyclopedia/Transportation_of_liquefied_natural_gas
46. Jefferies LLC. LNG & LPG Shipping Fundamentals. 2013.
47. WHOLESALE GAS PRICE SURVEY 2016 EDITION. 2016.
48. U.S. Department of Energy. Potential Roles of Ammonia in a Hydrogen Economy.
49. Resources / Nitrogen / Production Cost Profile and Operational Capability [Internet]. [cited
2017 Mar 25]. Available from:
http://www.potashcorp.com/overview/resources/nitrogen/production-cost-profile-
operational-capability#
50. Nutrients / Nitrogen / Overview / Nitrogen Production Cash Costs [Internet]. [cited 2017
Mar 25]. Available from:
http://www.potashcorp.com/overview/nutrients/nitrogen/overview/nitrogen-production-
cash-costs
51. Advantages / Nitrogen / US Midwest Delivered Ammonia Cost [Internet]. [cited 2017 Mar
25]. Available from: http://www.potashcorp.com/overview/advantages/nitrogen/us-
midwest-delivered-ammonia-cost
52. Alternative Fuels Data Center– Fuel Properties Comparison.
53. Barton R. Estimation of Costs of Heavy Vehicle Use Per Vehicle-Kilometre. 2006.
54. Johnson AP, LO CM, FARJO SF. Microwave-assisted bitumen extraction with vacuum-
assisted sediment filtration. Google Patents; 2016.
55. Bosisio RG, Cambon JL, Chavarie C, Klvana D. Exprimental Result on the Hesting of
Athabasca Tar Sand Samples with Microwave Power. J Microw Power. 1977 Jan
17;12(4):301–7.
56. Pringle FG. Microwave-based recovery of hydrocarbons and fossil fuels. Google Patents;
2009.
57. Renouf G, Scoular RJ, Soveran D. Treating Heavy Slop Oil With Variable Frequency
Microwaves. In: Canadian International Petroleum Conference. Petroleum Society of
133
Canada; 2003.
58. Process for the recovery of shale oil, heavy oil, kerogen or tar from their natural sources.
1981.
59. Mutyala S, Fairbridge C, Paré JRJ, Bélanger JMR, Ng S, Hawkins R. Microwave
applications to oil sands and petroleum: A review. Fuel Process Technol. 2010;91(2):127–
35.
60. Consultants P. SimaPro Life Cycle Analysis version 7.2 (software).
61. GREET 2016. IL 60439-4844 USA: Argonne National Laboratory; 2016.
62. Facts and FIGURES - Air Transport Action Group (ATAG) [Internet]. [cited 2017 Mar 25].
Available from: http://www.atag.org/facts-and-figures.html
63. Koroneos C, Dompros A, Roumbas G, Moussiopoulos N. Advantages of the use of
hydrogen fuel as compared to kerosene. Resour Conserv Recycl. 2005;44(2):99–113.
64. Contreras A, Yiğit S, Özay K, Veziroğlu TN. Hydrogen as aviation fuel: A comparison with
hydrocarbon fuels. Int J Hydrogen Energy. 1997;22(10–11):1053–60.
65. A Full Fuel-Cycle Analysis of Energy and Emissions Impacts of Transportation Fuels
Produced from Natural Gas.
66. Alternative Jet Fuels, Addendum 1 to Aviation Fuels Technical Review (FTR-3/A1).
67. Hileman JI, Stratton RW. Alternative jet fuel feasibility. Transp Policy. 2014;34:52–62.
68. Turner D, Xu H, Cracknell RF, Natarajan V, Chen X. Combustion performance of bio-
ethanol at various blend ratios in a gasoline direct injection engine. Fuel. 2011;90(5):1999–
2006.
69. Kong S-C. Combustion Efficiency and Exhaust Emissions of Ammonia Combustion in
Diesel Engines. In: 2008 Annual NH3 Fuel Conference. MINNEAPOLIS: NH3 Fuel
Association; 2008. p. SEPTEMBER 29-30.
70. Dincer I, Zamfirescu C. Apparatus for using ammonia as a sustainable fuel, refrigerant and
NOx reduction agent. Google Patents; 2012.
71. GREET 2015. IL 60439-4844 USA: Argonne National Laboratory; 2015.
72. Appl M. Ammonia: principles and industrial practice. Vch Verlagsgesellschaft Mbh; 1999.
73. Dincer I, Zamfirescu C. Ammonia as a Potential Substance. In: Sustainable Energy Systems
and Applications. Boston, MA: Springer US; 2011. p. 203–32.
74. Thomas G, Parks G. Potential roles of ammonia in a hydrogen economy: a study of issues
related to the use ammonia for on-board vehicular hydrogen storage. US Dep Energy.
2006;23.
75. Metkemeijer R, Achard P. Ammonia as a feedstock for a hydrogen fuel cell; reformer and
fuel cell behaviour. J Power Sources. 1994;49(1):271–82.
76. Yin SF, Xu BQ, Zhou XP, Au CT. A mini-review on ammonia decomposition catalysts for
on-site generation of hydrogen for fuel cell applications. Appl Catal A Gen. 2004;277(1):1–
9.
77. Chellappa AS, Fischer CM, Thomson WJ. Ammonia decomposition kinetics over Ni-Pt/Al
2 O 3 for PEM fuel cell applications. Appl Catal A Gen. 2002;227(1):231–40.
78. Roy SK, Ray N, Mukheriee D. Kinetics and mechanism of ammonia decomposition over
alumina supported nickel catalysts. Plan Dev Div. 1975;41:48.
79. Chorkendorff I, Niemantsverdriet JW. Concepts of modern catalysis and kinetics. John
Wiley & Sons; 2006.
80. Palaniappan R. Improving the efficiency of ammonia electrolysis for hydrogen production.
Ohio University; 2013.
134
81. Vitse F, Cooper M, Botte GG. On the use of ammonia electrolysis for hydrogen production.
J Power Sources. 2005;142(1):18–26.
82. Barbir F. PEM fuel cells : theory and practice. Academic Press; 2013. 518 p.
83. Barbir F. PEM electrolysis for production of hydrogen from renewable energy sources. Sol
Energy. 2005;78(5):661–9.
84. Boggs BK, Botte GG. On-board hydrogen storage and production: An application of
ammonia electrolysis. J Power Sources. 2009 Jul 15;192(2):573–81.
85. 1 Month Ruthenium Prices and Ruthenium Price Charts - InvestmentMine [Internet]. [cited
2017 Mar 22]. Available from: http://www.infomine.com/investment/metal-
prices/ruthenium/1-month/
86. DOE Technical Targets for Hydrogen Storage Systems for Material Handling Equipment |
Department of Energy [Internet]. [cited 2017 Mar 22]. Available from:
https://energy.gov/eere/fuelcells/doe-technical-targets-hydrogen-storage-systems-material-
handling-equipment
87. Satyapal S, Petrovic J, Read C, Thomas G, Ordaz G. The U.S. Department of Energy’s
National Hydrogen Storage Project: Progress towards meeting hydrogen-powered vehicle
requirements. Catal Today. 2007 Feb 28;120(3–4):246–56.
88. Dong B-X, Tian H, Wu Y-C, Bu F-Y, Liu W-L, Teng Y-L, et al. Improved electrolysis of
liquid ammonia for hydrogen generation via ammonium salt electrolyte and Pt/Rh/Ir
electrocatalysts. Int J Hydrogen Energy. 2016 Sep;41(33):14507–18.
89. Mulder FM. Electrolytic cell for the production of ammonia. Google Patents; 2016.
90. Tsatsaronis G. Thermoeconomic analysis and optimization of energy systems. Prog Energy
Combust Sci. 1993;19(3):227–57.
91. Dincer I, Zamfirescu C. Sustainable hydrogen production. 2016;494.
92. Bejan A, Tsatsaronis G (George), Moran MJ. Thermal design and optimization. Wiley;
1996. 542 p.
93. Lazzaretto A, Tsatsaronis G. SPECO: A systematic and general methodology for calculating
efficiencies and costs in thermal systems. Energy. 2006 Jul;31(8–9):1257–89.
94. DOE Hydrogen and Fuel Cells Program: DOE H2A Production Analysis [Internet]. H2A
Central Hydrogen Production Model, Version 3.1. [cited 2017 Jan 7]. Available from:
https://www.hydrogen.energy.gov/h2a_production.html
95. Comparison of Electricity Prices in Major North American Cities | Publications | Hydro-
Québec [Internet]. [cited 2017 Jan 7]. Available from:
http://www.hydroquebec.com/publications/en/corporate-documents/comparaison-
electricity-prices.html
96. Inflation Calculator | Find US Dollar’s Value from 1913-2017 [Internet]. [cited 2017 Mar
3]. Available from: http://www.usinflationcalculator.com/
97. Bartels J. A feasibility study of implementing an Ammonia Economy. Graduate Theses and
Dissertations. Iowa State University; 2008.
98. Morgan E. Techno-Economic Feasibility Study of Ammonia Plants Powered by Offshore
Wind. Dissertations. University of Massachusetts - Amherst; 2013.