mitigating drought: policy impact evaluation a case of ... · furthermore, the study revealed that...
TRANSCRIPT
Mitigating Drought: Policy Impact Evaluation A Case of Tigray Region, Ethiopia
Sara Abebe Asheber March, 2010
Mitigating Drought: Policy Impact Evaluation A Case of Tigray Region, Ethiopia
by
Sara Abebe Thesis submitted to the Faculty of Geo-information Science and Earth Observation, University Twente, in partial fulfilment of the requirements for the degree of Master of Science in Geo-information Science and Earth Observation, Specialisation: Governance and Spatial Information Management. Thesis Assessment Board Prof. Dr. Anne van der Veen (First Supervisor) Drs. Johan de Meijere (Second Supervisor)
INTERNATIONAL INSTITUTE FOR GEO-INFORMATION SCIENCE AND EARTH OBSERVATION
ENSCHEDE, THE NETHERLANDS

Disclaimer This document describes work undertaken as part of a programme of study at Faculty of Geo-information Science and Earth Observation of University Twnete. All views and opinions expressed therein remain the sole responsibility of the author, and do not necessarily represent those of the institute.
MITIGATING DROUGHT: POLICY IMPACT EVALUATION; A CASE OF TIGRAY REGION, ETHIOPIA
iv
Abstract
Recurrent cycle of drought is one of the greatest challenges facing the Ethiopian poor in general and the study region in particular. The complex nature of drought in the study region took the lives of people; entail loss of assets in the form of crops, livestock, and productive capital and threatened the lives of millions of people with starvation. Majority of the droughts had a drastic impact on agricultural out-put, with total crop failure and massive livestock deaths being recorded in many parts of the study region. Furthermore, the capacity of the rural poor to cope with drought has declined due the increase frequency and intensity of droughts.
Thus, this study looks on the effectiveness of government toward achieving the intended goals of reducing household vulnerability to the effects of recurrent cycle of drought; protect and improve household and community assets so as to prevent poor households from falling further towards destitution; rehabilitating the environment and breaking the cycle of dependence on food aid based on data collected from governmental bodies and field survey carried out in six Tabia’s of the Atsebi-Womberta and Enderta districts of the study region.
The findings of this study show that recurrent cycle of droughts have impacts on crop production, women health and education. Furthermore, the temporal analysis of vegetation change also showed that drought has a fundamental impact on vegetation. It is observed that there are encouraging activities carried out by the government to address causes and impacts of drought. It is also found that government’s interventions are effective solutions in mitigating the root causes of drought in the study region. The irrigation interventions are becoming a drought proofing strategy in the region. Furthermore, the study revealed that productive safety net programs are playing a significant positive impact in household and community asset creation, employment generation and thereby increasing household’s income.
The before-and-after assessment study based on remote sensing data further confirmed that there is positive changes in the vegetation cover over the past periods, which validates the effectiveness of government policy instruments put in place to rehabilitate the degraded environment. Besides, the findings of the probit regression show that government policy intervention has protected household distress sale of basic livestock to acquire food.
In general findings of the study reveal that considerable progress has been made throughout in improving the livelihoods of the rural poor. The overall findings of the result shows that governmental interventions carried out has been achieving its intended objectives and are effective in addressing causes and impacts of drought thereby improving the resilience of the poor.
Key Word: mitigation, drought, safety Net, and policy effectiveness

v
Acknowledgements Above all, I would like to thank the Almighty God without whose blessing, it would not have been possible all my wishes to come in to reality.
First and for most I would like to gratefully acknowledge the International Institute for Geo-Information Science and Earth Observations (ITC) that provided all financial support for my study in Netherland.
I am deeply indebted to my first supervisor Professor Anne van der Veen for his earnest guidance, critical comment; encouragement and timely suggestion that made this research a success. His support and advice makes me motivated and energetic all the way through this study. My deepest gratitude also goes to my second Supervisor and also GISM course coordinator, Drs Johan de Meijere. His kind support and encouragement give me strength right from the inception of the topic to the last minute of my research. Johan, I never forget your fatherly treatment, patience and dedication through out my study.
I am gratefully acknowledged to Atsebi-Womberta and Enderta district administration. I have no words to thank and appreciate the farmers of the two districts for their hospitality and patience to answer the questionnaire. My appreciation extends to those development agents who were most helpful and cooperative.
I would like to express my gratitude to my employer Sheba University College for their support and enthusiasm to study MSc in The Netherlands. I am grateful to acknowledge to all offices and personalities who give me data for my study: DPPC, BOARD, and Bureau of Finance and Economic development especially Ato Hayalu Mirutse to their support while collecting my data. My gratitude also goes to Helen for her support and taking care of my house on my absence.
I also wish to express my appreciation to all my class mates for their friendship, support, socialization and help each other in times of pressure and stress. Also am gratefully the entire Ethiopian fellow friends especially Ato Assefa Mulaw for his support and care.
I am very much grateful to my sisters and brothers; Mizer, Genet, Tsegu, Abel and Kalau for their love and care. Thank you Mizer, for your encouraging telephone calls consistently through out my study from Switzerland.
I would like to express my deepest appreciation to my beloved father Abebe and my mother Abadit. Their dedication, love to take care of my daughter enabled me to come for further studies. I lack words to express my feelings and appreciation for their generous support. I dedicate this work to my beloved daughter Delina. My daughter forgive me, I left you at the time you need love and care in the absence of parents. I love you Deli.
My sincere thanks also go to my mother-in-law Letay and my sisters’ in-law Ealzabeth and her husband Yohaness, and Hamelmal, for their love and care of my daughter in my absence.
Last but not least, I would like to thank my beloved husband Tagel Gebrehiwot for his love, encouragement, and for sharing all the difficulties with me. Dambuchey, this work would not have been complete without your enthusiastic support. This work is also dedicated to you with lots lots…….of love.
Sara Abebe

MITIGATING DROUGHT: POLICY IMPACT EVALUATION; A CASE OF TIGRAY REGION, ETHIOPIA
vi
Dedicated to
My beloved husband Tagel Gebrehiwot
&
Our beloved daughter Delina Tagel

vii
Table of contents 1. Background ...................................................................................................................................... 1
1.1. Introduction .............................................................................................................................. 1 1.2. Background and Justification to the Problem ........................................................................... 1 1.3. Problem Statement ................................................................................................................... 4
1.3.1. Justification of the Research ............................................................................................. 4 1.4. Research Objectives ................................................................................................................. 4
1.4.1. Main Objective ................................................................................................................. 4 1.4.2. Specific objectives ............................................................................................................ 4
1.5. Research Questions .................................................................................................................. 4 1.6. Conceptual Framework ............................................................................................................ 5 1.7. Research design ........................................................................................................................ 6 1.8. Thesies outline .......................................................................................................................... 7
2. Literature Review ............................................................................................................................. 8 2.1. Defining Droughts .................................................................................................................... 8
2.1.1. Meteorological drought .................................................................................................... 8 2.1.2. Agricultural drought ......................................................................................................... 8 2.1.3. Hydrological drought ....................................................................................................... 9 2.1.4. Socioeconomic drought .................................................................................................... 9
2.2. Drought management Strategy ............................................................................................... 10 2.3. Government Response to Mitigate impacts of drought .......................................................... 12 2.4. The role of social safety nets .................................................................................................. 13 2.5. Targeting mechanisms ............................................................................................................ 14
2.5.1. Approaches and Mechanisms of Targeting .................................................................... 14 2.5.2. Productive Safety net instruments .................................................................................. 16
2.6. Policy Impact Evaluation ....................................................................................................... 17 2.6.1. Before-after study ........................................................................................................... 17
2.7. Conclusion .............................................................................................................................. 18 3. Research Methodology ................................................................................................................... 19
3.1. The Research Techniques ....................................................................................................... 19 3.2. Selection of Study Area .......................................................................................................... 20 3.3. Sources of Data ...................................................................................................................... 21
3.3.1. Primary Data ................................................................................................................... 21 3.3.2. Secondary data ............................................................................................................... 22
3.4. Methods of Data Analysis ...................................................................................................... 23 3.4.1. Quantitative analysis ...................................................................................................... 25
3.5. Issues of Validity and Reliability ........................................................................................... 27 4. The Study Area ............................................................................................................................... 28
4.1. The Tigray National Regional State ....................................................................................... 28 4.2. Agro- ecological zones and climate ....................................................................................... 29 4.3. Land Use Pattern .................................................................................................................... 30 4.4. Demography and Socio-economic Settings of the Region ..................................................... 31 4.5. District Profile ........................................................................................................................ 32
4.5.1. Atsebi-Wemberta District ............................................................................................... 32 4.5.2. Enderta District ............................................................................................................... 33

MITIGATING DROUGHT: POLICY IMPACT EVALUATION; A CASE OF TIGRAY REGION, ETHIOPIA
viii
4.6. Conculusion ........................................................................................................................... 35 5. Drought Disasters and its Impacts in the Study Region ............................................................... 36
5.1. Impacts of Drought ................................................................................................................ 40 5.1.1. Impact of Drought on Agriculture ................................................................................. 40 5.1.2. Impact on Food Production ........................................................................................... 41 5.1.3. Impacts on Vegetation ................................................................................................... 42 5.1.4. Impacts on health ........................................................................................................... 45 5.1.5. Impacts on Education .................................................................................................... 45 5.1.6. Impacts on different sexes, age groups, and livelihoods ............................................... 45
5.2. Conclusion ............................................................................................................................. 45 6. Evaluation of Government Interventions in Addressing Causes and Impacts of drought ............. 47
6.1. Introduction ........................................................................................................................... 47 6.2. Policy Framework ................................................................................................................. 47
6.2.1. Mitigation Strategies...................................................................................................... 48 6.2.2. Ethiopia’s Productive Safety Net Program .................................................................... 48
6.3. The Productive Safety Net Program (PSNP) in Practice ...................................................... 50 6.3.1. Targeting ........................................................................................................................ 50 6.3.2. Public Works Intervention ............................................................................................. 50
6.4. Early warning System (EWS) ................................................................................................ 61 6.5. Conclusion ............................................................................................................................. 63
7. Household Opinions ...................................................................................................................... 64 7.1. Descriptive Results ................................................................................................................ 65
7.1.1. Education level of Household Head .............................................................................. 65 7.1.2. Farm Size and Land Holding ......................................................................................... 65 7.1.3. Rural Credit Services ..................................................................................................... 66 7.1.4. Access to Extension Services ........................................................................................ 67
7.2. Empirical Analysis ................................................................................................................ 68 7.2.1. Impact of productive safety net on Household Income ................................................. 68 7.2.2. Impact of water harvesting on Household Income and Production ............................... 70 7.2.3. Asset Protection and Creation ....................................................................................... 72 7.2.4. Effect of PSNP on Aid Dependency .............................................................................. 73 7.2.5. Copping Strategies to fill the food gap .......................................................................... 74 7.2.6. Does PSNP (Food for work) Prevent Distress Sales ..................................................... 74 7.2.7. Households Opinion on Early-warning systems............................................................ 76 7.2.8. Household opinion on Targeting ................................................................................... 76
7.3. Conclusion ............................................................................................................................. 77 8. Conclusion and Recommendation ................................................................................................. 78
8.1. Conclusions ........................................................................................................................... 78 8.2. Recommendation ................................................................................................................... 80 References: ........................................................................................................................................ 81 Appendix – Questionnaire employed for household interview ......................................................... 84

ix
List of figures
Figure 1: Conceptual Framework ............................................................................................................ 5 Figure 2: The research design .................................................................................................................. 6 Figure 3: Socio-economic and Environmental Impacts; Drought processes, factors, relationships and impacts, Source Wilhite and Glantz (1985). ............................................................................................ 9 Figure 4 Photo showing interview session ............................................................................................. 21 Figure 5: Methodological Framework .................................................................................................... 24 Figure 6 Administrative Map of Tigray ................................................................................................. 28 Figure 7: Agro-ecology based on rainfall, Source Bureau of Finance & Economic Development ....... 30 Figure 8: Map Atsebi-Wenberta District ............................................................................................... 32 Figure 9: Map Enderta District, study sites ............................................................................................ 34 Figure 10: Land Use Map, Source Bureau of Finance & Economic Development ............................... 35 Figure 11 Frequency of droughts in Tigray, 1970-2008, source: DPPC, 2009 ...................................... 37 Figure 12 Districts with spatially similar or dissimilar drought prone neighbourhoods ........................ 38 Figure 13 Scatter plot of drought frequency .......................................................................................... 38 Figure 14 Mean deviation of annual total rainfall, 1953-2008; source: NMSA, 2009 .......................... 39 Figure 15: Photo showing recurring crop failure due to severe droughts .............................................. 40 Figure 16 Normalized Difference Vegetation Index for a) 1986 and b) 2000 ....................................... 43 Figure 17 Difference in NDVI between 1986 and 2000 ........................................................................ 44 Figure 18: Spatial distribution of irrigation coverage across districts in Tigray in 2008 ....................... 51 Figure 19: Farmer fetching water from his plastic lined pond ............................................................... 52 Figure 20: Well-grown fruit in the home garden ................................................................................... 53 Figure 21: Trends in Crop production, 1997-2008 at the regional level ................................................ 54 Figure 22: Trends in Crop production, 1997-2008 in the study sites ..................................................... 55 Figure 23: Spatial distribution of change in food aid dependent population in Atsbi-Womberta district, within 2004-2008 ..... 55 Figure 24 Some of the catchments in the study area .............................................................................. 57 Figure 25: Reforestation site in the study site ........................................................................................ 58 Figure 26 NDVI of the area enclosure at 2000 and 2007 ....................................................................... 59 Figure 27 Vegetation change .................................................................................................................. 60 Figure 28: EWS at the study region ....................................................................................................... 62 Figure 29: Food gap situations, source: field survey, 2009 .................................................................... 73

MITIGATING DROUGHT: POLICY IMPACT EVALUATION; A CASE OF TIGRAY REGION, ETHIOPIA
x
List of tables
Table 1: Names of the Tabias selected .................................................................................................. 20 Table 2: Secondary Data collected ........................................................................................................ 23 Table 3 Agro-ecological zonation classes and their area coverage ....................................................... 29 Table 4: Land use pattern in Tigray, Source Community survey (1998) .............................................. 30 Table 5 Disaster Events in Ethiopia, 1970–2008 .................................................................................. 36 Table 6 Estimates of 2001 and 2002 Area, production and yield of major crops for farm holdings in Tigray (Meher Season) .......................................................................................................................... 42 Table 7 Water harvesting structures constructed in the two woredas.................................................... 52 Table 8 Results of vegetation change analysis ...................................................................................... 59 Table 9: Educational characteristics of the sampled households ........................................................... 65 Table 10: Household land holding size (in Hectare) ............................................................................. 66 Table 11 Beneficiaries of credit service among the sampled households ............................................. 67 Table 12 Participation of farmers in the application of modern farm inputs, by Tabia ......................... 68 Table 13 Household before and after inclusion in PSNP ...................................................................... 69 Table 14 Mean summary income of sample households after PSNP .................................................... 70 Table 15 Test for equality of mean of households included and not included in Safety net program .. 70 Table 16 Test for equality of mean of HHs with access to irrigation scheme and without ................... 71 Table 17 Livestock possession of the sample households ..................................................................... 72 Table 18 Probit estimate on distress sale of livestock in 2005/06 ......................................................... 75 Table 19 Opinions of studied households on program targeting ........................................................... 77
xi
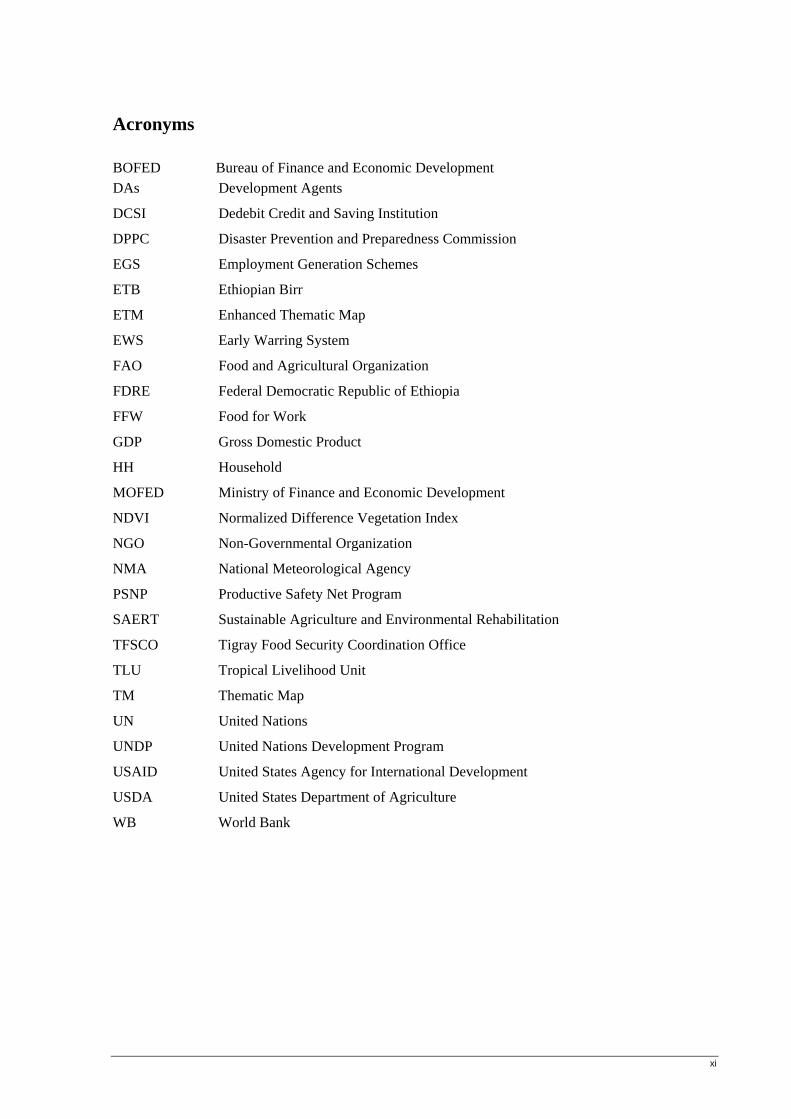
Acronyms BOFED Bureau of Finance and Economic Development DAs Development Agents
DCSI Dedebit Credit and Saving Institution
DPPC Disaster Prevention and Preparedness Commission
EGS Employment Generation Schemes
ETB Ethiopian Birr
ETM Enhanced Thematic Map
EWS Early Warring System
FAO Food and Agricultural Organization
FDRE Federal Democratic Republic of Ethiopia
FFW Food for Work
GDP Gross Domestic Product
HH Household
MOFED Ministry of Finance and Economic Development
NDVI Normalized Difference Vegetation Index
NGO Non-Governmental Organization
NMA National Meteorological Agency
PSNP Productive Safety Net Program
SAERT Sustainable Agriculture and Environmental Rehabilitation
TFSCO Tigray Food Security Coordination Office
TLU Tropical Livelihood Unit
TM Thematic Map
UN United Nations
UNDP United Nations Development Program
USAID United States Agency for International Development
USDA United States Department of Agriculture
WB World Bank
1
1. Background 1.1. Introduction Most of the countries in Africa are regularly affected by severe and often multi-year droughts. However, all areas within Africa are not equally vulnerable to drought. The sub-Saharan part of the region is considered to be the most drought-prone. This region is relatively drier, receiving much lower rainfall compared with the rest of the region.
Ethiopia is one of the sub-Sahara African countries highly prone to hazards. Different hazards have been recorded in Ethiopia. However, drought has remained the leading cause of disaster and human suffering in Ethiopia in terms of frequency, area coverage and the number of people affected. The history of drought in Ethiopia goes back to 250 BC and there had been many national and localized droughts even before that of the 1970s for which international support was sought for the first time, which were managed mainly by communities’ own coping mechanisms. However, the magnitude, frequency and the effects of the droughts have increased since mid 70s. The severity and persistence of the latest droughts has produced a wide range of impacts across the country. Agricultural production has been severely affected and there has been a significant reduction in livestock populations that are the mainstay of subsistence livelihoods. Large population movements due to drought have aggravated and compounded these miseries for communities, often with disproportionate impacts across the country.
As a result, Disaster Prevention and Preparedness Commission were established in 1993 to manage the effects of drought in the country. Since then, the primary focus of disaster management has been to avert drought-induced famine. The main theme of the National Policy on Disaster Prevention and Management that was ratified in 1993 and modified in 2004 has been focussed around drought and food insecurity. Accordingly different governmental interventions were made in the past years to address the root causes of drought and thereby reduce impacts of drought on the rural poor.
This research attempted at analysing the effect of government interventions in saving human lives and their livelihoods; protecting the quality of life in the affected areas from deteriorating on the account of drought disaster; in enhancing people’s resilience; ensuring best use of natural resources endowment; and overcoming the root causes of vulnerability to disaster and promoting sustainable development in the longer-term.
1.2. Background and Justification to the Problem Drought has no universally accepted definition. Drought has been developed to define drought, which may be classified in terms of meteorological, hydrological, agricultural and socio-economic conditions (Heim 2002). From the metrological point of view drought is defined as the period of rainfall significantly less than the long-term or some designated percentage thereof, or less than some fixed value. Hydrological drought is refers to a rainfall deficit capable of seriously reducing runoff, stream flow and recharge of ground water. Agricultural drought links impacts of meteorological drought to agriculture, focusing on precipitation shortages or crop failure. Socio-economic drought occurs when the demand for an economic good exceeds supply as a result of a weather-related shortfall in water supply (Whitmore 2000). In easier to understand terms, drought can be defined as a period of

MITIGATING DROUGHT: POLICY IMPACT EVALUATION; A CASE OF TIGRAY REGION, ETHIOPIA
2
abnormally dry weather sufficiently prolonged for the lack of precipitation to cause a serious hydrological imbalance.
Drought affects virtually all climatic regions, but their characteristics vary significantly from region to region. More than one half of the earth is susceptible to drought each year (Kogan 1990). Historically many of the drought-induced food emergencies in the world occurred in Africa. Since 1900 to the present, more than half or 57 percent of the world drought events recorded by the Centre for Research on the Epidemiology of Disasters in the EM-DAT have occurred in Africa (Minamiguchi 2005). However, all areas within Africa are not equally vulnerable to drought. The sub-Saharan part of the region is considered to be the most drought-prone. This region is relatively drier, receiving much lower rainfall compared with the rest of the region.
Ethiopia is one of the sub-Sahara African countries highly prone to drought. Ethiopia has experienced a number of severe droughts and a prolonged civil war, resulting in countless deaths and maiming, as well as the displacement of many communities. Drought is the most significant and recurrent climate-related hazard affecting the country. The country has experienced seven major droughts, six of which resulted in famine since 1980s, along with literally dozens of local droughts (Glantz 1996). The first well documented drought and famine crisis in Ethiopia happened in the years 1973-1975, which since then appears to repeat in less than a decade cycle. According to reports to date about drought, there were about 45 major drought episodes over the past nine centuries. Between the Great Famine and the 1970s there have been many national and localized droughts and at least 20 major drought years were noted affecting most parts of the country, particularly Tigray and Wollo (Glantz 1996). Most droughts lasted for one year or less except the 1066-1072, 1454-1458, 1543-1562, and 1888-1892 famine years which persisted for over 4 years.
The droughts of the last decades in Ethiopia have produced a complex web of impacts, which spans many sectors of the economy, especially the agriculture sector where agriculture is the largest sector of the economy, Agriculture accounts for 46% of its GDP and 90% of its export earnings and employs 85% of the country’s labour force and 70% of the raw material requirement of ago-based domestic industries(UNDP 2002). It is also the major source of food for the population and hence the prime contributing sector to food security. In addition agriculture is expected to play a key role in generating surplus capital to speed up the overall socio-economic development of the country.
By the year 1984-1985 droughts took the lives of an estimated one million people, destroyed crops, contributed to the death of animals, and threatened the lives of millions of people with starvation. Especially, the current drought in the years 2002-2003 with a total number of 13.5 million potentially affected populations, showed once more, the magnitude and the proportion of the problem which the country is facing (ECA 2005). Ethiopia has mainly dry sub-humid, semi-arid and arid regions, all of which are prone to desertification and drought. The country has a long history of recurring drought; however, since the 1970s, the magnitude, frequency, and impacts of droughts have become more severe (Margaret 2003). According to a United States Agency for International Development (USAID) study, the frequency of nationwide droughts causing severe food shortage increased from once every 10 years in the 1970s and 1980s, to every two-three years now (Margaret 2003). The spatial distribution and the frequency of its occurrence have also increased with different level of intensity, bringing significant water shortages, economic losses and adverse social consequences.
The increasing trend of drought-induced disaster, associated with other hazards, is reflected in the increasing number of people needing food assistance in Ethiopia. Between 1990 and 2005, on average each year 6.3 million people required food assistance amounting to over 654,000 tonnes annually. The

3
number of people affected is particularly significant in Tigray where on average more than 1.2 million people are affected annually. Tigray is one of the regions repeatedly affected by recurrent drought famine and food security problems in the country. Many people live in conditions of chronic hunger with a low average energy supply (Devereux 2000). The economy is predominantly agrarian where 52 percent of the GDP is contributed by the agricultural sector and 85 percent of the population depends on agriculture for their subsistence (BOFED 2004). Thus, frequent and severe droughts cause serious decreases in the incomes of rural inhabitants who tend to rely heavily on agriculture.
To reverse the impacts of recurrent drought on the lives, livelihoods and the national economy, the Government of Ethiopia has developed different strategies that focus on reducing vulnerabilities and disaster risks as well as providing early response when disaster does strike. One of the many policies is the Government's National Policy on Disaster Prevention and Management which sets out policy guidelines for implementing disaster prevention, preparedness and mitigation activities and thereby address the root causes that make people prone to drought and contribute to sustainable development (Transitional Government of Ethiopia 1993). Thus, the productive safety net program (PSNP) was developed in 2005 as an important policy tool to address the recurrent impacts of drought and thereby increase resilience.
The main objective of the program is to address the many problems faced by the large majority of Ethiopians and reduce the high vulnerability of the population to the effects of disaster mainly drought. One of the main departures of this new direction is the provide relief in ways that will support recovery and long term development through employment generation on development activities such as soil and water conservation, rural road building and other efforts to build community assets; provide employment based safety net programmes and seek improved coordination and management of relief resources assistance. A key element of this policy paper is the use of relief food to the attainment of long-term development objectives (use of relief as development tools) and the directives form the link between relief operations and rehabilitation/development. It is at the household and community level that the government is placing the main emphasis of its disaster prevention and mitigation programme. Interventions include employment generation schemes, the improvement of agricultural extension services and providing better access to improved varieties of seed, tools and farming technologies. Different interventions such as measures from water harvesting and water supply augmentation to awareness campaigns, emergency responses and drought contingency plans have been carried out to mitigate drought impacts and thereby reduce its long-term impacts. Furthermore, the strategy also envisages environmental protection, assistance with the diversification of income-earning opportunities and interventions designed to improve health and nutrition.
Accordingly the regional government has adopted an integrated policy for drought management within the framework of the national policy to enhance and protect the livelihood position of the rural people. Thus, different government interventions related to employment generation, household and community asset building, environmental rehabilitation activities and measures that increase water use efficiency have been carried out over the last years under the productive safety net program. However, little is known about the effect of these policy interventions in changing the livelihoods of the drought affected population in the study region. Thus it is compelling to study the impacts of the policy in order to provide the much needed information to the stakeholders about developments in the policy, which can form the basis for government policy interventions and program design.

MITIGATING DROUGHT: POLICY IMPACT EVALUATION; A CASE OF TIGRAY REGION, ETHIOPIA
4
1.3. Problem Statement Different government interventions have been carried out in the last five years to address the root causes that make people prone to drought and thereby increase the livelihood positions of the rural poor. However, little is know about the potential effect of the policy tools in changing rural livelihood in the study area. Therefore, the proposed research aims to address this gap in knowledge.
1.3.1. Justification of the Research The above mentioned problems are general to developing countries and findings of this research will contribute to the application of policy design and analysis in policy evaluation which is one of the new research spearhead of ITC. Despite its usefulness, critical evaluation of policy effectiveness is not carried out in majority of the developing countries like Ethiopia in general and in the study region in particular. Therefore, it is in this respect that the researcher intends to carry out a study so as to evaluate the effectiveness of government polices in enhancing and protecting rural livelihoods.
While the datasets and findings of the research is particular to the study area, the evaluation of policy effectiveness approach as well as the results of this study will be largely generic and can be applied elsewhere.
1.4. Research Objectives
1.4.1. Main Objective
The main research objective of the study is to analyse the effect of government drought mitigation policy instruments in protecting rural livelihoods and thereby creating drought resilient communities in the study area.
1.4.2. Specific objectives
1. To assess the impacts of drought and review the indigenous coping mechanisms in the study area.
2. To analyze and evaluate the effectiveness of government interventions in enhancing and protecting rural livelihoods.
1.5. Research Questions
Question for sub-objective 1
What are the underlying causes of drought in the study area?
What are the impacts of drought on crop production, human, livestock, and health? Can the drought impact be determined using remotely sensed data, Normalized Difference Vegetation Index (NDVI), from satellite imagery?
What coping mechanisms are used by the rural households to mitigate the impact of drought?

5
Question for sub-objective 2
What are the policy instruments introduced to mitigate impacts of drought?
To what degrees are regional policies/programs able to reduce impacts of drought and enhance rural livelihoods?
Do key impacts of policy instruments vary across different districts?
What is rural household’s response on the policy?
Are the changes in household livelihood explained by the policy?
Can some of the policy instrument be validated using Remote Sensing data?
1.6. Conceptual Framework
Figure 1: Conceptual Framework

MITIGATING DROUGHT: POLICY IMPACT EVALUATION; A CASE OF TIGRAY REGION, ETHIOPIA
6
1.7. Research design The research is initiated with a literature review in relation to the objective. The review is carried out with the purpose of establishing a theoretical framework to more fully understand the concept of drought, mitigation strategies and the principles and criteria’ used to assess the effectiveness of drought management policy. The process of the research approach is illustrated in Figure 2 below.
Phase one is the development of the research proposal which includes the formulation of research objectives and associated research questions and developing assessment criteria’s for the policy so as to achieve the research objectives. The pre/field work phase was focused on developing criteria’s for the selection of the study area and identifies the required data to carry out the research. In the third phase, the data collected on the existing development was analysed against the intended goals. The process of the research approach is illustrated in the figure below.
Theoretical framework including assessment criteria
Evaluation of government policy
Governmentinterventions
Effect of policy on rural
livelihoods
Analysis
Government Goal attainment
. Trend analysis Rural livelihoods situation & opinions
Evaluation of policy effectiveness
Conclusion and Recommendations
Vegetation change analysis
Government interventions
Figure 2: The research design

7
1.8. Thesies outline
This thesis report consists of eight chapters. The content of each chapter is organized as follows.
The first chapter contains introduction, background and justification of the problem, the problem statement, objectives of the study, research questions, conceptual framework and the research design.
The second chapter deals with scientific literature reviews relevant to the study. It includes the concept of drought, drought mitigation instruments, the role of productive safety nets, and approaches and mechanisms of targeting, and policy impact evaluation.
The third chapter presents a detailed account to the methods adopted to accomplish the research task, including the research techniques, the selection of study area, sources of data and acquisition methods, method of data analysis and issues of reliability and validity of the research outcome.
Chapter four presents a brief introduction of the study area. It provides the physical features, resource bases, demographic characteristics and socio-economic standards of Tigray Regional State including a district profile.
Chapter five, six and seven presents the main finding of the research. Chapter five presents the insights into the underlying causes of drought and its impact in the region while chapter six discusses the different government policy interventions carried out to address root problems of drought and their impact on the livelihood of rural household’s. Chapter seven discusses the results of household survey on household opinions on government policy interventions.
Chapter eight concludes by presenting the issues discussed in this paper as well as by providing recommendations for further improvement.

MITIGATING DROUGHT: POLICY IMPACT EVALUATION; A CASE OF TIGRAY REGION, ETHIOPIA
8
2. Literature Review 2.1. Defining Droughts Drought occurs in virtually all climatic zones, but its characteristics vary significantly from one region to another and its definition varies from region to region and may depend upon the dominating perception, and the task for which it is defined. It originates from a deficiency of precipitation over an extended period of time, usually a season or more. It should generally be defined relative to some long-term average condition in a particular area, a condition often perceived as “normal”. It is also related to the timing (i.e., principal season of occurrence, delays in the start of the rainy season, occurrence of rains in relation to principal crop growth stages) and the effectiveness (i.e., rainfall intensity, number of rainfall events) of the rains. Other climatic factors such as high temperature, high wind, and low relative humidity are often associated with it in many regions of the world and can significantly aggravate its severity. Drought is a temporary deviation; it differs from aridity, which is restricted to low rainfall regions and is a permanent feature of climate.
US National Drought Mitigation Centre (2003) differentiates between conceptual and operational definitions of drought. Conceptual definitions are normally formulated in general terms, do not provide quantitative answers to “when”, “how long” or “how severe” a drought is and are often used as a start-up in scientific papers and reports to help people understand the concept of drought. Operational definitions identify the beginning, end, spatial extent and severity of a drought. They are often region specific and are based on scientific reasoning, which follows the analysis of certain amounts of hydro-meteorological information. They are beneficial in developing drought policies, monitoring systems, mitigation strategies and preparedness plans. Operational definitions are formulated in terms of drought indices. The severity of a drought can be measured climatically, socially, and economically. Droughts affect individuals in different ways. Similar definitions of drought categories are given by Wilhite and Glantz (1985).
Another classification, based on a disciplinary perspective, can be found in Dracup et al. (1980), where droughts are related to precipitation (meteorological), streamflow (hydrological), soil moisture (agricultural) or any combination of the three. A similar classification can be found in Wilhite and Glantz (1985), where four categories are identified: meteorological drought, agricultural drought, hydrological drought, and socio-economic drought. The first three groups could be defined as environmental indicators, the last group as a water resources indicator.
2.1.1. Meteorological drought Meteorological drought is defined usually on the basis of the degree of dryness (in comparison to some “normal” or average amount) and the duration of the dry period. Definition of meteorological drought must be considered as region specific since the atmospheric conditions that result in deficiencies of precipitation are highly variable from region to region.
2.1.2. Agricultural drought Agricultural drought links various characteristics of meteorological (or hydrological) drought to agricultural impacts, focusing on precipitation shortages, differences between actual and potential evapotranspiration, soil water deficits, and so forth. A good definition of agricultural drought should
9
be able to account for the variable susceptibility of crops during different stages of crop development, from emergence to maturity.
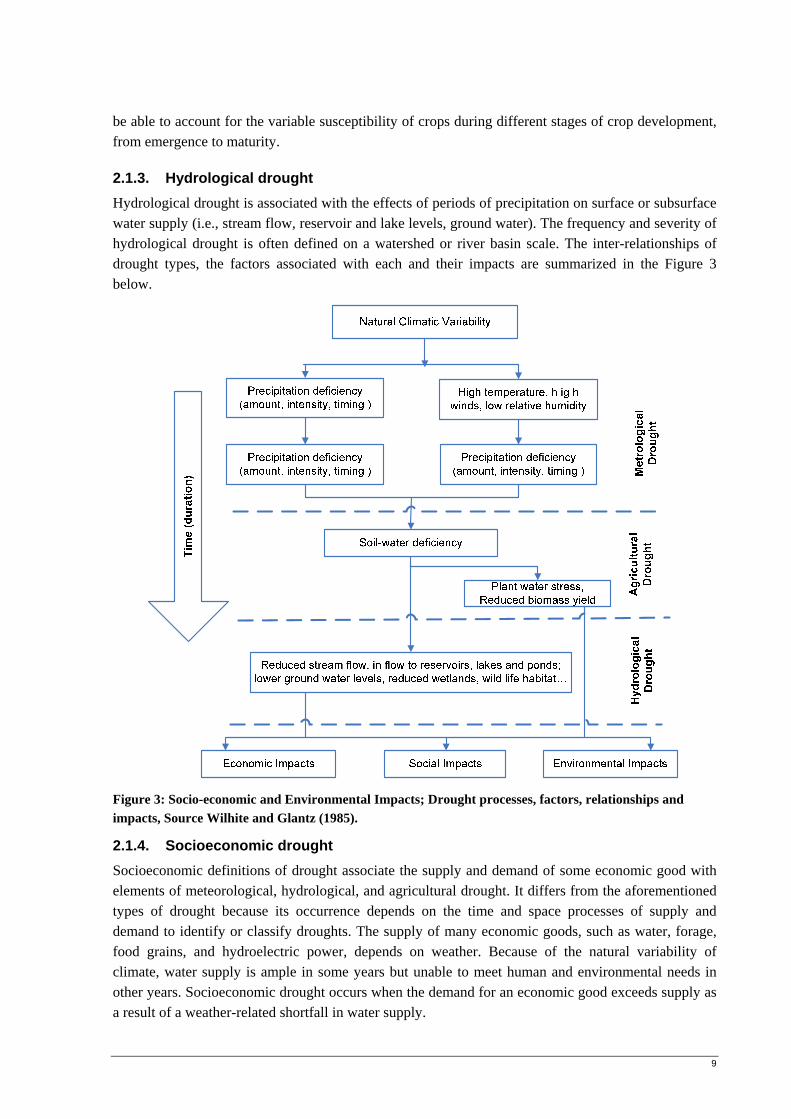
2.1.3. Hydrological drought Hydrological drought is associated with the effects of periods of precipitation on surface or subsurface water supply (i.e., stream flow, reservoir and lake levels, ground water). The frequency and severity of hydrological drought is often defined on a watershed or river basin scale. The inter-relationships of drought types, the factors associated with each and their impacts are summarized in the Figure 3 below.
Figure 3: Socio-economic and Environmental Impacts; Drought processes, factors, relationships and impacts, Source Wilhite and Glantz (1985).
2.1.4. Socioeconomic drought Socioeconomic definitions of drought associate the supply and demand of some economic good with elements of meteorological, hydrological, and agricultural drought. It differs from the aforementioned types of drought because its occurrence depends on the time and space processes of supply and demand to identify or classify droughts. The supply of many economic goods, such as water, forage, food grains, and hydroelectric power, depends on weather. Because of the natural variability of climate, water supply is ample in some years but unable to meet human and environmental needs in other years. Socioeconomic drought occurs when the demand for an economic good exceeds supply as a result of a weather-related shortfall in water supply.

MITIGATING DROUGHT: POLICY IMPACT EVALUATION; A CASE OF TIGRAY REGION, ETHIOPIA
10
In general, drought has no universally accepted definition. Drought has been developed to define drought, which may be classified in terms of meteorological, hydrological, agricultural and socio-economic conditions (Heim 2002). In easier to understand terms, drought can be defined as a period of abnormally dry weather sufficiently prolonged for the lack of precipitation to cause a serious hydrological imbalance.
2.2. Drought management Strategy Drought, unlike other natural disasters such as floods or earthquakes, does not occur abruptly, but it evolves over a long period of time (Roossi 2003). Such feature makes possible an effective mitigation of drought impacts, if a timely and reliable drought monitoring system is in operation (Cancelliere, Mauro et al. 2007) and an appropriate plan, including the necessary actions to reduce the most severe damages caused by drought (in economic, social and environmental terms), has been prepared (Roossi 2003).
Drought management is a process of reducing and managing the impact of drought in order to prevent it turning into a famine (Carney 1998). “Management” is generally defined as “the coordination of organized effort to attain specific goals or objectives”. In emergency or disaster management, the term means “an organized effort to mitigate against, prepare for, respond to, and recover from disaster”. Drought management has four main elements namely; Preparedness, Mitigation, Relief and Reconstruction.
• Preparedness - This concept implies “planning how to respond in case a drought occurs and working to increase resources available to respond effectively”. The rationale behind this arrangement is to save lives and minimize damage by preparing people to respond appropriately when a drought is imminent.
• Mitigation – These are activities which eliminate or reduce the chances of occurrence or effects of a drought. This approach is based on the idea that much can be done to prevent droughts from happening or reduce their impact.
• Relief - The concept applies to “activities that occur during and immediately following a drought”. Through proper response, emergency assistance to victims of the drought is provided.
• Reconstruction – This continues until all systems return to or are near normal. Short-term recovery returns vital life support systems to minimum operating standards. Long-term recovery may go on for years until the entire drought affected area is completely restored.
All these elements of disaster management are closely inter-linked with development. Effective planning must consider the relationship between disasters and development to avoid set backs. Disaster prevention, preparedness and recovery programmes provide significant opportunities to initiate long-term development programmes which reduce vulnerability to droughts.
The traditional approach to drought management has been reactive, relying largely on crisis management. This approach has been ineffective because response is untimely, poorly coordinated, and poorly targeted to drought stricken groups or areas (Wilhite 1997). In addition, drought response is post-impact and relief tends to reinforce existing resource management methods that quite often have increased societal vulnerability to drought.

11
The new strategy emphasizes a shift from Crisis Management to Risk Management (Wilhite 1997). It is a holistic approach to drought management involving forecasting, prevention, mitigation and preparedness in pre-drought phase along with the policy practiced so far of post-drought measures of relief and rehabilitation under crisis management. This strategy involves extensive scientific and technological inputs for data collection, analysis, modelling and forecasting drought.
Drought is a complex natural phenomenon and should be approached from a multidimensional and multidisciplinary perspective (IWMI 2004). Drought need to be viewed as long term development issue, and as such it is important to recognize that droughts require a multi-sectoral response, involving agriculture and rural development, and environmental and water resource management (Gautam 2006).
Drought preparedness plans promote a more preventive, risk management approach to drought management. They reduce vulnerability to drought and dependence on emergency assistance from governments and international organizations. The process of developing a plan identifies vulnerable areas, population groups, and economic and environmental sectors. Ultimately, preparedness plans will improve coordination within and between levels of government; procedures for monitoring, assessing, and responding to water shortages; information flow to primary users; and efficiency of resource allocation. The goals of these plans are to reduce water shortage impacts, personal hardships, and conflicts between water and other natural resource users. To be successful, drought preparedness plans must be integrated between levels of government and with other national plans or strategies, such as those to ensure food security and creates drought resilient society.
Drought preparedness plans contain three critical components: (1) a comprehensive early warning system; (2) risk and impact assessment procedures; and (3) mitigation and response strategies. These components complement one another and represent an integrated institutional approach that addresses both short- and long-term management and mitigation issues.
A drought early warning system is designed to identify climate and water supply trends and thus to detect the emergence or probability of occurrence and the likely severity of drought. This information can reduce impacts if delivered to decision makers in a timely and appropriate format and if mitigation measures and preparedness plans are in place (Pereira, Cordery et al. 2009). Besides, understanding the underlying causes of vulnerability is also an essential component of drought management because the ultimate goal is to reduce risk for a particular location and for a specific group of people or economic sector.
In agriculture, development of data bases information and communication technologies and communication pathway between farmers and grower associations and even extension services can greatly assist in timely adaptation on non-routine measures to cope with drought (Wilhite and Pulwarty 2005). Short time drought predication is important for warning farmers about the probable initiation or establishment of drought, about its continuation or its probable termination in a few months. This information may help them to make decision to cope with that predicted situation. Short time drought prediction may also be used to alter policy makers about the need to enforce appropriate preparedness measure before a drought is effectively installed, or to prepare for a post-drought period (Wilhite and Pulwarty 2005).
To cope with droughts require preparatory measures, contingency plans that support the timely implementation of mitigation measures and the forecast impacts which are likely to be experienced once the drought becomes established and evolves. This implies risk-based drought policies and
MITIGATING DROUGHT: POLICY IMPACT EVALUATION; A CASE OF TIGRAY REGION, ETHIOPIA
12
effective monitoring and early warning systems. However, this is only possible for a society that has strong institutions and where public participation forces policy-makers to adopt drought risk policies and make the society resilient to drought (Wilhite and Buchanan-Smith 2005). In drought resilient societies, where drought risk management could be adopted, where awareness is appropriate for timely implementing of mitigation measures, there is the need for a proactive approach. This consists of planning during the no-drought period, implementation during drought and monitoring and evaluation during and after the drought event.
In general, all the three components complement one another and represent an integrated institutional approach that addresses both short and long-term drought management. In particular, the key issue for implementing an efficient drought management strategy consists in identifying in advance measures to mitigate drought impacts on the water supply systems, the productive sectors and the environment. To this end, the formulation of guidelines for the definition of drought mitigation measures and for their appropriate use, in relation to the different drought conditions, can be extremely helpful.
2.3. Government Response to Mitigate impacts of drought Natural and human-made disasters have been experienced throughout history. In the last three decades, however, both the frequency of their occurrence and the losses associated with them has increased. The incidence and magnitude of disasters today is widely recognized as posing a serious threat to the survival, dignity and livelihoods of countless individuals, particularly the poor.
Ethiopia is vulnerable to disasters caused by drought, earthquake, flood, war and conflict, human and livestock diseases, pests, and wildfire amongst others. These different hazards occur with varying frequency and severity. Some result in nationwide disasters, while the impacts of others are more localized. However, hydro-meteorological hazard, particularly drought has remained the leading cause of disaster and human suffering in Ethiopia in terms of frequency, area coverage and the number of people affected. Although drought is a natural phenomenon that occurs in many countries, it does not necessarily lead to disaster by itself. It usually develops into disaster only in vulnerable societies. Ethiopia is one of the poorest countries in the world and therefore vulnerable to shocks. Under the Ethiopian context drought is more or less synonymous with disaster.
The capacity to cope with drought has declined because of the increasing human and livestock population pressure resulting in serious natural resources degradation. Though drought can be assumed as a natural disaster, land degradation has made Ethiopia vulnerable to drought and famine. Since the 1983-1984 famine, the policy response to this threat has been a series of adhoc emergency appeals on a near annual basis for food aid and other forms of emergency assistance which are then delivered either as payment for public works or as a direct transfer. While these measures succeeded in averting mass starvation, especially among those with no assets, they did not banish the threat of further famine, nor did they prevent asset depletion by marginally poor households affected by recurrent droughts. As a result, the number of individuals in need of emergency food assistance rose from approximately 2.1 million people in 1996 to 13.2 million in 2003 before falling back to 7.1 million in 2004 (World Bank 2004).
The high proportions of households that receive emergency food aid are “chronically food insecure” – they face predictable annual food deficits caused by agricultural production constraints and poverty. These the people are also exposed to recurrent shocks, usually triggered by drought, that raise their vulnerability further, by forcing them to dispose of their assets to survive. This results in a gradual deterioration of their food security status over time, which decades of large-scale food aid deliveries

13
have done little to prevent. Instead, dependency on food aid has steadily increased over time, as has the number of chronically food insecure Ethiopians. Further, the ad hoc nature of emergency appeals meant that the provision of emergency assistance—often in the form of food-for-work programs—was not integrated into ongoing economic development activities (Subbarao and Smith 2003).
Recognising this dilemma, in 2003 the Government of Ethiopia initiated a Productive Safety Net Programme (PSNP), with the objectives of reducing household vulnerability to the effects of disaster mainly drought, improving household and community resilience to shocks, and breaking the cycle of dependence on food aid. The overarching principle of the Productive Safety Net Programme is to facilitate “a gradual shift away from a system dominated by emergency humanitarian aid to productive safety net system resources via multi-year framework” (Government of Ethiopia 2004).
One of the main departures of this new direction is the provision of relief in ways that will support recovery and long term development through employment generation on development activities such as soil and water conservation, rural road building and other efforts to build community assets; provide employment based safety net programmes and protect household assets so as to prevent poor households from falling further towards destitution, vulnerability to future shocks particularly drought and chronic dependence on external assistance. The Productive Safety Net Program has two components:
o Public Works – provision of counter-cyclical employment on rural infrastructure projects such as road construction and maintenance, small-scale irrigation and reforestation;
o Direct Support – provision of direct unconditional transfers of cash or food to vulnerable households with no able-bodied members who can participate in public works projects.
The PSNP is complemented by a series of activities, such as productivity-enhancing transfers or services, including access to credit, agricultural extension services, technology transfer (such as advice on food crop production, cash cropping, livestock production, and soil and water conservation), and irrigation and water harvesting schemes. The PSNP is designed to protect existing assets, ensure a minimum level of food consumption, and encourage households to increase income generated from agricultural activities and to build up assets.
2.4. The role of social safety nets In this section an overview of safety nets in the context of social protection strategies, the mechanisms that protect those at risk on the lowest quartile in income profile, the modalities for identifying intended beneficiaries are examined.
Policymakers, academics and practitioners often equate welfare, social security, safety nets, social assistance or social insurance mechanisms to social protection. Many of these terms have overlapping meanings, and all form components of social protection strategies, but individually they do not equate to social protection. Social protection is the overarching policy framework that ensures cohesion among the various components, and the World Bank’s social protection sector strategy have clearly shown the need to move beyond mere transfers towards comprehensive forward-looking policies (Devereux 2003).
Social safety nets can serve an important role in alleviating poverty and in promoting long-term growth by providing households with the protection that markets and informal networks may not supply. A social safety net may redistribute resources toward disadvantaged groups, or sustain political coalitions to support critical structural reforms. Safety nets are a key pillar of social protection

MITIGATING DROUGHT: POLICY IMPACT EVALUATION; A CASE OF TIGRAY REGION, ETHIOPIA
14
strategies. Safety nets comprise both social assistance and social insurance functions (Haddad and Zeller 1996). The social assistance function is designed to bring households up to some minimum standard of living. This is the element of social protection most geared towards a government fulfilling its obligations under human rights considerations. Social insurance on the other hand provides a minimum floor to household income levels. It ensures that in the event that a shock such as drought occurs a household is assured of a certain level of wellbeing.
Safety nets need to be in place before a shock occurs, particularly from a social insurance perspective. The delivery instrument can be cash, in kind, with the most common in-kind instrument being food, or increasingly a hybrid with the transfer given in cash or near cash but conditional on certain activities.
2.5. Targeting mechanisms Safety net programmes are intended to protect the poorest citizens in society or those who, as a result of a shock, find themselves temporarily below a given welfare level. This implies that the programmes need to identify the right beneficiaries. In social safety net, social protection, or poverty reduction programs, targeting issues are frequently among the most difficult problems to deal with during the implementation of such programs. Nevertheless, targeting is almost always a prominent feature of the designs of such programs because the potential benefits of effective targeting are considerable. Targeting can concentrate expenditures allocated to the programs on those who need them most, hence it can save money and improve program efficiency (Hoddinott 1999). In addition, given the budgetary and time constraints facing program implementers, it is highly desirable that expenditures on social sectors are fine-tuned and well-targeted.
While targeting has large potential benefits, it also always entails costs. The costs include the administrative costs of identifying, reaching, and monitoring potential beneficiaries. In addition, there are potential additional costs in the forms of disincentive costs, stigma costs, and political economy costs (Subbarao, Bonnerjee et al. 1997). Disincentive costs are possible economic losses due to disincentive effects. Stigma costs can arise when program beneficiaries lose their self-esteem because they regard themselves as failures who have been forced to rely on government support. In addition, non-beneficiaries may have negative attitudes toward beneficiaries and treat them as second-class citizens. As a result, some of those who are actually eligible to receive the benefits of a program may refuse to accept their entitlements. Hence, the objectives of the program may not be achieved.
Political economy costs, meanwhile, are any loss of political support for a program which may render the program ineffective. Often the poor are the most difficult and costly to reach. On the other hand, the most vocal and organized groups in society are often not the poor. If a program is well targeted, the latter group may voice their opposition to the program and stifle its implementation. Faced by such a dilemma, there is a danger that government will “go easy”, diverting the benefits to vocal and organized groups, abandoning the program’s poverty alleviation objectives.
2.5.1. Approaches and Mechanisms of Targeting Normally, as the accuracy of targeting increases, the benefits from targeting will also increase, but so will the associated costs (Besley and Kanbur 1990). Hence, targeting should be carried out only as long as the benefits exceed the associated costs. This, however, is easier said than done. Often it is very difficult to quantify all the benefits and costs that are involved. In addition, there are many practical questions which need to be answered regarding the implementation of targeting. This section

15
specifically deals with the question of what targeting mechanisms are available to reach the intended beneficiaries of a program.
The intended beneficiaries of social safety net, social protection, or poverty reduction programs depend upon the objectives of the particular program. A food assistance program will want to target its benefits to those within the community who are having difficulties obtaining food out of their own resources. A health assistance program will aim to provide free or subsidized medical benefits to those with health problems who are also poor or who are unable to access medical services without outside assistance.
Meanwhile, a public works program will aim to provide employment opportunities to either all of the currently unemployed or those among the unemployed who are also poor. Normally a public works program is not designed to encourage the poor who are already working to switch jobs. The strategy on how to reach these intended beneficiaries should be a central element of any program design.
The targeting mechanism issue is also complicated by the fact that poverty is a very fluid condition, where people frequently move in and out of poverty as a result of various external factors. Many households, while not currently in poverty, recognize that they are vulnerable and that events could easily push them into poverty in the future — for example a bad harvest, a lost job, an unexpected expense, or an illness.
In general there are two types of targeting mechanisms, administrative targeting and market-based targeting. In administrative targeting, the beneficiaries of a program are selected by the program implementers. Two approaches are commonly used in administrative targeting, geographic targeting and household or individual targeting.
Geographic targeting simply means selecting particular regions or areas in which the benefits of a program will be distributed. The selection is usually based on a set of indicators, by which all regions are ranked from the most to the least eligible to be included in the program. Geographical targeting has its advantages and disadvantages. It is easy to implement and to monitor, typically involves less fraud and much lower administrative costs than other targeting mechanisms, and requires only limited information at the individual or household level. However, some benefits will inevitably leak to the non-poor who reside in the targeted areas, while the poor who reside in non-target areas will not be covered (Besley and Kanbur 1990).
Household or individual targeting is basically an effort to identify households or individuals who are deemed eligible to receive the benefits of a program. The selection of households or individuals can be based on means testing or based on a set of indicators as in geographic targeting. Means testing is a method of selecting individuals or households based on whether they pass a certain predetermined threshold. The problem with such ‘direct targeting’ is that screening to identify the poor is expensive. It requires extensive information gathering and verification on the part of government administration.
These problems have led to a variety of schemes using indicator targeting or intervention on the basis of the particular characteristics of the poor (‘characteristic targeting’). This can be considered as a form of statistical discrimination where lack of detailed information leads program providers to use average characteristics to target intended beneficiaries. Examples of indicators or characteristics that are useful good predictors of income include ownership of durable goods, number of children, gender, age, education level, land ownership, housing characteristics, or a combination of several of these indicators. Data on these characteristics are relatively easier to obtain than data on income. Therefore, the administrative costs of characteristic targeting are much lower than the cost of direct targeting. In
MITIGATING DROUGHT: POLICY IMPACT EVALUATION; A CASE OF TIGRAY REGION, ETHIOPIA
16
addition, they are also difficult to manipulate in the short run, and hence have much lower level of leakage than direct targeting.
Market-based targeting is also often referred to as self-selection targeting. With this targeting mechanism, a program is designed in such a way so that only those who really need assistance will choose to participate in the program. For example, a food security program can provide in-kind benefits of very low quality food, available to anybody who applies for it. The very low quality food is considered an inferior good, where demand decreases with rising income. Although theoretically every one can apply for the benefits, it is expected that only the poor will apply since such low quality food will not be acceptable or desirable to the non-poor. Similarly, in a public works program which provides a wage rate level below the prevailing market wage, it is expected that only those who are really in need will apply to join the program. Such a low level of wages discourages those who are already working from applying for the program and maintains the incentive to take up regular employment when it becomes available (Ferreira, Prennushi et al. 1999). This self-selection mechanism has certain advantages over administrative criteria: it allows individuals to choose to participate or not and is more flexible to unobserved household shocks than administrative criteria.
2.5.2. Productive Safety net instruments There is a wide array of safety net instruments ranging from direct programmes where the transfer medium is food. Direct food programmes include supplemental feeding, school feeding, emergency feeding, generalized food distribution, and food for work.
Emergency is a social assistance function, most often used in times of crisis, precipitated by war or by natural disaster, to protect lives. This may take the form of therapeutic feeding for severely malnourished children, and rations or feeding for a general population currently unable to access food. The goal, particularly in natural disasters such as floods and drought, should always be to feed families within the community to prevent distress asset sales and migration.
Food-For-Work has become increasingly popular in Sub-Saharan Africa over the past decade (Von Braun, Teklu et al. 1999). Several trends have jointly contributed to food-for-work’s sharp growth in popularity over the past generation. First, at least since Sen’s (1981) seminal work two decades ago, policymakers and researchers have come to understand hunger as being largely determined by individuals’ capacity to maintain access to sufficient food to maintain good nutrition, and thereby good health. Partly as a consequence, FFW schemes have blossomed as regular transfer programmes in chronic food deficit regions as a means of ensuring access to food.
Food for works schemes have best used as a livelihood protection mechanism, and is best implemented with an employment guarantee. This supports an insurance function to enable households to undertake more risk in their normal livelihood strategy than they may do in the absence of the programmes, knowing that should alternative livelihood means fail, food for work is available. The advance planning also enables appropriate attention to be paid to the type of works undertaken. This ensures that appropriate community assets are constructed or renovated/rehabilitated with appropriate plans for onward maintenance rather than ad hoc programmes that can be characterized by a ‘dig a hole, fill a hole’ mentality.

17
2.6. Policy Impact Evaluation Evaluation research is, first and foremost, a process of applying scientific procedures to accumulative reliable and valid evidence in the manner and the next to which specific activities produce particular effects or outcomes (Kumar 2005). Much of evaluation research is referred to as program evaluation or outcome assessment (Babbie 2003).
According to Rutman (1980) program evaluation referees to the use of research methods to measure the effectiveness of operative programs. The primary aim of an impact evaluation is to measure whether a particular programme has achieved its desired outcomes. Measuring the impact of a program or policy can be distinguished from a variety of other approaches to describing or evaluating programs. Impact evaluation performs several main functions in policy analysis. First, and most important, evaluation provides reliable and valid information about policy performance, that is, the extents to which needs, values, and opportunities have been realized through public action. In this respect, evaluation reveals the extent to which particular goals and objectives have been attained (Dunn 2004).
Impact or outcome evaluation is one of the most widely practiced types of evaluation. It is used to assess what changes can be attributed to the introduction of a particular intervention, program or policy (Kumar 2005). Thus, impact evaluations help to identify the causal link between outputs and outcome and are required to inform policymakers and the public on which public actions have been effective and which ones have not worked so well in reducing the impact of drought in rural households.
There are many designs in conducting an impact assessment. Some of the commonly used deigns are: experimental designs, quasie-experimental designs and qualitative designs (Babbie 2003). In experimental design the eligible populations are assigned at random either to an intervention group or to a control group. The control groups are denied the programme and are treated, as far as is possible, as if the programme did not exist. All others designs are referred to as quasi-Experimental (Purdon, Lessof et al. 2001). This includes matched area comparison design, before-after study, and the matched comparison group design. For the purpose of this research the before -and -after designs is employed to analyze the impact of governmental intervention as it is discussed below.
2.6.1. Before-after study Before and after measurements can be incorporated into most evaluation designs. The before-and¬ after design is technically sound and appropriate for measuring the impact of an intervention (Kumar 2005). In a standard before-after study, outcomes will be measured on the population eligible for a programme both before the programme is implemented and after. The difference between the before and after measurements is taken to be the impact of the policy. (In this instance, the ‘before’ – or ‘baseline’ – measurements act as the control measurements.) Typically outcomes are measured at just one point in time before programme implementation and at one point in time after implementation. But this basic design is considerably strengthened if the number of measurement occasions is increased both before and after. The main advantage of the before-after study is that it is possible to implement a policy nationally (or at regional level) and yet still obtains a measure of the impact that policy has. But, the design has weakness because the design does not show the change brought by introducing comparable policy separately from the changes brought by the policy.

MITIGATING DROUGHT: POLICY IMPACT EVALUATION; A CASE OF TIGRAY REGION, ETHIOPIA
18
The design can be strengthened quite considerably if the time series is extended to several years before the implementation of the policy and several years after the policy is implemented. It then becomes possible to look for an ‘interruption’ or ‘shift’ in the time series at the time the policy is introduced and to check that the shift is sustained over time. In particular, the administrative data collected by government departments allows for long-term time series analyses to be carried out relatively easily and cheaply. In a nutshell the motive for this evaluation research is to assess the changes in rural livelihood situations, which can form the basis of government policy interventions and program design.
2.7. Conclusion This chapter explored the concept of drought, drought management, government response to mitigate impacts of drought, the role of productive safety nets and the concepts of targeting. This enables to understand the nature and characteristics of drought and the fundamental elements of drought management strategy. Furthermore, the chapter elaborates approaches and mechanisms of targeting, instruments of productive safety nets and policy impact evaluation. The next chapter gives an overview of methodology and techniques used to analyze the data captured from the field work.

19
3. Research Methodology
3.1. The Research Techniques
Research is the processes of enquiry and discovery’ while methodology refers to a coherent set of rules and procedures which can be used to investigate a phenomena or situation (Kitchin and Tate 2000). For social science research to be able to answer the given social problems in a scientific way demands investigative and scientific research technique which is relevant to the specific problem. Based on this consideration a researcher selects and sets the methodological approach, qualitative or qualitative prior to entering into the actual processes. This implies that exploring, describing and explaining the problem rose in the research question and meeting the objective of the study at hand needs an appropriate methodology (ibid).
The advantage of employing qualitative and quantitative methods in research is getting increasing recognition among researchers. It enables to benefit from the insights that the two methods provide when used in combination. Moreover, the most effective evaluation research is one that combines qualitative and quantitative components (Babbie 2003). Thus, the research strategies employed in this study combine both qualitative and quantitative methods.
Qualitative method is used to capture data pertaining local perception and opinions on the effectiveness of policy intervention and policy outcomes employing the use and collection of a variety of empirical materials–interviewing, discussion, observation and photography, visual texts, and personal interactions and experiences. Causes for household susceptibility to drought and food insecurity are quite complex and attributable to natural, political and socio-economic factors. They also vary from place to place as well as from household to household. Thus, it is believed that methodologically these call for a detailed understanding of the everyday life of people and of the processes of social practice. Moreover, the different strategies that households employ to mitigate the impact of drought and food crisis based on their own natural, cultural and socio-economic settings also requires a detailed understandings of their life worlds.
Qualitative methodology is also best employed to evaluate an intervention program. Because it does inform the basic social processes related to a program under evaluation. Methodologically the concepts in the actor-oriented approach requires a detailed understanding of every day life and of the processes by which images, identities and social practices are shared, contested, negotiated, and sometimes rejected by various actors involved (Long 2002).
Thus, it is believed that employing both quantitative and qualitative approach is more useful to understand the complex factor that make households vulnerable and their strategies which requires a detail understandings of everyday lives and processes involved. Employing both quantitative and qualitative approach helps to assess the impacts of intervention mechanisms on the lives of the poor. It is appropriate to understand how the local people perceive government policies and their implementations.

MITIGATING DROUGHT: POLICY IMPACT EVALUATION; A CASE OF TIGRAY REGION, ETHIOPIA
20
3.2. Selection of Study Area
Atsebi-wenberta and Enderta rural districts are selected for this study. Some of the general specifications taken into account for the selection of this study area can be mentioned. First, the study sites constitute the main drought prone and food insecure districts in the region. Most people in these districts are either seasonally or chronically food insecure due to recurrent drought. These districts face severe problems and receive food aid. Second, although most people are food insecure and the districts are drought prone, there has never been a study conducted on the assessment of program interventions in these areas so far. Third, as I grew up in the region, there was no communication barrier between me and the local people to interact and deal with all matters related to the research activities.
With regard to the selection of sample tabia’s (villages) for the study, a discussion with experts of agriculture and rural developments, and development agents were held. The most important factors considered for the selection were the agro-climatic zone, the degree of the severity of drought and food shortage problem, and accessibility. Accordingly, three tabia’s (villages) were selected from each district with different agro-climatic zones of the district such as lowland (kolla climate), middle altitude (woyna dega climate), and highland (dega climate). Moreover, fifteen sample households from each tabia, totalling 90 from the two districts, were randomly selected in collaboration with the respective development agents. In order to randomly select the 90 sample households, list of household heads by tabia were supplied by respective tabia administrations. These lists were used to select 15 households from each tabia by employing simple random sampling technique, where every household heads in each tabia were given a chance of being included in the sample. Therefore the sample selection is free from bias. In a nutshell random sampling approach is employed to select the study areas and sample respondents in which the subjects selected are supposed to meet the study needs. Table 1 presents the name of tabias selected from the two zones and number of households selected from each selected tabia.
Table 1: Names of the Tabias selected
ZONE NAME OF TABIA SELECTED NO. OF HOUSEHOLDS SELECTED
Easter Zone • Barka Adi-Sebha
• Ruba Felege
• Felegweyeni
15
15
15
Southern Zone • Lemelem
• Mehbere Genet
• May Genet
15
15
15
Field survey
A visit was made to the selected communities and households from 4th of October to 15th of October. A combined questionnaire was used to record the household information. During the course of the field survey, household surveys, key informant interviews, and meeting with concerned officials in capital city Mekelle, wereda local administration, and tabia centers were undertaken.

21
Training of interviewers and test of questionnaires
Short orientation training for data enumerator was given in Mekelle. Pilot test was conducted in the community nearby Mekelle following the training of the interviewer to run the draft survey with a sample of target population. This was useful for uncovered aspects of questions that would cause interviewer and respondents to have difficulty. The final questionnaire was prepared after incorporating the suggestions of the test survey.
3.3. Sources of Data In this study, both primary and secondary data were utilized. Primary data were collected through interviews, focus group discussions, field observations and photography. Secondary data were obtained from government Bureaux and offices and non-governmental organizations both at the region and district levels. The sources and methods used to acquire data for the research are outlined below.
3.3.1. Primary Data Most of the data required to answer the research questions were collected from primary sources. To generate the required data from the primary sources, different qualitative methodological approaches such as in-depth interviews, focus group discussions, observations and photography were employed. These techniques were used to get the views and understandings of households about what causes the problems, about their coping and survival strategies and as to how the government has addressed and responded to the problem.
Interview
In-depth interviews encourage capturing of respondents’ perceptions in their own words, a very desirable strategy in qualitative data collection. This allows the evaluator to present the meaningfulness of the experience from the respondent’s perspective.
The research interview attempts to understand the situation from the subject point of view, to unfold the meanings of peoples experience and uncover their lived world. Interviews are a means of understanding people’s opinion or attitudes. They give the subjects of the research much more scope to speak for themselves than the survey questionnaires (Steinar 1996).
Accordingly interviews with the selected 90 households (15 in each village) were conducted and
Figure 4 Photo showing interview session
the necessary information was obtained. It includes information about household drought and food insecurity problems, about their strategies, about how the government intervenes and responses to the
MITIGATING DROUGHT: POLICY IMPACT EVALUATION; A CASE OF TIGRAY REGION, ETHIOPIA
22
problem, and how responses and interventions have been effective and changed their quality of life had been obtained. There had been also in-depth discussions about these issues with district executives and development agents in each village.
Focus Group Discussion
A focus group discussion is a group session moderated by a researcher. It allows the participants not only to speak for themselves but also to negotiate their own shared views. It allows the subjects to collaborate actively rather than to respond passively and it favours a collective approach to the production of knowledge.
Focus group discussions were held in each village to enrich the first hand data collected through interview. The group consisted of seven to ten participants within each gender group. Discussion with district concerned officials, such as district council, agriculture and rural development office, disaster protection and preparedness desk, Finance and Economic Development including with some experts was also held. Besides group and individual discussions was also carried with the target beneficiaries’ and with key informants from local non-governmental organizations particularly Releif Society of Tigray.
Observation
Observational techniques are methods by which an individual or individuals gather firsthand data on programs, processes, or behaviours being studied. They provide evaluators with an opportunity to openly explore the evaluation topic. By directly observing operations and activities, the evaluator can develop a holistic perspective, i.e., an understanding of the context within which the program operates.
Mikkelsen Britha (2002) suggested that observation provides important information during all phases of a study. ‘Observation of physical structure, social difference, behaviour, action and symbols in solitude or with other whom observation are discussed, provides important information (Mikkelsen 2002). Observations can be useful during both the formative and summative phases of evaluation. For example, during the formative phase, observations can be useful in determining whether or not governmental interventions are being operated as planned. On the other hand observations during the summative phase of evaluation can be used to determine whether or not the program intervention is successful.
Thus, observations of the people’s way of life, their assets and resources, the ups and downs to overcome their daily struggles, their activities for living, etc, would provide valuable and supportive information. Having a good look at physical and socio-economic infrastructures, the land use, housing conditions, the different economic activities people are involved with would provide valuable contributions to understand the existing real situations and the overall situation of the rural poor. Thus, in this study an attempt was made to carefully observe every situation and understand them fully.
3.3.2. Secondary data Secondary data contribute a lot to meet the research objectives. They are supportive in any research processes. They are used to supplement primary data generation or where primary data generation is impossible. However, most secondary data have limitations and were recorded usually with other purposes in mind (Kitchin and Tate 2000).

23
Secondary materials such as published books, articles, journals, maps and bulletins about the research topic had been collected and assessed from relevant organizations and institutions from bureaux and offices at national, regional and district level. Annual reports of bureaux and offices as well as policy documents about agricultural development, food security and Productive Safety Net Program were also among the secondary data collected and utilized. Furthermore, data from Remote Sensing was downloaded from Landsat TM and ETM+ for the year 1986, 2000 and 2007. The data collected during the field work are shown in the Table 2 given below.
Table 2: Secondary Data collected
SN DATA TYPE YEAR 1 Productive safety net beneficiaries 2005-2009 2 Contribution of agriculture to total GDP 1997-2006 1997-2006 3 Agricultural production in Tigray 1997-2008 4 Changes in population and cultivated land 1997-2008 5 Drought/disaster affected population in Tigray 1997-2009 6 Food Aid distributed in Tigray 1994-2008 7 Amount of credit disbursed 2000-2008 8 Agricultural inputs distributed 2000-20008 9 Drought disaster affected Population for 34 rural districts 1997-2008 10 Drought hazard frequency in Tigray 1994-2007 11 Health Profile 1999-2008 12 Education Profile 1998-2008 13 Irrigation Coverage 2009 14 Total area cultivated and crop Production by district 1998-2008 15 Number of water harvesting schemes constructed 2005-2008 15 Demographic Data 1998-2008 16 Rain fall data 1953-2008 Images/Maps 1 Landsat Images 1986, 2000 and 2007 2 Land Use/Land Cover 3 Land, water and climate resources of the region
4 Social service infrastructure distribution in the region
3.4. Methods of Data Analysis
Analysis of data provides sense for the data collected during the field work. The research strategies employed in this study combine both qualitative and quantitative methods. The advantage of simultaneously employing qualitative and quantitative methods in the study of rural livelihoods is getting increasing recognition among researchers. This is because it enables to benefit from the insights that the two methods provided when used in combination. In summary the methodological framework employed for the data analysis is outlined in Figure 5 below.
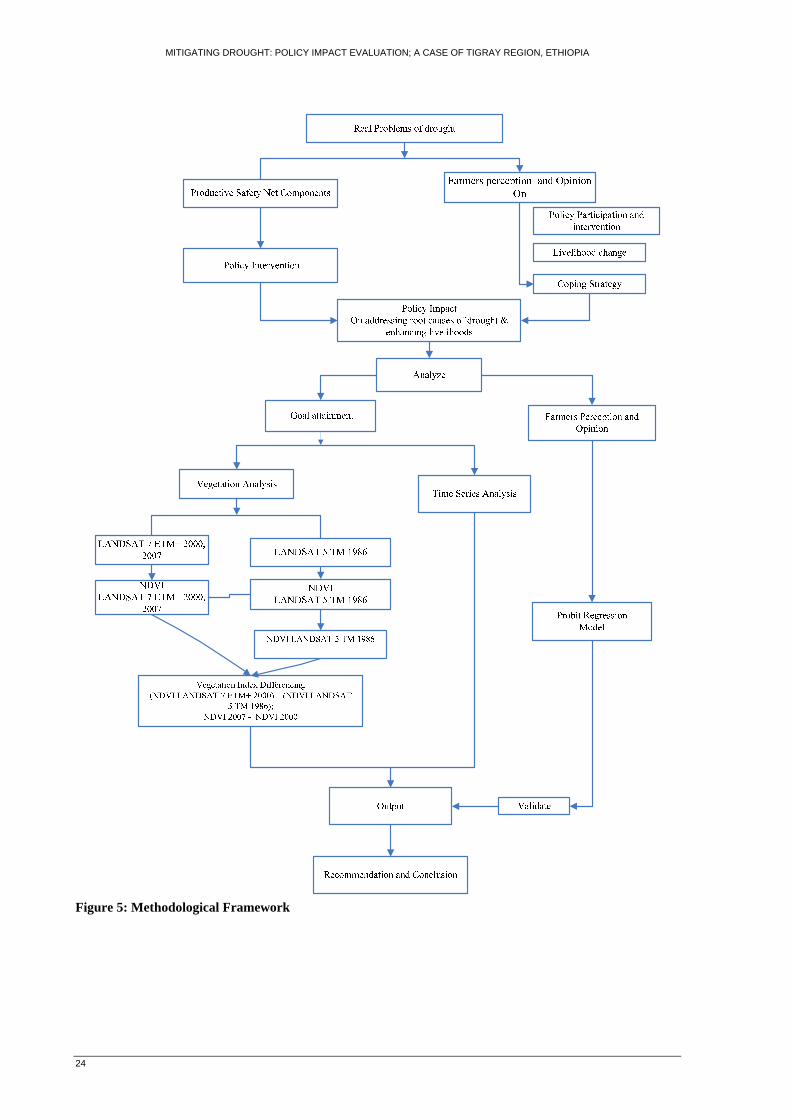
MITIGATING DROUGHT: POLICY IMPACT EVALUATION; A CASE OF TIGRAY REGION, ETHIOPIA
24
Figure 5: Methodological Framework

25
3.4.1. Quantitative analysis The primary data collected from survey was analyzed by employing statistical tools. Two methodological approaches were used to analyze the data collected. Those are probit regression analysis and spatial analysis. The details of each methodological approach employed are outlined below.
3.4.1.1. Specification of the model
For ordinary linear regression, the response variable is always quantitative and continuous in nature. When the response variables are categorical and in particular binary, that is, it can assume only two values (a ‘yes-no’) or in terms of counted proportions (r fail out of n tested) we are led to consider some other models which are more appropriate than ordinary linear regression. An important characteristic of data in which the response variables are binary is that the response variables must lie between 0 and 1. Therefore fitting these data using ordinary linear regression can give prediction for the proportion of above one or less than zero, which would be meaningless. On the other hand what we actually need in this situation is a regression model which will predict the proportion of occurrences, p at certain levels of x.
For this type of data, in particular, when the response variables are in terms of counted proportions, the relationship between response variables p and explanatory variables x is a non-linear curved relationship. The purpose of probit modelling is the same as other modelling techniques used in statistics, that is, to find a model that fits the data best in describing the relationship between the response and the explanatory variables. This model can be used when the response variables in the analyses are categorical in nature. Probit Analysis is designed to model the probability of response to a stimulus. Since the probability of an event must lie between 0 and 1, it is impractical to model probabilities with linear regression techniques, because the linear regression model allows the dependent variable to take values greater than 1 or less than 0. The probit analysis model is a type of generalized linear model that extends the linear regression model by linking the range of real numbers to the 0-1 range.
Probit regression analysis involves modelling the response function with the normal cumulative distribution function. The probit of a proportion p is just the point on a normal curve with mean 0 and standard deviation 1 which has this proportion to the left of it.
The model can be presented as
kkZp χβχββ +++==Φ− ...)( 1101
where p is the proportion and 1−Φ is the inverse of the cumulative distribution function of the
standard normal distribution. That is,
∫∞−
−=Φ=z
duuZp )2exp(21)(
2
π
is the cumulative distribution function of the standard normal distribution.

MITIGATING DROUGHT: POLICY IMPACT EVALUATION; A CASE OF TIGRAY REGION, ETHIOPIA
26
For probit regression, the binomial, rather than the normal distribution describes the distribution of the errors and will be the statistic upon which the analysis is based. The principles that are used for ordinary linear regression analysis could be adapted to fit both regressions. However, instead of using least square method to fit the model, for probit regressions, it is more appropriate to use maximum likelihood estimate. The likelihood function is given as
ii rni
rii
mi ppL −= −Π= )1(1
where the ip are defined in terms of the parameters kββ ,...,0 and the known values of the
predictor variables. This has to be maximized with respect to the parameters. The model above is referred to as the probit regression model. Once a probit regression model is fitted and obtained estimates for the various parameters of interest, to answer questions about the contributions of various factors to the prediction of the distress sale of assets. A test of association between different variables such as test of association between policy intervention and income of households, test of association between current livelihood status of studied households and participation in water harvesting scheme, e.t.c., was done using a 2χ (Chi-square) test. Furthermore, Moran’s I was employed to analyze the spatial patterns of drought in the study area.
3.4.1.2. Vegetation change analysis To analyze the change detection selection of appropriate satellite images was the first step in order to optimize the accuracy. The main criteria used in the selection process were the time of acquisition of the images and the sensor types. Since the analysis focuses on impacts of drought on vegetation and vegetation change, Landsat 5/TM (for January 1986) and Landsat 7/ETM+ (for February 2000 and 2007) were acquired to perform the change detection analysis for vegetation cover to identify impacts of drought and effect of policy instrument (area enclosure) over the last periods. The images were basically taken for the dry season according to the seasonal calendar of the study area and this will prevent the dynamic change of vegetation cover that could occur due to seasonal variations. The image processing procedures used in the multi-temporal analysis have schematically been represented in the methodological framework.
Song et al. (2001), state that the effect of the atmosphere can prevent the proper interpretation of images if it is not taken into account. Whether such correction is needed depends on the information desired and the analytical methods used to extract the information. For many applications involving image classification and change detection, atmospheric correction is unnecessary. Image classification with a maximum likelihood classifier using a single date image is a typical example in which atmospheric correction is not needed. On the other hand, atmospheric correction is necessary before classification and change detection in many other situations. For example, the Normalised Difference Vegetation Index (NDVI) which is often used to monitor vegetation dynamics needs atmospheric correction before change detection. NDVI makes use apparent reflectance values of the red and the near-infrared spectral bands. These reflectance values are influenced by atmospheric aerosols. This makes the atmospheric correction necessary in order to calculate accurate NDVI values free of aerosols (Song C., Woodcock C.E. et al. 2001).
In order to determine the effects of drought condition the NDVI were used where NDVI is the ratio between the maximum absorption in the red spectral band versus the maximum reflection radiation in

27
the near infrared spectral band. NDVI images were created for both the 1986 (good year) and 2000 (drought year). For this study change is defined in the mean of NDVI pixel values for the study area between the two images (1986 and 2000). Change was evaluated for the overall changes in NDVI pixel values for the entire study area to determine the effect of drought in 2000.
Furthermore, a vegetation index differencing technique was used for change detection analysis in order to identify the effects of policy instruments over the period of 2000 and 2007. According to Lu et al. (2004), the vegetation index differencing has the advantage of emphasizing differences in the spectral response of different features and reducing impacts of topographic effects. In order to perform the differencing, the NDVI image of the atmospherically corrected ETM+ was interactively stretched to have the same NDVI values. Then the ETM+ of 2000 was subtracted from the ETM+ 2007 to obtain the difference.
To identify the change on vegetation cover over the policy implementation period, the analysis was conducted over a total area of 49,255 hectare of land in Enderta district which is primarily allocated for vegetation growth. This area is located in the eastern part of the District and is currently enclosed for the enhancement of natural vegetation.
3.5. Issues of Validity and Reliability Validity is the degree to which a study actually measures or reflects what it intends to measure while reliability refers to the consistency and conformability of a research finding. It is the agreement of information obtained on different occasions or tools. In research evaluations one of the difficult tasks is achieving valid and reliable results. Because, a given research inquiry cannot be carried out without problems. There were some factors in this study that can affect its validity and reliability. The basic problem was related to secondary data. Secondary data that are aggregated at district level have been limited. Moreover, available reports at district level are not well documented.
However, in spite of the above mentioned problems, it has been tried to maintain the reliability and validity of the study through different strategies. Good relations with the respondents were able to establish. Particularly the development agents at each Tabia have played an important role in creating smooth relations. Moreover, different qualitative techniques such as in-depth interview, group discussions, observations and photography were utilized. Different groups of informants: respondents from different wealth category of men and women, extension agents and experts, and different government bodies were used within the study. Thus, multiple evidences for the analysis and cross- check of the data generated were able to obtain during the field survey. Thus, all these make the research result more credible and trustworthy.

MITIGATING DROUGHT: POLICY IMPACT EVALUATION; A CASE OF TIGRAY REGION, ETHIOPIA
28
4. The Study Area This chapter describes the study area, Tigray region in general and Atsebi-Wemberta and Enderta districts in particular. It provides the physical features, resource bases, demographic characteristics and socio-economic standards.
4.1. The Tigray National Regional State
The Tigray National Regional State was established in 1993 as one of the nine regional states of Ethiopia. It is located in the North Eastern part of the country between 12015’N and 14057’N latitude and 36027’E and 39059’E longitude and covers an area of 53,000 square kilometres (Solomon 2005). The region is bounded by Eritrea to the North, the Sudan to the West, and the Ethiopian regions of Amhara and Afar to the South and the East respectively. Administratively it is divided into 6 zones, 34 rural districts and 12 town districts. Each district is subdivided into tabias and each tabia is divided into kushet, which are the lowest unit in the administrative hierarchy. The delineation is made based on natural boundaries like rivers, escarpments and mountain peaks; settlement, population size, agro-ecology and convenience and proximity to administer centres.
Tigray contained the heart of the Aksumite empire with which Ethiopian history begins some four centuries before Christ, in the sense of the first written records of a settled population on the north Ethiopian massif that rises out of the semi-arid lowlands of the east (Afar) and west (western Tigray and eastern Sudan).
Figure 6 Administrative Map of Tigray

29
4.2. Agro- ecological zones and climate
The topography of Tigray region contains three main traditional divisions of arable Ethiopia: the kola – lowlands (1400-1800 meters above sea level) with relatively low rainfall and high temperatures; the woina dega – middle highlands (1800-2400 meters above sea level) with medium rainfall and medium temperatures; dega – highlands (2400-3400 meters above sea level) with somewhat higher rainfall and cooler temperatures. In general the region has a diverse topography, with peak highlands (8%), midlands (39%) and lowlands (53%), which together create diversified agro ecological conditions. The wide range of variation in altitude (2000-4000m above sea level) governs the temperature range and climatic conditions in the region. On the basis of altitude six major agro-ecological zones are identified: Upper Dega, Dega, Weyena Dega, Upper Kola, Lower Kolla and Wurch (Bureau of Finance and Economic Development 2007).
The climatic condition of the region is a direct reflection of its altitude. The recorded annual mean temperature of the region ranges from 12°c in some highland areas to 37°c in Humera, which is Arid Kolla. The annual mean temperature for most part of the region is between 15°c - 21°c.
The climate of Tigray is highly unpredictable characterized specially by unreliable rainfall. Severe droughts causing famine have affected the region approximately every 2-3 year. Tigray region belongs to the African Dry lands, which is often called the Sudano-Sahelian region (Warren and Khogali 1992). It is characterized by sparse and highly uneven distribution of seasonal rainfall, and by frequent drought. The amount of rainfall increases with altitude and from east to west, and decreases from south to north. Average rainfall varies from about 200 mm in the northeast lowlands to over 1000 mm in the south western highlands. The coefficient of variation in annual rainfall for the region is about 28 percent, compared to the national variation of 8 percent (Hagos and Holden 2002).
The highest rainfall in the region occurs during summer season which starts in mid June and ends up in early September. Rainfall distribution in the region is characterized by high temporal and spatial variability with annual precipitation ranging from 500 to 1000 mm (Ethiopian National Meteorological Agency 2007). The major problems and challenges facing the region are the inter-annual and inter-seasonal variability of rainfall volume and distribution. Based on rainfall, the agro-ecology of the region can be classified in to three major classes namely Dry, Wet and moist. Dry climatic element covers the highest portion of the region (66.8%) and the moist and wet climatic elements cover 24.2% and 9% respectively as it is depicted in Table 3 below.
Table 3 Agro-ecological zonation classes and their area coverage
AEZ BASED ON RAIN FALL AREA COVERED IN KM2 PERCENTAGE %
Dry 36467.9 66.8
Moist 13179.6 24.2
Wet 4925.1 9.0
Total 54572.6 100

MITIGATING DROUGHT: POLICY IMPACT EVALUATION; A CASE OF TIGRAY REGION, ETHIOPIA
30
Figure 7: Agro-ecology based on rainfall, Source Bureau of Finance & Economic Development
4.3. Land Use Pattern The distribution of land use/land cover type in Tigray is given in Table 4. The major types of land use are bush and shrub land (36.2%), cultivated land (28.2%), and grass lands (22.8%). Other forms of land use account for 10.81% of the land mass (Bureau of Finance and Economic Development 2007). Cultivable land is the dominant land use in the highlands of Tigray where there is high population density. The natural forest resource of the region is overexploited and covers only about 0.2% of the total land area. The decline in forest cover is closely linked with human economic activities and population pressure. Community survey undertaken by the International Food Policy Research Institute has broadly classified the lands into eight groups as it is depicted in Table 4 below.
Table 4: Land use pattern in Tigray, Source Community survey (1998)
TYPES OF LAND SOUTHERN EASTERN CENTRAL WESTERN TOTAL Cultivated rain-fed present
225494 (56) 121681 (28)
537276 (39) 1093405 (49)
1977856 (40)
Cultivated irrigated 3783 (1) 902 (0) 1264 (0) 413 (0) 6361 (0) Cultivated rain-fed potential
17815 (4) 1204 (0) 1509 (0) 306453 (11) 326980 (7)
Cultivated irrigated potential
216 (0) 231 (0) 75 (0) 1580 (0) 2103 (0)
Grazing land 63067 (16) 40823 (9) 279345 (20) 542264 (20) 925499 (19) Natural forest 39090 (10) 142405
(33) 240622 (17) 425841 (16) 847958 (17)
Plantation (woodland) 10579 (3) 9114 (2) 14639 (1) 3579 (0) 37911 (1) Wasteland 44147 (11) 120760
(28) 320506 (23) 294884 (11) 780297 (16
Total 404192 (8) 437119 (9) 1395235 (28)
2668419 (54)
4904965 (100)

31
4.4. Demography and Socio-economic Settings of the Region
The population of Tigray is over 4.3 million, with an average family size of five persons per household(Central Statistics Agency 2008). According to the 2007 census, the population is growing at 2.5% per year and population density in the region is 63 persons per square kilometre (Central Statistics Agency 2008). However, other studies indicate that in the highland areas the average density is 137 persons per square kilometre, showing that there is high population pressure in these areas (Pander and Gebremedhin 2004). Eastern Zone is relatively densely populated while Western part of the region is a sparsely populated zone.
The proportion of population under the age of 15 years is 43.7 percent of the total population in the region. On the other hand the proportion of population aged 65 and above is only 4.4 percent while the proportion of active labour force (16 – 64 years) is 51.9 percent. Both fertility and mortality in the region are very high. On average a woman bears 5 children in her productive lifetime. The average life expectancy at birth is below 50 years (ibid).
Agriculture is the mainstay of the region’s economy which contributes about 57 percent of the gross domestic product (GDP), of which 36% is from crop production and about 17% and 4% is from livestock and forestry respectively. Rainfed crop production is the main economic activity for over 80% of the population, supplemented by livestock rearing under mixed-subsistent system. Major crops are sorghum, barley, teff, finger millet, wheat and maize accounting for 26%, 16%, 12%, 11%, 9% and 7% of the total area respectively (Girmay 2006). The agriculture sub-sector’s growth rate is estimated to be 4 percent per annum while that of the GDP is 5.3 percent per annum. It is the major source of food, raw materials for local industries and export earnings. Over 90 percent of the crop output is produced by the peasant sector, which is characterized by a low-level of technology and largely rain-fed. Because of the frequent drought and low agricultural productivity, food deficit is the central challenge of the region. Even in a good year, peasants cannot produce enough foods to cover their subsistence requirements. Poverty and food insecurity are, therefore, very severe in the region. Several hundred thousand people died because of famine during the mid-1980s, and many are affected by food shortages on a regular basis.
According to the report of Bureau of Finance and Economic Development, the region has poor and insufficient health services. The health service to population ratio in the region is one hospital for 1.3 million people, one health station for 337,400 people and one clinic for 28,500 people. In terms of education, the Tigray region has a high level of enrolment ratio even as compared to national level. Primary schools gross enrolment ratio in the region is 97 percent. Infrastructural services like telecommunications, road network and transport services are very much limited. For instance, according to BOFED (2004) the regional road density is 51km per 1000 square kilometres in 2006 (BOFED 2004).

MITIGATING DROUGHT: POLICY IMPACT EVALUATION; A CASE OF TIGRAY REGION, ETHIOPIA
32
4.5. District Profile
4.5.1. Atsebi-Wemberta District
Location
Atsebi-Wenberta district is one of the 8 districts of the Easter Zone of the Tigray Region. Geographically the district is situated at 13o 36' North Latitude and 39o 36' East Longitude. It is about 70 km far from Mekelle to the North East through Wukro. It is bordered with Afar region in the East, and by the weredas of Enderta, Kilte Awlaelo and Saesie Tsaeda Emba, in the South, West and North respectively. The district covers a total land area of 1137.75 square kilometres.
Figure 8: Map Atsebi-Wenberta District
Relief and Climate
The altitude of the district ranges from 1800 to 3069 meter above sea level where 75 percent of the wereda is upper highlands and the remaining 25 percent is found in the low lands. The wereda is classified in to two agro-ecological zones. These are Tepid Sub-moist Mid-highlands of Wemberta Area (apiculture/livestock farming system) and Sub-moist Highlands of Atsbi Area (pulse/livestock farming system) which consists of 7 and 9 villages respectively. Agro-ecologically the district is characterized as Arid zone comprising two agro-ecological zones; Weina-Degua (1800 – 2300 masl), and Degua (> 2300) that constitutes 30% and 70% of the total area coverage of the district respectively.
The climate Atsebi-Wenberta distict ranges from cool to warm. The average temperature of the area is 18 °c. Generally the climate of the area is characterized as highland and middle land. Rainfall is usually intense and short in duration. Under normal conditions, however, rain starts around the end of June then ends on early September. The average annual rainfall is around 67.8 mm. As a result Atsbi wemberta is one of the drought prone areas of in the region. The area receives bimodal rainfall: Belg (short rains) from November to March (which is not enough for crop production, except for early variety barley) and Meher (long rains) from June to September (IPMS/ILRI 2004).

33
Administration, Population and Socio-economic Activities
Atsebi-Wenberta district is sub-divided into 18 administrative Tabias. Tabias are the lower strata of the government administration organ which are responsible for all political, social and economic matters in its span of control. Each tabia is expected to have on average about 1,000 households or 5,000 people. Tabias are responsible to the district council.
Population: The total population of the district was estimated at 112,234 of which 47.8% (53,615) are male and 52.2% (58,619) are female in the year 2007. Of the 112,234 total populations, only 9.9% or 11,141populations were urban dwellers. The average household size of the district was five persons.
Land Use: The district has a total area of 147,096.195 hectares, of which 60.96% (125,294.96 ha) are cultivated land, 8.9 % (12,142.53 ha) are forest land, and 28.6% (111,674.5 ha) are uncultivated, grazing land, non-utilized land and other uses. The average land holding size per household is 0.504 hectare.
Economic Activities
People living in the area practice farming in combination with livestock rising. Agriculture is the single most dominant means of livelihoods of the population in the district. There are some people engaged in business activities. However, these constitute only a very small proportion, agriculture both crop cultivation and livestock raising remain to be the overall dominant economic activity. Atsbi- Wemberta wereda has around 2% cattle, 4% sheep, and 0.4% goats of the region. Livestock are integral part of the farming system. Oxen provide almost the entire traction and threshing power. Sheep appear to be more important in pulse/livestock farming system, and goats are also important in the escarpments to the east and in the midlands (apiculture/livestock farming system). Apiculture is an important source of household income in both farming systems.
According to the District Rural Development and Agriculture Office, the main crops grown in the study area are barley, wheat, teff, maize and sorghum. Among the pulses, beans, field pea and lentil are the major dominant crops. There are also cattle, equines, sheep, goat, camel, and beekeeping. Honeybee colony multiplication through over crowding and splitting method is practiced in the highland areas where as honey production is a common practice in middle altitude.
Livestock population of the study area was; Oxen 21908, Cows 30588, Goats 15431, Sheep 82,950, Donkeys 9416, Mules 1333, Horses 79, Camels 54, Poultry 47265, Honeybee Hives with honeybee Colony 16,915.
4.5.2. Enderta District
Location
Enderta district is one of the 8 districts of the Southern Zone of Tigray Region and is one of the drought prone and chronic food deficient districts in the region. It is bounded by Hintalo wajerat in the South, Samere-sehareti and Degua-tembien districts in the West, and Wukero distraict in the north. Geographically the district is located between 130-140 North and at 390-400 30’ East. The district covers a total land area of 1446.49 square kilometres.

MITIGATING DROUGHT: POLICY IMPACT EVALUATION; A CASE OF TIGRAY REGION, ETHIOPIA
34
Figure 9: Map Enderta District, study sites
Demography: The total population of the district was estimated at 114,277 of these 57,472 (50.3%) are male and 56,805 (49.7%) are female in the year 2007 (Central Statistics Agency 2007). Out of the total population almost all (100%) the population is living in rural areas. Average family size is five and population density of the district is 79 people per square kilometre.
Agro-Ecology The altitude of the district ranges from below 1400 meter above sea level to 2700 meters above sea level. Agro-ecologically the district is characterized as Arid zone comprising three agro-ecological zones; Kolla (< 1500 masl), Weina-Degua (1500 – 2300 masl), and Degua (> 2300) that constitutes 13.75%, 63.75%, and 22.5% of the total area coverage of the district respectively.
Climate: Rainfall in the district is characterized by one rainy season. The area is known by having uni-modal rainfall pattern that covers from June to September. Small area (16 %) of the district has bimodal rainfall pattern. The average annual rainfall generally varies between 435.26 mm - 674.08 mm and the average minimum and maximum temperature is 150c and 270c respectively.
Topography: Land escape formation of the district is mountainous, undulating, flat and plain lands, rugged valley and gorges, and hilly areas. As a result of continuous land exploitation by manmade and natural calamities, the land is severely eroded and the soils are low in their fertility.
Land Use: The district has a total area of 193,309 hectares, of which the total agriculture covers 49.03 %. This includes the fields inside the land use for ‘agriculture’ and ‘agriculture and degradation control’. This agricultural land contains 48.48% of annual rain-fed crops and 0.55 % of irrigated crops. The average land holding size per household is 0.75 hectare.
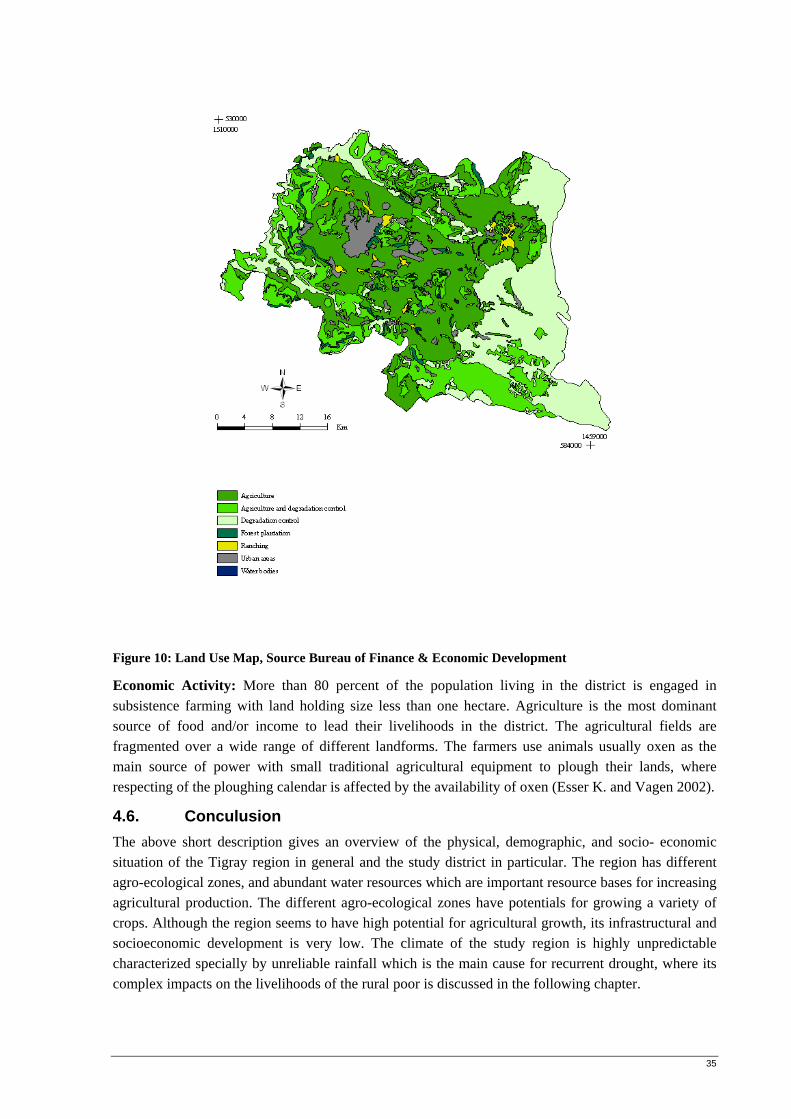
35
Figure 10: Land Use Map, Source Bureau of Finance & Economic Development
Economic Activity: More than 80 percent of the population living in the district is engaged in subsistence farming with land holding size less than one hectare. Agriculture is the most dominant source of food and/or income to lead their livelihoods in the district. The agricultural fields are fragmented over a wide range of different landforms. The farmers use animals usually oxen as the main source of power with small traditional agricultural equipment to plough their lands, where respecting of the ploughing calendar is affected by the availability of oxen (Esser K. and Vagen 2002).
4.6. Conculusion The above short description gives an overview of the physical, demographic, and socio- economic situation of the Tigray region in general and the study district in particular. The region has different agro-ecological zones, and abundant water resources which are important resource bases for increasing agricultural production. The different agro-ecological zones have potentials for growing a variety of crops. Although the region seems to have high potential for agricultural growth, its infrastructural and socioeconomic development is very low. The climate of the study region is highly unpredictable characterized specially by unreliable rainfall which is the main cause for recurrent drought, where its complex impacts on the livelihoods of the rural poor is discussed in the following chapter.

MITIGATING DROUGHT: POLICY IMPACT EVALUATION; A CASE OF TIGRAY REGION, ETHIOPIA
36
5. Drought Disasters and its Impacts in the Study Region
Drought is a complex phenomenon and is generally viewed as a continued and regionally extensive occurrence of below average natural water availability either in the form of precipitation, river runoff or groundwater. Drought is a normal, recurrent feature of climate. It can take place almost everywhere, although its manifestation varies from region to region and therefore a global definition is a difficult task (Wilhite and Glantz 1985). In general sense, drought originates from lack of precipitation over an extended period of time, usually a season or more, resulting in a shortage of water supply for a certain activity, group, or environment. Drought is a normal part of virtually every climate on the planet, even rainy ones. It is the most complex of all natural hazards, and it affects more people than any other hazard.
Ethiopia is one of the horns of African countries highly vulnerable to drought. It is the single most important climate related natural hazard impacting the country from time to time. Drought in Ethiopia is a frequently recurring phenomenon. Ethiopia has experienced major droughts which resulted in famine. The last three decades have been marked by catastrophic and wide spread droughts and famines; and the magnitude, frequency and the effects of droughts have increased since the mid-1970s. According to a United States Agency for International Development (USAID) study, the frequency of nationwide droughts causing severe food shortage increased from once every 10 years in the 1970s and 1980s, to every two-three years now (Margaret 2003).
Between 1970 and 1984, Ethiopia sustained an average of two large-scale disasters a year. Since 1985 the annual frequency of large-scale disasters has increased to 2.8. Frequent droughts, floods, epidemics, and recent devastating pestilence infestation are the key hazards. The country has had five food crises since 1980. Table 5 lists the numbers and effects on the population of natural disasters in Ethiopia over the past three decades. Drought and resultant food shortage and famine are the main killers, accounting for more than 90 percent of deaths.
Table 5 Disaster Events in Ethiopia, 1970–2008 TYPE OF EVENT NUMBER OF EVENTS NUMBERS KILLED NUMBERS AFFECTED Flood 19 870 958,951 Drought/famine/food shortage
35 1,200,367 112,880,064
Landslide 2 35 29
Epidemics 6 10,326 103,688 Insect infestation 5 Earthquake/volcanic eruption
2
66 2
Total 69 1,211,664 113, 942, 734 Source: Degefu (1987); Nicholls (1993); Webb and Braun (1994) cited in (ICPAC 2007) & "EM-DAT: The OFDA/CRED International Disaster Database
The percentage of the Ethiopian population affected by drought was tracked from 1985–2008. Drought-affected populations ranged from a high of just over 16 percent in 1985, a time of famine during which at least 1 million people died, to a low of about 5 percent. In 6 of the 11 years recorded, more than 10 percent of the population was affected by drought. In the most recent drought (1999–

37
2008), 16 percent of the population was affected. Higher rates of acute malnutrition and mortality are also seen during droughts, and food insufficiency resulting from drought. While households and communities may be able to recover from one drought, asset losses mount in recurrent crises, incomes fluctuate, and potential investments were postponed. These pressures have increased household vulnerability, and coping strategies were become irreversible, forcing migration.
In general Ethiopian history is punctuated by drought and famine which affected large parts of the country covering hundreds of thousands of square kilometres, and millions of households. Furthermore, most of the drought and food crisis events have been geographically concentrated in two broad zones of the country. The first consist of the central and northern highlands, stretching from northern Shewa through Wello and Tigray, and the second is made up of the crescent of low-lying agro-pastoral lands ranging from Wello in the north, through Hararghe and Bale to Sidamo and Gamo Gofa in the south (Ramakrishna and Assefa 2002) particularly the east and north of the country are the most vulnerable and have the highest food insecurity. The number of people vulnerable to acute and chronic food insecurity is always increasing as a result of dependence on rain-fed agriculture and increased frequency and intensity of droughts.
The study region is one of the regions repeatedly affected by recurrent drought and food security problems in the country. Many people live in conditions of chronic hunger with a low average energy supply due to the recurrent droughts (Devereux 2000). The spatial distribution and the frequency of its occurrence have also increased with different level of intensity, bringing significant water shortages, economic losses and adverse social consequences.
Figure 11 Frequency of droughts in Tigray, 1970-2008, source: DPPC, 2009
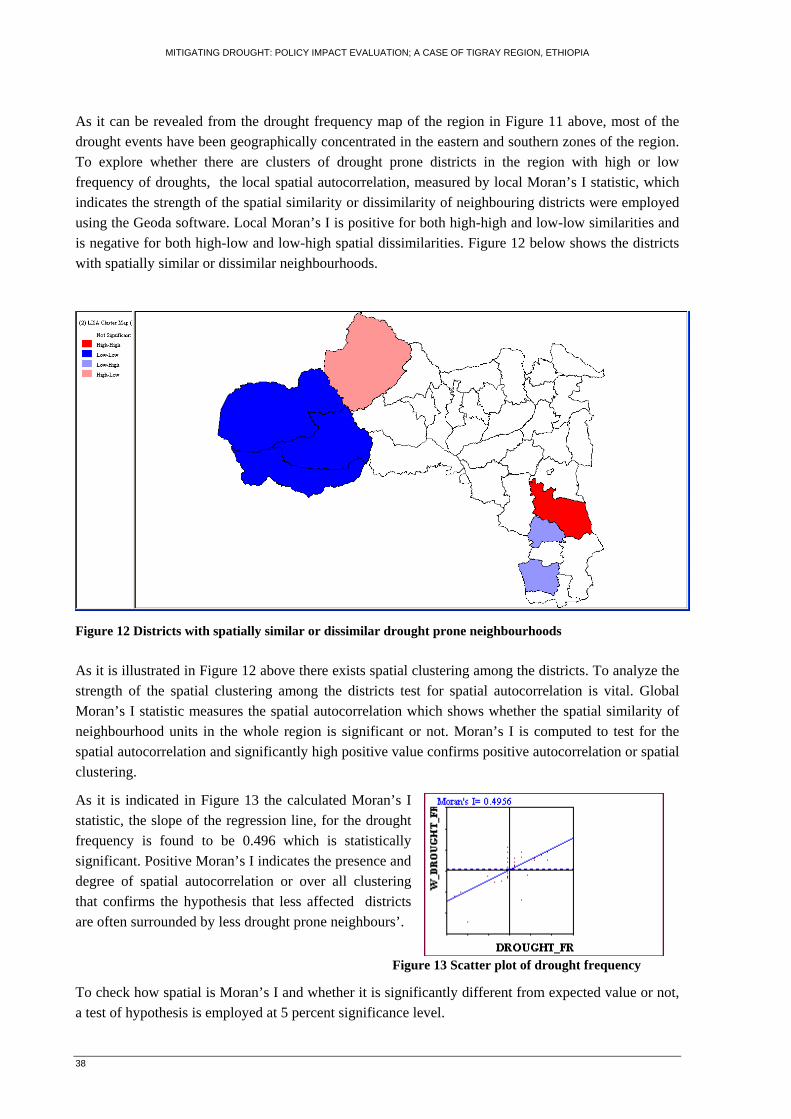
MITIGATING DROUGHT: POLICY IMPACT EVALUATION; A CASE OF TIGRAY REGION, ETHIOPIA
38
As it can be revealed from the drought frequency map of the region in Figure 11 above, most of the drought events have been geographically concentrated in the eastern and southern zones of the region. To explore whether there are clusters of drought prone districts in the region with high or low frequency of droughts, the local spatial autocorrelation, measured by local Moran’s I statistic, which indicates the strength of the spatial similarity or dissimilarity of neighbouring districts were employed using the Geoda software. Local Moran’s I is positive for both high-high and low-low similarities and is negative for both high-low and low-high spatial dissimilarities. Figure 12 below shows the districts with spatially similar or dissimilar neighbourhoods.
Figure 12 Districts with spatially similar or dissimilar drought prone neighbourhoods As it is illustrated in Figure 12 above there exists spatial clustering among the districts. To analyze the strength of the spatial clustering among the districts test for spatial autocorrelation is vital. Global Moran’s I statistic measures the spatial autocorrelation which shows whether the spatial similarity of neighbourhood units in the whole region is significant or not. Moran’s I is computed to test for the spatial autocorrelation and significantly high positive value confirms positive autocorrelation or spatial clustering.
As it is indicated in Figure 13 the calculated Moran’s I statistic, the slope of the regression line, for the drought frequency is found to be 0.496 which is statistically significant. Positive Moran’s I indicates the presence and degree of spatial autocorrelation or over all clustering that confirms the hypothesis that less affected districts are often surrounded by less drought prone neighbours’.
Figure 13 Scatter plot of drought frequency
To check how spatial is Moran’s I and whether it is significantly different from expected value or not, a test of hypothesis is employed at 5 percent significance level.

39
Moran I statistic standard deviate = 3.0009, p-value = 0.001346 alternative hypothesis: greater sample estimates:
Moran I statistic Expectation Variance
0.4960 -0.0303 0.010696
To test the above hypothesis a z-test statistic, )(
)(IS
IEIZd
−= =, is computed and a value of 5.09 is
obtained which is significant at 5% and the hypothesis that there is no spatial autocorrelation or no spatial clustering of drought prone districts is rejected. This finding is more similar with the actual at the ground where less drought prone districts are found in the western parts of the region and the chronically prone districts are found in the eastern and southern parts.
Furthermore, the study attempted to analyze the trends in rainfall using historical data of for the year 1953- 2008. Figure 14 shows the mean deviation of annual rainfall over the study region expressed for 43 stations. As it can be seen from Figure 7 below the region has experienced both dry and wet years over the last 55 years. Years like 1960, 1961, 1962, 1964, 1965, 1969, 1971, 1982, 1983, 1984, 1985, 1987, 1991, 1994, 2000, 2002, 2003 and 2007 were dry while 1954, 1955, 1956, 1958, 1959, 1963, 1974, 1986, 1996, 1998, 1999, 2001, and 2006 were wet years.
Mean deviation of annual total rainfall
-600.0
-400.0
-200.0
0.0
200.0
400.0
600.0
1954
1957
1960
1963
1966
1969
1972
1975
1978
1981
1984
1987
1992
1995
1998
2001
2004
2007
Figure 14 Mean deviation of annual total rainfall, 1953-2008; source: NMSA, 2009 From the previous analysis, it can also be inferred that the rainfall pattern over the region exhibits very high variability’s over time and are quite often accentuated with positive and negative deviations. Inter-annual rainfall variations are extremely high, and drought is common in most parts of the region. The cost of such extreme events runs to millions of dollars every year, a price that many farming communities cannot afford either to incur or to prevent. The complex impacts of recurrent drought are discussed below.

MITIGATING DROUGHT: POLICY IMPACT EVALUATION; A CASE OF TIGRAY REGION, ETHIOPIA
40
5.1. Impacts of Drought Fluctuations in the timing and duration of rains; population, land, and environmental stress; lack of physical and natural resources; structural poverty and chronic food insecurity; lack of access to infrastructure and essential services; and destructive coping strategies and lack of capacity to deal with drought emergency at the household level are the reasons for drought vulnerability affecting socio-economic conditions in Tigray region. Owing to the abnormalities in monsoon precipitation in terms of both spatial and temporal distribution, drought is a frequent phenomenon over many parts of the region. It is one of the utmost important disasters which cause instability in food production in the region and still there is hue and cry in terms of stability of food grain production as a result of drought induced crop failure.
Recurring drought disasters have multiple impacts on rural communities. Populations engaged in agriculture are particularly at risk from drought as agriculture is the main stay of the rural poor. It has been estimated that 250,000 people died and 50% of livestock in Tigray and Wollo died because of the 1972 drought. Similarly, due to the 1984 drought an estimated 8 million people affected of which 1 million people died, many livestock lost. Drought is a major hazard affecting crop and livestock production in most parts of Tigray. The impact on crops and animals was the most important.
Figure 15: Photo showing recurring crop failure due to severe droughts
Over the year’s farmers experience the worst ill effect of drought in terms of their loss of crop yield and livestock, and sometimes crop failure due to scarcity of water during peak growth stages of the crop. The magnitude of this is well understood from the fact that the region is an agricultural region with 81 percent of its population directly depend on agriculture for their livelihood (Central Statistics Agency 2008). Furthermore, the loss of income, which is a cumulative effect of impact on cropping and animal husbandry, was ranked third at most of the study locations. Impact on availability of fodder and children’s education has also emerged as significant. Furthermore, recurrent droughts have impacts on the livelihoods, food security, health, economy, and social impacts at the community level.
5.1.1. Impact of Drought on Agriculture
Droughts affect virtually all aspects of agricultural and other water-intensive activity and impact on a large proportion of households, with far-reaching consequences throughout the economy. The recent drought episodes experienced reveal that droughts are not once-off disasters. They are frequent phenomena that can be forecasted, and they will occur at least in the foreseeable future.

41
Droughts entail loss of assets in the form of crops, livestock, and productive capital damaged as a direct consequence of water shortages or related power cuts. Some of the droughts had a drastic impact on agricultural out-put, with total crop failure and massive livestock deaths being recorded in many parts of the country. For instance, the 1984 drought in Tigray led to a 61% and 94% decline in the yield of teff and sorghum, respectively (Mulat 2004). Because such a high percentage of the population is rural and depends on farmland for subsistence, variations in the weather have powerful consequences.
The capacity to cope with drought has declined because of the increasing human and livestock population pressure resulting in serious natural resources degradation. Though drought can be assumed as a natural disaster, land degradation has made the region vulnerable to drought and famine. Degradation of the agricultural resource base, particularly through intensified land use of the ecologically fragile land by a rapidly growing population together with over grazing, deforestation and soil erosion, has been partly responsible for the increasing vulnerability of the rural population to drought and famine. Such practice aggravates the vulnerability of the region to drought.
The impact of previous drought on the environment has become a major cause for concern in the country in general in the study region in particular. With a rapid population growth of about 2.8 percent per annum prevailing in the region, the pressure on the limited natural resources for increased agricultural production has been mounting, causing encroachment in marginal areas. Rapid population growth, an increasing livestock population, overstocking, and the relentless cutting down of trees have all exposed the environment to great risk during times of drought.
5.1.2. Impact on Food Production
The 2001/02 climate anomalies had a significant impact on the regional economy, by reducing the regional GDP growth from 8.44 percent in 2001 to 1.11 percent in 2002 (BOFED 2004). The trends in the contribution of agriculture to the region’s total GDP clearly explain the relationship between the performance of agriculture, climate and the total economy. Years of drought (1994/1995, 2001/2002) are associated with very low contributions. The recent drought of 2002 damaged food production in the region due to the sever drought event. Total land cultivated, and total output in 2002 was lower than in 2001. For example, total output was decreased by 52.8 percent of in the study region due to the 2002 drought. As Table 6 indicates, the output and yield of crops were reduced due to drought. Total area for cereals was reduced by 17.9 percent while output was down by more than 35.8 percent due to erratic weather. Yields were also down by about 21.8 percent, as Table 6 indicates. The yields of most pulses and other crops also declined due to the 2002 drought.
An aggregated investigation of the damage further indicates that maize was the most damaged crop in 2002 as it is indicated in Table 6. Data from the regional Bureau of Finance and Economic Development indicates the yield for this important crop was also reduced by 60 percent due to a shortened period of rain. Wheat and barley, which are very important crops on the region, were also affected by the unusual weather. The crops planted in some districts of the region (alamata, Mehoni and Raya Azebo Woredas) had completely failed. The main reasons for the food production in 2002 were the erratic rainfall during the main season (i.e. June-September). In general, the food security situation was poor. For the affected populations, recourses to market were limited because of weak purchasing power, cereal price hikes, and falling livestock prices. Households were able to cover only one to two months of food requirements from own source.
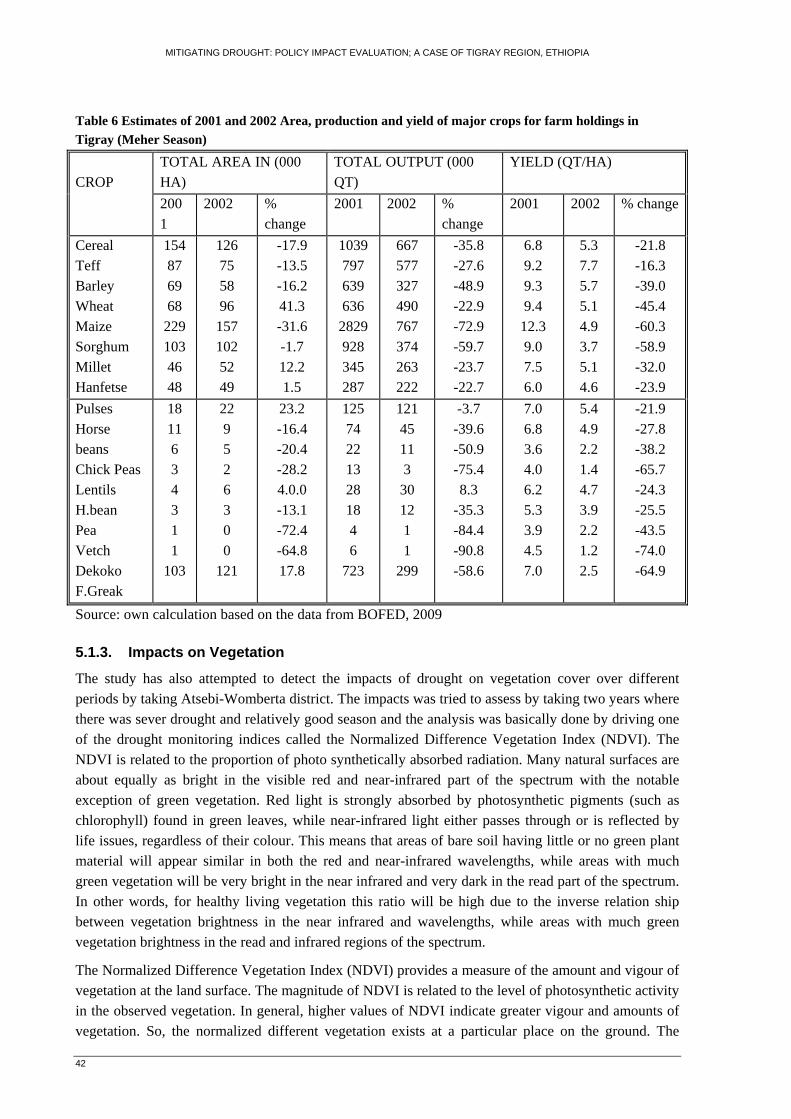
MITIGATING DROUGHT: POLICY IMPACT EVALUATION; A CASE OF TIGRAY REGION, ETHIOPIA
42
Table 6 Estimates of 2001 and 2002 Area, production and yield of major crops for farm holdings in Tigray (Meher Season)
CROP
TOTAL AREA IN (000 HA)
TOTAL OUTPUT (000 QT)
YIELD (QT/HA)
2001
2002 % change
2001 2002 % change
2001 2002 % change
Cereal Teff Barley Wheat Maize Sorghum Millet Hanfetse
154 87 69 68
229 103 46 48
126 75 58 96
157 102 52 49
-17.9 -13.5 -16.2 41.3 -31.6 -1.7 12.2 1.5
1039 797 639 636
2829 928 345 287
667 577 327 490 767 374 263 222
-35.8 -27.6 -48.9 -22.9 -72.9 -59.7 -23.7 -22.7
6.8 9.2 9.3 9.4
12.3 9.0 7.5 6.0
5.3 7.7 5.7 5.1 4.9 3.7 5.1 4.6
-21.8 -16.3 -39.0 -45.4 -60.3 -58.9 -32.0 -23.9
Pulses Horse beans Chick Peas Lentils H.bean Pea Vetch Dekoko F.Greak
18 11 6 3 4 3 1 1
103
22 9 5 2 6 3 0 0
121
23.2 -16.4 -20.4 -28.2 4.0.0 -13.1 -72.4 -64.8 17.8
125 74 22 13 28 18 4 6
723
121 45 11 3
30 12 1 1
299
-3.7 -39.6 -50.9 -75.4 8.3
-35.3 -84.4 -90.8 -58.6
7.0 6.8 3.6 4.0 6.2 5.3 3.9 4.5 7.0
5.4 4.9 2.2 1.4 4.7 3.9 2.2 1.2 2.5
-21.9 -27.8 -38.2 -65.7 -24.3 -25.5 -43.5 -74.0 -64.9
Source: own calculation based on the data from BOFED, 2009
5.1.3. Impacts on Vegetation
The study has also attempted to detect the impacts of drought on vegetation cover over different periods by taking Atsebi-Womberta district. The impacts was tried to assess by taking two years where there was sever drought and relatively good season and the analysis was basically done by driving one of the drought monitoring indices called the Normalized Difference Vegetation Index (NDVI). The NDVI is related to the proportion of photo synthetically absorbed radiation. Many natural surfaces are about equally as bright in the visible red and near-infrared part of the spectrum with the notable exception of green vegetation. Red light is strongly absorbed by photosynthetic pigments (such as chlorophyll) found in green leaves, while near-infrared light either passes through or is reflected by life issues, regardless of their colour. This means that areas of bare soil having little or no green plant material will appear similar in both the red and near-infrared wavelengths, while areas with much green vegetation will be very bright in the near infrared and very dark in the read part of the spectrum. In other words, for healthy living vegetation this ratio will be high due to the inverse relation ship between vegetation brightness in the near infrared and wavelengths, while areas with much green vegetation brightness in the read and infrared regions of the spectrum.
The Normalized Difference Vegetation Index (NDVI) provides a measure of the amount and vigour of vegetation at the land surface. The magnitude of NDVI is related to the level of photosynthetic activity in the observed vegetation. In general, higher values of NDVI indicate greater vigour and amounts of vegetation. So, the normalized different vegetation exists at a particular place on the ground. The
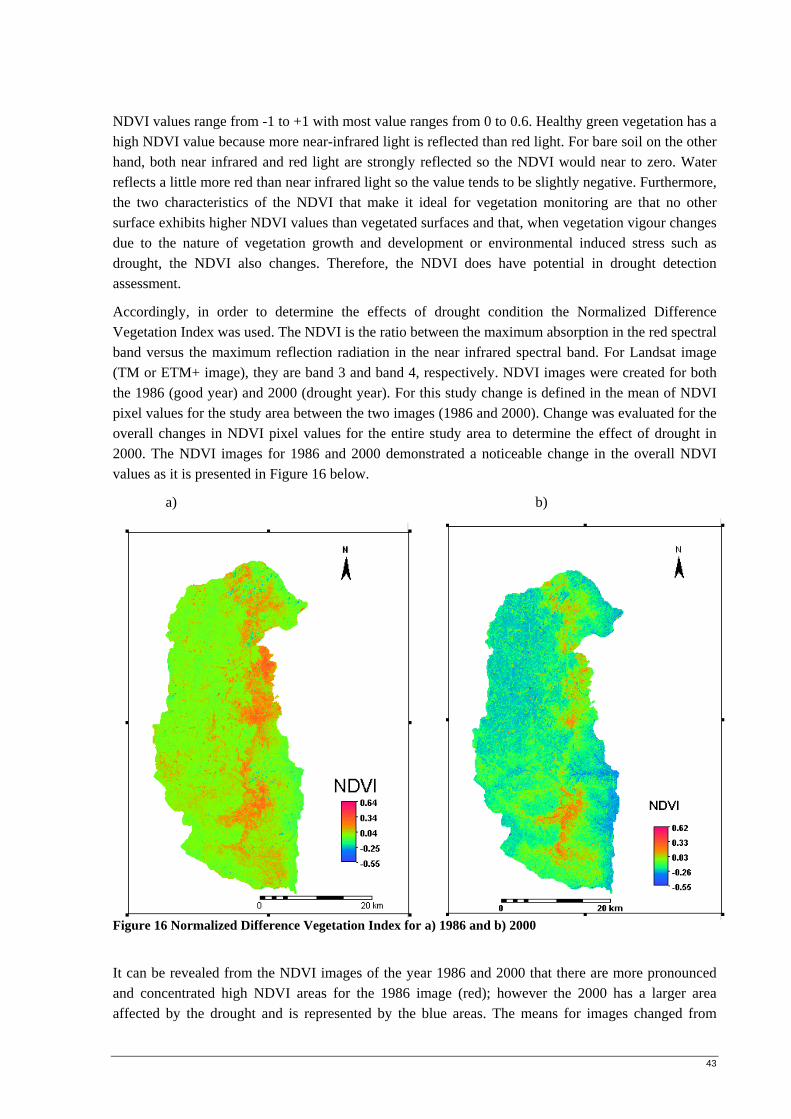
43
NDVI values range from -1 to +1 with most value ranges from 0 to 0.6. Healthy green vegetation has a high NDVI value because more near-infrared light is reflected than red light. For bare soil on the other hand, both near infrared and red light are strongly reflected so the NDVI would near to zero. Water reflects a little more red than near infrared light so the value tends to be slightly negative. Furthermore, the two characteristics of the NDVI that make it ideal for vegetation monitoring are that no other surface exhibits higher NDVI values than vegetated surfaces and that, when vegetation vigour changes due to the nature of vegetation growth and development or environmental induced stress such as drought, the NDVI also changes. Therefore, the NDVI does have potential in drought detection assessment.
Accordingly, in order to determine the effects of drought condition the Normalized Difference Vegetation Index was used. The NDVI is the ratio between the maximum absorption in the red spectral band versus the maximum reflection radiation in the near infrared spectral band. For Landsat image (TM or ETM+ image), they are band 3 and band 4, respectively. NDVI images were created for both the 1986 (good year) and 2000 (drought year). For this study change is defined in the mean of NDVI pixel values for the study area between the two images (1986 and 2000). Change was evaluated for the overall changes in NDVI pixel values for the entire study area to determine the effect of drought in 2000. The NDVI images for 1986 and 2000 demonstrated a noticeable change in the overall NDVI values as it is presented in Figure 16 below.
a) b)
Figure 16 Normalized Difference Vegetation Index for a) 1986 and b) 2000
It can be revealed from the NDVI images of the year 1986 and 2000 that there are more pronounced and concentrated high NDVI areas for the 1986 image (red); however the 2000 has a larger area affected by the drought and is represented by the blue areas. The means for images changed from

MITIGATING DROUGHT: POLICY IMPACT EVALUATION; A CASE OF TIGRAY REGION, ETHIOPIA
44
0.345 in 1986 (non drought condition) to 0.114 resulting in a 67% decrease due to drought effects in the year 2000 (drought condition).
Figure 17 Difference in NDVI between 1986 and 2000
Furthermore, the analysis on the vegetation change shows that the vegetation cover has decreased from 146,696 ha of in 1986 to 3804.5 ha in the year 2000, which was a drought period in the region as the whole. This shows that drought has impact in the vegetation cover. Furthermore, the degradation of the agricultural resource base, particularly through intensified land use of the ecologically fragile land by a rapidly growing population together with over grazing, deforestation and soil erosion, has been responsible for the increasing vulnerability of the rural population to drought and famine. To reverse the deteriorating condition of the environment due to the recurrent cycle of drought, the Regional Government of Tigray has promoted area enclosures and soil and water conservation activities to encourage natural vegetation regeneration as the main driving force for the enhancement of the natural vegetation and thereby reverse impacts of drought in the long term. The capacity to cope with drought has declined because of the increasing human and livestock population pressure resulting in serious natural resources degradation.

45
5.1.4. Impacts on health
Unhygienic conditions and drought are closely related in the study areas. During drought times water level go down and springs and streams decrease significantly and some even dry up. In addition to failure in crop production, sanitation will loose attention under the prevalence of drought conditions. This is so because of personal hygiene such as washing of body, cloth, etc. require the availability and supply of water. The prevalence of drought forces people to look for opportunities for survival including abandoning their home and migrating to camps where they see some temporary help to rescue their life. Those who are unable to move or cope up with the drought are doomed to perish. As drought persists human and livestock death toll increases compounded by poor sanitation and deteriorating natural environment. On the other hand drought shock increases the prevalence of diarrhoea among the children. According to the statistics of the Regional Health Bureau, 7,122 cases of diarrhoea in children were reported in 2003 (drought year) in the whole region, an increase of 17 percent compared with normal levels. The increase was attributed to water scarcity.
5.1.5. Impacts on Education
In addition to threatening the health and welfare of children in the affected areas, the recurrent drought is effectively suspending their education. Primary schools are closing down as children leave to help support individual family incomes during severe drought event. Schooling is not only vital to a child's development; it helps provide a sense of security and continuity during times of disaster and stress.
5.1.6. Impacts on different sexes, age groups, and livelihoods
The impact of drought on women and children needs to be emphasised. Women in these communities collect water from the nearest water source. They do work such as cooking and cleaning, rearing children, and collecting firewood. In addition, they also work in agricultural farms, earning income for their family. Women in general in the study area lack the skills needed for employment in less burdensome jobs. So they have to cope with enormous physical burdens on a daily basis. The situation worsens during droughts. With fewer water sources near the dwelling, they will have to walk long distances to fetch drinking water.
Sixty-three per cent of respondents agreed that recurring disasters have differential impacts on males and females; 74 percent of respondents believed that the women were more severely affected by the drought than the men. Respondents said that differential impacts of the drought were due to the differing needs for water of males and females. Water scarcity obliges women to walk long distances to fetch water. The survey also reiterated that older members of society and children are much more vulnerable to the drought. These impacts were attributed to the prevalence of malnourishment during drought.
In general, farmers are more affected by drought than any other section of society. This response was uniform throughout the study locations. It signifies that the primary impact of the drought is on crops. Due to insufficient water resources, both surface and subsurface, crops are often vulnerable to drought.
5.2. Conclusion
A large segment of population in Tigray is chronically or seasonally food insecure. The region is worst affected due to recurrent cycle of drought. The complex nature of drought in the region took the lives of people; entail loss of assets in the form of crops, livestock, and productive capital damaged as a direct consequence of water shortages and threatened the lives of millions of people with

MITIGATING DROUGHT: POLICY IMPACT EVALUATION; A CASE OF TIGRAY REGION, ETHIOPIA
46
starvation. Majority of the droughts had a drastic impact on agricultural out-put, with total crop failure and massive livestock deaths being recorded in many parts of the study region. The rural populations living in drier areas were the worst affected.
The capacity to cope with drought has declined because of the increasing human and livestock population pressure resulting in serious natural resources degradation. Degradation of the agricultural resource base, particularly through intensified land use of the ecologically fragile land by a rapidly growing population together with over grazing, deforestation and soil erosion, has been partly responsible for the increasing vulnerability of the rural population to drought and famine. Furthermore, the temporal analysis of vegetation change also showed that the vegetation cover has decreased from 146,696 ha of in 1986 (normal year) to 3804.5 ha in the year 2000, which was a drought period in the region as the whole. This shows that drought has impact in the vegetation cover.
Recognizing this dilemma, in 2003 the Government of Ethiopia initiated a Productive Safety Net Programme (PSNP), with the objectives of reducing household vulnerability to the effects of recurrent cycle of drought, improving household and community resilience to shocks, protect household assets so as to prevent poor households from falling further towards destitution, vulnerability to future shocks particularly drought and breaking the cycle of dependence on food aid. Thus, evaluating the impacts of government interventions carried out over the last periods is vital. These issues are discussed separately on the following chapter.

47
6. Evaluation of Government Interventions in Addressing Causes and Impacts of drought
6.1. Introduction Governments’ intervention mechanisms to minimize impacts of droughts in the past decades were very much limited. The current government has a sustainable development and poverty reduction program which call attention to protect the lives and assets of the rural poor and thereby minimize the impacts of recurrent drought as its top priority. Accordingly, different development programs and activities have been carried out to address the impacts of recurring cycle of droughts and food security problems since 2005.
This chapter evaluates government intervention mechanisms carried out to address root causes of drought and their impact in bringing changes on the resilience of rural households. These policy instruments and strategies include public works intervention such as rain water harvesting schemes, environmental rehabilitation, soil and water conservation, employment generating schemes and early warning systems. This is basically analyzed based on the official governmental reports and figures collected during field work.
6.2. Policy Framework Ethiopia's economy and its people remain largely dependent on subsistence farming. This dependency has proven to be very problematic because of a number of factors including high variability of rainfall from year to year. However frequent droughts are not the only factors contributing to Ethiopia's food security problems. The average farmer works to feed his or her family on less than two acres of land and this land is often over cultivated and subjected to intense soil erosion. Ethiopia's population growth remains very high with an annual rate of approximately 2.4%, causing further reductions in farm size. As farm size decreases the intensity of agriculture increases contributing to further land degradation and soil erosion. These perennial problems make Ethiopia one of the world’s poorest countries.
Approximately 8.5 million people, 10 percent of Ethiopia's population are facing annual food deficit due to weather fluctuations. These people are very vulnerable to the negative consequences of any variability in rainfall or other negative events. During an emergency situation their ability to survive depends on the "mining" of their already limited capital and assets including, physical assets (tools and oxen), natural assets (land and water) and human capital (education and labour). The mining of assets occurs when families take last resort actions such as taking children out of school, or selling productive assets and household goods in order to survive. These survival strategies result in long-term negative impacts. After the drought has passed, these families must rebuild their capital to become productive again; consequently, the economic impacts of a crop failure are long-term and result in lifelong reductions in earnings. With each shock, families and communities become less able to cope and fall farther into food insecurity.
Furthermore, Ethiopia's recent history makes it clear that weather related problems and annual food shortages will continue to occur regularly in the future. Truly, a new approach was needed for the lives of these drought prone households and communities to improve. Thus, the Government of Ethiopia and Donors have worked together to come out with alternative strategy to break the vicious cycle of

MITIGATING DROUGHT: POLICY IMPACT EVALUATION; A CASE OF TIGRAY REGION, ETHIOPIA
48
drought and poverty. Consequently, the Productive Safety Net Program (PSNP) was designed with the expectation addressing the root causes of drought and building households resilience in the long-term. Productive Safety Net Programs is a coherent disaster response strategy, which demands a level of sectoral integration across government bureaus and across donors.
6.2.1. Mitigation Strategies One of the lessons from Ethiopia and elsewhere is that drought results in significant impacts regardless of the level of development, although the character of these impacts will differ profoundly. Each drought produces a unique set of impacts, depending not only on its severity, duration, and spatial extent but also on ever-changing social conditions. Society’s vulnerability to drought is determined by a wide range of factors, both physical and social, such as demographic trends and geographic characteristics. One of the challenges of planning for drought is understanding its impacts, both direct and indirect.
Drought mitigation strategies have traditionally been defined in terms of improving food security at the national and household levels. Furthermore, such strategies have often been concerned with increasing long-run productivity rather than reducing output variability and so have only indirectly addressed problems of drought.
Given the devastating effects droughts can have on lives, especially of the poor, the need to respond to short term emergencies in the short-term is not up for debate. Yet responding to recurrent droughts also requires a strategic response. Droughts need to be viewed as a long-term development issue, and as such it is important to recognize that droughts require a multi-sectoral response, involving agriculture and rural development, and environmental and water resources management (Esikuri 2005). It is essential to adopt a long-term strategic framework to manage drought risks and guide investments in all aspects of a comprehensive risk based management approach targeting risk-reduction, mitigation and coping activities.
Mitigating drought or taking actions in advance of drought to reduce its long-term risk, involves a wide range of institutional activities. In the case of drought mitigation, a lot has to be done in all cases to make transition from crisis to risk management. In the case of Ethiopia, the primary focus for drought mitigation were to concentrate seriously on short-, medium- and long-term water resources development activities that involve multi-year storage facilities. In addition, more investment was planned in enhancing the resilience of rural households.
In general, there has been strong sustained interest in drought mitigation on both the governments and donors, and a number of other ways of reducing the impact of a drought through, for example, improved water conservation and management, increased planting of drought-tolerant plants, and ensuring that the risk of drought has been adequately built into strategies for promoting economic diversification.
6.2.2. Ethiopia’s Productive Safety Net Program As indicated in the program implementation manual of the Productive Safety Net Program (PSNP), Productive Safety Nets are transfers of cash and / or food, to smooth out distressed consumption patterns and protect households against loss of assets and destitution due to recurrent droughts. Therefore, the primary target of transfers is the household (FDRE 2006 ). Transfers are either through public works or through direct support. Beyond meeting immediate consumption needs, transfers can enhance productivity through labour-intensive public works, and through the multiplier effects of cash

49
transfers on the local economy. The PSNP has two core components: (1) Labour-intensive public works: - to assure a transfer to those who are very poor, but have labour that they can contribute to productive activities; and (2) direct transfers: - that meet the welfare objective of a safety net - to assure a transfer to those who are labour poor (e.g. the elderly, disabled, orphans and those that lack productive labour). Basically the productive safety net program have designed different policy instruments such as: soil and water conservation systems, constructing irrigation systems, reforestation programme, food assistance, digging wells, provision of drought resistant seeds for farmers at fair price, provision of credit facilities, provision of livestock or chicks, improving food and income security for poor women and men, construction of wells and small water reservoirs and provision of extension services.
In the Productive Safety Net food aid is planned in advance and made available during the annual hunger period; therefore the safety net helps the chronically food insecure communities before the onset of the food shortage season and before they must use negative coping strategies. By eliminating the need to sell scarce assets to survive the food shortage season during drought periods, the hard hit communities are able to retain and build upon their asset base. Thus, the program is aimed on preventing annual food shortages, build community assets that will contribute to long term productivity and reduce the need for poor families to sell assets to survive until next year. The specific objectives of the cash and food transfers provided through the PSNP include:
To smooth household consumption – to bridge production deficits in chronically food insecure farming households that are not self-sufficient, even in good rainfall years;
To protect household assets – to prevent poor households from falling further towards destitution, vulnerability to future shocks and chronic dependence on external assistance;
To create community assets – by linking the delivery of transfers to activities that are productivity-enhancing, in order to promote sustainable developmental outcomes.
This program has been operating since 2005, with an agreed plan to support 4.5 million chronically food insecure people in the drought prone districts of Southern Nations Nationalities and peoples, Amhara, Tigray, Oromiya, Dire Dawa and Harari regions (FDRE 2006 ). The programme is planned to be implemented for five years, at the end of which beneficiaries who have received predictable transfers and complementary interventions throughout the programme period will be expected to “graduate” out of dependence on external support, except during food crises. Graduation means that the household is no longer chronically food insecure and also has the economic resilience to resist falling back into chronic food insecurity in the future. Beneficiaries were more likely to have reported experiencing drought shocks and had, on average, lower levels of non-land assets.
The Productive Safety Net Program’s specific purpose is to provide clear guidance regarding the strategies and measures that must be adopted in order to improve the resilience of the rural poor in the region. At the same time, it is aimed to support related initiatives on reducing poverty. It is thus vital to evaluate the effectiveness of Productive Safety Net Program.
The primary aim of this policy evaluation on Productive Safety Net is to assess the impact of government’s intervention in improving the lives of the poor. That is to assess whether the productive safety net programs carried out have achieved their intended objectives. To do this, it is tried to assess outcomes with the program in place and compare them to outcomes without the program (i.e. the counterfactual). As it is discussed in the literature section 2.8.1, a before-and-after design is employed for the evaluation design to assess the changes in livelihood status. Time series data on various

MITIGATING DROUGHT: POLICY IMPACT EVALUATION; A CASE OF TIGRAY REGION, ETHIOPIA
50
program indicators that extends to several years before the implementation of the policy and several years after the policy is implemented is considered to look for an ‘interruption’ or ‘shift’ in the time series at the time the policy is introduced and to check that the shift is sustained over time. Thus, long-term time series analysis is carried out based on official governmental reports and figures. The before and-after evaluation on the main program instruments is discussed below.
6.3. The Productive Safety Net Program (PSNP) in Practice
6.3.1. Targeting Within the drought prone and food insecure woreda’s (districts) served by the PSNP, chronically food-insecure households were identified using a mix of administrative guidelines and community knowledge. Chronic food insecurity was defined as existing when a household faced continuous food shortages (usually having three to nine months of an annual food gap) in the last three years and received food assistance. Households that had experienced shocks that had led to severe asset losses were also eligible. Beneficiaries reported, on average, larger food gaps in the period prior to the implementation of the PSNP and they were considerably more likely to report having food gaps that exceeded three months prior to the implementation of the PSNP. Beneficiaries were more likely to have reported experiencing drought shocks and had, on average, lower levels of non land assets.
The different interventions carried out in the region through the Productive Safety Net Program are discussed below.
6.3.2. Public Works Intervention Public works programs have been started as rehabilitation activities and some have evolved into long-term development projects. Food-for-work (FFW) is the most widely used type of public work program came into effect in the study region following the recurrent droughts in the areas through which a higher share of the food aid is distributed. Food-for-work projects in the study region mainly focus on natural resource rehabilitation. The main activities are: construction of ponds, soil and water conservation structures, rural access roads, area enclosures and afforestation (when there is enough precipitation).
Public works programs are launched with various objectives in mind. Providing to poor households a source of income by creating temporary jobs is of course the most important motivation. The output of such a program is twofold: jobs of short duration for workers to increase their income, and creation of public goods in the form of new infrastructure or improvements of existing infrastructure, or delivery of services (TFSCO 2006). The different activities carried out under the productive safety net program objective and their effect on household and community is discussed below.
6.3.2.1. Rainwater Harvesting At present, almost all of the rural people rely entirely on rain-fed agriculture (crop and livestock production). Rainwater harvesting is a necessity and not an option in alleviating effects of drought and food crises in country. Possible alternatives to address food shortages and food self sufficiency in the country is to maximize the use of available rainwater through different harvesting techniques including floodwater diversion, on-farm runoff retention, soil moisture conservation, impounding in storage structures, etc. This option focuses on harvesting and utilizing as much rainwater as possible and making maximum use of it to increase production and productivity of the land. The regional government believes irrigation intervention to be a drought proofing strategy in the region. Accordingly in an effort to address the problems of recurring cycle of droughts and food insecurity,

51
the government has been engaged in a variety of water harvesting programmes to supplement the rain fed agriculture and thereby address drought and food shortages.
Notable among these is the extensive small dam-based irrigation program initiated ten years ago, within a major rural development program called Sustainable Agriculture and Environmental Rehabilitation in Tigray (SAERT). These dams, which are generally small constructions of local stone and earth, have been constructed with active participation of the communities. During the past 8 years about 60 micro dams, ranging from 50,000 to 4,000,000 m3, have been built.
More recently under the Productive Safety Net Program there has been a change in strategy with increased emphasis on water harvesting now being given to use whatever opportunities are available to exploit water resources. These include interventions that could be implemented using household labour as the major input and include river diversion, small pond construction (Horoye), and water wells. Extensive pond construction and digging of water wells has been in progress in the region since 2002/03 to provide for irrigation at a household level and perhaps as a source of drinking water as well.
Figure 18: Spatial distribution of irrigation coverage across districts in Tigray in 2008 According to the new strategy, water harvesting using ponds and construction of wells at the village or household level is proposed as a practical and effective alternative to improve the lives of rural people at little cost and with minimal outside inputs. In theory, household water harvesting can be done mainly through the effort of the individual farmer. Use of stored rainwater could supplement natural rainfall and make farming families less vulnerable to drought and therefore less dependent on outside help in harder times (Rämi 2003). Thus, water harvesting is considered as the single most important means to increase agricultural productivity and provide a source of drinking water in drought prone areas such as Tigray.

MITIGATING DROUGHT: POLICY IMPACT EVALUATION; A CASE OF TIGRAY REGION, ETHIOPIA
52
Accordingly, 18562, 22218, 36743 and 24014 totalling 101, 537 pond schemes were constructed during the period 2005-2008 at the regional level respectively; of which 65.74% of the ponds constructed are being functional. In a discussion held with pond owners at the study sites, it was acknowledged that ponds whose surface is covered or blanketed with compacted clay soil keep the stored water on average for a maximum of five weeks after the ceasing of rainfall, while ponds that are lined with black polyethylene membrane can retain water in most cases until the middle of October i.e. nearly 2 months after the rainfall ceases.
Figure 19: Farmer fetching water from his plastic lined pond
Accordingly, construction of all the water harvesting check dam is underway in the region. To supplement the task of integrated agricultural development, 3624 and 3118 different types of water harvesting check dam ponds have been constructed in the past four years in Enderta and Atsebi-womberta respectively, which would used to irrigate farmlands and assist the reclamation of gully beds and for livestock watering. The different water harvesting structures constructed in the two study districts as part of the PSNP public works is summarized in Table 7 below.
Table 7 Water harvesting structures constructed in the two woredas
Type of structure Cumulative achievement Enderta district
Atsebi-Womberta district
Total
Community Hand Dug Wells for Micro-Irrigation
886 851 1737
Underground Water Tanker 141 368 509 Hand dug well 23 15 38 Small Ponds 597 386 983 Community pond 593 607 1200 Spring Development for Irrigation 18 29 47 Spate Irrigation 53 34 87 Small Community Ponds 1259 763 2022 Small River Diversion 45 51 96 Irrigation Check Dam 1 3 4 Roof rain Water Harvesting 6 7 13 Source: district rural agriculture and rural development
The economic value of the constructed water harvesting dams to the community is very high. It is observed that beneficiaries are able to harvest vegetables through irrigation from the dams. Furthermore, water harvesting scheme makes cultivation of crops twice or more a year possible, as well as the possibility for supplementary irrigation when rain stops early. This intervention has also

53
helped farmers’ to shift to high value crops (production of fruits, cash crops and vegetables) with an increased likelihood of using improved inputs due to reduced risk of crop failure due to drought and increased yield due to input complementarities. This has helped the individual farmer to obtain additional income and increase household consumption; and have a direct effect on household welfare in terms of improved nutrition due to improved dietary intake because of increased income and due to increased growing of vegetables and fruits on home gardens.
Figure 20: Well-grown fruit in the home garden
In general, the present effort of the Government to harness and develop the water potential of the region by promoting construction of small irrigation schemes, diversions, ponds and wells can be regarded as a major pillar in addressing the recurring cycle of drought and food shortages under the Productive Safety Net Program. In a nutshell rain water harvesting schemes carried out by the regional government under the productive safety net program are offering the farmers a possibility of mitigating water stress thereby reducing risks of crop failures due to cycle of recurring drought and thereby playing a great role in the regional food security.
Effect of Irrigation on Cropping Pattern and Production
Access to reliable irrigation has been regarded as a powerful factor which provides a greater opportunity for cropping intensity, multiple cropping and crop diversification (Saleth, Samad et al. 2003). Hence, an attempt was made in this study area to analyze the impact of irrigation, on cropping intensity and crop diversification. Based on the information collected from the household survey the following descriptions were found in relation to the effect of water harvesting in cropping pattern, multiple cropping and crop diversification.
Prior to the introduction of the household level water harvesting in 2005, a majority of households in the study areas produced main staple crops such as teff, maize, sorghum, wheat and barley. Dry season vegetable and fruit cultivation were limited only to households who had access to irrigation from river diversion and micro dams. However, after the introduction of the water harvesting irrigation at the household level (mainly shallow well and deep well irrigation), dry season horticultural crop production was found to have become common practice. It is observed that many farmers are now producing high value horticultural crops such as potato, tomato, pepper, onion, cabbage, as well as fruits such as papaya, and mango. It can be conclusively demonstrated, therefore, that the availability of dependable water from water harvesting schemes does significantly contribute to crop pattern

MITIGATING DROUGHT: POLICY IMPACT EVALUATION; A CASE OF TIGRAY REGION, ETHIOPIA
54
diversification. This includes a shift from the traditional cropping pattern towards the inclusion of high valued crops.
Furthermore, introduction of water harvesting schemes allows crops to be grown in the dry season and thereby increasing household crop production and food security. This can be seen from the before-and-after assessment on food production, which shows food grain production has grown annually at an average of 7.6% in 1998-2004 as it is depicted in Figure 21 below. Thereafter the regional crop production is growing annually at an average of 27.4% from 2005-2008 coupled with positive shift in public policy. It is also observed that the increased in production was not due to the expansion of cultivated land; it is generally attributed to the sectors structural transformation as a result of encouraging policies.
0
200
400
600
800
1000
1200
1400
1600
1800
1998 1999 2000 2001 2002 2003 2004 2005 2006 2007 2008
Prod
uctio
n in
"00
0" M
T
Figure 21: Trends in Crop production, 1997-2008 at the regional level Similarly, the trend in crop production illustrated in Figure 22 below also shows an increasing trend have been realized in both the study districts after the governments has shifted its focus toward promoting water harvesting scheme, under the productive safety net program. Thus, it can be observed that government intervention have been effective and this can be seen from the before-and-after assessment on food production assessment which shows food grain production has grown annually at an average of 3.54% and 3.79% in Atsebi-Womberta and Enderta districts respectively in the year 1997-2004 as it is depicted in Figure 22 below. Thereafter the regional crop production has been growing annually at an average of 19.88% and 10.6% in Atsbi-womberta and Enderta districts respectively from 2005-2008 coupled with positive shift in public policy. It is also observed that the percentage of increase in production is not evenly distributed spatially across the two districts. In general it can be observed that the increased in production is generally attributed to the agricultural sectors structural transformation as a result of encouraging policies.
Y= 86.13x-171643 R2 =0.59

55
0.0
5.0
10.0
15.0
20.0
25.0
1998 1999 2000 2001 2002 2003 2004 2005 2006 2007 2008
Prod
uctio
n in
"00
0" M
T
0.0
10.0
20.0
30.0
40.0
50.0
60.0
Atsebi-womberta Enderta
Figure 22: Trends in Crop production, 1997-2008 in the study sites
Based on the before-and-after evaluation, it is observed that annual food grain production had been increasing since 2004 in both districts. Moreover, it was attempted to investigate on the change in food aid dependent population by taking one of the study districts based on the data obtained from the district rural and agricultural development office.
Figure 23: Spatial distribution of change in food aid dependent population in Atsbi-Womberta district, within 2004-2008

MITIGATING DROUGHT: POLICY IMPACT EVALUATION; A CASE OF TIGRAY REGION, ETHIOPIA
56
The general trend on the spatial distribution of proportion of food aid dependent population across the different tabia’s (villages) shows that the proportion food aid dependent population over the period has decreased in all the villages as it is illustrated in Figure 23 above. The decrease in the number of dependent population over the period of 2004-2008 ranges from 48.9% to 75.8% in some villages. In general the before-and-after assessment revealed that the productive safety net program impacts positive change across different tabia’s (villages) in the studied district as it is shown in the Figure 23 above.
6.3.2.2. Impacts on Environmental Rehabilitation
Natural resource degradation like soil erosion is severe in the region and constrains agricultural production. Impacts of drought have been exacerbated by environmental degradation from extensive deforestation and land over-exploitation. In general environmental degradation is a serious challenge in the study region. Many highlighted the urgency of reversing the land deterioration in the region to halt the socio-economic and ecological problems of the region. Having realised the seriousness of the problem, the government and the people in the region are trying to rehabilitate degraded lands in an effort to reverse the problem. Thus, different community support activities aimed at developing the agro-economic infrastructure necessary to combat the challenges of drought have been carried out over the past years. Some of the achievements realized under the productivity safety net program are discussed below.
Area enclosure
One of the reasons for the decline of land productivity in many areas is the removal of forest and vegetation cover due to increased human population pressure. However, in dry lands livestock rearing, which is the major stay of the economy, also bear a particular force in hastening the degradation process (Baumer 1990). This is because; traditional practices of animal husbandry are based on keeping large number of stock and free access to arable lands after each crop harvest. This continuous grazing with the animal number more than the carrying capacity of the land strips-off the ground cover plant and thus, leaves soil bare. Hence, the soil will be easily vulnerable to the prevailing erosive winds and torrential rains. As a consequence, many of the dry land areas are now characterised by food-, feed- and fuel wood deficits, erosion problems and associated declining soil fertility.
These days, after the introduction of the Productive Safety Net Program (public works sub-component) efforts are underway to replenish the denuded vegetation of the region in line with the need to cater land degradation, livestock fodder and other tree products. To this effect, enclosing areas has been instrumental towards materialising the major goal; achieving conservation based sustainable agriculture. It is also a means to maintain biodiversity in the drylands of the region within the rural community (Kindeya 2003).
In the program implementation period (2005–2008), using PSNP public works a total area of 33,559 and 36267 hectares of the existing area enclosures and 5948 and 7,634 hectares new badly eroded sloppy and very bare land have been enclosed with the participation of the community of Enderta and Atsebi-womberta districts. The enclosed land is protected from any interference of human being and livestock entrance until the area is being rehabilitated, minimum for about 3 years. Thereafter it will be handed over to the community. The great vegetation recovery in these managed sites is evident from Figure 24 below.

57
Figure 24 Some of the catchments in the study area
It is observed during the field visit that there are encouraging experience with area enclosures in different parts of the study districts as indicated in Figure 24, the impact being the restoration of vegetation and increase of available fodder. The land now produces some grass, though still not enough as compared to the fodder needs of the local community. In addition it is protecting downstream areas from erosion while at the same time improving infiltration and ground water conditions; as a consequence there are springs re-emerging and providing water for longer periods of time down stream.
It is also observed that communities are empowered to administer, enhance and utilize their common resources. Almost all districts have one or more participatory forest management agreements. Forests are protected with bylaws whereby the community set rules and regulations though which trespassers will be punished. These bylaws have been agreed upon by communities and participation of local community was given due emphasis in the management and rehabilitation of common resources, which is a good experience in the management of common resources.
Soil and Water Conservation
To reduce soil erosion and improve water retention and vegetation coverage of areas as an objective it has been carried out different physical structures of soil and water conservation in communal land. During the past four years of the productive safety net program implementation period, a vast area of land is covered with soil and water conservation to rehabilitate the degraded land. It is thus observed that in the study sites 395,243 and 493,126 hectares of land is covered by soil and water conservation activities in Enderta and Atsebi womberta districts respectively. Besides, to combat gully formation and stabilize the channel gradients, a range of different sized gullies 1,936,052 m2 and 1,838,766 m2
had been reclaimed and catchments had been treated in Enderta and Atsebi-womberta districts respectively.

MITIGATING DROUGHT: POLICY IMPACT EVALUATION; A CASE OF TIGRAY REGION, ETHIOPIA
58
Furthermore, reforestation programmes have been carried out in the study areas to as a part of combating drought and desertification, and have been priorities for the regional government for the past five years. The data from the district office of Rural and Agricultural Development of Enderta nd Atsebi-womberta shows that about 1,034,521 and 1,375,452 various tree seedlings were planted on communal land in Enderta and Atsebi-wemberta districts respectively. The survival rate in first count is found to be 72% on communal lands Figure 25. During the field visit it was observed that there are beneficiaries of productive safety net generating income from selling of trees, and also used for fuel wood.
Figure 25: Reforestation site in the study site In summary governmental figures and reports show that a lot of interventions have been accomplished under the productive safety net program to rehabilitate the environment and thereby halt the socio-economic and ecological problems of the region. Different community support activities aimed at developing the agro-economic infrastructure necessary to combat the challenges of drought have been carried out over the past years. But can these changes realized from the environmental rehabilitation be validated using remotely sensed data? This is basic issue is discussed below.
6.3.2.3. Vegetation change detection using Remote Sensing To validate the effects of government intervention realized on rehabilitating the environment, vegetation change detection was made using Remote Sensing data over the last eight years period. The analysis was conducted over a total area of 49,255 hectare which is primarily allocated for vegetation growth in Enderta district, one of the study sites. This area is located in the eastern part of the district and is currently enclosed for the enhancement of natural vegetation. The Government of Tigray has been promoting area enclosures to encourage natural vegetation regeneration and thus this part of the area was selected for vegetation change analysis in the context of policy impact evaluation. The image processing included digitizing the district image to the study area, area enclosure. This was accomplished by creating a shape file in ArcGIS from the district shape file, which was latter exported in to Ilwis for the NDVI processing from the Landsat images.
The first step in analysing the vegetation change detection was the selection of appropriate satellite images in order to optimise the accuracy. The main criteria used in the selection process were time of acquisition of the images and the sensor types. Since the analysis focused on vegetation different criteria were used in the selection of the images. Accordingly, the satellite images selected to perform the change detection analysis for vegetation cover were Landsat 7/ETM+ acquired on January 5, 2000 and the Landsat 7/ETM+ acquired on February 2, 2007. In addition to the similar sensors, these images were selected mainly due to similar date of acquisition. Although they have a temporal

59
difference of fourteen years, both images were taken in the dry season according to the seasonal calendar of the study area.
The Normalized Difference Vegetation Index (NDVI) was calculated for both the images at the different time periods and this NDVI provides a measure of the amount and vigour of vegetation at the land surface for both years at it is illustrated in the Figure 26 below. The NDVI measure is basically employed in the study due to the two characteristics of the NDVI that make it ideal for vegetation monitoring: no other surface exhibits higher NDVI values than vegetated surfaces and that, when vegetation vigour changes due to the nature of vegetation growth and development or environmental induced stress such as drought, the NDVI also changes, Tucker 1987 cited in (Gadisso 2007).
Figure 26 NDVI of the area enclosure at 2000 and 2007
A vegetation index differencing technique was used for change detection analysis. According to Lu et al. (2004), the vegetation index differencing has the advantage of emphasising differences in the spectral response of different features and reducing impacts of topographic effects (Lu D., Mausel P. et al. 2004). In order to perform the differencing, the NDVI image of ETM+ of 2000 and ETM+ 2007 were interactively stretched to have the same NDVI values. Then the 2000 image was subtracted from the ETM+ 2007 image to obtain the difference image. Finally, the classification threshold values were determined by slicing techniques on the different images by carefully fixing the thresholds and the result is shown in Figure 27 below. So, all the percentages have been calculated on the base of this as it is illustrated in Table 8.
Table 8 Results of vegetation change analysis
DEGREE OF INCREASE TOTAL AREA INCREASED (HA) Strong increase (dense) 1,143 Moderate increase 16,662 Total increase 17,805
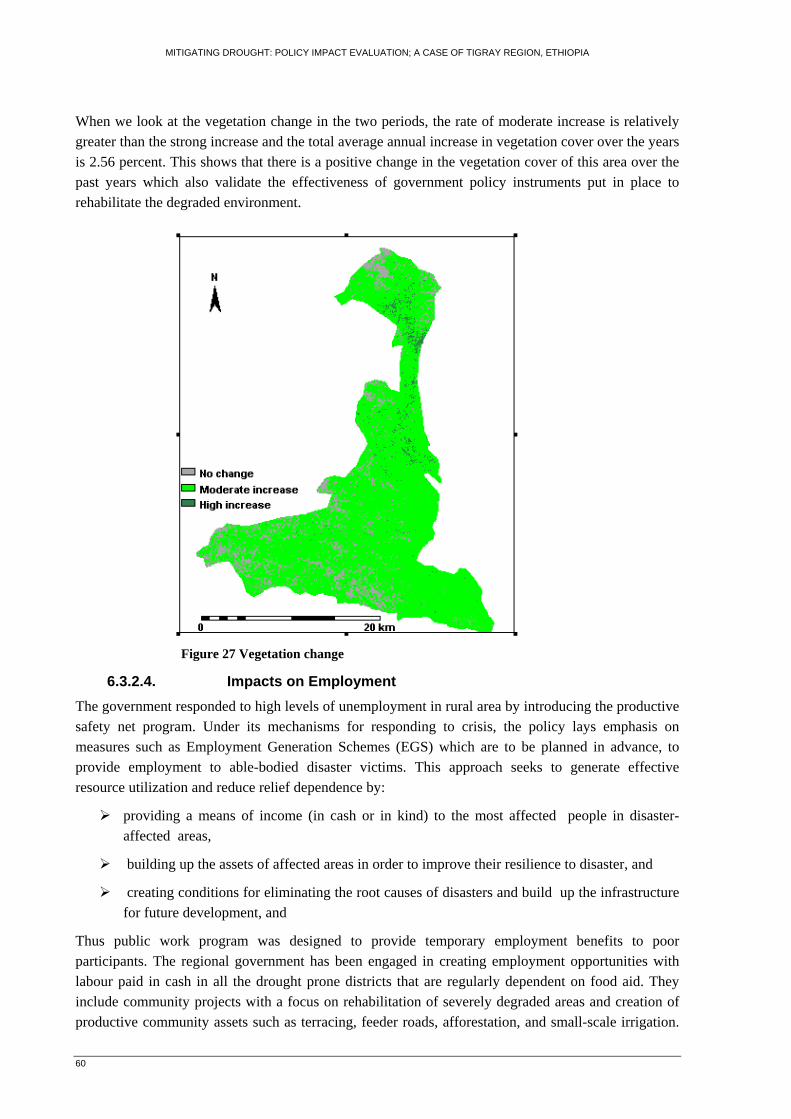
MITIGATING DROUGHT: POLICY IMPACT EVALUATION; A CASE OF TIGRAY REGION, ETHIOPIA
60
When we look at the vegetation change in the two periods, the rate of moderate increase is relatively greater than the strong increase and the total average annual increase in vegetation cover over the years is 2.56 percent. This shows that there is a positive change in the vegetation cover of this area over the past years which also validate the effectiveness of government policy instruments put in place to rehabilitate the degraded environment.
Figure 27 Vegetation change
6.3.2.4. Impacts on Employment The government responded to high levels of unemployment in rural area by introducing the productive safety net program. Under its mechanisms for responding to crisis, the policy lays emphasis on measures such as Employment Generation Schemes (EGS) which are to be planned in advance, to provide employment to able-bodied disaster victims. This approach seeks to generate effective resource utilization and reduce relief dependence by:
providing a means of income (in cash or in kind) to the most affected people in disaster-affected areas,
building up the assets of affected areas in order to improve their resilience to disaster, and
creating conditions for eliminating the root causes of disasters and build up the infrastructure for future development, and
Thus public work program was designed to provide temporary employment benefits to poor participants. The regional government has been engaged in creating employment opportunities with labour paid in cash in all the drought prone districts that are regularly dependent on food aid. They include community projects with a focus on rehabilitation of severely degraded areas and creation of productive community assets such as terracing, feeder roads, afforestation, and small-scale irrigation.

61
In 2005, the productive safety net program reached 0.9 million chronically food insecure people in rural areas, expanding to 1.4 million people in 2008. In 2008 the program generated many days of public works. The program enabled the move from emergency food towards cash transfers, with up to 1,105,359 beneficiaries receiving cash transfers in 2008 for their participation in the program.
It is observed that the Productive Safety-Nets Program (PSNP) is a key income source of the poor and very poor. The poor and very poor rural households had the opportunity to find employment (eg as daily wage labourers, guards etc.). They each have a maximum of 5 household members participating in the program, and earn a daily wage 8 times per month for 6 months. They earn a total of 900 ETB. PSNP contributes approximately more than one third of the income for the very poor and poor. Ehui and Pender (2003) has also found that food-for-work and cash-for-work projects accounted for 40% of non-farm income in Tigray, cited in (Holden, Shiferaw et al. 2004).
Furthermore, the regional government has carried out different intervention to empower rural households’ access to physical infrastructure. It is observed that there has been substantial investment made in rural areas in physical infrastructure, especially roads. The total length of rural roads in the region was estimated to be about 3360km in 2004, of which 2000 km was community road. The total length of roads in the region has increased to about 8606.20km in 2008, of which 7246.212 km is community road. Excluding the community roads the road density of the region has increased from 47 km per 1000 square kilometre in 2004 to 61km per 1000 square kilometres in 2008. The before-and-after assessment on government interventions revealed that the rural poor has better access to physical infrastructures now than it was in 2004.
Thus, it can be concluded that the safety net program has contributed in raising incomes of the poor without leaving their home and their capacity to acquire food through employment generating activities. Besides it has helped the poor to get employment easily in their village (with out leaving their home) and many managed to buy oxen to promote their farm. In a nutshell, the productive safety net programs have enabled the poor to engage in livelihood strategies that offer the potential for pathways out of poverty, by providing risk mitigating opportunities.
6.4. Early warning System (EWS) The effectiveness of government responses to drought-related food crises depends on many factors including the political set-up of the government; emergency preparedness and response capacity of the government; and availability of reliable food security information. The immediate response is to mobilize the necessary resources and meet the immediate food requirements of those affected. This may include: using contingency funds, reallocating funds from development projects and requesting humanitarian aid through international emergency appeals. While addressing the immediate food crises governments recognize the need for developing comprehensive national response mechanisms that would ensure timely intervention that would protect the livelihoods of their populations.
The EWS “is a program established to monitor and warn the threat of disasters ahead of time to trigger timely, appropriate, and preventive measures”. To achieve this objective early warning committees are established at regional, zonal and woreda levels besides the National Early Warning System (EWS). This helps the system to be more decentralized.
The National Early Warning System has tried to use different approaches and mechanisms to collect information and data on different indicators including crop, livestock, cash, market, social, demography, nutrition, health, and stress indicators and coping strategies; and to refine its information.

MITIGATING DROUGHT: POLICY IMPACT EVALUATION; A CASE OF TIGRAY REGION, ETHIOPIA
62
Due to the recurrence of drought-induced food shortage, the system has increasingly become effective and efficient.
Figure 28: EWS at the study region Examining the performance of the early warning systems put in place over the last periods, the early warning systems were highly effective in preventing the repeated occurrence of the types of famines that struck Ethiopia in general and the study region in particular in the 1970s and 1980s. The government has developed a fairly credible early warning system and has predicted, on a number of occasions, disasters well in advance such as the recent unprecedented 2002/2003 large scale emergency in which over 13 million people were affected. This information has induced government, donor, UN and NGO humanitarian responses on an adequate scale to prevent the mass migration of vulnerable populations to famine camps, thereby avoiding the worst of the famine images that were once synonymous with Ethiopia.
The rapid and effective response to localized pockets of drought prone areas shows the advantage of a decentralized district level system, where the decision makers are close to, and more familiar with the situation to which they are responding, compared to distant decision making in centralized EWS. The response in 2002/03 was successful because of a well developed and sensitive EWS, some preplanning of relief interventions, aid resources allocated in advance for destocking, responsibility delegated to the district level where EW practitioners and decision makers were in close and regular contact.
Furthermore, EWS are the means of detecting stress on livelihoods and providing timely information for decision makers before lives are threatened. It is thus observed that the Early warning system has given emphasis on monitoring both endowments such as rainfall, crop and vegetation, and entitlements such as markets, assets, and opportunities to change livelihoods, which makes the system capable of detecting stress on livelihoods.
Despite good developments of early warning systems, several key issues are of concern which was observed during the key informant’s discussion with regional Disaster Prevention and Preparedness

63
commission. The lack of baseline data to serve as benchmark for early warning information; poor understanding of the local economy to detect localized problems; lack of coordination in information collection; poor infrastructure and communication system for timely information flow; and inadequate institutional capacity to analyze information at woreda level constitute its weaknesses.
6.5. Conclusion The regional government has designed Productive Safety Net Program (PSNP) which is part and parcel of the Plan for Accelerated and Sustainable Development to End Poverty (PASDEP) of the country. Since 2005 different activities have been carried out to reduce household vulnerability to the effects of recurrent cycle of drought, improving household and community resilience to shocks, protect household assets so as to prevent poor households from falling further towards destitution, and to break the cycle of dependence on food aid.
The government’s PSNP interventions are effective solutions in mitigating the root causes of drought the study region. Activities such as water harvesting schemes could be stated as a success intervention in most districts of the region. Irrigation and rain water harvesting schemes carried out by the regional government are offering the farmers a possibility of mitigating water stress thereby reducing risks of crop failures. The irrigation interventions are becoming a drought proofing strategy in the region.
Furthermore, the productive safety net programs are playing a significant positive impact in household and community asset creation, employment generation and thereby increasing household’s income. It is also observed that government interventions are bringing encouraging changes on rehabilitate the environment which is vital to halt the socio-economic and ecological problems of the region. More importantly, Remote Sensing data was employed to detect the vegetation change over the policy implementation period, and the finding of the study showed that there is positive changes in the vegetation cover of over the past years which also validate the effectiveness of government policy instruments put in place to rehabilitate the degraded environment in the study area.
In summary based on the times series data collected from the governmental bodies, the different intervention carried out under the PSNP have been achieving their intended objectives. The before-and-after assessments on the different indicators revealed there is change or sustained improvement since the introduction of the policy. Accordingly it leads to a conclusion that government interventions carried out over the past five year were effective in improving the lives of the poor. However, it will be unrealistic to conclude that all the changes realized currently are only due to the government productive safety net programs carried out in the past few years. Because first policies do not operate in vacuum, there is a wide network of interaction between different policies operating at any given moment. Furthermore, NGO’s have played a fundamental role in financing and advocacy regarding the targeting of the program and this has been played for the smooth implementation of the policy. Furthermore, making overall concluding remarks on effectiveness of governmental intervention by relying only on governmental figures without considering the perception and opinions of the target beneficiaries on changes in their livelihood brought by the policy may lead to a subjective conclusion. Thus, validating the impact of government’s intervention based on the opinions of the beneficiaries is vital. This issue is discussed separately in chapter seven.

MITIGATING DROUGHT: POLICY IMPACT EVALUATION; A CASE OF TIGRAY REGION, ETHIOPIA
64
7. Household Opinions Public policy is a guide to government action that sets the range of possibilities for the choices made by the public at large. Thus, government policies affect every facets of living. Policy evaluation determines policy outcomes in reference to their efficiency, and effectiveness. Thus, evaluating impacts of policy in improving the lives of the poor is vital. However, drawing overall conclusion on effectiveness of governmental intervention by relying only on governmental macro-data’s would be unrealistic without considering the perceptions of the target beneficiaries. This is because measuring the impact of government interventions through government macro-data will not show the desired outcome or its effectiveness from the beneficiary’s perspective on the rural households and it is also impossible to check to what extent the beneficiaries have benefited from the governmental interventions. Besides, government macro-data might be exaggerated for political benefits and relying only on government macro-data’s may lead to a subjective conclusion.
Thus, validating the effectiveness of government’s policy intervention based on the opinions and perceptions of farm households is crucial. Data collected through the sample household survey can provide useful insights into some the effects of the policy issues. Moreover, household surveys measure the impact of policies and interventions affecting their livelihoods. Only household surveys can provide beneficiary’s-based information about how government policies affect the well-being of individuals and perceptions on access.
Accordingly, one of the objectives of the study is to validate the effectiveness of government’s policy intervention based on the opinions and perceptions of farm households in the study region. In order to attain this specific objective, household data were generated and analyzed through the assessment of household’s perceptions and opinions on policy interventions; and to directly quantify the livelihood status of households and to examine the kind of relationship that exists between the productive safety net status at current and the various factors influencing livelihoods status at the household level.
To meet this objective primary data from sample household was collected from two drought prone districts. The two districts were chosen randomly from the drought prone districts of Southern and Eastern zones. The survey gathered qualitative and quantitative data pertaining to social, demographic and economic aspects of households. The analysis is based on data from a sample of 90 households randomly selected. The sample units were chosen from the six tabia’s using a random sampling method.
This chapter evaluates the impacts of government intervention on household income, crop pattern and crop production, household asset protection and creation, reducing food aid dependency and distress sale of assets. Results and discussions of the studied households are discussed below.

65
7.1. Descriptive Results
This section provides the descriptive results of the studied households’.
7.1.1. Education level of Household Head
The level of education (years of schooling) of a rural household plays an important role in improving the productivity (both at individual and organizational level) by equipping people with the skills and knowledge to actively participate in the economic endeavours of the society, and in promoting entrepreneurship (Phillips 1994). Therefore an attempt was made to assess the educational level of the respondents. It was found that approximately 58.9% of the households in the study sites did not read or write and were therefore illiterate, while 35.6% of the respondents had a primary school education; with very few respondents having had access to secondary school as it is depicted in Table 9 below.
There was very little difference found in the number of household heads who attended formal education in all the study areas. When education levels were cross tabulated with sex, there were higher numbers of men (31%) literate than women (12%). This difference is also statistically significant ( 2χ = 9.73, p <0.01). It suggests that relative to men, women are obviously disadvantaged in education.
Table 9: Educational characteristics of the sampled households Level of education Total Illiterate Primary Junior Secondary tabia Barka Adi
Sebha Count 9 6 0 0 15 % within tabia 60.0% 40.0% .0% .0% 100.0%
Felege Weyeni Count 4 10 1 0 15 % within tabia 26.7% 66.7% 6.7% .0% 100.0%
Lemelem Count 12 3 0 0 15 % within tabia 80.0% 20.0% .0% .0% 100.0%
Mahebere Genet
Count 11 4 0 0 15 % within tabia 73.3% 26.7% .0% .0% 100.0%
May-Genet Count 9 6 0 0 15 % within tabia 60.0% 40.0% .0% .0% 100.0%
Ruba Felege Count 8 3 2 2 15 % within tabia 53.3% 20.0% 13.3% 13.3% 100.0%
Total Count 53 32 3 2 90 % within tabia 58.9% 35.6% 3.3% 2.2% 100.0%
Source: sample survey, 2009
7.1.2. Farm Size and Land Holding
In an agrarian society like Ethiopia, ownership of land, particularly cultivated land as well as ownership of livestock is referred to as productive assets. These assets are a prerequisite in the productive activities for agricultural production. As participants in the focus group noted land size and land fertility are the most important factors for differences in agricultural production and wealth disparities and difference in coping mechanisms between households. The research then seeks to examine whether land holding per household vary among the sample study areas and household land holding size has relationship with type of type of irrigation system owned.

MITIGATING DROUGHT: POLICY IMPACT EVALUATION; A CASE OF TIGRAY REGION, ETHIOPIA
66
The study indicated that the average household land holding size was 0.54 hectare, which is below to the national average land holding of 1.02 hectare. It is found that that the average land owned per household in the Enderta study sites (Lemelem, Mahebere Genet and May Genet) are relatively lower than the Atsebi-Womberta study sites (Ruba Felege, Felegeweyni and Barka Adi Sebha). Its also fond that the distribution of land ownership is skewed with the majority of sample households (98%) having less than 0.75 hectare, and only 2% of households owning between 0.75 to 1 hectare. The study attempted also to compare the overall land holding size among the study groups. The study shows that the land holding per household among the study group is almost similar.
Table 10: Household land holding size (in Hectare) Frequency Percent Cumulative Percent Valid <=0.25 4 4.4 4.4
0.26-0.50 71 78.9 83.3 0.51-0.75 13 14.4 97.8 0.76-1.0 2 2.2 100.0 Total 90 100.0
Source: field survey 2009
7.1.3. Rural Credit Services Analysis of the survey results indicated that approximately 84.4% of the sample households had borrowed from different credit sources during the 2008 production year. This indicates that the contribution of micro finance institutions and household productive safety net programs were immensely significant in providing livelihood initiative and capital alternatives to the local people.
The main credit sources in the study areas are Dedebit Credit and Saving Institution (DCSI), service cooperatives, associations such as women’s associations also provide credit services to their members. Moreover, non formal sources were also providing micro credit services to the community. These included: relatives, friends, local moneylenders, local community insurance (Iddir) or rotating savings and credit associations (Equb).
In general DCSI has been the main credit provider in the study areas: providing credit and saving services for household agricultural packages of the productive safety net program packages and micro business activities. The highest proportion of respondents who received credit was in May Genet tabia (with 93.3%) and lowest in Lemelem tabia (66%). The average loan size per household was estimated to be ETB 1,575; with minimum and maximum of ETB 500 and 5,000 respectively. The credit was predominantly used for the purchase of farm inputs such as treadle pumps, fertilizer, seed, pesticides and livestock - for draft oxen or cattle. Some households needed credit as a start-up capital for petty trading activities. Moreover the survey showed that the average amount of credit taken by irrigation user and non irrigation user households was found to be ETB 2652 and 1,328 respectively. The slightly higher amount of credit for irrigation could possibly be attributed to the fact that the loan included water harvesting materials such as a treadle pump or motorized pump.
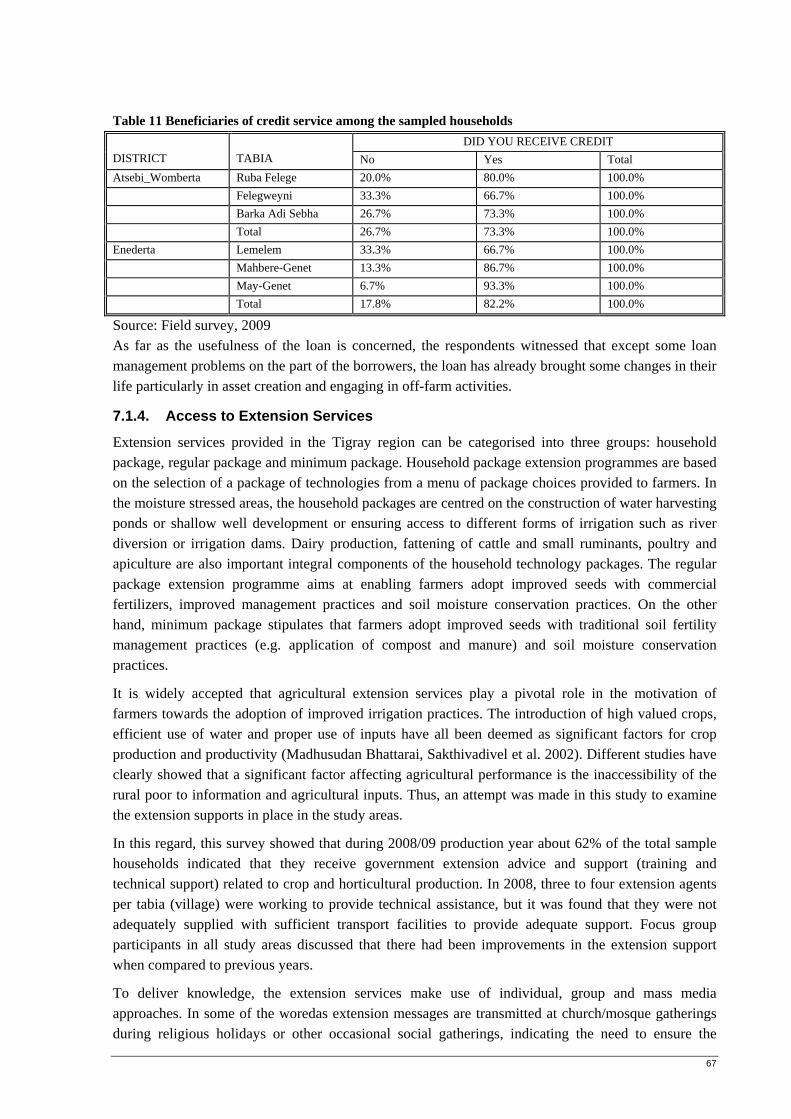
67
Table 11 Beneficiaries of credit service among the sampled households DISTRICT
TABIA
DID YOU RECEIVE CREDIT No Yes Total
Atsebi_Womberta Ruba Felege 20.0% 80.0% 100.0% Felegweyni 33.3% 66.7% 100.0% Barka Adi Sebha 26.7% 73.3% 100.0% Total 26.7% 73.3% 100.0% Enederta Lemelem 33.3% 66.7% 100.0% Mahbere-Genet 13.3% 86.7% 100.0% May-Genet 6.7% 93.3% 100.0% Total 17.8% 82.2% 100.0%
Source: Field survey, 2009 As far as the usefulness of the loan is concerned, the respondents witnessed that except some loan management problems on the part of the borrowers, the loan has already brought some changes in their life particularly in asset creation and engaging in off-farm activities.
7.1.4. Access to Extension Services
Extension services provided in the Tigray region can be categorised into three groups: household package, regular package and minimum package. Household package extension programmes are based on the selection of a package of technologies from a menu of package choices provided to farmers. In the moisture stressed areas, the household packages are centred on the construction of water harvesting ponds or shallow well development or ensuring access to different forms of irrigation such as river diversion or irrigation dams. Dairy production, fattening of cattle and small ruminants, poultry and apiculture are also important integral components of the household technology packages. The regular package extension programme aims at enabling farmers adopt improved seeds with commercial fertilizers, improved management practices and soil moisture conservation practices. On the other hand, minimum package stipulates that farmers adopt improved seeds with traditional soil fertility management practices (e.g. application of compost and manure) and soil moisture conservation practices.
It is widely accepted that agricultural extension services play a pivotal role in the motivation of farmers towards the adoption of improved irrigation practices. The introduction of high valued crops, efficient use of water and proper use of inputs have all been deemed as significant factors for crop production and productivity (Madhusudan Bhattarai, Sakthivadivel et al. 2002). Different studies have clearly showed that a significant factor affecting agricultural performance is the inaccessibility of the rural poor to information and agricultural inputs. Thus, an attempt was made in this study to examine the extension supports in place in the study areas.
In this regard, this survey showed that during 2008/09 production year about 62% of the total sample households indicated that they receive government extension advice and support (training and technical support) related to crop and horticultural production. In 2008, three to four extension agents per tabia (village) were working to provide technical assistance, but it was found that they were not adequately supplied with sufficient transport facilities to provide adequate support. Focus group participants in all study areas discussed that there had been improvements in the extension support when compared to previous years.
To deliver knowledge, the extension services make use of individual, group and mass media approaches. In some of the woredas extension messages are transmitted at church/mosque gatherings during religious holidays or other occasional social gatherings, indicating the need to ensure the
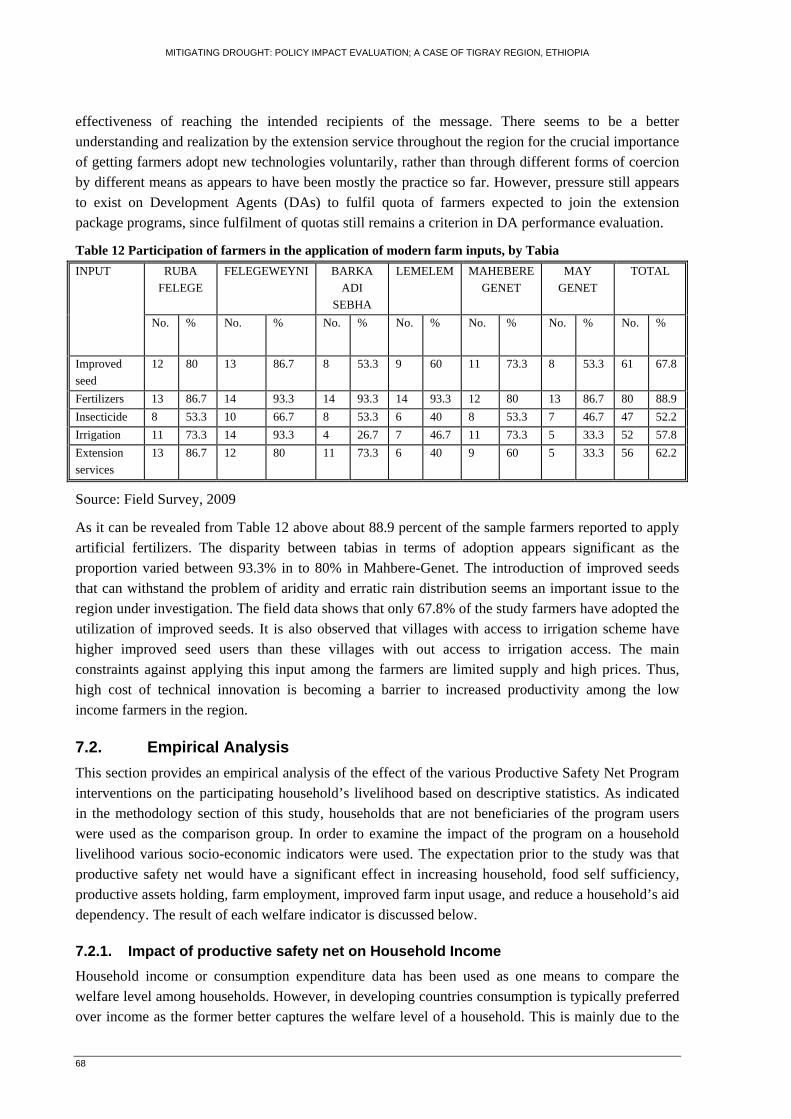
MITIGATING DROUGHT: POLICY IMPACT EVALUATION; A CASE OF TIGRAY REGION, ETHIOPIA
68
effectiveness of reaching the intended recipients of the message. There seems to be a better understanding and realization by the extension service throughout the region for the crucial importance of getting farmers adopt new technologies voluntarily, rather than through different forms of coercion by different means as appears to have been mostly the practice so far. However, pressure still appears to exist on Development Agents (DAs) to fulfil quota of farmers expected to join the extension package programs, since fulfilment of quotas still remains a criterion in DA performance evaluation.
Table 12 Participation of farmers in the application of modern farm inputs, by Tabia INPUT RUBA
FELEGE FELEGEWEYNI BARKA
ADI SEBHA
LEMELEM MAHEBERE GENET
MAY GENET
TOTAL
No. % No. % No. % No. % No. % No. % No. %
Improved seed
12 80 13 86.7 8 53.3 9 60 11 73.3 8 53.3 61 67.8
Fertilizers 13 86.7 14 93.3 14 93.3 14 93.3 12 80 13 86.7 80 88.9 Insecticide 8 53.3 10 66.7 8 53.3 6 40 8 53.3 7 46.7 47 52.2 Irrigation 11 73.3 14 93.3 4 26.7 7 46.7 11 73.3 5 33.3 52 57.8 Extension services
13 86.7 12 80 11 73.3 6 40 9 60 5 33.3 56 62.2
Source: Field Survey, 2009
As it can be revealed from Table 12 above about 88.9 percent of the sample farmers reported to apply artificial fertilizers. The disparity between tabias in terms of adoption appears significant as the proportion varied between 93.3% in to 80% in Mahbere-Genet. The introduction of improved seeds that can withstand the problem of aridity and erratic rain distribution seems an important issue to the region under investigation. The field data shows that only 67.8% of the study farmers have adopted the utilization of improved seeds. It is also observed that villages with access to irrigation scheme have higher improved seed users than these villages with out access to irrigation access. The main constraints against applying this input among the farmers are limited supply and high prices. Thus, high cost of technical innovation is becoming a barrier to increased productivity among the low income farmers in the region.
7.2. Empirical Analysis This section provides an empirical analysis of the effect of the various Productive Safety Net Program interventions on the participating household’s livelihood based on descriptive statistics. As indicated in the methodology section of this study, households that are not beneficiaries of the program users were used as the comparison group. In order to examine the impact of the program on a household livelihood various socio-economic indicators were used. The expectation prior to the study was that productive safety net would have a significant effect in increasing household, food self sufficiency, productive assets holding, farm employment, improved farm input usage, and reduce a household’s aid dependency. The result of each welfare indicator is discussed below.
7.2.1. Impact of productive safety net on Household Income Household income or consumption expenditure data has been used as one means to compare the welfare level among households. However, in developing countries consumption is typically preferred over income as the former better captures the welfare level of a household. This is mainly due to the

69
fact that households are likely to under report their income level more than they do their consumption level (Ravallion 2005). However, due to time constraint it was not possible to collect data on consumption expenditure of the sampled households and the comparison is based on household income.
Thus, to determine the actual impact of the productive safety net program on the sample household’s total annual income of productive safety net beneficiaries and non-beneficiaries was estimated. The aim was to examine the magnitude of change which had occurred in the annual income by estimating the difference between beneficiary and non beneficiary sample households.
According to the survey the average household’s total income per annum (current income after the intervention of the program) for productive safety net beneficiaries was ETB 8727.64 while the average income of non-beneficiaries were found to be ETB 3761.11 as it is depicted in table below. It is also found that productive safety net beneficiary households average annual income have been dramatically increased (about three fold) in the past five years than non-beneficiary households.
Table 13 Household before and after inclusion in PSNP Does the HH head included in PSNP Estimated average annual HH
income before 5 years Estimated average annual HH income now
no Mean 1683.89 3761.11 Minimum 1000 2300 Maximum 2500 7500 Std. Deviation 374.435 1342.578
yes Mean 2253.33 8727.64 Minimum 1000 1200 Maximum 4500 17500 Std. Deviation 655.419 3453.174
Total Mean 2139.44 7734.33 Minimum 1000 1200 Maximum 4500 17500 Std. Deviation 649.569 3721.290
Furthermore, an attempt was made to investigate the impact of safety net program on the livelihoods of households empirically and test for equality of mean of income between households included in the program and those who have not included was employed. A null hypothesis that there is no difference in the mean income of households included in safety program and those not included against the
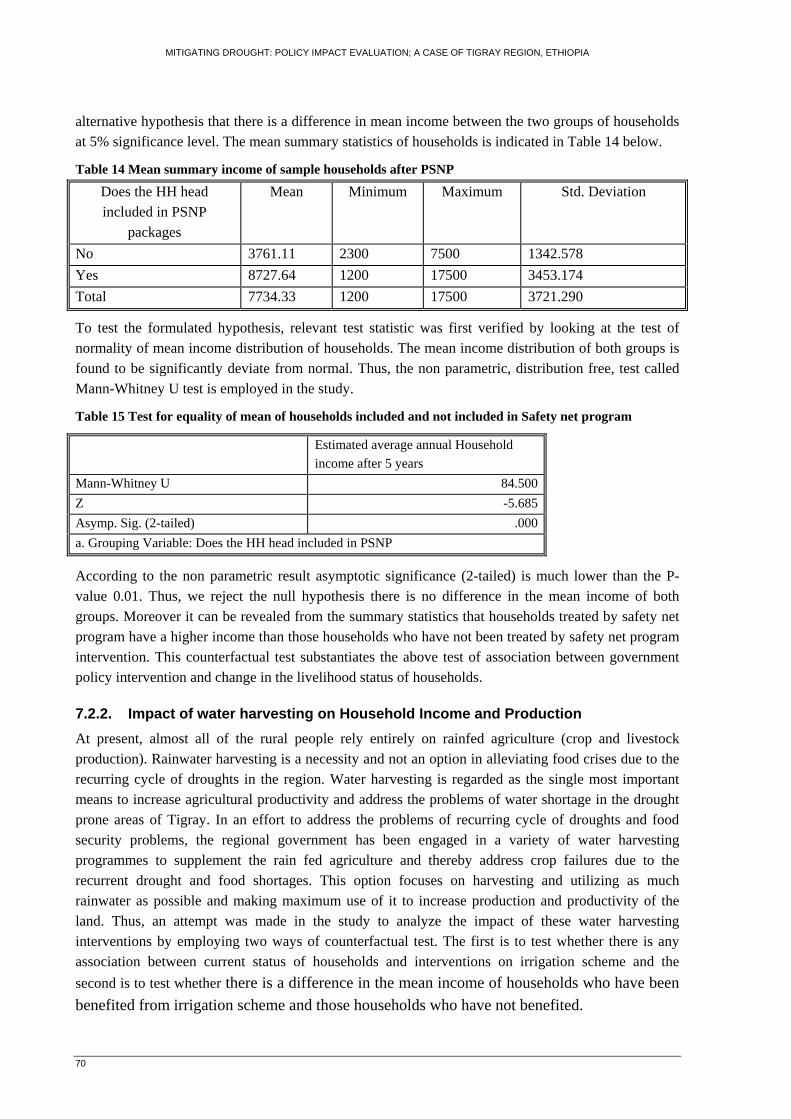
MITIGATING DROUGHT: POLICY IMPACT EVALUATION; A CASE OF TIGRAY REGION, ETHIOPIA
70
alternative hypothesis that there is a difference in mean income between the two groups of households at 5% significance level. The mean summary statistics of households is indicated in Table 14 below.
Table 14 Mean summary income of sample households after PSNP
Does the HH head included in PSNP
packages
Mean Minimum Maximum Std. Deviation
No 3761.11 2300 7500 1342.578 Yes 8727.64 1200 17500 3453.174 Total 7734.33 1200 17500 3721.290
To test the formulated hypothesis, relevant test statistic was first verified by looking at the test of normality of mean income distribution of households. The mean income distribution of both groups is found to be significantly deviate from normal. Thus, the non parametric, distribution free, test called Mann-Whitney U test is employed in the study.
Table 15 Test for equality of mean of households included and not included in Safety net program
According to the non parametric result asymptotic significance (2-tailed) is much lower than the P-value 0.01. Thus, we reject the null hypothesis there is no difference in the mean income of both groups. Moreover it can be revealed from the summary statistics that households treated by safety net program have a higher income than those households who have not been treated by safety net program intervention. This counterfactual test substantiates the above test of association between government policy intervention and change in the livelihood status of households.
7.2.2. Impact of water harvesting on Household Income and Production At present, almost all of the rural people rely entirely on rainfed agriculture (crop and livestock production). Rainwater harvesting is a necessity and not an option in alleviating food crises due to the recurring cycle of droughts in the region. Water harvesting is regarded as the single most important means to increase agricultural productivity and address the problems of water shortage in the drought prone areas of Tigray. In an effort to address the problems of recurring cycle of droughts and food security problems, the regional government has been engaged in a variety of water harvesting programmes to supplement the rain fed agriculture and thereby address crop failures due to the recurrent drought and food shortages. This option focuses on harvesting and utilizing as much rainwater as possible and making maximum use of it to increase production and productivity of the land. Thus, an attempt was made in the study to analyze the impact of these water harvesting interventions by employing two ways of counterfactual test. The first is to test whether there is any association between current status of households and interventions on irrigation scheme and the second is to test whether there is a difference in the mean income of households who have been benefited from irrigation scheme and those households who have not benefited.
Estimated average annual Household income after 5 years
Mann-Whitney U 84.500Z -5.685Asymp. Sig. (2-tailed) .000a. Grouping Variable: Does the HH head included in PSNP

71
To analyze the impact of intervention activity on the income of the households, test for equality of mean of income between households participated in irrigation scheme and those who have not participated are employed. A null hypothesis that there is no difference in the mean income of households participated in irrigation activities and those who have not been participated against the alternative hypothesis that there is a difference in mean income at 5% significance level.
Table 16 Test for equality of mean of HHs with access to irrigation scheme and without
Estimated average annual Household income after 5 years
Mann-Whitney U 107.000Z -7.198Asymp. Sig. (2-tailed) .000a. Grouping Variable: Do household use water harvesting structures To test the formulated hypothesis, non parametric called Mann-Whitney U test is used. According to the non parametric result indicated in Table 16 above, asymptotic significance (2-tailed) is 0.000 which is much lower than the P-value 0.01. Thus, we reject the null hypothesis that there is no difference in the mean income of both groups. This counterfactual test shows that those who have been participated in irrigation scheme have higher mean annual income than those who have not access to irrigation activity. 71.3 percent of the variation in household income is explained by the fact that the household’s access to dependable water for irrigation (pond or shallow well) has a significant positive impact in increasing the household’s income due to increased production and income being obtained from the regular dry and wet season vegetables and horticultural production. Tagel (2008) has also found that there is a significant association between government’s intervention on irrigation activities and household’s food security status at the same study region (Tagel 2008).
To determine whether government interventions on water harvesting activities has been created household’s an opportunity to supplement the rain fed agriculture and increase households crop production, means test was performed to determine whether there is a significant difference in annual crop production between irrigation users when compared to non irrigation user households. It is thus found that there is significant correlation (r= 0.546) between change in household crop production and household’s access to irrigation. Thus, access to irrigation has provided household’s with an opportunity to produce cash crops, both for sale and household consumption needs.

MITIGATING DROUGHT: POLICY IMPACT EVALUATION; A CASE OF TIGRAY REGION, ETHIOPIA
72
Box 1
Mr. Hagos Woldegebriel, is 62’s years old and is a farmer living in the Flegeweyni study area, made the following remarks about the advantages of shallow well during a focus group discussion. ‘‘Before the introduction of shallow well irrigation, used to lead my livelihood mainly through rain fed agriculture. There was a time when my family living conditions were very poor, as the land was not producing enough. To get additional income I was dependent on food aid or food for work activities. Even by doing this, I never made enough money to feed my family for the whole year. I was often worried, about the future of my children. Four years ago by mobilizing my family labour I dug a well (7 meters in depth). In the first year, by planting tomato, pepper and groundnut I was able to generate a total net income of ETB 3,000 from the sale of my produce. In the second year, I realised that I could have boosted my income if I used a motor pump to lift the water from the well. Then I got a pump with 3,000 ETB on credit base from the household package program to be repaid over a five years period of annual instalments. In the next harvest from my 0.25 hectare of shallow well irrigable land, I managed to generate a total income of 4,000 ETB from the sale of the produce excluding the value of vegetables I used for household consumption, which had positive impact on the nutritional status of my family. Besides, the well has helped to create dry season employment for all my able bodied of my family members’’. He said finally ‘‘since I started the irrigation I hardly run short of money, money is no longer the problem it used to be. ... With this hand dug well irrigation, I am confident that I will earn a lot more from my farming’’
7.2.3. Asset Protection and Creation
Livestock and livestock products are obviously very important sources of livelihoods since a mixed crop-livestock system is the economic base in all the study areas. Ownership of livestock is one important indicator in ascertaining the well-being of the rural people of Ethiopia and it is also an indicator of a household’s wealth status and propensity to invest. Moreover, in most rural areas of the study region livestock are closely integrated with a range of other purposes such as direct production, draft power, transport, and manure production to sustain soil fertility. Generally livestock constitutes the main form of capital accumulation by farmers in the study area and an attempt was made to investigate the role of productive safety net program in protecting and creating household assets. Before the program intervention, 71.1% and 73.3% of the sample beneficiaries was having 3 and Below TLU (Tropical Livestock Unit) and after the program intervention 62.2% and 64.4% of the beneficiaries have above 3 TLU in Atsebi-womberta and Enderat districts respectively as it is indicated in Table 17.
Table 17 Livestock possession of the sample households Livestock in TLU Woreda (District)
Atsebi-Womberta Enderta 2004 2009 2004 2009
No livestock 17 0 21 0 0.25-3 15 17 12 16 3.25-7 12 22 12 26 7.25-13.83 1 6 0 3 Total 45 45 45 45
Source: Field survey, 2009

73
As shown in Table 17 above, the sample household’s have shown an increase in their livestock holding. Before the commencement of the productive safety net program (For instance, in 2004) 42.2 percent of the sample households have no any livestock holding but after the program intervention this number has decreased to zero at 2009. In the other hand, the livestock possession having with 7.25-13.83 TLU increased from 1 to 6 and from 0 to 3 in Atsebi-womberta and Enderta districts respectively over the last five years. This is due the fact that beneficiaries of productive safety net households are included in the government household package programmes and took loans for the purchase of dairy cows, sheep and goats as income generating activities.
7.2.4. Effect of PSNP on Aid Dependency
Rural households in the surveyed weredas had developed different alternative measures in response to the problem of food shortages. Among all types of coping mechanisms, food aid is a structural component of the livelihood coping strategy in many rural households. To address the problem of chronic food insecurity, the regional government have been carried out different activities under the productive safety net programme. One of the aims of the programme is to improve productivity of transfers of food or cash aid to food insecure households, thereby reducing household vulnerability, improving resilience and promoting sustainable community development. Thus, an attempt was made to ascertain if any relationship exists between access to productive safety net programs and food aid dependency.
0
5
10
15
20
25
30
35
40
45
Before After Before After
Atsebi-womberta Enderta
Num
ber
of b
enef
icia
ries
1-3 months4-6 months7-9 months
Figure 29: Food gap situations, source: field survey, 2009
As it is illustrated in Figure 29the food gap before the commencement of the productive safety net program was above 7 months (or the average number of months able to cover their food requirements was 1-3 months); whereas, after productive safety net program’s intervention majority of the households have below 3 months food gap in the study areas. This clearly indicates that productive safety net program has greater impact to bridge the food gap of beneficiaries. Thus, it is revealed from the sample households that a significant proportion of farmers are able to cover their food requirement for 7-9 months from their own farm produces and by participating on public works. The study confirmed that the change in average food sufficiency before-and-after the program revealed that productive safety net has a significant role in improving the households’ food self sufficiency.

MITIGATING DROUGHT: POLICY IMPACT EVALUATION; A CASE OF TIGRAY REGION, ETHIOPIA
74
7.2.5. Copping Strategies to fill the food gap
The household sample survey asked respondents what “coping strategies” they had adopted during the previous hungry season. The ranking of strategies adopted follows a pattern that is familiar from the literature on household responses to drought and famine in Africa. The most widely adopted strategies are those that have little cost to the household and are easily reversible, such as cutting back temporarily from three meals to two meals per day. These are by far the most commonly reported coping strategies in the study area, being adopted by almost three-quarters of the sample, and more by non-PSNP beneficiaries than by beneficiary households. This suggests that hunger in non-beneficiary households was more severe in 2005/06 than in beneficiary households. This does suggest that PSNP transfers provide protection against hunger and rationing in 2005.
Conversely, strategies that involve high cost to the household – in terms of asset stripping, or lost future income, or loss of social status – tend to be adopted last, only after other responses to hunger have been exhausted. A classic case in point is renting land, which requires the farming household to give up its most basic and indispensable productive resource. In the sample survey, a small number of households were forced into renting out farmland to survive the 2005/06 hungry season; 14 of these 20 households were non-PSNP beneficiaries. Some farmers, especially young people, go to the town to sell their labour. Clearly, the PSNP did entirely protect household assets against forced disposal or “distress sales”, presumably the cash or food transfers was adequate for these households to cover their food consumption deficits.
There is not much difference in the proportion of beneficiary and non-beneficiary households adopting other coping strategies. Beneficiaries are more likely to cut back on non-essential non-food spending, and to withdraw their children from school. Non-beneficiaries are more inclined to sell livestock and other assets for food.
7.2.6. Does PSNP (Food for work) Prevent Distress Sales
When the food stock from production is too small due to the recurrent drought, households have to depend on other sources of income to cover their food expenditure. In the study area, sale of livestock was among the most commonly adopted coping response during the drought in 2002/2003. Sale of livestock, however, may have long-term impact on household vulnerability. It compromises future income by reducing the benefit streams in the form of animal products. Livestock are also important factors of production for farm households in the study region who use oxen for ploughing and other draft animals for transportation. However, we can not argue that all sales of livestock during drought qualify as distress sales. It is possible that households keep some livestock partially as insurance item to be sold in stressful times.
In this study distress sale of livestock is defined as the sale of the most valuable livestock of households to buy food. It is argued that productive safety net program (under the Food-for-work activities) serve an asset protection function during drought shocks by providing food transfer and thereby reducing the pressure to sell livestock.
For this analysis primary data collected during the field work is used. Respondent were asked about their coping mechanisms during the 2005/06 drought year causing severe crop failures in the study villages. Based on the priorities and importance of the different types of livestock to the farmer in the study area, it is considered that sale of cows, oxen and donkey. Webb et al. (1992) have also treated sale of these three animals as distress sales in their study of famine in Ethiopia (Webb, Braun et al. 1992).

75
To investigate the impact of FFW in preventing distress sales, a probit model is employed using the STATA statistical tool. The dependent variable was binary which takes one if the households sold any of the three animals. A hypothesis that households participating in productive safety net (Food-for-work) were less likely to sell their livestock as a coping response is formulated. Data on Income from food-for-work is computed from the number of labor-days supplied in the food-for-work reported for all participating studied households. Since food-for-work income is linearly proportional to the number of days where payment is per day at fixed minimum wage rate, it can serve as the best proxy for FFW income.
Other factors that may influence whether a household will engage in distress sale are: characteristics of household head (sex and education), consumer-worker ratio, wealth (given by farm size), livestock owned in the previous period and ‘occupation’ dummy representing other source of income. Wealth is expected to negatively influence distress sales. Households with educated household heads, high labor endowment, and other sources of income are also expected to be less likely to engage in distress sales. Livestock ownership was measured in tropical livestock units (TLU) owned. Conversion factors were used in order to change each livestock of a household to its equivalent tropical livestock unit; a value of 1.1, 0.8, 0.1, and 0.36 is equivalent to one oxen, cow, sheep/goat and donkey. Thus, sale of any one these livestock type (oxen, cow or donkey) is expected to be positively correlated with distress sale.
Households with high consumer-worker ratio are expected to be more likely to engage in distress sale. The outputs from the probit estimation of probability of selling cows, oxen and donkeys are given in Table 18 below.
Table 18 Probit estimate on distress sale of livestock in 2005/06
DEPENDENT VARIABLE: BINARY (0/1) FOR DISTRESS SALE OF LIVESTOCK Variables Coefficients Z value Age of HHH 0.048894 0.960 Education of HHH -0.367272 1.83 (**) Occupation -0.324909 1.734 (**) Consumer-worker ratio -0.261911 -2.37 (*) Farm size -0.51095 -2.07 (*) FFW income -0.025795 2.83 (*) Asset holding 0.214574 2.46 Constant 11.78388 2.02 Number of observations = 90 Wald chi2 (11)= 51.08 Prob > Chi2= 0.0000 Log likelihood= -102.2 (*) and (**) ..significant at 95% and 90% significant levels
The coefficient on the variable indicating ‘FFW income’, as proxied by predicted number of labor-man-days supplied, was found to be negative and significant at 5 percent level. This shows that food-for-work income reduces the probability of distress sales possibly indicating towards the success of FFW as a safety net in the event of drought shocks in the study areas. Households’ own perception also point to a similar direction. It is observed that three in five beneficiaries avoided having to sell assets to buy food in 2005/06 – a common ‘distress response’ to household food shortage. Majority of
MITIGATING DROUGHT: POLICY IMPACT EVALUATION; A CASE OF TIGRAY REGION, ETHIOPIA
76
the sampled household’s explained these positive outcomes in terms of the productive safety net program. Since one of the main objectives of the productive safety net is to prevent asset depletion at the household level, this is an important and very positive finding.
Barrett et al. (2001) also found a similar result from a study in Kenya. They have shown that, compared with the non-participants in the poorest half of the income distribution, food-for-work participants in the same group are found to be less reliant on sale of livestock for immediate cash needs (Barrett and Clay 2003).
Furthermore, the findings of the probit model revealed that households with alternative off-farm activities are less likely to sell their assets during drought shocks; and households with high consumer-worker ratio were engaged in distress sale during the drought shock of 2005/06.
In a nut shell results of the household’s data revealed that productive safety net program is playing a great role in household’s asset protection and creation.
7.2.7. Households Opinion on Early-warning systems
Communities were also asked for their opinions about the disaster-management systems in operation in their location over the past five years. Questions focused on the early warning and preparedness mechanisms, because they enable communities to be prepared and they help to reduce the impact of recurring disasters.
Drought is known to provide several natural indicators before and during its occurrence. Globally, there has been much emphasis on identifying such traditional early-warning signs. The objective of providing early warning is to enhance preparedness, to speed up the response after the disaster and ensure that the impacts are reduced to a minimum. Majority of the communities at the studied areas obtained early-warning information from radio reflecting the active government involvement in disaster-risk management. When asked specifically about their sources of early warning within the government, the majority of respondents said that they obtained early warning from development agents in their village. Most respondents felt that the existing early-warning systems were sufficient for them to identify impending disaster such as drought.
Irrespective of the study location, respondents believed that communities are the first to respond to disasters (85.4 per cent). Food preservation (storage) appears to be the major adaptation mechanism of communities (32.7 per cent of respondents), followed by preservation of seeds for the next cropping season (24.6 per cent).
7.2.8. Household opinion on Targeting
The study has attempted to analyse the targeting system put in place and the findings of the household survey shows that the PSNP is reaching the poor. 67.8 percent of the studied household perceived that the productive safety net interventions are properly targeted while the reaming 32.2 percent of the households perceived that there are errors of exclusion in targeting as it is illustrated in Table 19 below.

77
Table 19 Opinions of studied households on program targeting
District
Does PSNP fairly targeted
Total no yes
Atsebi_Womberta Tabia Ruba Felege % within Tabia Count
40.0% 60.0% 100.0%
Felegeweyni % within Tabia 20.0% 80.0% 100.0%
Barka Adi Sebha % within Tabia 20.0% 80.0% 100.0%
Enderta Tabia Lemelem % within Tabia 40.0% 60.0% 100.0%
Mahebere Genet % within Tabia 26.7% 73.3% 100.0%
May Genet % within Tabia 46.7% 53.3% 100.0%
Total Count 29 71 45
% within Tabia 32.2% 67.8% 100.0%
Source: Field survey, 2009
The studied household’s perceived that there have been improvement in targeting an the process ran more smoothly now than during the inception of the program at 2005. These improvements were variously attributed to better understanding of the PSNP principles and due to the shift to community driven targeting process with more involvement of community members, which made the targeting transparent. The institutional structures for combined administrative and community targeting are in place in most areas, and are functioning with varying degrees of success. It is observed that great efforts have been made by local government and community decision makers to fulfil a very difficult task.
Nevertheless, there are problems and areas for improvement. Errors and occasional abuses are inevitable in any targeting system: the key question is how effectively they are detected and corrected. The system for appeals and complaints laid out in the program implementation manual (PIM) is nominally in place in the study woredas visited, but is not functioning very effectively. Membership of the targeting and appeals bodies overlaps, so that there is no independent channel for complaints, and appeals are often passed back to the original community decision-makers. Potential beneficiaries are not well-informed about the right or process of appeal. No records of appeals are kept or passed to higher levels of government for oversight.
7.3. Conclusion
The findings of the probit regression model show the food-for-work income reduces the probability of distress sales indicating the success of food-for-work as a productive safety net in the event of drought shocks in the studied areas. It is also found that there is a strong association between government policy interventions and increased income of the studied households and the studied households perceive that the productive safety net program interventions carried out over the past periods have brought change on their livelihood assets. Moreover, the findings of the probit model revealed that households with alternative off-farm activities are less likely to sell their assets during drought shocks.

MITIGATING DROUGHT: POLICY IMPACT EVALUATION; A CASE OF TIGRAY REGION, ETHIOPIA
78
8. Conclusion and Recommendation 8.1. Conclusions Drought is a complex phenomenon and is generally viewed as a sustained and regionally extensive occurrence of below average natural water availability either in the form of precipitation, river runoff or groundwater. Ethiopia is one of the horns of African countries highly vulnerable to drought. Drought in Ethiopia is a frequently recurring phenomenon. Mitigating drought is the most significant challenge facing the country. The government’s drought mitigation policy calls attention to protect the lives and assets of the rural poor and thereby minimize the impact of recurrent drought as its top priority. Accordingly the government has been carried out different intervention to address the impact of recurring cycle of drought since 2005.
This study employed the before-and after evaluation designs to evaluate the impact of government interventions. The main findings of the research are summarized below.
There are diverse and interrelated causes for household asset depletion: The complex nature of drought in the region took the lives of people; entail loss of assets in the form of crops, livestock, and productive capital damaged as a direct consequence of water shortages and threatened the lives of millions of people with starvation. Majority of the droughts had a drastic impact on agricultural out-put, with total crop failure and massive livestock deaths being recorded in many parts of the study region. Recurring cycle of droughts have eroded the productive assets of communities and households thereby reducing the capacity to cope with drought. Degradation of the agricultural resource base, particularly through intensified land use of the ecologically fragile land by a rapidly growing population together with over grazing, deforestation and soil erosion, has been partly responsible for the increasing vulnerability of the rural population to drought and famine. Furthermore, data from the remote sensing revealed that drought has impact in the vegetation cover in the study region.
Spatial clustering of drought exists in the region: based on the spatial distribution and frequency of drought among the districts it is found that there exists strong spatial clustering of drought frequency among the districts. The result of the research have confirmed that there is strong and significant spatial clustering which confirms that less affected districts are often surrounded by less affected neighbors. Moreover factors such as topology, population pressure, deforestation, soil erosion, mainly the average rain full required districts makes them to cluster in one area.
Effective interventions have been carried out to address the root cause of drought: the study revealed that the different interventions carried out through productive safety net interventions to increase income of the poor of the rural household’s are successful. The different water harvesting scheme has helped farmers’ to shift to high value crops with an increased likelihood of using improved inputs due to reduced risk of crop failure in the event of drought and increased yield due to input complementarities. This has helped the individual farmer to obtain additional income and increase household consumption; and have a direct effect on household welfare in terms of improved nutrition due to improved dietary intake because of increased income and due to increased growing of vegetables and fruits on home gardens. Furthermore, rain water harvesting schemes carried out by the regional government are offering the farmers a possibility of mitigating water stress thereby reducing risks of crop failures due to cycle of recurring drought.

79
Water harvesting schema has effect on cropping pattern and crop diversification: Access to reliable irrigation has been regarded as a powerful factor which provides a greater opportunity for cropping intensity, multiple cropping and crop diversification. Based on the information collected from the household survey the following descriptions were found in relation to the effect of water harvesting in cropping pattern, multiple cropping and crop diversification.
Promoting of water harvesting irrigation schemes by the regional government at the household level, has helped many farmers to produce high value horticultural crops such as potato, tomato, pepper, onion, cabbage, as well as fruits such as papaya, and mango. Dry season horticultural crop production was found to have become common practice in the study region. The study has found that availability of dependable water from water harvesting schemes does significantly contribute to crop pattern diversification, which includes a shift from the traditional cropping pattern towards the inclusion of high valued crops. Furthermore, the before-and-after assessment on food production showed that food grain production has grown annually at an average of 7.6% over the period 1998-2004, which is attributed to positive shift in public policy.
The policy has impact on Environmental Rehabilitation: the study revealed that the different interventions carried out by the regional government aimed at rehabilitating the degraded lands and developing the agro-economic infrastructure necessary to combat the challenges of drought have been successful. These activities are successful in halting the socio-economic and ecological problems of the study region. Furthermore, the before-and-after assessment study based on remote sensing data confirmed that there is positive changes in the vegetation cover over the past periods, which validates the effectiveness of government policy instruments put in place to rehabilitate the degraded environment.
Interventions have impact on employment generation: The government responded to high levels of unemployment in rural area by introducing the productive safety net program. The study revealed that the Productive Safety-Nets Program (PSNP) is a key income source of the poor and very poor. The productive safety net interventions have provided the poor and very poor rural household’s the opportunity to find employment (eg as daily wage laborers, guards etc.), there by contributing approximately more than one third of the income for the very poor and poor and enhancing their capacity to acquire food through employment generating activities. In a nutshell, the productive safety net programs have enabled the poor to engage in livelihood strategies that offer the potential for pathways out of poverty, by providing risk mitigating opportunities.
Early warning system and Government Response: Examining the performance of the early warning systems put in place over the last periods, the early warning systems were highly effective in preventing the repeated occurrence of the types of famines that struck the country in general and the study region in particular in the 1970s and 1980s. The government has developed a fairly credible early warning system and has predicted, on a number of occasions, disasters well in advance thereby avoiding the worst of the famine images that were once synonymous with Ethiopia. Furthermore, the decentralized district level early warning system, where the decision makers are close to, and more familiar with the situation to which they are responding, is found to be successful than the centralized ones.
Despite good developments of early warning systems, several key issues are of concern which was observed during the key informant’s discussion with regional Disaster Prevention and Preparedness commission. The lack of baseline data to serve as benchmark for early warning information; poor understanding of the local economy to detect localized problems; lack of coordination in information

MITIGATING DROUGHT: POLICY IMPACT EVALUATION; A CASE OF TIGRAY REGION, ETHIOPIA
80
collection; poor infrastructure and communication system for timely information flow; and inadequate institutional capacity to analyze information at woreda level constitute its weaknesses.
Food-for-work prevent distress sales: The findings of household survey showed that food-for-work income reduces the probability of distress sales possibly indicating towards the success of food-for-work as a safety net in the event of drought shocks in the study areas. This finding shows the effectiveness of the policy in achieving the intended goals of protecting household asset during drought shocks. Furthermore, the findings of the Probit model revealed that households with alternative off-farm activities are less likely to sell their assets during drought shocks; and households with high consumer-worker ratio were engaged in distress sale during the drought shock of 2005/06.
In general considerable progress has been made throughout the study region in improving the livelihood positions of the rural poor. The before- and-after evaluation revealed that the activities carried out have succeeded to bring changes on the main drought mitigation key goals such as individual household asset protection, community asset development, employment generation, improving water use efficiency, improving crop production, and environmental rehabilitation across districts. The overall finding of the research shows that the government interventions carried out since 2004 has been achieving its intended objectives and are effective in improving the lives of the poor and thereby creating resilient community.
8.2. Recommendation
In order to improve the capability of households to cope with drought shocks, the following may be the major areas of intervention.
Efforts should be made to coordinate the inter-organizational information System: To have a sensitive EWS, the regional government should facilitated the establishment of baseline data which serve as benchmark for early warning information; good understanding of the local economy to detect localized problems; coordination in information collection; development of infrastructure and communication system for timely information flow; and establishing adequate institutional capacity capable of analyzing information at woreda level.
Efforts should continue to ensure that community targeting processes are transparent, participatory and well managed. Greater attention should be paid to raising awareness of the appeals process. The appeals process needs to be faster. Bodies that hear appeals or complaints about targeting should have separate membership from the Food Security Task Forces, to ensure independence.
Price of Agricultural input should be Affordable: The price of quality seed, fertilizer and modern agricultural equipment should be reasonable. Furthermore, the farmers should agree on the importance of using agricultural inputs by providing them sufficient knowledge and skill in using the inputs. In addition the performance appraisal of development agent’s should not be on the quota of farmers used Agricultural input.

81
References: Babbie, E. (2003). The Practice of Social Research, Victoria etc., Wadsworth. Barrett, C. B. and D. C. Clay (2003). "How Accurate is Food-for-Work Self-Targeting in the Presence
of Imperfect Factor Markets? Evidence from Ethiopia." Journal of Development Studies 39(5): 152-180.
Baumer, M. (1990). The Potential of agroforestry in combating desertification and environmetal deradation. Technical centre for Agricultural and Rural Co-operation (CTA): The Netherlands. 250pp.
Besley, T. and R. Kanbur (1990). The Principals of Targeting, Policy Research and External Affairs Working Paper Series No. 385, The World Bank, Washington, DC.
BOFED (2004). National Regional State of Tigray Strategic Plan for the years 2004-2006 (Unpublished document).
Bureau of Finance and Economic Development (2007). "Atlas of Tigray Regional State (Unpublished).".
Cancelliere, A., G. Mauro, et al. (2007). "Drought forecasting using the standardized precipitation index." Water Resources Management 21(5): 801-819.
Carney, D. (1998). Sustainable Rural Livelihoods, Department for international Development, London.
Central Statistics Agency (2007). National Population Statistics. Addis Ababa, Ethiopia. Central Statistics Agency (2008). Summary and Statistical Report of the 2007 Population and Housing
Census, Federal Democratic Republic of Ethiopia Population Census Commission. Devereux, S. (2000). Food Insecurity in Ethiopia, A discussion paper for DFID. Addis Ababa,
Ethiopia. Devereux, S. (2003). ‘Policy Options for Increasing the Contribution of Social Protection to Food
Security’. Theme paper prepared for the Forum for Food Security in Southern Africa. Sussex: Institute of Development Studies.
Dunn, W. N. (2004). Public Policy Analysis: An Introduction -3rd ed New Jersey, Pearson Education LTD.
ECA (2005). GIS Implementation to Support Poverty Reduction Policy and Drought Management in Ethiopia Addis Ababa, Ethiopia.
Esikuri, E. E. (2005). "Mitigating Drought - Long Term Planning to Reduce Vulnerability.” Environment Strategy Notes, No. 13. Washington, D.C.
Esser K. and T. G. Vagen (2002). Soil Conservation in Tigray Ethiopia, Mitiku Haile, February 2002. Ethiopian National Meteorological Agency (2007). Rainfall Distribution in Tigray, 1997-2007. FDRE (2006 ). Productive Safety Net Program: Program Implementation Manual, Government of the
Federal Democratic Republic of Ethiopia; Ministry of Agriculture and Rural Development. Ferreira, F., G. Prennushi, et al. (1999). Protecting the Poor from Macroeconomic Shocks: An Agenda
for Action in a Crisis and Beyond, World Bank, Washington, DC, mimeo. Gadisso, B. E. (2007). Drought assessment for the Nile basin using meteosat second generation data
with special emphasis on the upper Blue Nile region. Enschede, ITC, 2007. 91 p. Gautam, M. (2006). Managing Drought in Sub-Saharan Africa: Policy Perspectives. Drought:
Economic Consequences and Policies for Mitigation Washington, D. C., World Bank. Girmay, T. (2006). Agriculture, Resource Management and Institutions: A Socioeconomic Analysis of
Households in Tigray, Ethiopia, Wageningen University. PhD Thesis. Glantz, M. H. e. (1996). Drought and hunger in Africa : denying famine a future. Cambridge etc.,
Cambridge University Press. Government of Ethiopia (2004). The Ethiopian Productive Safety Net Program: Programme
Implementation Manual, Ministry of Agriculture and Rural Development, Addis Ababa. Haddad, L. and M. Zeller (1996). How can Safety Nets do More with Less? General Issues with some
Evidence from Southern AfricaI. Food Consumption and Nutrition. Washington, DC, IFPRI. Hagos, F. and S. Holden (2002). Incentives for Conservation in Tigray, Ethiopia: Findings from a
Household Survey.
MITIGATING DROUGHT: POLICY IMPACT EVALUATION; A CASE OF TIGRAY REGION, ETHIOPIA
82
Heim, R. R. (2002). "A review of twentieth-century drought indices used in the United States." American Meteorological Society 83(8): 1149-1165.
Hoddinott, J. (1999). Targeting: Principles and Practice, Technical Guide No. 9, International Food Policy Research Institute, Washington, D.C.
Holden, S., B. Shiferaw, et al. (2004). "Non-farm income, Household Welfare, and Sustainable Land Management in Less-favoured Area in Ethiopian Highlands." Food Policy( 29): 369-392.
IPMS/ILRI. (2004). "Atsbi Wemberta Pilot Learning Site Diagnosis and Program Design." Retrieved October -4, 2009, from http://www.ilri.org/.
IWMI (2004). Assessment and Mitigation of Droughts in South-West Asia:Issues and Prospects. Colombo, Sri Lanka.
Kindeya, G. (2003). "Ecology and Management of Boswellia papyrifera (Del.) Hochst dry forests in Tigray, northern Ethiopia. George -August Universität, Göttingen."
Kitchin, N. and Tate (2000). Conducting Research in Human Geography. Prentice Hall, Harlow. Kogan, F. N. (1990). "Remote sensing of weather impacts on vegetation in non-homogeneous areas "
Remote Sensing 11: 1405-1420. Kumar, R. (2005). Research Methodology. SAGE Publication Ltd, Thousand Oaks, California 91320. Long, N. (2002). An Actor-Oriented Approach to Development Intervention, Wageningen University. Lu D., Mausel P., et al. (2004). "Change detection techniques " International Journal of Remote
Sensing 25(37): 2365-2401. Madhusudan Bhattarai, M., R. Sakthivadivel, et al. (2002). Irrigation Impacts on Income Inequality
and Poverty Alleviation: Policy Issues and Options for Improved Management of Irrigation Systems , Working Paper 39, International water management Institutes.
Margaret, F. M. (2003). Planning for the Next Drought: Ethiopia Case Study USAID, Washington. Mikkelsen, B. (2002). Methods for Development Work and research: A guide for Practitioners, Sage
publications ltd. Minamiguchi, N. (2005). The Application of Geospatial and Disaster Information for Food Insecurity
and Agricultural Drought Monitoring and Assessment by the FAO GIEWS and Asia FIVIMS. Workshop on Reducing Food Insecurity Associated with Natural Disasters in Asia and the Pacific. Bangkok, Thailand.
Mulat, D. (2004). Hydrological Variability In Ethiopia: Its Impact And Some Strategic Considerations. Background Paper For Ethiopia Water Resources Assistance Strategy Of The World Bank. January 2004, Addis Ababa.
Pander, J. and B. Gebremedhin (2004). Impacts of Policies and Technologies in Dry Land Agriculture: Evidence from Northern Ethiopia. .
Pereira, L. S., I. Cordery, et al. (2009). Coping With Water Scarcity: Arid Lands, Droughts and Desertification, Springer.
Phillips, S. M. (1994). "Farmers Education and farming efficiency: A meta -analysis." Economic Development and cultural Change ( 43): 1439-1465.
Purdon, S., C. Lessof, et al. (2001). Research Methods for Policy Evaluation, National Centre for Social Research,London.
Ramakrishna, G. and D. Assefa (2002). "An Empirical Analysis of Food Insecurity in Ethiopia: The Case of North Wello." African Development XXVII, Nos. 1 & 2: 127-143.
Rämi, H. (2003). Ponds Filled with Challenges: Water Harvesting Experiences from Amhara and Tigray. United Nations Office for the Coordination of Humanitarian Affairs-Ethiopia. UN OCHA - Ethiopia.
Ravallion, M. (2005). "Evaluating anti-poverty programs. Washington DC, World Bank, Policy Research Working Paper WPS3625."
Roossi, G. (2003). Reqisites for a Drought Watch system. Tools for Drought Mitigation in Meditrranean Region. Dordrecht, Kluwer Academic Publishing, Netherlands: pp147-157.
Saleth, R. M., M. Samad, et al. (2003). Water, poverty and gender an overview of issues and policies, Water policy, Volume 5 Number 5/6.
Solomon, H. (2005). Socio-economic Infrastructure of the Tigray Region, Department of Geography, Mekelle University (Unpublished). .
83
Song C., Woodcock C.E., et al. (2001). "Classification and Change Detection Using Landsat TM Data: When and How to Correct Atmospheric Effects? ." Remote Sensing of Environment, 75(2): 230-244.
Steinar, K. (1996). Interviews: An Introduction to Qualitative Research Interviewing, Sage Publications.
Subbarao, K., A. Bonnerjee, et al. (1997). Safety Net Programs and Poverty Reduction: Lessons from Cross-Country Experience, Directions in Development, The World Bank, Washington, D.C.
Subbarao, K. and J. Smith (2003). Safety nets versus relief nets: Toward a medium term safety net strategy for Ethiopia. Mimeo. Washington, D.C.: World Bank.
Tagel, G. (2008). Rural Food Security in Tigray, Ethiopia: Policy Impact Evaluation, International institute for Geo-information Science and Earth Observation. Msc.
TFSCO (2006). Three Year Strategic Plan, Tigray, Ethiopia. Transitional Government of Ethiopia (1993). Transitional Government of Ethiopia National Policy on
Disaster Prevention and Management UNDP (2002). World Development Report, Oxford University Press. Von Braun, J., T. Teklu, et al. (1999). Famine in Africa. Causes Responses, and Prevention. Baltimore,
MD: John Hopkins University Press. Warren, A. and M. Khogali (1992). Assessment of Desertification and Drought in the Sudano-Sahelian
Region 1985-1991. , New York, UNSO. Webb, P., J. Braun, et al. (1992). Famine in Ethiopia: Policy implications Of Coping Failure at
National and Household levels. Research Report 92, IFPRI. Whitmore, J. S. (2000). Drought Management on Farmland, Dordrecht: Kluwer Academic,
Netherlands. Wilhite, D. A. (1997). Improving Drought Management in the West: The Role of Mitigation and
Preparedness, National Drought Mitigation Center University of Nebraska, Lincoln. Wilhite, D. A. and M. Buchanan-Smith (2005). "Drought as hazard: Understanding the natural and
social context." Drought and water crises: science, technology, and management issues: 3–29. Wilhite, D. A. and M. H. Glantz (1985). "Understanding the drought phenomenon: The role of
definitions." Water International(10): 111-120. Wilhite, D. A. and R. Pulwarty (2005). "Drought and water crises: lessons learned and the road
ahead." Drought and water crises: science, technology, and management issues: 389. World Bank (2004). Project Appraisal Document for a Productive Safety Net Project. Report No.
29767-ET. Washington, D.C.

MITIGATING DROUGHT: POLICY IMPACT EVALUATION; A CASE OF TIGRAY REGION, ETHIOPIA
84
Appendix – Questionnaire employed for household interview
District ______________ Tabia ______________ Village _________________ Household code _________ Name of household head ___________________________________________ Age_____ 1. Type of household _____________
1= Male head 2= Female head 2. Family size _____________ , Number of dependent ________ 1. <= 3 _____________ 2. 4 – 5 _____________ 3. 6 – 8 _____________ 4. >= 9 _____________ 3. Average Land holding 1. < 0.25ha 2. 0.26-0.5 3. 0.51-0.75 4. .0.76-1.0 5. >1.0 4. Education _____________ 1. None (Illiterate) ____ 2. Primary ____ 3. Junior _____ 4. Secondary _____ 5. For how long do you live in the village? __________ 6. What is your means of livelihood? _____________ 1. Agriculture ____________________ 2. Petty trade ____________________ 3. Daily labour ____________________ 4. Livestock ______________________ 5. Other __________________________ 7. Source of income of the household other than agriculture /off farm activity/
• Bee keeping _______________ • Poultry _______________ • Livestock _______________ • Diary products _______________ • Petty trade _______________ • Selling of fuel wood and timber for construction ___________ • Handcraft ___________
8. Could your production enough to feed the family for a year and above? Yes ______ No ________ 9. If ‘No’ for how many months is it sufficient? 1-3 ____ 4-6 ____ 7-9 _____ others, specify _____________ 10. What are your survival mechanisms to fill the food gap deficiency?
• Selling labour in town’s ___ • Livestock selling ____ • Selling other assets ___ • Participating in PSNP activities ___ • Borrowing grain ____ • Borrowing cash ____ • Petty trade ___ • Other, specify _______
11. What are the most important problems related to food crops? 1. _________________________________ 2. _________________________________ 3. __________________________________
85
12. Did you use improved seeds to increase your production during the programme commenced? Yes _______ No _________ 13. What are the main causes of drought in your village? 1. Inadequate and variable rain _________ 2. Desertification __________ 3. _________________________ 4. _________________________ 5. __________________________ 14. What were the main impacts of drought in your area? 1. Loss of live _______________ 2. Loss of livestock _____________ 3. Crop failures that cause food shortage ____________ 4. Decreased income & employment _____________________ 5. Desertification _______________ 6. Social disruption ______________ 7. Incidence of malaria _______________ 8. Other (Specify) _______________ 15. What are the main coping mechanisms practiced in times of drought according their importance? 1. Sell of livestock ______________ 2. Sell of household belongings _________________ 3. Sell of farm equipments ___________________
3. Mortgaging land ____________________ 4. Daily labour outside the village _____________ 5. Out migration to cities ______________________ 6. Begging _____________________________ 7. Other (Specify) ________________________ 16. What measures have been or are being done by the government to mitigate impacts of drought in your area? 1. _______________________________________________________ 2. _______________________________________________________ 3. _______________________________________________________ 17. Are you included in the Productive Safety net programs underway in your village? 1. Yes _______ 2. No ________ 17.1 When did you start to participate in the program? __________ 18. Who decided which households in the community would be included in the PSNP?
1. Kebele Food Security Task Force _____________________ 2. The community (we all decided together) _______________ 3. Kebele Council or Administration _____________________ 4. Community Food Security Task Force __________________ 5. Development Agency _______________________________ 6. Woreda Food Security Task Force ______________________ 7. Woreda Council or Administration ______________________ 8. Don't know _________________________________________
19. Do you think the program is fairly targeted to the needy? 1. Yes _______ 2. No ___________ 20. If your answer is no, what are the main problems of targeting? 1. __________________________________________ 2. __________________________________________ 3. __________________________________________ 4. __________________________________________ 21. Do you think that your livelihoods have been changed by participating in the productive safety net program? Yes ______ No _________, If yes

MITIGATING DROUGHT: POLICY IMPACT EVALUATION; A CASE OF TIGRAY REGION, ETHIOPIA
86
22. What is the estimated average annual total household income?
Before 5 years now 1. <= 5000 _____________ _____________ 2. 5001-10000 _____________ _____________ 3. 10001-15000 _____________ _____________ 4. >=15001 _____________ _____________
23. Changes in accumulated assets/Households
Before Program after Program Oxen _____________ _____________ Cows _____________ _____________ Sheep Holding _____________ _____________ Goat Holding _____________ _____________ Poultry _____________ _____________ Bee Hives _____________ _____________ Horse’s _____________ _____________ Donkey _____________ _____________ Others _____________ _____________
24. Changes on crop productivity (Yield) Before Program After Program 1. <= 5 Qt _____________ _____________ 2. 5 – 7 Qt _____________ _____________ 3. 7.1 – 12 Qt _____________ _____________ 4. 12.1 – 16 Qt _____________ _____________
25. Do you introduce water harvesting structures and techniques? 1 = Yes, ___ 2 =No ___ 26. Why did you practice the water harvesting structure?
• For supplementary irrigation _________ • For human drinking _________ • For animal drinking __________ • for home consumption __________ • Others, specify __________
27. What were the benefits of the water harvesting technology? • Increase production __________________ • Increase farm income __________________ • Make water available for livestock __________________ • Make water available for human drinking __________________ • Others, specify __________________
28. What type of water /moisture/ harvesting techniques do you apply? • Small water harvesting structures for irrigation schemes _______________________ • Pond construction _______________________ • Hand Dug wells ____________________ • River diversion _____________________ • Other ______________________
29. Have you experienced a change in the quantity of water available for human and livestock consumption because of programme activities?
Not at all ____ some _________ Very much _________ 30. Has there been a change in employment opportunities since the programme commenced? Yes _______ No _______

87
31. If yes, in what way and to what extent have you benefited form employment opportunities provided? IN WHAT WAY? HOW MANY PERSON DAYS
HAVE YOU OR MEMBERS OF YOUR FAMILY BEEN EMPLOYED IN PUBLIC WORKS (FFW) IN A MONTH?
PERCEIVED INCREASE IN EMPLOYMENT*
* Perceived increase in employment: 1=Low 2= Slight increase 3= Significant increase 4=High 5=Very High 32. Have you/your family members attended any training since the programme began? Yes ______ No ________ 33. What type of training did you get since the program began?
1. Livestock/agriculture 2. Watershed management 3. Soil conservation 4. Pond construction 5. Road construction
34. Do you participate in a public works programs through food-for-work (FFW)? 1. Yes __________ 2. No _________ 35. If yes what are the benefits of participating in the program?
35.1 Does FFW help you in supplementary employment? Yes ____ No______ 35.2 Does FFW help households adopt fertilizer? Yes ____ No______ 35.3 Does FFW prevent distress sale in the event of shocks like drought? Yes ____No______
36. Have you receive credit service from the government in the last 5 years? 1 = Yes __________ 2 =No ____________ If yes for what purpose did you spend?
1-Education _________ 2-Non-farm business __________ 3-Farm inputs ________________ 4-Buy Cattle ____________ 6-Food and Clothing ___________ 8-Other (specify) ______________
37. What is the predominant type of environmental conservation on your parcel of land? (a) None ______ (b) Tree planting _____ (c) Terracing _______ (d) Fallowing____ (e) intercropping _____ (f) ridging _______ (g) Grass strips ____ (h) Strip cropping _______ (i) other (specify) ___ 38. What are the main environmental rehabilitation activities underway at the community level? 1. ___________________________________________________ 2. ___________________________________________________ 3. ____________________________________________________ 4. ____________________________________________________ 39. To what extent is the government committed to address the root causes of drought?
5 years ago now 5 Very high ______________ ______________ 4 High ______________ ______________ 3 Moderate ______________ ______________ 2 Low ______________ ______________ 1 Very low ______________ ______________
MITIGATING DROUGHT: POLICY IMPACT EVALUATION; A CASE OF TIGRAY REGION, ETHIOPIA
88
40. Do you think these government measures have brought changes in your livelihoods? 1. Yes __________ 2. No _________ 41. To what extent are government measures are effective?
5 Very high ______________ 4 High ______________ 3 Moderate ______________ 2 Low ______________ 1 Very low ______________
42. Has there been change in the type and number of assets purchased for the home because of income generated by the programme? Such items include radios, stoves, improved roofing, furniture etc. Indicate the extent of change.
Decrease ______ No increase _____ Slight increase _______ significant increase______ 43. Has there been a change in the type and number of farm assets purchased or constructed, because of programme interventions? Indicate the extent of change.
Decrease ____ No increase _____ Slight increase _____ significant increase _____ 44. What has been a change after the programme?
AFTER THE PROGRAMME RESPONSE:
1= LESS
2=SAME
3= MORE
EXPLAIN :
1= BECAUSE OF THE PROGRAMME
2= BECAUSE OF OTHER FACTORS
Has there been a change in the number of meals taken?
Has there been a change in the type of food eaten?
Has there been a change in the production of food crops?
Has there been a change in food consumption (quality/quantity)
Has there been a change in the amount of money you spend on meat, vegetables, fruit etc.
Has there been a change for money spent on education, health clothing, and shelter?
Is there a change for aid received?
Compare you food security status of today with five years go.
.
Thank you