mitigating the effects of urbanization with bioretention ... · of urbanization with bioretention...
TRANSCRIPT

Mitigating the Effects
of Urbanization with
Bioretention Rain Gardens
Amanda Cording, PhD Candidate
WRRC Seminar Series
February 5, 2015

Global Population will Reach 9.6 Billion by 2050
Image source: www.nasa.gov Source: U.N. Report (2013)

Increased Development Causes Water Quality Impairment

86 Square Miles of Bays and Estuaries are Impaired In Hawaii
Source: EPA (2010) Hawaii Water Quality Assessment Report

Proposed Management Strategies
Penn (2013) Valuation of Recreational Beach Quality and Water Quality Management Strategies in Oahu, Thesis

Low Impact Development
Low Impact Development
Green Roofs
Porous Pavement
Vegetated Swales Constructed Wetlands
Rain Gardens
LID is an approach to land development (or re-development) that works with nature to manage stormwater
as close to its source as possible.

Goals of LID & Bioretention
Volume Reduction
Pollutant Removal
Peak Flow Retention
Aesthetics
Sustainability

What is Bioretention?
Source: northfield.org
Pollutant Removal Mechanisms:
1. Physical 2. Biological 3. Chemical

What is Bioretention? Reference Definition
Davis, A. P., Shokouhian, M., Sharma, H., &
Minami, C. (2001). Laboratory Study of
Biological Retention of Urban Stormwater.
Water Environment Research, 73(1), 5–14.
• Layers of soil, mulch, and a variety of plant species.
• Soil: high sand content to provide rapid infiltration
but with low levels of silt and clay
Vermont Agency of Natural Resources. (2002).
The Vermont Stormwater Management
Manual Volume I - Stormwater Treatment
Standards (Vol. I).
• Shallow depression that treats stormwater as it
flows through a soil matrix, and is returned to the
storm drain system
Washington State University Pierce County Extension. (2012). Low Impact Development Technical Guidance Manual for Puget Sound.
• Soil is a highly permeable sandy mineral aggregate
mixed with compost.

Simple

Complex

Residential Scale

Neighborhood Scale

City Scale

Hydrologic Performance
Attenuated Peak Flow > 95% Reduced Volume > 97%
Hunt et al. (2008); Debusk et al. (2011)
Image Source: Liu et al. (2014)

Sediment Removal Performance
Removal of Total Suspended Solids
70%-99%
Brown and Hunt (2011); Bratieres et al. (2008); Hatt et al. (2008)

Nutrient Removal Performance
• Nutrient removal is variable • Phosphorus export is common • Nitrate is often exported unless
systems are designed to promote denitrification
Davis et al. (2001); Hunt et al. (2006); Debusk et al. (2011)
Image Credit: Amanda Cording

Phosphorus Removal Mechanisms
Tanner (1996); Arias et al. (2001); Lucas and Greenway (2011); Liping et al. (2012)
1. Soil Sorption Fe, Ca and Al > 90%
2. Plant Uptake (3% - 30%)

Nitrogen Removal Mechanisms
Davis et al. (2006); Bratieres et al. (2008); Kim et al. (2003)
Nitrogen Chemistry
Nitrification (aerobic bacteria) NH4
+ + 2 O2 -> NO3- + H2O + 2H+
NH4+ + H2O -> NH3
+ H3O+
Denitrification (anoxic bacteria) 2 NO3
- + organic matter -> N2 (N2O) + CO2 + H2O

Amanda Cording, PhD Candidate [email protected] UVM Department of Plant and Soil Science 230 Jeffords Hall Burlington, VT 05405 774.262.6256 Dr. Stephanie Hurley, Advisor and PI UVM Department of Plant and Soil Science Dr. Carol Adair, Committee Member and Co-PI UVM Rubenstein School of the Environment and Natural Resources Project Website: http://www.uvm.edu/~pss/?Page=bioretentionproject.html
University of Vermont
Bioretention Laboratory:
Partners

Research Questions
1. What are the characteristics of first flush pollutants from road-side watersheds? How do their mobilization thresholds compare?
2. How will bioretention performance be affected by increased precipitation predicted as a result of climate change?
3. How do two soil media mixes compare with regards to nutrient and sediment removal?
4. How do two common planting designs compare with regards to nutrient and sediment removal?
5. How do greenhouse gas emissions from the soil profile compare among the different treatments?
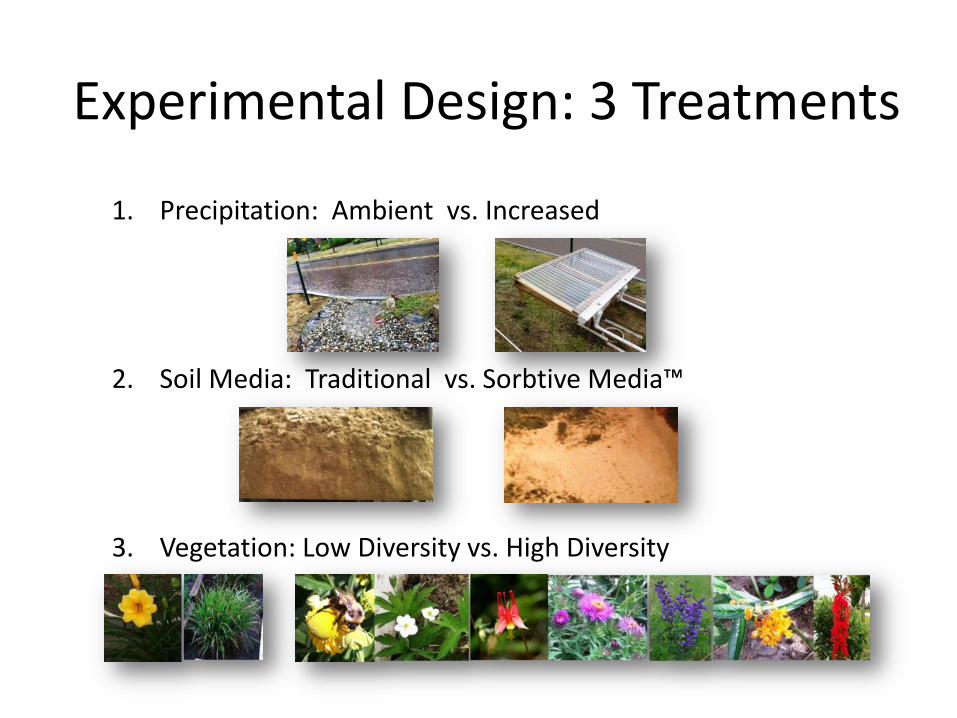
Experimental Design: 3 Treatments
1. Precipitation: Ambient vs. Increased
2. Soil Media: Traditional vs. Sorbtive Media™
3. Vegetation: Low Diversity vs. High Diversity

Experimental Design Layout
Cell with Rain Pan
5
2
7 6
1
434 357 674
576 320 658
3
7 8
2 6
3
1
4
5
LOW DIV
HIGH DIV
AMB INCREASED INCREASED AMB
SORBTIVE MEDIA ™
Legend
AMB Ambient Rainfall
Precipitation Treatment
Vegetative Treatment
Sorbtive Media ™ Treatment
* Cell Area is listed in the watershed as ft2
Precipitation
Vegetation
Soil Media

Methods: Measuring Flow Rate (Q)
Inflow 90o Weir Box Outflow Thel-Mar™ Weir
Where:
Q = flow rate over the weir (L/s)
H= depth of water (head) behind the weir (pressure transducer)
n = an empirical exponent (dimensionless)
C= coefficient of discharge, or weir coefficient
Q=CHn

Methods: Water Quality Monitoring
Equipment Parameter
• ISCO 6712 Automatic Samplers • Model 720 Pressure Transducer
24 Samples Inflow and Outflow
8 Bioretention Cells (2-4 min for 24 to 48 min)
1. Total Nitrogen (TN) 2. Total Phosphorus (TP) 3. Nitrite+Nitrate-N (NO3
-) 4. Soluble Reactive Phosphorus (SRP) 5. Total Suspended Solids (TSS) 6. Flow Rate (Q)
*units: μg/L, mg/L, L/s or ft3/s (cfs)

Methods: Soil Conditions Equipment Parameter
• Soil Probes at Two Depths • High Resolution Rain Gauge
1. Soil Temperature 2. Volumetric Water Content 3. Electrical Conductivity 4. Rainfall

Inflow Monitoring Using 90o V-notch Weir Box

Outflow Monitoring Using 6” In-Pipe Thel-Mar ™ Weir

Installing Outflow Monitoring Equipment

Vegetation Planted: May 2013
Low Diversity (2 species) vs. High Diversity (7 species)
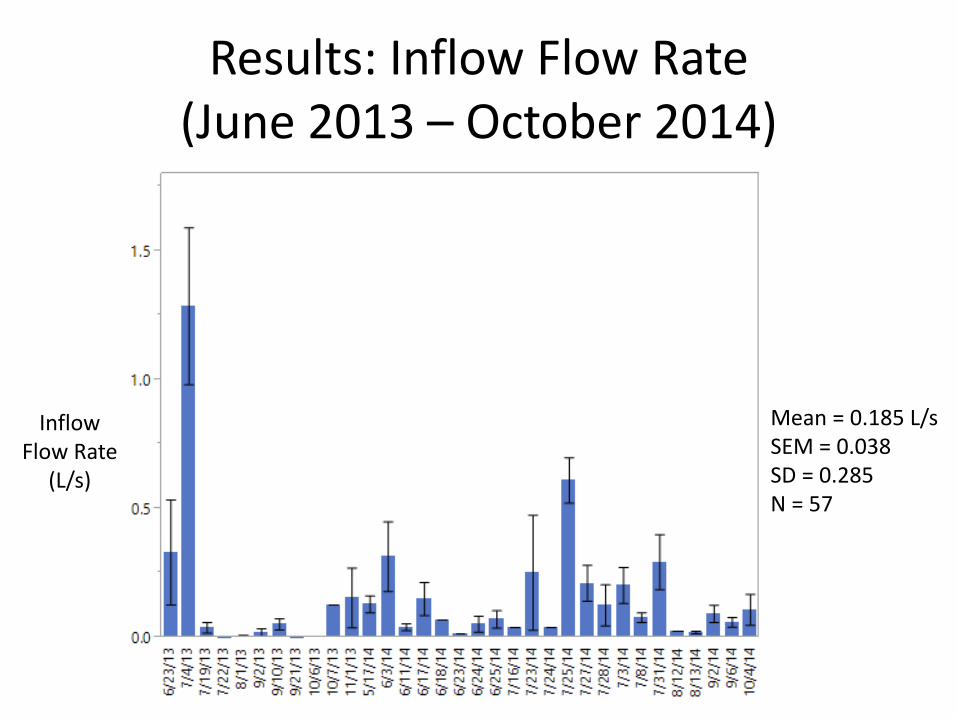
Results: Inflow Flow Rate (June 2013 – October 2014)
Mean = 0.185 L/s SEM = 0.038 SD = 0.285 N = 57
Inflow Flow Rate
(L/s)

Results: Outflow Flow Rate (June 2013 – October 2014)
Mean = 0.033 L/s SEM = 0.005 SD = 0.039 N = 58
Outflow Flow Rate
L/s

Flow Rate Reduction Performance
Inflow Outflow
Average Flow Rate
(L/s)
Average Flow Rate Reduction:
82%
Average of all cells, all storms (L/s):
Inflow Flow Rate = 0.185
Outflow Flow Rate = 0.033
N = 57
N = 58

Sediment Reduction Performance
TSS Load (mg)
Inflow Outflow
Average TSS Load (mg):
Inflow Load = 1,590 Outflow Load = 110
N= 54
N = 49
Average
TSS Reduction: 93%

Inflow Phosphorus Characteristics
Inflow Mass Load
(μg)
2,137 μg
5,881 μg
SRP TP
Average Inflow
Phosphorus Characteristics:
36% Soluble
64% Particulate
N = 55

Outflow Phosphorus Characteristics
Outflow Mass Load
(μg)
N= 54 SRP TP
Average Outflow
Phosphorus Characteristics:
87% Soluble
13% Particulate
10,629 μg
12,208 μg

Particulate Phosphorus Inflow vs Outflow
Mass Load (μg)
N = 55
N = 54
Inflow Outflow
Average
Particulate P Reduction:
48%
Average Particulate
Phosphorus Mass (μg):
Inflow = 3,744 Outflow = 1,939

Soluble Reactive Phosphorus (SRP) Inflow vs. Outflow
SRP Load (μg)
Inflow Outflow
Average SRP Mass Load (μg):
Inflow Load = 2,099
Outflow Load = 10,629 N= 56
N = 58
Exporting SRP (5x)

Baseline Conditions: 60:40 Sand Compost Mix
0
50
100
150
200
250
300
350
60:40 Compost Mix (Top 12")
mg/kg
K
Mg
Available Phosphorus
Na
S
Mn
Al
Fe
Zn
B
Cu
190 mg/kg

Total Available Phosphorus in Top 15 cm of Bioretention Soil
Available Phosphorus
mg/kg

Inflow Nitrogen Characteristics
Inflow Mass Load
(μg) 8,127 μg
26,595 μg
NO3- TN
Average Inflow
Nitrogen Characteristics:
31% Nitrite + Nitrate 69% Organic N + NH4
+
N = 48

Outflow Nitrogen Characteristics
Outflow Mass Load
(μg)
12,225 μg
N = 52 NO3- TN
Average Outflow
Nitrogen Characteristics:
55% Nitrite + Nitrate 44% Organic N + NH4
+
22,051 μg


References 1. Blecken, G.-T., Zinger, Y., Deletić, A., Fletcher, T. D., Hedström, A., and Viklander, M. (2010). “Laboratory study on stormwater
biofiltration: Nutrient and sediment removal in cold temperatures.” Journal of Hydrology, 394(3-4), 507–514.
2. Claytor, R. A., & Schueler, T. R. (1996). Design of Stormwater Filtering Systems (pp. 1–220).
3. Collins, K. a., Lawrence, T. J., Stander, E. K., Jontos, R. J., Kaushal, S. S., Newcomer, T. a., Grimm, N. B., and Cole Ekberg, M. L. (2010). “Opportunities and challenges for managing nitrogen in urban stormwater: A review and synthesis.” Ecological Engineering, Elsevier B.V., 36(11), 1507–1519.
4. Davis, A. P., Shokouhian, M., Sharma, H., and Minami, C. (2006). “Water quality improvement through bioretention media: nitrogen and phosphorus removal.” Water environment research, Water Environment Federation, 78(3), 284–93.
5. Dietz, M. E., & Clausen, J. C. (2005). A Field Evaluation of Rain Garden Flow and Pollutant Treatment. Water, Air, and Soil Pollution, 167, 123–138.
6. Dietz, M. E., & Clausen, J. C. (2006). Saturation to improve pollutant retention in a rain garden. Environmental Science & Technology, 40(4), 1335–40. Retrieved from http://www.ncbi.nlm.nih.gov/pubmed/16572794
7. Harper, C. W., Blair, J. M., Fay, P. A., Knapp, A. K. and Carlisle, J. D. 2005. “Increased rainfall variability and reduced rainfall amount decreases soil CO2 flux in a grassland ecosystem.” Global Change Biol. 11, 322-334.
8. Hatt, B. E., Fletcher, T. D., and Deletic, A. (2008). “Hydraulic and pollutant removal performance of fine media stormwater filtration systems.” Environmental Science & Technology, 42(7), 2535–41.
9. Hsieh, C. & Davis, A. P. Evaluation and Optimization of Bioretention Media for Treatment of Urban Storm Water Runoff. 131, 1521–1531 (2006).
10. Hunt, W. F., Jarrett, A. R., Smith, J. T., and Sharkey, L. J. (2007). “Evaluating Bioretention Hydrology and Nutrient Removal at Three Field Sites in North Carolina.” Journal of Irrigation and Drainage Engineering, 132(6), 600–608.
11. Kim, H., Seagren, E. A., Davis, A. P., and Davis, P. (2003). “Engineered Bioretention for Removal of Nitrate from Stormwater Runoff.” Water Environment Federation, 75(4), 355–367.
12. Ventera, R. & Parkin, T. USDA-ARS GRACEnet Project Protocols Chapter 3. Chamber-Based Trace Gas Flux Measurements 4. 2010, 1–39 (2010).
13. Vermont Agency of Natural Resources. (2002). The Vermont Stormwater Management Manual Volume I - Stormwater Treatment Standards (Vol. I).
14. Washington State University Pierce County Extension. (2012). Low Impact Development Technical Guidance Manual for Puget Sound.