mitigation of synchronous machine based distributed
TRANSCRIPT

MITIGATION OF SYNCHRONOUS MACHINE
BASED DISTRIBUTED GENERATION INFLUENCES
ON FUSE-RECLOSER PROTECTION SYSTEMS IN
RADIAL DISTRIBUTION NETWORKS USING
SUPERCONDUCTING FAULT CURRENT LIMITERS
A Thesis
Submitted to the College of Graduate Studies and Research
In Partial Fulfillment of the Requirements
For the Degree of Master of Science
In the Department of Electrical and Computer Engineering
University of Saskatchewan
Saskatoon, Saskatchewan
By
Keaton A. Wheeler
© Copyright Keaton A. Wheeler, February 2015. All rights reserved

i
PERMISSION TO USE
I agree that the Library, University of Saskatchewan, may make this thesis freely available for
inspection. I further agree that permission for copying of this thesis for scholarly purpose may be
granted by the professor or professors who supervised the thesis work recorded herein or, in their
absence, by the Head of the Department or the Dean of the College in which the thesis work was
done. It is understood that due recognition will be given to me and to the University of
Saskatchewan in any use of the material in this thesis. Copying or publication or any other use of
this thesis for financial gain without approval by the University of Saskatchewan and my written
permission is prohibited.
Request for permission to copy or to make any other use of the material in this thesis in whole or
part should be addressed to:
Head of the Department of Electrical and Computer Engineering
University of Saskatchewan
57 Campus Drive
Saskatoon, Saskatchewan S7N 5A9
Canada

ii
ABSTRACT
Distributed generation (DG) is increasingly employed in modern utility grids to address
the growing complexity and size of consumer energy demands. The obstacles associated with DG
integration are related to the additive effect the DG has on the short circuit current characteristics
of power systems during short circuit conditions.
This thesis proposes a novel mitigation technique for synchronous machine based DG
integration effects on existing radial fuse-recloser protection infrastructure. The mitigation method
provides a comparative analysis of the utilization of resistive (R), inductive (L) and resonant (LC)
type superconducting fault current limiters (FCLs) for prevention of excessive fault current
contribution from DG sources. Within the frame of reference of this thesis is an interrogation into
the effects of synchronous machine based DG sources, in conjunction with mitigation capabilities
of FCL integration in the context of fuse-recloser coordination, recloser sensitivity and recloser
directionality behavior during radial distribution short circuit conditions. For validation purposes,
the proposed methods are demonstrated on a suburban test benchmark using the PSCAD/EMTDC
program.

iii
ACKNOWLEDGEMENTS
Foremost, I would like to express my sincere gratitude to my supervisor Dr. Sherif O.
Faired. This thesis would not have been possible without your continuous support, enthusiasm and
guidance and it has helped me develop a passion and motivation for problem solving.
I would also like to thank Dr. Mohamed Elsamahy for his constant encouragement and
support throughout the duration of this research. Your advice and guidance has been invaluable in
my academic and professional journey.
I would also like to express my appreciation to my parents, sister and friends for their
encouragement and support. Special thanks go to my mother, Colleen Wheeler, for helping me
with the editing of this thesis.

iv
TABLE OF CONTENTS
PERMISSION TO USE ................................................................................................................... i
ABSTRACT .................................................................................................................................... ii
ACKNOWLEDGEMENTS ........................................................................................................... iii
TABLE OF CONTENTS ............................................................................................................... iv
LIST OF TABLES ....................................................................................................................... vii
LIST OF FIGURES ..................................................................................................................... viii
LIST OF SYMBOLS .................................................................................................................... xv
LIST OF ABBREVIATIONS .................................................................................................... xviii
1. INTRODUCTION ........................................................................................................... 1
1.1 Distributed Generation ..................................................................................................... 1
1.1.1 Interconnection of Distributed Resources .................................................................. 3
1.2 Power System Protection ................................................................................................. 4
1.2.1 Protective Devices ...................................................................................................... 4
1.2.2 Protection Coordination of Radial Distribution Networks ......................................... 8
1.3 Fault Current Limiters ...................................................................................................... 9
1.4 Literature Review ............................................................................................................. 9
1.5 Research Objective and Scope of the Thesis ................................................................. 11
2. MODELING OF POWER SYSTEMS FOR DISTRIBUTED GENERATION IMPACT
ASSESSMENTS ............................................................................................................ 13
2.1 Introduction .................................................................................................................... 13
2.2 System under Study ........................................................................................................ 13
2.2.1 Network .................................................................................................................... 13
2.2.2 Protection Coordination Paths .................................................................................. 14
2.2.3 Protection Settings .................................................................................................... 19
2.2.4 Candidate DG Interconnection Points ...................................................................... 27
2.3 Power System Modeling ................................................................................................ 27
2.3.1 Modeling of the Utility ............................................................................................. 27
2.3.2 Modeling of Distribution Lines ................................................................................ 27
2.3.3 Modeling of transformers ......................................................................................... 29
2.3.4 Modeling of system loads ......................................................................................... 30
2.3.5 Induction Motor Model ............................................................................................ 31
2.3.6 Modeling of the Synchronous DG ............................................................................ 32
2.3.7 Modeling of the Fault Current Limiters ................................................................... 35

v
2.4 A Sample Case Study: Effects of DG Integration on Short Circuit Level ..................... 38
2.5 Summary ........................................................................................................................ 43
3. STRATEGIES FOR DG INTEGRATION IMPACT ASSESSMENTS ON
PROTECTION INFRASTRUCTURE IN DISTRIBUTION NETWORKS ................. 44
3.1 Introduction .................................................................................................................... 44
3.2 Loss of Fuse-Recloser Coordination Assessment due to DG Source Interconnection .. 44
3.2.1 Loss of Fuse-Recloser Coordination Definition and Method of Assessment .......... 44
3.2.2 Loss of Fuse-Recloser Coordination Case Study ..................................................... 46
3.3 Loss of Sensitivity Assessment due to Interconnection of DG sources ......................... 59
3.3.1 Loss of Sensitivity Definition and Method of Assessment ...................................... 59
3.3.2 Loss of Recloser Sensitivity Case Study .................................................................. 60
3.4 Bi-Directionality Assessment due to Interconnection of DG sources............................ 66
3.4.1 Bi-Directionality Definition and Method of Assessment .......................................... 66
3.4.2 Bi-Directionality Case Study .................................................................................... 68
3.5 Summary ........................................................................................................................ 76
4. THE UTILIZATION OF FCLS IN THE MITIGATION OF SYNCHRONOUS
MACHINE BASED DG INFLUENCES ON FUSE-RECLOSER PROTECTION
INFRASTRUCTURE .................................................................................................... 77
4.1 Introduction .................................................................................................................... 77
4.2 Fault Current Contribution from Synchronous Machine Based DG Integration in the
Presence of FCLs ........................................................................................................... 77
4.3 The Use of FCLs for the Mitigation of Synchronous Machine Based DG Influences on
Fuse-Recloser Coordination........................................................................................... 84
4.3.1 Bus 1 DG Connection ............................................................................................... 85
4.3.2 Bus 2 DG Connection ............................................................................................... 86
4.3.3 Bus 4 DG Connection ............................................................................................... 90
4.3.4 Bus 5 DG Connection ............................................................................................... 94
4.3.5 DG Connection Summary ........................................................................................ 98
4.4 The use of FCLs for the Mitigation of Synchronous Machine Based DG Influences on
Recloser Sensitivity ....................................................................................................... 99
4.4.1 Bus 1 DG Connection ............................................................................................... 99
4.4.2 Bus 2 DG Connection ............................................................................................. 104
4.4.3 Bus 4 DG Connection ............................................................................................. 106
4.4.4 Bus 5 DG Connection ............................................................................................. 108
4.4.5 DG Connection Summary ...................................................................................... 110
4.5 The use of FCLs for the Mitigation of Synchronous Machine Based DG Influences on
Recloser Bi-Directionality ........................................................................................... 111
4.5.1 Bus 1 DG Connection ............................................................................................. 111
4.5.2 Bus 2 DG Connection ............................................................................................. 116

vi
4.5.3 Bus 4 DG Connection ............................................................................................. 119
4.5.4 Bus 5 DG Connection ............................................................................................. 121
4.5.5 DG Connection Summary ...................................................................................... 123
4.6 Summary ...................................................................................................................... 123
5. SUMMARY AND CONCLUSIONS .......................................................................... 124
5.1 Critical Analysis of Results .......................................................................................... 124
5.2 Summary ...................................................................................................................... 126
5.3 Conclusions .................................................................................................................. 127
REFERENCES ........................................................................................................................... 129
APPENDIX A ............................................................................................................................. 134
APPENDIX B ............................................................................................................................. 137

vii
LIST OF TABLES
Table 1.1: Advantages and disadvantages of interconnecting transformers. ................................. 3
Table 1.2: Hydro One preferred interconnection transformer connections. .................................. 4
Table 1.3: Typical CT current ratios. ............................................................................................. 7
Table A.1: Synchronous generator data. .................................................................................... 134
Table A.2: Transformer data. ..................................................................................................... 135
Table A.3: Line and cable data. ................................................................................................. 135
Table B.1: Short circuit currents for varying fault types at the bus 5 load. ............................... 137
Table B.2: Short circuit currents for varying fault types at the bus 4. ....................................... 137
Table B.3: Short circuit currents for varying fault types at the bus 3. ....................................... 137
Table B.4: Short circuit currents for varying fault types at the bus 2. ....................................... 138

viii
LIST OF FIGURES
Figure 1.1: A basic configuration of a DFIG wind turbine. .......................................................... 2
Figure 1.2: A typical DG interconnecting scheme. ....................................................................... 3
Figure 1.3: Time-Current Characteristic of a Kearney 100T fuse. ................................................ 5
Figure 1.4: Time-Current Characteristics of an ABB PCD 2000 Recloser. .................................. 6
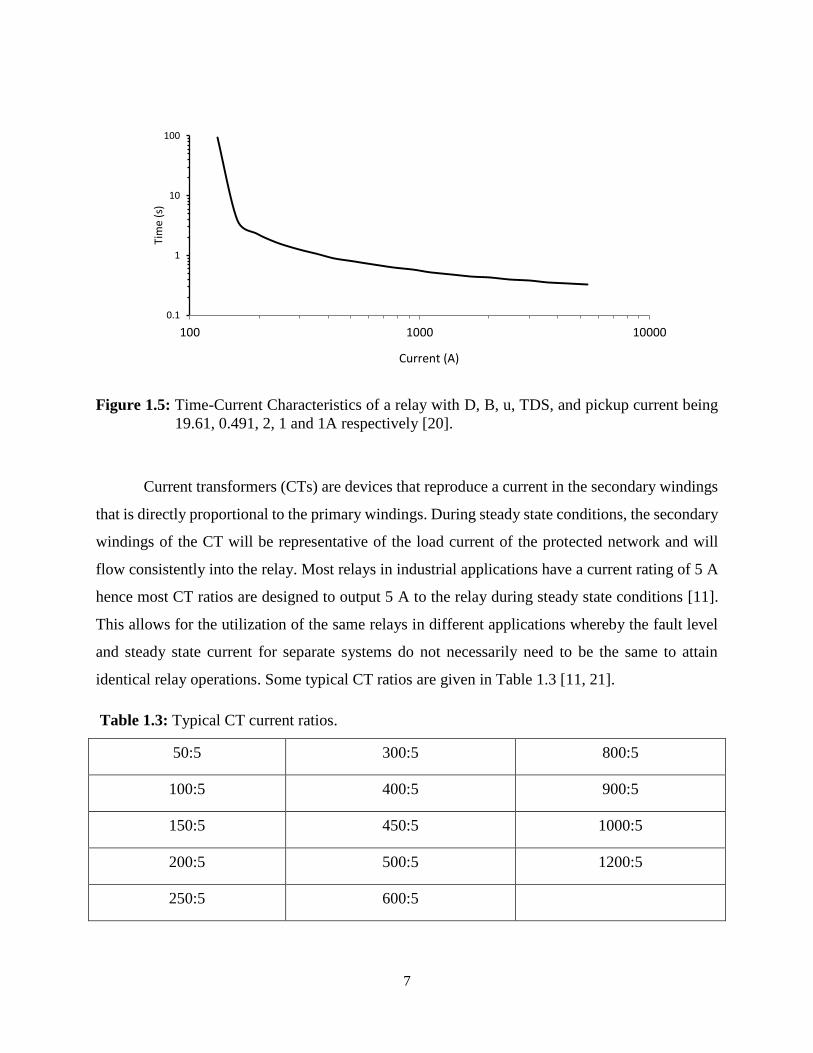
Figure 1.5: Time-Current Characteristics of a relay with D, B, u, TDS, and pickup current being
19.61, 0.491, 2, 1 and 1A respectively. ....................................................................... 7
Figure 1.6: Typical characteristic curves for protection coordination in radial distribution
networks. .................................................................................................................. 8
Figure 2.1: Single line diagram of the suburban distribution system under study. ..................... 14
Figure 2.2: Single line diagram of the suburban distribution system bus 5 coordination path. .. 15
Figure 2.3: Single line diagram of the suburban distribution system bus 4 coordination path. .. 16
Figure 2.4: Single line diagram of the suburban distribution system bus 3 coordination path. .. 17
Figure 2.5: Single line diagram of the suburban distribution system bus 2 coordination path. .. 18
Figure 2.6: Phase coordination chart for the suburban distribution system bus 5 path. .............. 21
Figure 2.7: Ground coordination chart for the suburban distribution system bus 5 path. ........... 22
Figure 2.8: Phase coordination chart for the suburban distribution system bus 4 path. .............. 24
Figure 2.9: Ground coordination chart for the suburban distribution system bus 4 path. ........... 24
Figure 2.10: Phase coordination chart for the suburban distribution system bus 2/3 path. ......... 26
Figure 2.11: Ground coordination chart for the suburban distribution system bus 2/3 path. ...... 26
Figure 2.12: The nominal PI model for distribution lines . ......................................................... 28
Figure 2.13: Modeling of the synchronous machine in the d-q reference frame. ........................ 32
Figure 2.14: Resistive type superconducting FCL....................................................................... 35
Figure 2.15: Current through fuse 2 during a three phase to ground fault at bus 5 with and without
a 60 Ω FCL_R. ........................................................................................................ 36
Figure 2.16: Inductive type superconducting FCL. ..................................................................... 37
Figure 2.17: Resonant type superconducting FCL. ..................................................................... 38
Figure 2.18: Suburban distribution system bus voltages without DG integration. ...................... 39
Figure 2.19: Time-domain RMS current simulation for a fault applied at bus 4. ....................... 40
Figure 2.20: Fault current experienced by the relay and respective bus fuse for a three phase fault.
................................................................................................................................. 40
Figure 2.21: Suburban distribution system bus voltages with DG integration at bus 1. ............. 41
Figure 2.22: Time-domain RMS current simulation for a fault applied at bus 4 with 8.4 MVA DG
integration at bus 1. ................................................................................................. 42
Figure 2.23: Fault current experienced by the relay and respective bus fuse for a three phase fault
at bus 4 for both 8.4 MVA DG integrated at bus 1 and non-DG integrated systems.
................................................................................................................................. 42

ix
Figure 3.1: Algorithm for the determination of DG penetration level before the occurrence of loss
of fuse-recloser coordination. ................................................................................... 45
Figure 3.2: Time-domain RMS current simulation for a three phase fault applied at bus 2 with a
5.2 MVA synchronous machine based DG source integrated at bus 1. .................... 48
Figure 3.3: Suburban distribution system with DG integration at bus 2. .................................... 49
Figure 3.4: Time-domain RMS current simulation for a three phase fault applied at bus 4 with a
5.5 MVA synchronous machine based DG source integrated at bus 2. .................... 50
Figure 3.5: Time-domain RMS current simulation for a three phase fault applied at bus 2 with a
5.5 MVA synchronous machine based DG source integrated at bus 2. .................... 51
Figure 3.6: Suburban distribution system with DG integration at bus 4. .................................... 52
Figure 3.7: Time-domain RMS current simulation for a three phase fault applied at bus 4 with a
3.8 MVA synchronous machine based DG source integrated at bus 4. .................... 53
Figure 3.8: Time-domain RMS current simulation for a three phase fault applied at bus 2 with a
3.8 MVA synchronous machine based DG source integrated at bus 4. .................... 54
Figure 3.9: Suburban distribution system with DG integration at bus 5. .................................... 55
Figure 3.10: Time-domain RMS current simulation for a three phase fault applied at bus 4 with a
3.8 MVA synchronous machine based DG source integrated at bus 5. .................. 56
Figure 3.11: Time-domain RMS current simulation for a three phase fault applied at bus 2 with a
3.8 MVA synchronous machine based DG source integrated at bus 5. .................. 57
Figure 3.12: Synchronous machine based DG penetration levels for differing interconnection
points in the suburban distribution system before loss of fuse-recloser coordination
occurs. .................................................................................................................... 58
Figure 3.13: Algorithm for the determination of DG penetration level before the occurrence of
recloser loss of sensitivity. ..................................................................................... 60
Figure 3.14: Time-domain recloser RMS current simulation for a line to line fault applied at the
bus 5 load with synchronous machine based DG sources integrated at bus 1. ...... 61
Figure 3.15: Time-domain recloser RMS current simulation for a line to line fault applied at the
bus 5 load with synchronous machine based DG sources integrated at bus 2. ...... 62
Figure 3.16: Time-domain recloser RMS current simulation for a line to line fault applied at the
bus 5 load with synchronous machine based DG sources integrated at bus 4. ...... 63
Figure 3.17: Time-domain recloser RMS current simulation for a line to line fault applied at the
bus 5 load with synchronous machine based DG sources integrated at bus 5. ...... 64
Figure 3.18: Synchronous machine based DG penetration levels for differing interconnection
points in the suburban distribution system before loss of recloser sensitivity occurs.
................................................................................................................................ 65
Figure 3.19: Short circuit contribution for a radial distribution network with DG integration. .. 66
Figure 3.20: Algorithm for the determination of DG penetration level before the occurrence of
recloser bi-directionality. ....................................................................................... 68
Figure 3.21: Phase Time-Current Characteristics of the main and parallel feeder head end recloser.
................................................................................................................................ 69

x
Figure 3.22: Ground Time-Current Characteristics of the main and parallel feeder head end
recloser. .................................................................................................................. 69
Figure 3.23: Time-domain primary feeder recloser RMS current simulation for a line to line to
ground fault applied at the parallel feeder with main feeder synchronous machine
based DG source integration at bus 1. .................................................................... 70
Figure 3.24: Time-domain primary feeder recloser RMS current simulation for a three phase fault
applied at the parallel feeder with main feeder synchronous machine based DG
source integration at bus 1. ...................................................................................... 71
Figure 3.25: Time-domain primary feeder recloser RMS current simulation for a line to line to
ground fault applied at the parallel feeder with main feeder synchronous machine
based DG source integration at bus 2. .................................................................... 72
Figure 3.26: Time-domain primary feeder recloser RMS current simulation for a line to line to
ground fault applied at the parallel feeder with main feeder synchronous machine
based DG source integration at bus 4. .................................................................... 73
Figure 3.27: Time-domain primary feeder recloser RMS current simulation for a line to line to
ground fault applied at the parallel feeder with main feeder synchronous machine
based DG source integration at bus 5. .................................................................... 74
Figure 3.28: Synchronous machine based DG penetration levels for differing interconnection
points in the suburban distribution system before bi-directionality occurs for an
adjacent feeder........................................................................................................ 75
Figure 4.1: A DG interconnecting scheme with the presence of FCLs. ...................................... 77
Figure 4.2: Suburban distribution system bus voltages with DG integration at bus 1 with FCL
presence. .................................................................................................................. 78
Figure 4.3: Time-domain RMS current simulation for a three phase fault applied at bus 4 with 8.4
MVA DG integration at bus1 in the presence of a 60 Ω R type FCL. ..................... 79
Figure 4.4: Time-domain RMS current simulation for a three phase fault applied at bus 4 with 8.4
MVA DG integration at bus1 in the presence of a 0.16 H L type FCL. .................. 79
Figure 4.5: Time-domain RMS current simulation for a three phase fault applied at bus 4 with 8.4
MVA DG integration at bus1 in the presence of a resonant type FCL. ................... 80
Figure 4.6: Summary of short circuit currents with an 8.4 MVA synchronous machined based DG
source integrated at bus 1 in the suburban distribution system with a three phase fault
applied at bus 4. ........................................................................................................ 80
Figure 4.7: Time-domain RMS current simulation for a three phase fault applied at bus 4 with 8.4
MVA DG integration at bus1 in the presence of a 50 Ω R type FCL. ..................... 81
Figure 4.8: Time-domain RMS current simulation for a three phase fault applied at bus 4 with 8.4
MVA DG integration at bus1 in the presence of a 20 Ω R type FCL. ..................... 82
Figure 4.9: Time-domain RMS current simulation for a three phase fault applied at bus 4 with 8.4
MVADG integration at bus1 in the presence of a 0.13 H L type FCL. ................... 82
Figure 4.10: Time-domain RMS current simulation for a three phase fault applied at bus 4 with
8.4 MVA DG integration at bus1 in the presence of a 0.05 H L type FCL. .......... 83

xi
Figure 4.11: Summary of short circuit currents for varying resistive FCL magnitudes with an 8.4
MVA synchronous machine based DG source integrated at bus 1 in the suburban
distribution system with a three phase fault applied at bus 4. ................................ 83
Figure 4.12: Summary of short circuit currents for varying inductive FCL magnitudes with an 8.4
MVA synchronous machine based DG source integrated at bus 1 in the suburban
distribution system with a three phase fault applied at bus 4. ................................ 84
Figure 4.13: Suburban distribution system with DG integration at bus 2 with FCL presence. ... 87
Figure 4.14: Time-domain RMS fault current simulation for a three phase fault applied at bus 4
with 8.4 MVA DG integration at bus 2 in the presence of a varying FCL types. .. 88
Figure 4.15: Time-domain RMS recloser current simulation for a three phase fault applied at bus
4 with 8.4 MVA DG integration at bus 2 in the presence of varying FCL types... 88
Figure 4.16: Summary of short circuit currents with an 8.4 MVA synchronous machine based DG
source integrated at bus 2 in the suburban distribution system with a three phase
fault applied at bus 4. ............................................................................................. 89
Figure 4.17: Suburban distribution system with DG integration at bus 4 with FCL presence. ... 91
Figure 4.18: Time-domain RMS fault current simulation for a three phase fault applied at bus 4
with 8.4 MVA DG integration at bus 4 in the presence of a varying FCL types. .. 92
Figure 4.19: Time-domain RMS recloser current simulation for a three phase fault applied at bus
4 with 8.4 MVA DG integration at bus 4 in the presence of varying FCL types... 92
Figure 4.20: Summary of short circuit currents with an 8.4 MVA synchronous machine based DG
source integrated at bus 4 in the suburban distribution system with a three phase fault
applied at bus 4. ....................................................................................................... 93
Figure 4.21: Suburban distribution system with DG integration at bus 5 with FCL presence. ... 95
Figure 4.22: Time-domain RMS fault current simulation for a three phase fault applied at bus 4
with 8.4 MVA DG integration at bus 5 in the presence of a varying FCL types. ... 96
Figure 4.23: Time-domain RMS recloser current simulation for a three phase fault applied at bus
4 with 8.4 MVA DG integration at bus 5 in the presence of varying FCL types. .. 96
Figure 4.24: Summary of short circuit currents with an 8.4 MVA synchronous machine based DG
source integrated at bus 5 in the suburban distribution system with a three phase fault
applied at bus 4. ....................................................................................................... 97
Figure 4.25: Time-domain recloser RMS current simulation for a line to line fault applied at the
bus 5 load with an 8.4 MVA synchronous machine based DG source integrated at
bus 1 with FCL presence. ........................................................................................ 99
Figure 4.26: Time-domain recloser RMS current simulation for a line to line fault applied at the
bus 5 load with a 55.6 MVA synchronous machine based DG source integrated at
bus 1 with FCL presence. ..................................................................................... 100
Figure 4.27: Summary of recloser short circuit currents with an 8.4 MVA and 55.6 MVA
synchronous machine based DG source integrated at bus 1 in the suburban
distribution system with a line to line fault applied at the bus 5 load with FCL
presence. .............................................................................................................. 100

xii
Figure 4.28: Time-domain recloser RMS current simulation for a line to line fault applied at the
bus 5 load with an 8.4 MVA synchronous machine based DG source integrated at
bus 1 with varying resistive FCL impedance. ...................................................... 101
Figure 4.29: Time-domain recloser RMS current simulation for a line to line fault applied at the
bus 5 load with a 55.6 MVA synchronous machine based DG source integrated at
bus 1 with varying resistive FCL impedance. ...................................................... 102
Figure 4.30: Time-domain recloser RMS current simulation for a line to line fault applied at the
bus 5 load with an 8.4 MVA synchronous machine based DG source integrated at
bus 1 with varying inductive FCL impedance. .................................................... 102
Figure 4.31: Time-domain recloser RMS current simulation for a line to line fault applied at the
bus 5 load with a 55.6 MVA synchronous machine based DG source integrated at
bus 1 with varying inductive FCL impedance. .................................................... 103
Figure 4.32: Summary of recloser short circuit currents with an 8.4 MVA and 55.6 MVA
synchronous machine based DG source integrated at bus 1 in the suburban
distribution system with a line to line fault applied at the bus 5 load with varying
resistive FCL impedance. .................................................................................... 103
Figure 4.33: Summary of recloser short circuit currents with an 8.4 MVA and 55.6 MVA
synchronous machine based DG source integrated at bus 1 in the suburban
distribution system with a line to line fault applied at the bus 5 load with varying
inductive FCL impedance. .................................................................................. 104
Figure 4.34: Time-domain recloser RMS current simulation for a line to line fault applied at the
bus 5 load with an 8.4 MVA synchronous machine based DG source integrated at
bus 2 with FCL presence. ..................................................................................... 105
Figure 4.35: Time-domain recloser RMS current simulation for a line to line fault applied at the
bus 5 load with a 55.5 MVA synchronous machine based DG source integrated at
bus 2 with FCL presence. ..................................................................................... 105
Figure 4.36: Summary of recloser short circuit currents with an 8.4 MVA and 55.5 MVA
synchronous machine based DG source integrated at bus 2 in the suburban
distribution system with a line to line fault applied at the bus 5 load with FCL
presence. .............................................................................................................. 106
Figure 4.37: Time-domain recloser RMS current simulation for a line to line fault applied at the
bus 5 load with an 8.4 MVA synchronous machine based DG source integrated at
bus 4 with FCL presence. ..................................................................................... 107
Figure 4.38: Time-domain recloser RMS current simulation for a line to line fault applied at the
bus 5 load with a 50.5 MVA synchronous machine based DG source integrated at
bus 4 with FCL presence. ..................................................................................... 107
Figure 4.39: Summary of recloser short circuit currents with an 8.4 MVA and 50.5 MVA
synchronous machine based DG source integrated at bus 1 in the suburban
distribution system with a line to line fault applied at the bus 5 load with FCL
presence. .............................................................................................................. 108

xiii
Figure 4.40: Time-domain recloser RMS current simulation for a line to line fault applied at the
bus 5 load with an 8.4 MVA synchronous machine based DG source integrated at
bus 5 with FCL presence. ..................................................................................... 109
Figure 4.41: Time-domain recloser RMS current simulation for a line to line fault applied at the
bus 5 load with a 48.8 MVA synchronous machine based DG source integrated at
bus 5 with FCL presence. ..................................................................................... 109
Figure 4.42: Summary of recloser short circuit currents with an 8.4 MVA and 48.8 MVA
synchronous machine based DG source integrated at bus 5 in the suburban
distribution system with a line to line fault applied at the bus 5 load with FCL
presence. .............................................................................................................. 110
Figure 4.43: Time-domain recloser RMS current simulation for a line to line to ground fault
applied at the double load adjacent feeder with a 4.7 MVA synchronous machine
based DG source integrated at bus 1 with FCL presence. ................................... 111
Figure 4.44: Time-domain recloser RMS current simulation for a line to line to ground fault
applied at the double load adjacent feeder with a 8.4 MVA synchronous machine
based DG source integrated at bus 1 with FCL presence. ................................... 112
Figure 4.45: Summary of recloser short circuit currents with a 4.7 MVA and 8.4 MVA
synchronous machine based DG source integrated at bus 1 in the suburban
distribution system with a line to line to ground fault applied at double load
adjacent feeder with FCL presence. ................................................................... 112
Figure 4.46: Time-domain recloser RMS current simulation for a line to line to ground fault
applied at the double load adjacent feeder with a 4.7 MVA synchronous machine
based DG source integrated at bus 1 with varying resistive FCL impedance. .... 113
Figure 4.47: Time-domain recloser RMS current simulation for a line to line to ground fault
applied at the double load adjacent feeder with a 8.4 MVA synchronous machine
based DG source integrated at bus 1 with varying resistive FCL impedance. .... 114
Figure 4.48: Time-domain recloser RMS current simulation for a line to line to ground fault
applied at the double load adjacent feeder with a 4.7 MVA synchronous machine
based DG source integrated at bus 1 with varying inductive FCL impedance. .. 114
Figure 4.49: Time-domain recloser RMS current simulation for a line to line to ground fault
applied at the double load adjacent feeder with a 8.4 MVA synchronous machine
based DG source integrated at bus 1 with varying inductive FCL impedance. .. 115
Figure 4.50: Summary of recloser short circuit currents with a 4.7 MVA and 8.4 MVA
synchronous machine based DG source integrated at bus 1 in the suburban
distribution system with a line to line to ground fault applied at double load adjacent
feeder with varying resistive FCL impedance. .................................................... 115
Figure 4.51: Summary of recloser short circuit currents with a 4.7 MVA and 8.4 MVA
synchronous machine based DG source integrated at bus 1 in the suburban
distribution system with a line to line to ground fault applied at double load adjacent
feeder with varying inductive FCL impedance. .................................................. 116

xiv
Figure 4.52: Time-domain recloser RMS current simulation for a line to line to ground fault
applied at the double load adjacent feeder with a 5 MVA synchronous machine
based DG source integrated at bus 2 with FCL presence. ................................... 117
Figure 4.53: Time-domain recloser RMS current simulation for a line to line to ground fault
applied at the double load adjacent feeder with a 5 MVA synchronous machine
based DG source integrated at bus 2 with FCL presence. ................................... 117
Figure 4.54: Time-domain recloser RMS current simulation for a line to line to ground fault
applied at the double load adjacent feeder with a 8.4 MVA synchronous machine
based DG source integrated at bus 2 with FCL presence. ................................... 118
Figure 4.55: Summary of recloser short circuit currents with a 5 MVA and 8.4 MVA synchronous
machine based DG source integrated at bus 2 in the suburban distribution system
with a line to line to ground fault applied at double load adjacent feeder with FCL
presence. ................................................................................................................ 118
Figure 4.56: Time-domain recloser RMS current simulation for a line to line to ground fault
applied at the double load adjacent feeder with a 5.5 MVA synchronous machine
based DG source integrated at bus 4 with FCL presence. .................................... 119
Figure 4.57: Time-domain recloser RMS current simulation for a line to line to ground fault
applied at the double load adjacent feeder with a 8.4 MVA synchronous machine
based DG source integrated at bus 4 with FCL presence. .................................... 120
Figure 4.58: Summary of recloser short circuit currents with a 5.5 MVA and 8.4 MVA
synchronous machine based DG source integrated at bus 4 in the suburban
distribution system with a line to line to ground fault applied at double load adjacent
feeder with FCL presence. .................................................................................. 120
Figure 4.59: Time-domain recloser RMS current simulation for a line to line to ground fault
applied at the double load adjacent feeder with a 5.8 MVA synchronous machine
based DG source integrated at bus 5 with FCL presence. ................................... 121
Figure 4.60: Time-domain recloser RMS current simulation for a line to line to ground fault
applied at the double load adjacent feeder with a 8.4 MVA synchronous machine
based DG source integrated at bus 5 with FCL presence. ................................... 122
Figure 4.61: Summary of recloser short circuit currents with a 5.8 MVA and 8.4 MVA
synchronous machine based DG source integrated at bus 5 in the suburban
distribution system with a line to line to ground fault applied at double load adjacent
feeder with FCL presence. .................................................................................. 122

xv
LIST OF SYMBOLS
is, ir steady-state DFIG stator and rotor current
ig grid current
A amperes
t(I) time (seconds)
D, B, u TCC curve constants
M input current over pick up current ratio
TDS time dial setting
p.f. power factor
Sload load complex power
VLL line to line voltage
Ω ohm
Z impedance
Y admittance
Pload real load power
Qload reactive load power
V0 initial voltage
r1, r2 stator and rotor resistance
L1, L2 stator and rotor inductance
Lm magnetizing inductance
ωr rotor angular frequency
d direct axis
q quadrature axis
i1d, i2d d-axis damper winding currents
i1q, i2q q-axis damper winding currents
v1d, v2d d-axis damper winding voltages

xvi
v1q, v2q q-axis damper winding voltages
X` transient reactance
X1, X2 stator and rotor reactance
Xm magnetizing reactance
isc short circuit current
iac, idc ac and dc short circuit current
E prefault voltage
t time
T` short circuit transient time constant
Tdc DC decay time constant
ω angular velocity
ωr rotor angular frequency
ed, eq d- and q- axis components of the stator voltage
efd filed voltage
id, iq d- and q- axis components of the stator current
ifd field winding current
isd, isq d- and q- axis components of the stator current
Ld, Lq d- and q- axis components of the stator inductance
Lad d-axis magnetizing inductance
Laq q-axis magnetizing inductance
Lffd self-inductance of the field winding
L11d self-inductance of the d-axis damper winding
L11q, L22q self-inductances of the q-axis damper winding
Ra armature resistance
RL resistance of the series capacitor compensated
transmission line
Rfd field winding resistance

xvii
R1d d-axis damper winding resistance
R1q, R2q q-axis damper winding resistances
Te electromagnetic torque
Ψd, Ψq d- and q- axis components of the stator flux linkages
Ψfd field winding flux linkage
Ψ1d d-axis damper winding flux linkage
Ψ1q, Ψ2q q-axis damper winding flux linkages
ω0 (f0) synchronous frequency (337 rad/sec)
Rp parallel resistance
RFCL resistive state FCL resistance
LTC FCL trigger coil inductance
LFCL FCL limiting coil inductance
fc resonant frequency
Lf resonant frequency inductance
Cf resonant frequency capacitance
Ifault fault current
Ifeeder feeder head end recloser current

xviii
LIST OF ABBREVIATIONS
DG distributed generation
FCL fault current limiter
R resistive
L inductive
AC alternating current
DC direct current
A amperes
TCC time current characteristic
MMT minimum melt time
TCT total clearing time
CT current transformer
VA volt ampere
V volt
MOV metal oxide varistor
VAR volt ampere reactive
RMS root mean square

1
1. INTRODUCTION
1.1 Distributed Generation
Due to the growing complexity of modern utility grids and increasing consumer energy
demand, power utilities worldwide are seeking methods yielding increased generating capacity.
One low capital method of increasing this capacity is through the inclusion of small generators on
the distribution side of the grid to meet local power demands. This form of capacity increase is
known as distributed generation (DG) [1]. Although DG inclusion has undeniable advantages such
as voltage profile improvement, increased grid capacity and increased power delivery reliability,
it also has drawbacks in relation to existing system design and operation [1-9].
A key drawback in the utilization of DG sources is the effect they can have on power
system protection [1-9]. Most modern utility distribution networks are set up in a radial
configuration such that power flows in a unidirectional manner from the utility to the consumer.
DG integration into such grids potentially causes this radial behavior of the network to be lost [10,
11], and may cause magnitudinal (and possibly directional) changes in system short circuit levels.
This can cause possible failure or limit existing protection setting adequacy under fault conditions.
The extent of such influences is determined by DG size, location and interconnection methods [3,
5, 9].
DG sources come in a variety of types including traditional (such as gas and diesel
generators) and non-traditional (renewables). Traditional sources include low speed turbines,
diesel engines and micro-turbines. Micro turbines in particular are being used fairly frequently due
to their efficiency, and their capacity to operate using resources such as natural gas and propane.
These types of turbines are mainly synchronous machine based generators [2].
Non-traditional DG sources mainly consist of electrochemical devices (such as fuel cells)
and renewable energy devices. Of particular interest is the increase in the utilization of renewable
sources such as wind farms (induction and converter based) and photovoltaics (converter based)
[3]. Wind energy is becoming an increasingly popular resource following the global trend towards
promoting the integration of green initiatives [4] and substantial investment in investigating the

2
viability of this form of energy generation. Although higher levels of wind penetration are being
integrated into modern utility grids [5], the effect on protection coordination is not as significant
as those in synchronous based generators [2]. This in part is due to the configuration of Doubly
Fed Induction Generator (DFIG) type wind turbines (most common [3]) as shown in Figure 1.1.
Figure 1.1: A basic configuration of a DFIG wind turbine [6].
For DFIG type wind turbines, the stator of the induction machine is connected to the grid
while the rotor windings are connected through slip rings and an AC-AC converter system. A
crowbar is used to protect the power electronics converter against overvoltage or thermal
breakdown whilst also limiting the rotor inrush current when a voltage dip occurs [7]. When a grid
fault occurs the rotor windings are shorted by the crowbar turning the wind turbine into a squirrel
cage induction generator with an increased rotor resistance. This in turn has the effect that for a
persistent fault, the current contribution from the wind farm will decrease exponentially over time
until it reaches near zero after a few cycles (2 to 3) [12, 13, 14]. Given this fault behavior in
conjunction with the fact that synchronous machine based DG has a more severe effect on system
operation, only synchronous machine based DG sources are used in this thesis.
Slip rings
Gearbox
Grid
Stator power
Rotor-Side
Converter
Grid-Side Converter
Rotor power
Step down
transformer
Windmill
Crow-bar
Vdc
ig ir
IL, PL
is

3
1.1.1 Interconnection of Distributed Resources
A typical interconnecting scheme for DG sources to the existing network consists of an
inter-collecting feeder and inter-connecting transformer as shown in Figure 1.2 [8].
Figure 1.2: A typical DG interconnecting scheme.
One critical aspect of the interconnection is related to the transformer. Each type of
connection comes with advantages and disadvantages. Currently there are five connections that
are most commonly used: the advantages and disadvantages are summarized in Table 1.1.
Table 1.1: Advantages and disadvantages of interconnecting transformers.
Low Voltage
Side
High Voltage
Side Disadvantages Advantages
Delta Delta
Supplies network from
ungrounded source even if
utility breaker trips.
Provides no fault current for a
ground fault on the HV side of
the transformer. Main network
breakers will not react to
ground faults on the LV side
of the transformer.
Ground-Wye Delta
Delta Wye
Delta Ground-Wye
Provides an unwanted
ground current for network
faults.
Main network breakers will
not react to ground faults on
the LV side of the transformer.
No overvoltages for faults on
main feeder.
Ground-Wye Ground-Wye
Allows main feeder relaying
to respond to ground faults
on the LV side.
No overvoltages for ground
faults on main feeder if the
DG source is grounded.
There is no universal agreement amongst utilities about the most effective connection [8],
but a range of utilities have set preferences for DG interconnection in relation to DG size. Table
1.2 specifies the preferences for the Hydro One distribution utility [9].
G
Collector Feeder
∞
DG Source
Interconnecting
Transformer
Utility Network
Z=R+jX
Y/2 Y/2

4
Table 1.2: Hydro One preferred interconnection transformer connections.
System Voltage
(kV) DG size (MW)
Preferred Interconnection Transformer
High voltage: Low voltage
27.6 1-2
Gnd-Wye:Delta
Delta:Gnd-Wye
Gnd-Wye:Gnd-Wye
27.6/12/8 0.2-1
Gnd-Wye:Gnd-Wye
Gnd-Wye:Delta
Delta:Gnd-Wye
27.6/12/8/4 0.05-0.2 Gnd-Wye:Gnd-Wye
27.6/12/8/4 0.02-0.05 Gnd-Wye:Gnd-Wye
1.2 Power System Protection
When faults occur, the implications for a power system can be catastrophic as it potentially
yields system failure and equipment damage. Faults may occur when equipment insulation fails,
overvoltages occur due to lightning and switching surges, and due to other natural or mechanical
causes [10].
Power system protection can be defined as “the science, skill and art of applying and setting
relays and/or fuses to provide maximum sensitivity to faults and undesirable conditions, but to
avoid their operation on all permissible or tolerable conditions” [10]. In modern protection
schemes, it is desirable to remove only sections of the power system that have a faulted condition,
leaving the rest of the network to operate as normal. Additionally it is preferred that devices that
are closer to the fault should operate before those that are further away [10, 11, 15]. This will be
discussed further in this chapter.
1.2.1 Protective Devices
Fuses are the simplest and oldest forms of system protection that are capable of interrupting
current in a power network [11]. A fuse can be defined as “an overcurrent protective device with
a circuit-opening fusible part that is heated and severed by the passage of overcurrent through it”
[11]. Fuses are installed in series on the lines they are assigned to protect and are able to carry
normal load currents without interrupting supply. Fuses have two distinct time-current
characteristic (TCC) curves, namely minimum melt time (MMT) and total clearing time (TCT).
The MMT is the minimum time required for the fuse link to melt for a designated short circuit

5
level. The TCT is the maximum time required for the fuse link to melt and the arc to clear for a
designated short circuit level [15]. A typical fuse time current characteristic is shown in Figure 1.3.
Figure 1.3: Time-Current Characteristic of a Kearney 100T fuse [16].
A recloser is an overcurrent device that is set to trip (by opening points of contact and then
reclosing a specified amount of time after) a designated number of times in order to clear temporary
faults or isolate sections of a network in the presence of a permanent fault [15]. The sequence
followed by a recloser will vary depending on the respective standards adopted by
utilities/countries. However a common sequence is the ‘two fast and two slow before lockout’
(contacts are permanently opened) [17, 18]. The fast (often called TCC1) and slow (often called
TCC2) sequences of the recloser are dependent on both the manufacturer and the TCC curve that
is used in the programming of the recloser [11]. For the typical ‘two fast two slow’ scheme the
recloser first reacts to a fault twice using its fast characteristic before switching to its slow
characteristic. If the fourth attempt at clearing a fault is unsuccessful, the recloser locks out [11].
A typical recloser TCC curve is shown in Figure 1.4.
0.01
0.1
1
10
100
1 10 100 1000 10000
Tim
e (s
)
Current (A)
MMT
TCT

6
Figure 1.4: Time-Current Characteristics of an ABB PCD 2000 Recloser [19].
Circuit breakers are devices that automatically interrupt or reclose for a system in a faulted
or steady state condition [15]. The main purpose of a circuit breaker is to extinguish the arc that
develops when the breaker’s contact opens during fault conditions. In general, circuit breakers are
equipped with a relay that senses the level of current flowing through the system. The relay is
programmed to activate the circuit breaker if a fault is sensed [11]. Typically, the relays that are
used are overcurrent electronic type with inverse, very inverse or extremely inverse time-current
characteristics. The time-current characteristic of any relay curve can be modeled by [20].
𝑡(𝐼) = (𝐷
𝑀𝑢−1+ 𝐵) × 𝑇𝐷𝑆 (1.1)
With time t(I) expressed in seconds for a current I in Amperes, M is the Iinput/Ipickup ratio,
Ipickup is the pickup current of the relay (lowest current that is detected as a fault) in Amperes, TDS
is the time dial setting of the relay, and D, B, and u are the constants to provide the curve with its
characteristic. These inverse time characteristics can be depicted graphically in Figure 1.5.
0.01
0.1
1
10
100
100 1000 10000
Tim
e (s
)
Current (A)
TCC1
TCC2
Slow Characteristic
Fast Characteristic
7
Figure 1.5: Time-Current Characteristics of a relay with D, B, u, TDS, and pickup current being
19.61, 0.491, 2, 1 and 1A respectively [20].
Current transformers (CTs) are devices that reproduce a current in the secondary windings
that is directly proportional to the primary windings. During steady state conditions, the secondary
windings of the CT will be representative of the load current of the protected network and will
flow consistently into the relay. Most relays in industrial applications have a current rating of 5 A
hence most CT ratios are designed to output 5 A to the relay during steady state conditions [11].
This allows for the utilization of the same relays in different applications whereby the fault level
and steady state current for separate systems do not necessarily need to be the same to attain
identical relay operations. Some typical CT ratios are given in Table 1.3 [11, 21].
Table 1.3: Typical CT current ratios.
50:5 300:5 800:5
100:5 400:5 900:5
150:5 450:5 1000:5
200:5 500:5 1200:5
250:5 600:5
0.1
1
10
100
100 1000 10000
Tim
e (s
)
Current (A)

8
1.2.2 Protection Coordination of Radial Distribution Networks
In a typical radial type distribution network, feeders have fuses, reclosers and circuit
breakers installed to prevent damage to the system when fault conditions occur. Fuses only operate
for permanent faults (known as the fuse saving scheme). In the event of a temporary fault, the
recloser opens quickly to allow the fault to self-clear, or slowly if the fuse fails to clear a permanent
fault. In the event that the recloser and fuse both fail to clear the fault, the feeder relay will operate
to prevent system damage [11, 22].
Traditional protection coordination in radial distribution networks requires the
determination of minimum and maximum fault currents that may be experienced by the feeder.
These fault levels allow for the fast characteristic curve of the recloser to be determined and set
below the fuse’s minimum melting time, while the slow characteristic is placed above the total
clearing time curve. This allows the recloser to operate before the fuse is activated, allowing
temporary faults time to self-clear. In the case of a permanent fault, the fuse will operate before
the recloser utilizes the slow characteristic curve application. The characteristic curve of the relay
resides above the recloser slow characteristic and serves as a backup protection. The implications
are that for coordination to be maintained it is imperative that the fault current levels experienced
by the feeder remain in the predetermined minimum and maximum range [11, 22]. This scheme
can be depicted graphically via Figure 1.6.
Figure 1.6: Typical characteristic curves for protection coordination in radial distribution
networks.
0.01
0.1
1
10
100
1000
1 10 100 1000 10000 100000
Tim
e (s
)
Current (A)
MMT [16]TCT [16]Recloser Fast [19]Recloser Slow [19]Relay [20]

9
1.3 Fault Current Limiters
Fault current limiters (FCLs) limit the amount of short circuit current that is allowed to
flow into a power network enabling continual operation of systems despite faulted conditions [23].
FCLs are series devices that have very low impedances (near zero) during steady state system
operation (normal mode) but rapidly introduce high impedance into the protected line to restrain
the short circuit current (superconducting mode) to a desirable level during fault conditions [24].
FCLs can be classified into quench, non-quench and composite type, depending on their
operating characteristics. Quench FCLs can be resistive, inductive or hybrid and act to limit the
fault level through control of the conversion between the normal and superconducting states. Non-
quench type FCLs can be iron core, bridge or active types, and control the fault level by controlling
the conductor current. Composite type FCLs combine the principles of the quench and non-quench
types [25].
An alternate type of FCL is known as the resonant FCL. The resonant FCL, as the name
suggests, is a component that makes use of the series resonant circuit in a system to limit the short
circuit level during fault conditions. For resonant FCLs, the short circuit current increases
gradually, (not instantaneously during a fault condition, the effect being that the fault can be
interrupted at a lower magnitude, preventing damage to the system [26, 27].
1.4 Literature Review
With the anticipation that various types of DG’s are set to be introduced into distribution
grids with increasing levels of penetration [28], there is scope for engineers to investigate viable
methods of solving the coordination issues associated with DG introduction. Research into
adaptions which will limit the influences of DG on existing protection systems is still in its infancy.
IEEE Std. 1547 was the first standard of its kind, promoting the disconnection of all DGs from the
system following fault detection [29]. This design prevents fault current contribution through
disconnection during fault conditions, solving coordination issues. The inefficiency associated
with this practice is that the DG would have to resynchronize to the grid for reconnection and
decrease the capacity of the network, even for temporary faults.
Abdel-Galil and team [2] demonstrate that inverter based DG has little effect on existing
protection coordination when compared to synchronous machine based DG sources. Reference [2]

10
also determines a method to ascertain the DG penetration level at which coordination is no longer
maintained. The solution presented in [2] would obviate the need for protection system redesign,
but it is not feasible long term, as it limits the amount of DG that is able to be introduced. An
alternative solution offered in [2] is to redesign the protective schemes, again not feasible long
term due to high re-engineering costs.
A proposal for the use of microprocessor based reclosers to prevent loss of coordination is
one of a range of possible recommended solutions [22, 30]. These solutions are based on the use
of multiple recloser curves which are selected following analysis of current system operating
conditions and output of recloser algorithms. Williams [31] proposes the use of inverse time
admittance relays which have an admittance factor rather than pick up current to determine trip
conditions.
Other solutions that have been developed involve the use of communications based
protocols. A selection is outlined in [32, 33]. Although this type of solution is reliable, the
methodology requires protective device upgrades and changes to existing settings. These additions
come at a high capital cost, and the buyback period of the DG may affect economic unfeasibility.
A recently developed solution is presented in [12] where it is proposed that inverter based
DGs are used to limit the fault current contribution of the DG. Although this solution is effective
it is limited to the capabilities of the inverters.
One possible response to re-evaluation of existing protection infrastructure following DG
integration is to utilize FCLs. FCLs are series devices that have very low impedance (considered
zero) during steady state operation but change following a fault to a high impedance value in order
to limit the short circuit current [26]. Some research has been conducted in the use of FCLs for
DG integration. El-Khattam [34] presents a method of restoring relay coordination in a loop based
system using FCLs. It demonstrates that FCLs have the ability to limit the fault current contribution
of the DG and maintain relay original coordination. However, it does not investigate fuse-recloser
coordination.
A solution presented in [35] demonstrates the use of FCLs in limiting the overvoltages and
additional fault current experienced by the introduction of DG. This paper does not outline the
type of DG used nor does it thoroughly investigate the implications of DG integration into multiple
locations in a distribution system. Reference [35] only investigates DG integration for locations

11
between the utility and the load, whereas in a realistic distribution system the load is not confined
to a single location but is rather spread throughout the network [11, 15, 21]. Additionally, the
results presented do not investigate the implications of increased DG on the system’s steady state
operation.
1.5 Research Objective and Scope of the Thesis
Due to the increasing size of energy demand by the consumer, utility companies around
the world are investigating the efficiencies of integrating distributed resources to curb the
additional stresses that will be experienced by existing generating units [2]. The introduction of
DG sources offers a method of expanded generating capacity and increased reliability in power
supply; however it also offers its own challenges with regards to aspects of system operation. This
has led to growing research in the field of DG integration, as utilities look to mitigate the
detrimental operational effects DG sources can have on power networks.
Alteration of the adequacy of existing protective schemes is one of these detrimental effects
of DG integration. Other critical issues that have been identified with regard to protection systems
are: the alterations made by DG integration on fuse-recloser coordination, recloser sensitivity and
recloser bi-directionality [2]. Although the use of FCLs has been employed in some research [30,
34], no research has been reported on the effects of FCL use on synchronous machine based DG
source integration for the purposes of the mitigation of fuse-recloser mis-operation.
The main objective of this research is to determine the feasibility of use of superconducting
FCLs to mitigate short circuit currents that can affect fuse-recloser coordination, recloser
sensitivity, and recloser bi-directionality during fault conditions. The approach utilizes FCLs at
the DG side of the interconnection transformer in conjunction with some characteristics from [2]
to determine the effectiveness of using FCLs to mitigate the effects of synchronous machine based
DG sources on fuse-recloser protection infrastructure in a typical radial distribution network. The
approach demonstrates the use of FCLs to restore the effectiveness of the original fuse-recloser
characteristics with the presence of synchronous machine based DG sources without the
requirement of DG disconnection as per IEEE Std. 1547 or alteration to existing protection
infrastructure.

12
This thesis is organized into five chapters, a list of references section and two appendices.
Chapter 1 introduces the fundamentals of protection coordination, generation source
interconnection and distributed generation. An introduction into FCLs is also included. Objectives
are also presented.
In Chapter 2, the system under study is introduced along with the details associated with
the modelling of individual components. A sample case study is also presented in this chapter.
Chapter 3 outlines the approach taken for DG impact assessment on fuse-recloser loss of
coordination, recloser loss of sensitivity and recloser bi-directionality. Case studies are also
presented for each problem.
Chapter 4 presents results in the validation of the use of FCLs in mitigating the effects of
synchronous machine based DG integration on distribution networks during fault conditions. A
critical analysis of results is also presented in this chapter.
Chapter 5 summarizes the research described in this thesis and presents conclusions and
recommendations for future research.
The data of the systems under investigation are provided in Appendix A.
Fault current characteristics of the system under study are provided in Appendix B

13
2. MODELING OF POWER SYSTEMS FOR
DISTRIBUTED GENERATION IMPACT
ASSESSMENTS
2.1 Introduction
This chapter presents a discussion of the system under study with particular reference to
the protection settings and mathematical models of individual components. Results of a digital
time-domain simulation of the system during a three-phase fault are presented at the end of this
chapter.
2.2 System under Study
2.2.1 Network
A modified version of the suburban distribution network presented in [2] and shown in
Figure 2.1 is used in the investigations in this thesis. The system comprises of a connection to the
utility (modeled as a source behind impedance) connected to a double ended substation, with a
transformer on each side with a rating of 100 MVA. The rated bus voltage is 25kV. Each
transformer feeds six feeders and a tie breaker is connected to allow for all twelve feeders to be
supplied by a single transformer. For the main feeder, a 2 Ω series reactor is placed on the head
end to limit the highest fault current to approximately 6 kA. There are two suburban loads of 5
MVA, each connected at bus 1. These loads are considered as lateral feeders and their protective
elements are not under investigation in this thesis. Bus 2 and bus 3 have 2.1 MVA residential loads.
Bus 4 has a 1 MVA industrial load connected which is modelled by a 1 MVA induction motor.
Bus 5 has a 1 MVA commercial load connected through a delta/wye transformer. More details on
the loads, components and cables are presented in APPENDIX A.

14
Figure 2.1: Single line diagram of the suburban distribution system under study [2].
2.2.2 Protection Coordination Paths
As per Figure 2.1, loads connected to buses 2 to 5 are fuse protected at the connections to
the feeder backbone. The feeder backbone has a recloser and relay present on the head end. Four
coordination paths are therefore present, each with a fuse-recloser-relay scheme (fuse is most
5 MVA 3 km
5 MVA
Bus 3
3 km
Bus 2
2.1 MVA,
0.9 p.f. lag.
residential
load
Fuse
Fuse
Fuse
2.1 MVA,
0.9 p.f. lag.
residential
load
1 km
1 km
Breaker and
recloser
Tie-
breaker
2 Ω reactor
M
100 MVA 100 MVA
25 kV
230 kV
1 km
1 km
Bus 1
∞
Bus 5
Bus 4
1 km
1 km
Utility
C1 C
1
C1 = 20 MVAR
P + j Q
6 remaining
feeders, 100
MVA, p.f. 0.95
lag.
P + j Q 5 remaining
feeders, 84 MVA,
p.f. 0.95 lag.
1 MVA,
0.9 p.f. lag.
industrial
load
1 MVA, 0.9
p.f. lag.
commercial
load
Fuse
15
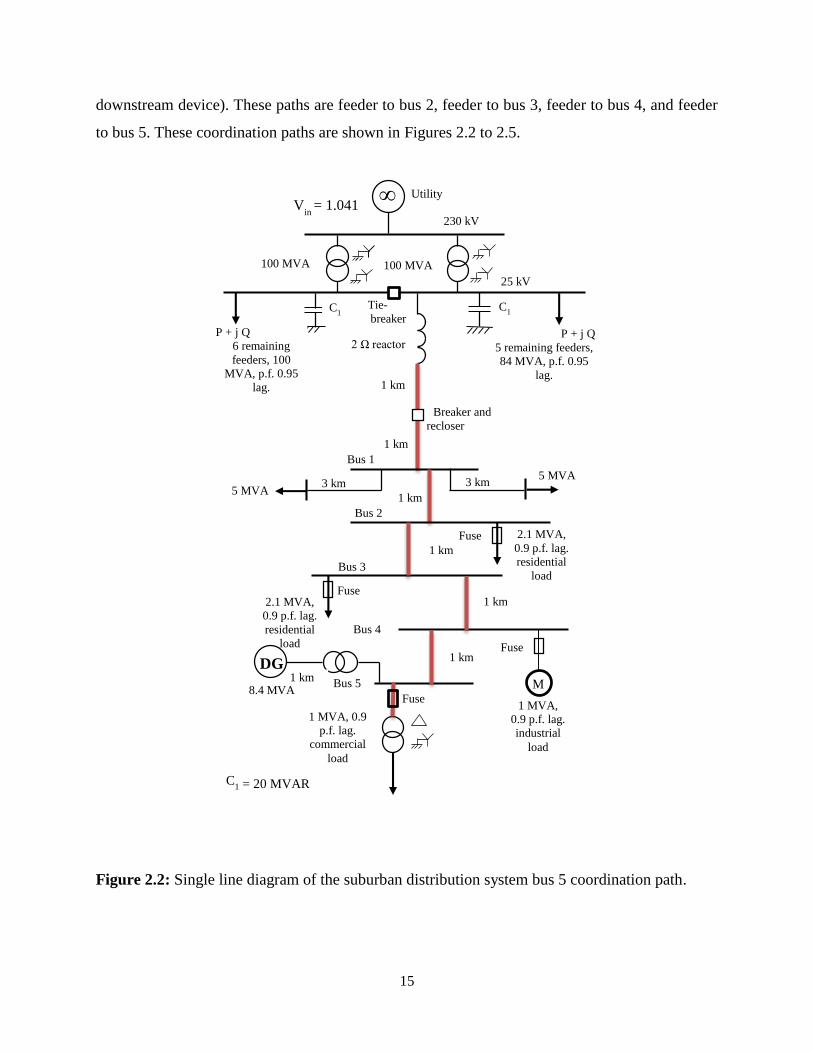
downstream device). These paths are feeder to bus 2, feeder to bus 3, feeder to bus 4, and feeder
to bus 5. These coordination paths are shown in Figures 2.2 to 2.5.
Figure 2.2: Single line diagram of the suburban distribution system bus 5 coordination path.
5 MVA 3 km
5 MVA
Bus 3
3 km
Bus 2
2.1 MVA,
0.9 p.f. lag.
residential
load
Fuse
Fuse
Fuse
2.1 MVA,
0.9 p.f. lag.
residential
load
1 km
1 km
Breaker and
recloser
Tie-
breaker
2 Ω reactor
M
100 MVA 100 MVA
25 kV
230 kV
1 km
1 km
Bus 1
∞
Bus 5
Bus 4
1 km
1 km
Utility
C1 C
1
C1 = 20 MVAR
P + j Q
6 remaining
feeders, 100
MVA, p.f. 0.95
lag.
P + j Q 5 remaining feeders,
84 MVA, p.f. 0.95
lag.
1 MVA,
0.9 p.f. lag.
industrial
load
1 MVA, 0.9
p.f. lag.
commercial
load
Fuse
Vin
= 1.041
DG 1 km
8.4 MVA

16
Figure 2.3: Single line diagram of the suburban distribution system bus 4 coordination path.
5 MVA 3 km
5 MVA
Bus 3
3 km
Bus 2
2.1 MVA,
0.9 p.f. lag.
residential
load
Fuse
Fuse
Fuse
2.1 MVA,
0.9 p.f. lag.
residential
load
1 km
1 km
Breaker and
recloser
Tie-
breaker
2 Ω reactor
M
100 MVA 100 MVA
25 kV
230 kV
1 km
1 km
Bus 1
∞
Bus 5
Bus 4
1 km
1 km
Utility
C1 C
1
C1 = 20 MVAR
P + j Q
6 remaining
feeders, 100
MVA, p.f. 0.95
lag.
P + j Q 5 remaining feeders,
84 MVA, p.f. 0.95
lag.
1 MVA,
0.9 p.f. lag.
industrial
load
1 MVA, 0.9
p.f. lag.
commercial
load
Fuse
Vin
= 1.041
DG 1 km
8.4 MVA

17
Figure 2.4: Single line diagram of the suburban distribution system bus 3 coordination path.
5 MVA 3 km
5 MVA
Bus 3
3 km
Bus 2
2.1 MVA,
0.9 p.f. lag.
residential
load
Fuse
Fuse
Fuse
2.1 MVA,
0.9 p.f. lag.
residential
load
1 km
1 km
Breaker and
recloser
Tie-
breaker
2 Ω reactor
M
100 MVA 100 MVA
25 kV
230 kV
1 km
1 km
Bus 1
∞
Bus 5
Bus 4
1 km
1 km
Utility
C1 C
1
C1 = 20 MVAR
P + j Q
6 remaining
feeders, 100
MVA, p.f. 0.95
lag.
P + j Q 5 remaining feeders,
84 MVA, p.f. 0.95
lag.
1 MVA,
0.9 p.f. lag.
industrial
load
1 MVA, 0.9
p.f. lag.
commercial
load
Fuse
Vin
= 1.041
DG 1 km
8.4 MVA

18
Figure 2.5: Single line diagram of the suburban distribution system bus 2 coordination path.
5 MVA 3 km
5 MVA
Bus 3
3 km
Bus 2
2.1 MVA,
0.9 p.f. lag.
residential
load
Fuse
Fuse
Fuse
2.1 MVA,
0.9 p.f. lag.
residential
load
1 km
1 km
Breaker and
recloser
Tie-
breaker
2 Ω reactor
M
100 MVA 100 MVA
25 kV
230 kV
1 km
1 km
Bus 1
∞
Bus 5
Bus 4
1 km
1 km
Utility
C1 C
1
C1 = 20 MVAR
P + j Q
6 remaining
feeders, 100
MVA, p.f. 0.95
lag.
P + j Q 5 remaining feeders,
84 MVA, p.f. 0.95
lag.
1 MVA,
0.9 p.f. lag.
industrial
load
1 MVA, 0.9
p.f. lag.
commercial
load
Fuse
Vin
= 1.041
DG 1 km
8.4 MVA

19
2.2.3 Protection Settings
As specified in Section 1.2.2, most modern radial distribution networks employ a fuse
saving scheme. This is to prevent excessive maintenance costs on lines where there are temporary
faults [11].
2.2.3.1 Utility to 1 MVA Commercial Load (Bus 5)
As per Figure 2.1, the coordination path extends from the utility source to the last load of the
system. The coordination path includes the main feeder relay, the recloser, and the lateral fuse
connected on the high voltage side of the load transformer. The most downstream device is the
lateral fuse protecting the 1 MVA load. The rating of this fuse is selected through the use of
Equation 2.1 [21].
𝐼 =𝑆𝑙𝑜𝑎𝑑
√3×𝑉𝐿𝐿× 𝑀𝑢𝑙𝑡𝑖𝑝𝑙𝑦𝑖𝑛𝑔 𝑓𝑎𝑐𝑡𝑜𝑟 (2.1)
In the case of a fuse, the multiplying factor used is 1.75 so as to account for the transformer
inrush current as well as coordination with the transformer damage curve [2].
This gives a rating of:
𝐼 =106
√3 × 25000× 1.75 = 40.4 A
A Kearney 40T fuse is adequate. It should be noted that T fuses are more preferable than
K in this context due to the slower response times of the T fuses, allowing for easier coordination
with the upstream recloser [11].
For the recloser rating, Equation 2.1 can also be used with a multiplying factor: the recloser
phase and ground setting being 1.5 and 0.75 respectively [21]. As per Section 2.2.1, the overall
load of the main feeder is 16.2 MVA. This gives a phase trip setting of:
𝐼 =16.2 × 10⁶
√3 × 25000× 1.5 = 561.2 A
The nearest standard recloser rating that is adequate is 560 A [10].
The ground trip setting is given as:
𝐼 =16.2 × 10⁶
√3 × 25000× 0.75 = 280.6 A
20
The nearest standard recloser rating that is adequate is 280 A [10].
The head end feeder relay pick up settings are found using the same calculations as those
for the recloser [11]. From this the phase and ground pick up settings of the relay are 600 A and
300 A, respectively. Given that the relay phase pick up current is 600 A, the CT ratio is selected
to be 600:5 as per Table 1.3.
It is necessary to determine the time-current characteristic curves for the relay and recloser
for both the ground and phase operations.
The recloser is coordinated with the fuse such that a fuse saving scheme is employed for
the network. This means that the recloser fast TCC needs to react faster to a fault than that of the
fuse for the most severe fault current experienced by the system. The fault current experienced by
the system for faults at varying locations is given in APPENDIX B. As can be seen from the results
in APPENDIX B, the maximum phase short circuit current experienced for a fault at the bus 5 load
is 1059 A which equates to 1171 A experienced by the recloser/relay. When performing recloser-
fuse coordination for fuse saving it is recommended that for adequate system operation, the
recloser fast clearing time be at least 75% lower than that of the minimum melt time of the fuse
and that the recloser slow clearing time be at least double that of the fuse maximum clearing time
[11]. Given this, the recloser phase fast TCC is selected to be the ANSI INV INST-1 curve. This
characteristic yields a trip time for a current of 1171 A at 0.0461 seconds while the fuse reacts in
0.0976 seconds, well within the 75% tolerance. The recloser phase slow TCC is selected to be the
ANSI INV-2 curve. This characteristic yields a trip time for a current of 1171 A at 1.56 seconds
while the fuse reacts in 0.1567 seconds, well within tolerance.
Similarly for the ground setting, the maximum ground short circuit current experienced
during a fault at the bus 5 load is 657 A, which equates to 889 A for the recloser/relay. The recloser
ground fast TCC is selected again to be the ANSI INV INST-1 curve. This characteristic yields a
trip time for a current of 889 A at 0.0382 seconds while the fuse reacts in 0.2476 seconds, well
within the 75% tolerance. The recloser ground slow TCC is selected to be the ANSI LTEI-1 curve.
This characteristic yields a trip time for a current of 889 A at 7.48 seconds, while the fuse reacts
in 0.3762 seconds, well within tolerance.

21
For the recloser to relay coordination, it is recommended that the difference in clearing
times between the recloser slow TCC and relay be 0.2 to 0.3 seconds. Given this recommendation
the relay is selected as an ABB DPU 2000R LT EI with a time dial setting (TDS) of 1 and a tap
setting of 5 (scale: 1/12) for the phase settings, and a TDS of 1 with a tap of 2.5 (scale: 1/12) for
the ground settings. For the maximum phase fault current of 1171 experienced by both the relay
and recloser, the relay operates in 23.46 seconds while the recloser slow TCC yields operation in
1.56 seconds. For the maximum ground fault current of 889 A experienced by both the relay and
recloser, the relay operates in 21.89 seconds while the recloser slow TCC yields operation in 7.48
seconds. These large margins are due to other coordination paths.
Given these settings, Figure 2.6 displays the phase coordination TCC curves while Figure
2.7 displays the ground coordination TCC curves [16, 19, 20].
Figure 2.6: Phase coordination chart for the suburban distribution system bus 5 path.
0.01
0.1
1
10
100
1000
1 10 100 1000 10000 100000
Tim
e (s
)
Current (A)
MMT [16]
TCT [16]
Recloser Fast [19]
Recloser Slow [19]
Relay [20]

22
Figure 2.7: Ground coordination chart for the suburban distribution system bus 5 path.
2.2.3.2 Utility to 1 MVA Industrial Load (Bus 4)
As per Figure 2.1, the coordination path extends from the utility source to the industrial
load located at bus 4. The coordination path includes the main feeder relay, the recloser, and the
lateral fuse connected to bus 4. The most downstream device is the lateral fuse protecting the 1
MVA load. As per Equation 2.1, the rating of the fuse can be determined by [21]:
𝐼 =106
√3 × 25000× 1.75 = 40.4 A
A Kearney 40T fuse should be adequate. The recloser and relay are the same as those
specified in Section 2.2.3.1. From here it is necessary to check for coordination between the
recloser/relay and the 50T fuse.
As per the results in APPENDIX B, the maximum phase short circuit current experienced
for a fault at bus 4 is 3869 A which equates to 3917 A experienced by the recloser/relay. The
recloser phase fast TCC is the ANSI INV INST-1 curve. This characteristic yields a trip time for
a current of 3869A at 0.0292 seconds while the fuse reacts in 0.025 seconds, indicating that the
0.01
0.1
1
10
100
1000
1 10 100 1000 10000 100000
Tim
e (s
)
Current (A)
MMT [16]
TCT [16]
Recloser Fast [19]
Recloser Slow [19]
Relay [20]

23
fuse needs to be increased in size. A Kearney 50T fuse is adequate as it is close enough to 1.5
times the load current and will still allow for at least one recloser operation. The recloser phase
slow TCC is the ANSI INV-2 curve. This characteristic yields a trip time for a current of 3917 A
at 0.6086 seconds while the fuse reacts in 0.0317 seconds, well within tolerance.
Similarly for the ground setting, the maximum ground short circuit current experienced for
a fault at bus 4 is 3402 A, which equates to 3516 A for the recloser/relay. The recloser ground fast
TCC is the ANSI INV INST-1 curve. This characteristic yields a trip time for a current of 3516 A
at 0.0253 seconds while the fuse reacts in 0.0369 seconds. This is marginally outside the 75%
tolerance recommendation, which should still be within operational tolerance levels. The recloser
ground slow TCC is the ANSI LTEI-1 curve. This characteristic yields a trip time for a current of
3516 A at 0.672 seconds while the fuse reacts in 0.3762 seconds, marginally outside the twice
operating time recommendation but still considered adequate.
For the maximum phase fault current of 3917 A experienced by both the relay and recloser,
the relay operates in 1.8 seconds while the recloser slow TCC yields operation in 0.6117 seconds.
For the maximum ground fault current of 3516 A experienced by both the relay and recloser, the
relay operates in 1.87 seconds while the recloser slow TCC yields operation in 0.672 seconds.
Given the settings, Figure 2.8 displays the phase coordination TCC curves while Figure 2.9
displays the ground coordination TCC curves [16, 19, 20].

24
Figure 2.8: Phase coordination chart for the suburban distribution system bus 4 path.
Figure 2.9: Ground coordination chart for the suburban distribution system bus 4 path.
0.001
0.01
0.1
1
10
100
1000
1 10 100 1000 10000 100000
Tim
e (s
)
Current (A)
MMT [16]
TCT [16]
Recloser Fast [19]
Recloser Slow [19]
Relay [20]
0.001
0.01
0.1
1
10
100
1000
1 10 100 1000 10000 100000
Tim
e (s
)
Current (A)
MMT [16]
TCT [16]
Recloser Fast [19]
Recloser Slow [19]
Relay [20]

25
2.2.3.3 Utility to 2.1 MVA Industrial Load (Bus 2/3)
The load for bus 2 and bus 3 are identical in magnitude and are both residential loads hence
their coordination paths will be the same. Bus 2 will have the highest fault level due to it being
located closer to the utility [11]. As per Figure 2.1, the coordination path extends from the utility
source to the residential loads located at bus 2/3. The coordination path includes the main feeder
relay, the recloser, and the lateral fuse connected to bus 2/3. The most downstream device is the
lateral fuse protecting the 2.1 MVA load. As per Equation 2.1, the rating of the fuse can be
determined by:
𝐼 =2.1 × 10⁶
√3 × 25000× 1.75 = 84.9 A
A Kearney 100T fuse should be adequate.
The recloser and relay are the same as those specified in Section 2.2.3.1. At this point it is
necessary to check for coordination between the recloser/relay and the 100T fuse.
The results in APPENDIX B demonstrate that the maximum phase short circuit current
experienced for a fault at bus 2 is 4707 A, which equates to 4724 A experienced by the
recloser/relay. The recloser phase fast TCC is the ANSI INV INST-1 curve. This characteristic
yields a trip time for a current of 4724 A at 0.0277 seconds while the fuse reacts in 0.032 seconds,
which is just outside the 75% tolerance, which should be within operational limits. The recloser
phase slow TCC is the ANSI INV-2 curve. This characteristic yields a trip time for a current of
4724 A at 0.5585 seconds while the fuse reacts in 0.0581 seconds, well within tolerance.
Similarly for the ground setting, the maximum ground short circuit current experienced for
a fault at bus 2 is 4256 A which equates to 4313A for the recloser/relay. The recloser ground fast
TCC is the ANSI INV INST-1 curve. This characteristic yields a trip time for a current of 4313 A
at 0.0244 seconds while the fuse reacts in 0.0384 seconds, well within the 75% tolerance range.
The recloser ground slow TCC is the ANSI LTEI-1 curve. This characteristic yields a trip time for
a current of 4313 A at 0.531 seconds while the fuse reacts in 0.0673 seconds, well within tolerance.
For the maximum phase fault current of 4724 A experienced by both the relay and recloser,
the relay operates in 1.32 seconds while the recloser slow TCC yields operation in 0.5585 seconds.
For the maximum ground fault current of 4313 A experienced by both the relay and recloser, the

26
relay operates in 1.43 seconds while the recloser slow TCC yields operation in 0.531 seconds.
Given the settings, Figure 2.10 displays the phase coordination TCC curves while Figure
2.11 displays the ground coordination TCC curves [16, 19, 20].
Figure 2.10: Phase coordination chart for the suburban distribution system bus 2/3 path.
Figure 2.11: Ground coordination chart for the suburban distribution system bus 2/3 path.
0.01
0.1
1
10
100
1000
1 10 100 1000 10000 100000
Tim
e (s
)
Current (A)
MMT [16]TCT [16]Recloser Fast [19]Recloser Slow [19]Relay [20]
0.01
0.1
1
10
100
1000
1 10 100 1000 10000 100000
Tim
e (s
)
Current (A)
MMT [16]
TCT [16]
Recloser Fast [19]
Recloser Slow [19]

27
2.2.4 Candidate DG Interconnection Points
As per [2], the candidate DG connection points of the system used in this thesis are bus 1,
bus 2, bus 3, bus 4, and bus 5. The coordination paths for bus 2 and 3 are similar, hence bus 3 is
not investigated as a DG connection point in this study. These DG connection locations can be
dictated by system studies or client requirements [2].
2.3 Power System Modeling
The nonlinear differential equations of the system under study are derived through the
development of individual mathematical models representative of multiple components of the
network. This includes modeling of the utility, distribution lines, transformers, system loads, the
synchronous generator (DG source), and the fault current limiters.
2.3.1 Modeling of the Utility
The utility connection shown in Figure 2.1 is modelled as a voltage source of constant
voltage and angle behind a small impedance. The voltage is kept at 1.041 per unit so as to maintain
the most downstream voltage (bus 5) above 0.95 per unit, as per most utility standards [21].
2.3.2 Modeling of Distribution Lines
Transmission/distribution lines can be classed into three different categories [10]:
1. Short lines: lines smaller than 80 km in length.
2. Medium lines: lines equal to or longer than 80 km in length but smaller than 240
km.
3. Long lines: lines longer than 240 km in length.
In the PSCAD environment, there are several distribution line models that can be used.
Three of these models can be described as;
1. Beregon Model: This model is the traditional nominal PI model of a distribution
line where admittance and impedance are manually input at a specific frequency.
The suitability of the model is limited to constant frequency operations where
studies such as relay coordination are being conducted [36].

28
2. Frequency Dependent (Mode) Model: This model is used to represent the frequency
dependence of the line models using modal techniques to solve the line constants
while assuming constant transformation. The issue with this model is that it requires
ideally transposed conductor spacing geometry, hence tower configurations must
be known for this model to be used accurately [36].
3. Frequency Dependent (Phase) Model: This model is used to represent the frequency
dependence of all the parameters (similar to the mode model). It does not require
constant transformation since solving occurs in the phase domain. The model is
therefore accurate in all studies, including unbalanced line geometry. The limitation
comes from the requirement for the tower configuration to be known [36].
4. PI Models: This model is suitable when the frequency is kept constant. It is very
precise in keeping admittance and impedance constant, however precision can be
inadequate for long lines. The model is mainly used in short and underground lines
[37].
Considering that the longest line in the suburban distribution system in Figure 2.1 is 5
kilometers and the test is being conducted using short circuit studies, the PI model is selected as
the model for this thesis. The PI model can be visually represented by Figure 2.12.
Figure 2.12: The nominal PI model for distribution lines [10].
Where:
VS is the sending voltage (V)
VR is the receiving voltage (V)
IS is the sending current (A)
IR is the receiving current (A)
Z=R+jωL
Y/2 Y/2
- -
+ +
VR
VS
IS I
R

29
Y is the total shunt admittance (S)
Z is the total series impedance (Ω)
An important aspect of a distribution line in short circuit studies is the zero sequence
impedance. Positive sequence components are those that consist of three phasors of equal
magnitude with 120 degree spacing that rotate in the same direction as the phasors in the network.
The negative sequence components are the same as positive except that the phasors are in the
reverse sequence. Zero sequence components are three phasors of equal magnitude that are in
phase with one another that rotate in the same direction as the positive sequence phasors. The zero
sequence impedance of a line differs from the positive and negative sequence, as the magnetic
field that creates the positive and negative sequence currents is different to that of the zero
sequence. (Positive and negative sequence impedances are of the same magnitude of the given
impedance of the line). In the case of single circuit lines, the zero sequence impedance can be up
to 3.5 times more than the positive and negative, while for underground cables it can be between
3 and 5 times larger for triplex core underground cables [38, 39]. Given this, the zero sequence
impedances of the lines in this thesis are taken to be three times larger than the positive and
negative. Cable impedances are given in APPENDIX A.
2.3.3 Modeling of transformers
Two modelling options are available for transformers in the PSCAD simulation
environment: the UMEC and classical approach model. The classical approach model utilizes the
IEEE equivalent circuit given in [14], using equivalent lumped components to represent internal
impedances of the equipment. The Unified Magnetic Equivalent Circuit (UMEC) model is based
primarily on the core of the transformer and deals with the magnetic coupling of the different
phases [36]. Considering that the key features required from the transformer for the studies in this
thesis are impedances and voltage transformation, the IEEE (classical) model is used.
The three phase transformer connected to the bus 5 load in Figure 2.1 is a delta, wye solidly
grounded for the high voltage and low voltage sides respectively. All other transformers are wye
solidly grounded connections. Each transformer consists of winding resistance, winding reactance
and winding impedance as specified in APPENDIX A.
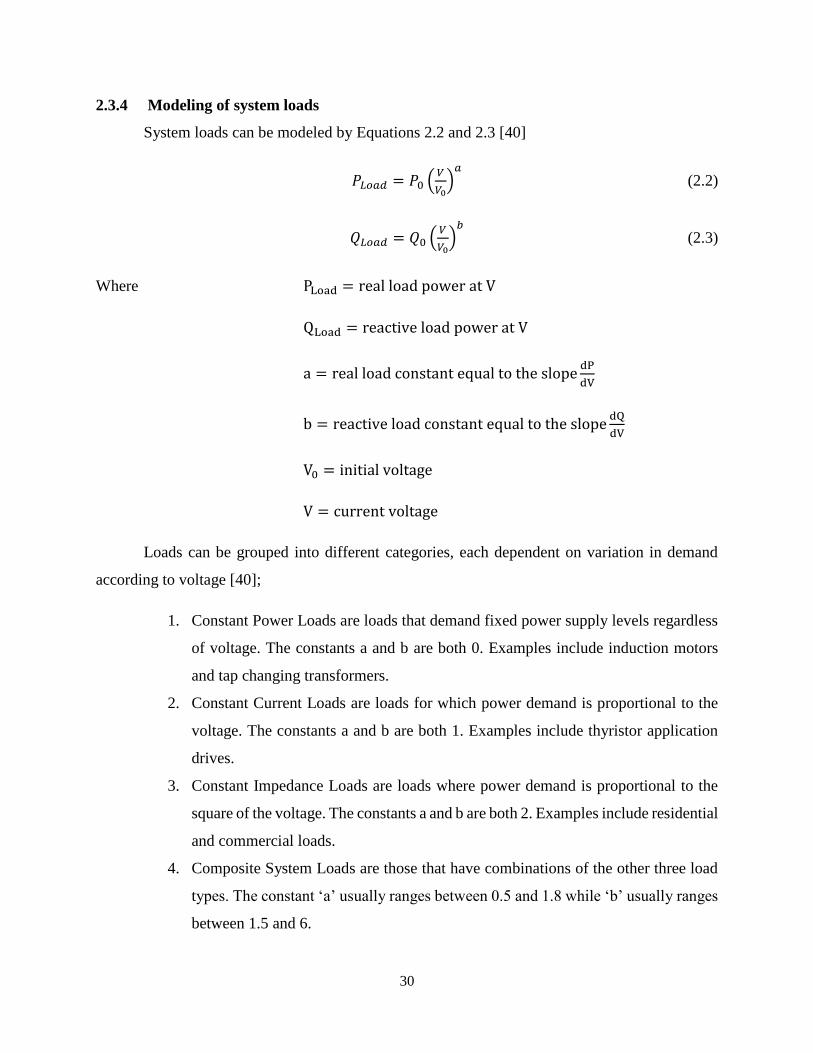
30
2.3.4 Modeling of system loads
System loads can be modeled by Equations 2.2 and 2.3 [40]
𝑃𝐿𝑜𝑎𝑑 = 𝑃0 (𝑉
𝑉0)𝑎
(2.2)
𝑄𝐿𝑜𝑎𝑑 = 𝑄0 (𝑉
𝑉0)𝑏
(2.3)
Where PLoad = real load power at V
QLoad = reactive load power at V
a = real load constant equal to the slopedP
dV
b = reactive load constant equal to the slopedQ
dV
V0 = initial voltage
V = current voltage
Loads can be grouped into different categories, each dependent on variation in demand
according to voltage [40];
1. Constant Power Loads are loads that demand fixed power supply levels regardless
of voltage. The constants a and b are both 0. Examples include induction motors
and tap changing transformers.
2. Constant Current Loads are loads for which power demand is proportional to the
voltage. The constants a and b are both 1. Examples include thyristor application
drives.
3. Constant Impedance Loads are loads where power demand is proportional to the
square of the voltage. The constants a and b are both 2. Examples include residential
and commercial loads.
4. Composite System Loads are those that have combinations of the other three load
types. The constant ‘a’ usually ranges between 0.5 and 1.8 while ‘b’ usually ranges
between 1.5 and 6.
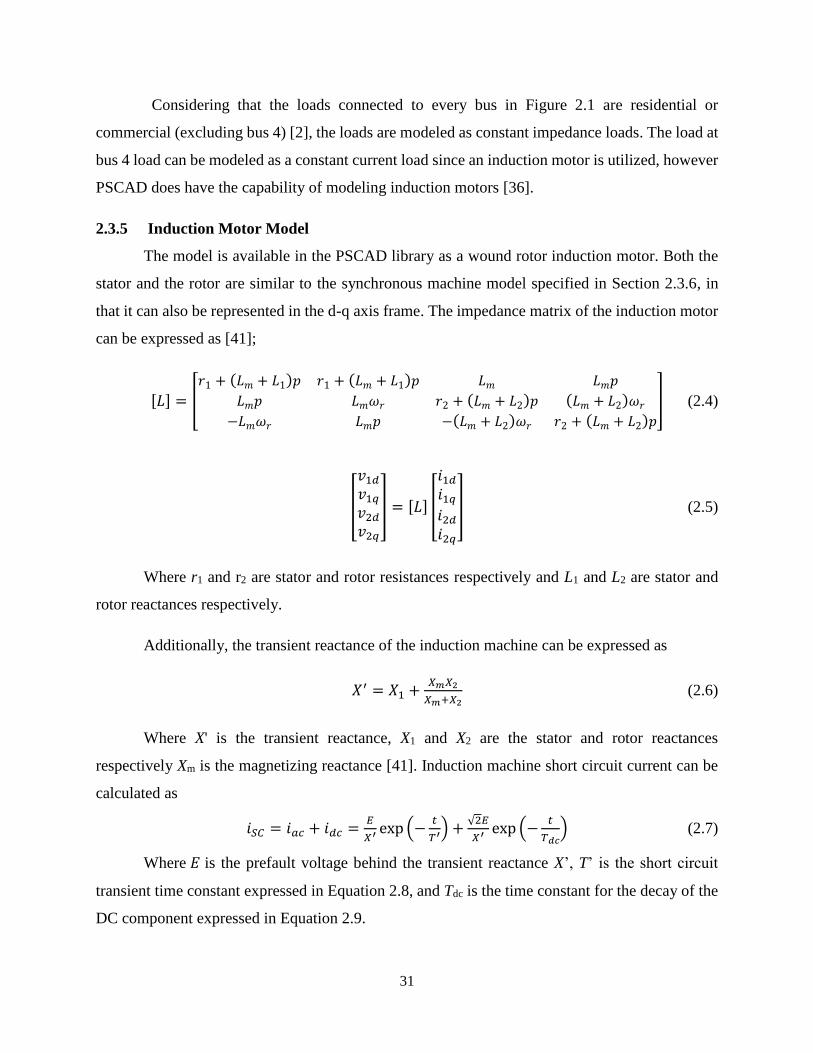
31
Considering that the loads connected to every bus in Figure 2.1 are residential or
commercial (excluding bus 4) [2], the loads are modeled as constant impedance loads. The load at
bus 4 load can be modeled as a constant current load since an induction motor is utilized, however
PSCAD does have the capability of modeling induction motors [36].
2.3.5 Induction Motor Model
The model is available in the PSCAD library as a wound rotor induction motor. Both the
stator and the rotor are similar to the synchronous machine model specified in Section 2.3.6, in
that it can also be represented in the d-q axis frame. The impedance matrix of the induction motor
can be expressed as [41];
[𝐿] = [
𝑟1 + (𝐿𝑚 + 𝐿1)𝑝 𝑟1 + (𝐿𝑚 + 𝐿1)𝑝 𝐿𝑚 𝐿𝑚𝑝
𝐿𝑚𝑝 𝐿𝑚𝜔𝑟 𝑟2 + (𝐿𝑚 + 𝐿2)𝑝 (𝐿𝑚 + 𝐿2)𝜔𝑟
−𝐿𝑚𝜔𝑟 𝐿𝑚𝑝 −(𝐿𝑚 + 𝐿2)𝜔𝑟 𝑟2 + (𝐿𝑚 + 𝐿2)𝑝
] (2.4)
[
𝑣1𝑑
𝑣1𝑞
𝑣2𝑑
𝑣2𝑞
] = [𝐿] [
𝑖1𝑑
𝑖1𝑞
𝑖2𝑑
𝑖2𝑞
] (2.5)
Where r1 and r2 are stator and rotor resistances respectively and L1 and L2 are stator and
rotor reactances respectively.
Additionally, the transient reactance of the induction machine can be expressed as
𝑋′ = 𝑋1 +𝑋𝑚𝑋2
𝑋𝑚+𝑋2 (2.6)
Where X' is the transient reactance, X1 and X2 are the stator and rotor reactances
respectively Xm is the magnetizing reactance [41]. Induction machine short circuit current can be
calculated as
𝑖𝑆𝐶 = 𝑖𝑎𝑐 + 𝑖𝑑𝑐 =𝐸
𝑋′ exp (−𝑡
𝑇′) +√2𝐸
𝑋′ exp (−𝑡
𝑇𝑑𝑐) (2.7)
Where 𝐸 is the prefault voltage behind the transient reactance X’, T’ is the short circuit
transient time constant expressed in Equation 2.8, and Tdc is the time constant for the decay of the
DC component expressed in Equation 2.9.

32
The time constants are given as:
𝑇′ =𝑋′
𝜔𝑟2 (2.8)
𝑇𝑑𝑐 =𝑋′
𝜔𝑟1 (2.9)
The nature of the short circuit current is identical to that of a synchronous machine, the
main difference being that the current of the induction machine will decay rapidly and can often
be ignored after six cycles [41].
2.3.6 Modeling of the Synchronous DG
In this thesis the DG source is modeled as a synchronous generator. In a standard
synchronous machine, the stator circuit that consists of a three-phase winding, produces a magneto
motive force. The field winding, located on the rotor, is excited by a DC voltage. A synchronous
machine can be modeled by the equations given below in the d-q reference frame depicted in
Figure 2.13. The convention adopted for the signs of the voltages and currents in the equations
below is that v is the impressed voltage at the terminals, and the direction of positive current i
corresponds to generation [42].
Figure 2.13: Modeling of the synchronous machine in the d-q reference frame.
iq
efd ed id
d-axis
q-axis
ifd i1d
d
𝜔𝑟, elec. Rad/sec
eq
i1q
i2q

33
With time t expressed in seconds, the angular velocity 𝜔 expressed in rad/s (𝜔0 =
377𝑟𝑎𝑑/sec) and the other quantities expressed in per unit, the stator equations become:
𝑒𝑑 =1
𝜔0
𝑑Ψ𝑑
𝑑𝑡−
𝜔
𝜔0Ψ𝑞 − 𝑅𝑎𝑖𝑑 (2.10)
𝑒𝑞 =1
𝜔0
𝑑Ψ𝑞
𝑑𝑡+
𝜔
𝜔0Ψ𝑑 − 𝑅𝑎𝑖𝑞 (2.11)
The rotor equations:
𝑒𝑓𝑑 =1
𝜔0
𝑑Ψ𝑓𝑑
𝑑𝑡+ 𝑅𝑓𝑑𝑖𝑓𝑑 (2.12)
0 =1
𝜔0
𝑑Ψ1𝑑
𝑑𝑡+ 𝑅1𝑑𝑖1𝑑 (2.13)
0 =1
𝜔0
𝑑Ψ1𝑞
𝑑𝑡+ 𝑅1𝑞𝑖1𝑞 (2.14)
0 =1
𝜔0
𝑑Ψ2𝑞
𝑑𝑡+ 𝑅2𝑞𝑖2𝑞 (2.15)
The stator flux linkage equations:
Ψ𝑑 = −𝐿𝑑𝑖𝑑 + 𝐿𝑎𝑑𝑖𝑓𝑑 + 𝐿𝑎𝑑𝑖1𝑑 (2.16)
Ψ𝑞 = −𝐿𝑞𝑖𝑞 + 𝐿𝑎𝑞𝑖1𝑞 + 𝐿𝑎𝑞𝑖2𝑞 (2.17)
The rotor flux linkage equations:
Ψ𝑓𝑑 = 𝐿𝑓𝑓𝑑𝑖𝑓𝑑 + 𝐿𝑎𝑑𝑖1𝑑 − 𝐿𝑎𝑑𝑖𝑑 (2.18)
Ψ1𝑑 = 𝐿𝑎𝑑𝑖𝑓𝑑 + 𝐿11𝑑𝑖1𝑑 − 𝐿𝑎𝑑𝑖𝑑 (2.19)
Ψ1𝑞 = 𝐿11𝑞𝑖1𝑞 + 𝐿𝑎𝑞𝑖2𝑞 − 𝐿𝑎𝑞𝑖𝑞 (2.20)
Ψ2𝑞 = 𝐿𝑎𝑞𝑖1𝑞 + 𝐿22𝑞𝑖2𝑞 − 𝐿𝑎𝑞𝑖𝑞 (2.21)
The electromagnetic torque equation:
𝑇𝑒 = Ψ𝑑𝑖𝑞 − Ψ𝑞𝑖𝑑 (2.22)

34
The overall differential equations which describe the transient performance of the
synchronous machine are given by the following matrix equation:
[𝑑𝑋𝑠𝑦𝑛
𝑑𝑡] = [𝐴𝑡𝑠𝑦𝑛][𝑋𝑠𝑦𝑛] + [𝐵𝑡𝑠𝑦𝑛] [
𝑉𝑡𝑑
𝑉𝑡𝑞
𝑒𝑓𝑑
] (2.23)
where
[𝑋𝑠𝑦𝑛] = [𝑖𝑑 𝑖𝑞 𝑖𝑓𝑑 𝑖1𝑞 𝑖1𝑑 𝑖2𝑞]𝑇
[𝐴𝑡𝑠𝑦𝑛] = [𝐿]−1[𝑄𝑡]
[𝐵𝑡𝑠𝑦𝑛] = [𝐿]−1[𝑅𝑡]
[𝐿] =
[
11
11
22
0 0 0
0 0 0
0 0 0
0 0 0
0 0 0
0 0 0
d ad ad
q aq aq
ad ffd ad
aq q aq
aq ad d
aq aq q
L L L
L L L
L L L
L L L
L L L
L L L
]
(2.24)
[𝑄𝑡] =
[ 0
0
0
0 1
0 1
0 2
0 0
0 0
0 0 0 0 0
0 0 0 0 0
0 0 0 0 0
0 0 0 0 0
a q aq aq
d a ad ad
fd
q
d
q
R L L L
L R L L
R
R
R
R
]
[𝑅𝑡] =
[ 0
0
0
0 0
0 0
0 0
0 0 0
0 0 0
0 0 0
]
Here, the superscript T means matrix transpose.

35
The interconnection of the DG to the network in Figure 2.1 is as shown in Figure 1.2 in
Section 1.1.1.
2.3.7 Modeling of the Fault Current Limiters
Fault current limiter models are required to have no influence on steady state system
operations (invisible to the system) but are also required to produce a high impedance during fault
periods in order to limit the short circuit current. Three FCL models are considered in this thesis,
designated FCL_R, FCL_L and FCL_LC. Individual values for components in Sections 2.3.7.1,
2.3.7.2 and 2.3.7.3 are given in APPENDIX A.
2.3.7.1 Resistive FCL Model
The resistive type FCL (FCL_R) model’s elements consist of a superconducting resistor in
parallel with a regular resistor. When steady state conditions are present, the superconducting
element of the FCL is in a superconductive state, allowing normal load currents to pass through
with virtually no losses. When a fault occurs, the current will sharply rise and will surpass a critical
current of the FCL. At this point the FCL will transition into its normal resistive state, applying
high impedance to the connection point (RFCL). This in turn limits the short circuit level. In
practical FCLs, a parallel resistance (RP) is present to protect the FCL during the transition period
from “hot spots”. It also adjusts the limited current and, in the event the FCL resistance rises too
rapidly, avoids overvoltages [24]. This can be represented graphically via Figure 2.14.
Figure 2.14: Resistive type superconducting FCL.
RFCL
RP

36
Superconducting FCLs are required to limit the fault current to at least between three and
five times the rated line current [24]. Three values of R that will allow for this to occur at 60, 50
and 20 Ω respectively. Figure 2.15 illustrates the fuse protecting the bus 5 for a three phase fault
at bus 5 with and without the FCL_R in service respectively.
Figure 2.15: Current through fuse 2 during a three phase to ground fault at bus 5 with and without
a 60 Ω FCL_R.
As can be seen in Figure 2.15, when the FCL is disabled the peak current is 7508 A. In
contrast, the peak current for the FCL system is 1830 A in the first half cycle, which reduces to
1406 A in the second (less than 5 times the peak load current). Observations demonstrate that the
-10000
-5000
0
5000
10000
2.99 3 3.01 3.02 3.03 3.04
Cu
rren
t (A
)
Time (s)
IfaultNOFCL
IfaultFCL_R7508A
1830A1406A

37
fault current is reduced by 76% in the first half cycle, demonstrating that the models being used
for the FCL are operating as expected.
2.3.7.2 Inductive FCL Model
Similarly for the inductive type FCL (FCL_L) model, two coils are connected in parallel
as depicted in Figure 2.16. Under steady state conditions, currents flow through LTC until a fault
condition occurs. In the presence of the fault condition, LTC transitions to the LFCL state, limiting
the fault current [24]. Similar to Section 2.3.7.3, the inductance values used in this thesis are 0.16,
0.13 and 0.05 H respectively.
Figure 2.16: Inductive type superconducting FCL.
2.3.7.2 Resonant FCL Model
For the resonant FCL model (FCL_LC), an inductor is placed in series with a capacitor as
depicted in Figure 2.17. The capacitor is protected via a metal oxide varistor (MOV). Similar to
FCL_R and FCL_L, during steady state operation the FCL is virtually invisible to the system. The
resonant frequency of this circuit given by Equation 2.25 is tuned to the frequency of the power
(60 Hz) such that under steady state conditions the FCL is virtually invisible to the system [27].
𝑓𝑐 =1
2𝜋√𝐿𝐶 (2.25)
Where fc is the resonant frequency (Hertz), L is inductance (H) and C is capacitance (F)
LFCL
LTC

38
When a short circuit occurs, the FCL has a characteristic that increases the current
gradually. This is due to the activation of the MOV across the capacitor when the capacitor
protection voltage level is reached [27]. L and C are 0.187 H and 37.665 µF respectively.
Figure 2.17: Resonant type superconducting FCL.
2.4 A Sample Case Study: Effects of DG Integration on Short Circuit Level
The following sample case study demonstrates the effect of DG integration on short-circuit
levels of a power network. It shows results for a three phase fault at bus 4 in Figure 2.1 for both
bus 1 synchronous machine based DG integrated and non-DG systems. Further results are
presented in APPENDIX B for differing fault types, DG locations and fault locations with results
presenting the same conclusions as the sample case study. The studies conducted in this thesis
utilize the PSCAD/EMTDC program to model a variety of system components to produce time-
domain simulation results. It should be noted that faults are assumed to occur 9 seconds into the
simulation to ensure steady state system operation has occurred.
Figure 2.18 shows the voltage load flow results (in per unit voltage) for the suburban
distribution system without DG integration while Figure 2.19 depicts the time-domain short circuit
level for a fault at bus 4 experienced by the bus 4 fuse and feeder recloser respectively. Figure 2.20
presents a summary of the varying three phase fault currents experienced by the recloser and fuse
at each bus without DG integration.
Cf
Lf
MOV

39
Figure 2.18: Suburban distribution system bus voltages without DG integration.
5 MVA 3 km
5 MVA
Bus 3
3 km
Bus 2
2.1 MVA,
0.9 p.f. lag.
residential
load
Fuse
Fuse
Fuse
2.1 MVA,
0.9 p.f. lag.
residential
load
1 km
1 km
Breaker and
recloser
Tie-
breaker
2 Ω reactor
M
100 MVA 100 MVA
25 kV
230 kV
1 km
1 km
Bus 1
∞
Bus 5
Bus 4
1 km
1 km
Utility
C1 C
1
C1 = 20 MVAR
P + j Q
6 remaining
feeders, 100
MVA, p.f. 0.95
lag.
P + j Q 5 remaining feeders,
84 MVA, p.f. 0.95
lag.
1 MVA,
0.9 p.f. lag.
industrial
load
1 MVA, 0.9
p.f. lag.
commercial
load
Fuse
Vfeed
= 0.9668
Vin
= 1.041
V1 = 0.9614
V2 = 0.9594
V3 = 0.958
V4 = 0.9572
V5 = 0.9567
V5L = 0.9509

40
Figure 2.19: Time-domain RMS current simulation for a fault applied at bus 4.
Figure 2.20: Fault current experienced by the relay and respective bus fuse for a three phase fault.
As can be observed in Figure 2.20, there is a correlation between the distance from the
utility source and the size of the fault. This is as expected, since the further the fault is from the
source, the larger the impedance that is available in the lines to limit the fault level [10].
0
1000
2000
3000
4000
5000
6000
8.95 8.97 8.99 9.01 9.03 9.05 9.07 9.09
Cu
rren
t (A
)
Time (s)
Ifault
Ifeeder
0
500
1000
1500
2000
2500
3000
3500
4000
4500
5 4 3 2
Cu
rren
t (A
)
Fault Location (Bus)
Recloser Current No DGFault Current No DG

41
Figure 2.21 shows the voltage load flow results (in per unit voltage) for the suburban
distribution system with an 8.4 MVA DG integration at bus 1 while Figure 2.22 depicts the time-
domain short circuit level for a fault at bus 4 experienced by the bus 4 fuse and feeder recloser
respectively. Figure 2.23 presents a summary of the varying fault currents experienced by the
recloser and fuse at each bus with an 8.4 MVA DG integration at bus 4 while being compared to
those that were obtained in Figure 2.20. An 8.4 MVA DG size was selected as it has the capacity
to supply over half the local load demand.
Figure 2.21: Suburban distribution system bus voltages with DG integration at bus 1.
V1 = 0.9763
V2 = 0.9743
V3 = 0.9729
V4 = 0.9721
V5 = 0.9716
V5L = 0.9656
5 MVA 3 km
5 MVA
Bus 3
3 km
Bus 2
2.1 MVA,
0.9 p.f. lag.
residential
load
Fuse
Fuse
Fuse
2.1 MVA,
0.9 p.f. lag.
residential
load
1 km
1 km
Breaker and
recloser
Tie-
breaker
2 Ω reactor
M
100 MVA 100 MVA
25 kV
230 kV
1 km
1 km
Bus 1
∞
Bus 5
Bus 4
1 km
1 km
Utility
C1 C
1
C1 = 20 MVAR
P + j Q
6 remaining
feeders, 100
MVA, p.f. 0.95
lag.
P + j Q 5 remaining feeders,
84 MVA, p.f. 0.95
lag.
1 MVA,
0.9 p.f.
lag.
industrial
load
1 MVA, 0.9
p.f. lag.
commercial
load
Fuse
Vfeed
= 0.9788
Vin
= 1.041
DG
1 km

42
Figure 2.22: Time-domain RMS current simulation for a fault applied at bus 4 with 8.4 MVA DG
integration at bus 1.
Figure 2.23: Fault current experienced by the relay and respective bus fuse for a three phase fault
at bus 4 for both 8.4 MVA DG integrated at bus 1 and non-DG integrated systems.
Observation of Figure 2.21 in conjunction with Figure 2.18 makes it apparent that DG
integration can aid in the improvement of the voltage profile of a power network [1-9] with an
average of 1.54% increase in voltage is generated when DG is present. When the 8.4 MVA DG is
0
1,000
2,000
3,000
4,000
5,000
6,000
8.95 8.97 8.99 9.01 9.03 9.05 9.07 9.09
Cu
rren
t (A
)
Time (s)
Ifault
Ifeeder
0
1000
2000
3000
4000
5000
5 4 3 2
Cu
rren
t (A
)
Fault Location (Bus)Recloser Current No DG Fault Current No DGRecloser Current 8.4 DG Fault Current 8.4 DG
43
connected at bus 5 this voltage profile improves by up to 3%, demonstrating the capacity for the
DG source to supplement the voltage of a power system, enhancing the voltage of the network.
Comparison of Figure 2.19 in conjunction with Figure 2.22 highlights that in the event of
a fault condition, the fault current contribution from the utility decreases with the presence of DG.
In the case study presented, the contribution to the fault current by the utility can decrease by as
much as 32% in some cases meaning that the recloser located on the main feeder will detect a
lower fault current than what is present. Although there is less stress on the utility during the fault
condition, this lower short circuit level being detected may cause the protection infrastructure to
fail to perform as expected.
Analysis of Figure 2.23 demonstrates that the inclusion of a small DG can have a significant
effect on the short circuit levels experienced by a power system. In some cases the fault current
increased by as much as 16% for a DG that can supply 52% of the total load of the system. This
means that the lateral fuses experience heavier currents than when there is no DG presence and
can result in the fuse clearing the fault before the feeder’s recloser has time to operate.
Observations make it apparent that the initial coordination scheme outlined in Section 2.2.3 may
no longer be adequate.
From results obtained it is apparent that the introduction of a DG source can significantly
change the behavior of a power system under faulted conditions. This gives rise to the need for
determination of frameworks to analyze and assess the level of effect that DG sources of varying
size may have on the operational characteristics of power systems, and an investigation into how
to best mitigate the detrimental changes.
2.5 Summary
Chapter 2 has provided an introduction into the suburban distribution system under
consideration, in addition to an investigation into the models employed for the variety of
components implemented in the PSCAD software environment. A digital time-domain simulation
is presented of a case study of the system under three phase fault conditions both with and without
synchronous machine based DG source integration. Results obtained highlight the effect that
synchronous machine based DG source integration can have on the short circuit levels of a power
system, demonstrating its capacity to adversely affect normal system operations and behaviors.

44
3. STRATEGIES FOR DG INTEGRATION IMPACT
ASSESSMENTS ON PROTECTION
INFRASTRUCTURE IN DISTRIBUTION NETWORKS
3.1 Introduction
This chapter presents methods for assessment of DG integration on existing fuse-recloser
infrastructure. The proposed impact assessment approach considers effects associated with
increasing levels of synchronous machine based DG penetration on previously installed fuse-
recloser protection. These effects considered can be classed as [2]:
1. Loss of Coordination: The level of DG penetration that will cause the original fuse-
recloser coordination to become inadequate or ineffective at clearing fault
conditions for fuse saving schemes.
2. Loss of Sensitivity: The level of DG penetration that will render protective elements
unable to detect fault conditions.
3. Bi-Directionality: The level of DG penetration that will cause the original
directionality of a fault to reverse
3.2 Loss of Fuse-Recloser Coordination Assessment due to DG Source Interconnection
3.2.1 Loss of Fuse-Recloser Coordination Definition and Method of Assessment
Increasing the size of a DG source can lead to downstream protective devices experiencing
greater fault levels than those that are upstream [11, 30]. These devices have previously been
coordinated for a system that has excluded this DG source. This can create inadequacy in the
original fuse-recloser coordination (current protection settings), causing alterations in behavior
under faulted conditions, including loss of fuse-recloser coordination and incorrect performance
of fuse saving schemes [30]. In order to determine when fuse-recloser loss of coordination will
occur, the following method adapted from the ideas in [2] and presented in Figure 3.1 is useful.
This can be explained by:

45
1. Firstly a synchronous machine based DG source is connected to a previously determined
candidate connection point.
2. A load bus is selected with a fault that yields the highest short circuit current being
applied to the selection.
3. The algorithm allows the engineer to determine if loss of fuse-recloser coordination has
occurred, through analysis of the time overcurrent characteristics of the equipment for
the given coordination path.
Figure 3.1: Algorithm for the determination of DG penetration level before the occurrence of loss
of fuse-recloser coordination.
No
No
Yes
Yes
No
No
Yes
Yes
DG penetration level that first
causes loss of coordination for
specified connection point is
the lowest of the DG sizes
recorded
Select candidate DG
connection point
Place DG source at selected
connection point
Decrease
DG size
Select a load bus
Apply a fault yielding highest short
circuit current
Did
previous DG
size cause loss of
coordination?
Has loss of coordination
occurred?
Increase
DG size
Did
previous DG size
cause loss of coordination?
Record DG size for fault at
specified bus
Have all load buses been
faulted?

46
4. If loss of fuse-recloser coordination has occurred, then it is necessary to look at the
previous iteration of the algorithm. If this is the first iteration, or the previous iteration
caused loss of coordination, then the DG size needs to be decreased. Otherwise the DG
size must be recorded for future use.
5. If loss of fuse-recloser coordination has not occurred, then it is necessary to look at the
previous iteration of the algorithm. If this is the first iteration, or the previous iteration
did not cause loss of coordination, then the DG size needs to be increased. Otherwise
the DG size must be recorded for future use.
6. After the DG size has been recorded, the algorithm needs to be repeated for all
coordination paths.
7. The algorithm ends with the result being the lowest DG size recorded from the analysis,
since this will be the largest DG size for the selected candidate point before a severe
fault will cause mis-operation of the previously determined fuse-recloser coordination.
It should be noted that the algorithm assumes that the protection coordination for the
distribution system has been completed as well as the increase/decrease of DG levels being
limited so as to accurately capture the penetration level. This algorithm is applied to all DG
candidate connection points.
3.2.2 Loss of Fuse-Recloser Coordination Case Study
In regular overcurrent protection coordination for radial distribution networks, it is
desirable for the primary protection (for temporary and permanent faults. In this case it is the
recloser and fuse respectively) to operate before the backup [11]. As demonstrated in Section 2.4,
the integration of DG sources can have an adverse effect on the short circuit characteristics of
distribution networks.
3.2.2.1 Bus 1 DG Connection
In order to illustrate the effect of DG integration on fuse-recloser coordination, the case
study presented in Section 2.4 should be considered. As depicted in Figure 2.22, the short circuit
current experienced by the load lateral fuse at bus 4 increases to 4319 A (11% increase) for a three
phase fault at bus 4 with 8.4 MVA synchronous machine based DG integration at bus 1. In contrast,

47
for the same fault conditions, the short circuit current experienced by the recloser located on the
main feeder decreases to 3750 A (5% decrease). This will result in the recloser and load fuse
reacting to the faulted condition at differing times than what was previously determined in Section
2.2.3.2. Through the utilization of the coordination chart presented in Figure 2.8, it is apparent that
the synchronous machine based DG integrated suburban distribution system, yields a recloser
operating time (fast curve) of 0.0294 seconds. In contrast, the lateral fuse protecting the bus 4 load
will operate in 0.0274 seconds (10% faster), meaning that it will blow before the recloser has time
to attempt to clear the fault. In addition, for this level of synchronous machine based DG
penetration, the characteristics determined in Section 2.2.3.2 can no longer be characterized as a
fuse saving scheme hence fuse-recloser coordination is no longer present, highlighting the
importance of assessment methods such as those presented in Figure 3.1.
In order to assess the level of synchronous machine based DG penetration that the suburban
distribution system is able to receive before loss of fuse-recloser coordination occurs, the algorithm
present in Figure 3.1 is utilized. In the suburban distribution system presented, there are a total of
four coordination paths with fuse-recloser protection as outlined in Section 2.2.2. Each of these
paths need to be considered, hence faults need to be placed separately at bus 5, 4, 3 and 2 for each
of the candidate connection points. As shown in APPENDIX B, for both the 8.4 MVA DG
connected and non DG suburban distribution systems the most severe type of fault is three phase
[10]. This results in the three phase fault yielding loss of fuse-recloser coordination before other
fault types in the presence of synchronous machine based DG sources.
It is apparent from results given in APPENDIX B that an 8.4 MVA synchronous machine
based DG source causes loss of fuse-recloser coordination, with three phase faults at bus 2 and bus
4 having the most severe effect. This means that the DG source needs to be reduced in size in order
to be able to determine the penetration level before loss of coordination.
Following the steps presented in Figure 3.1, a synchronous machine based DG size of 5.2
MVA is found to cause the recloser fast characteristic to yield the same trip time as the fuse along
the bus 4 coordination path. The time response for this condition and level of DG penetration can
be depicted graphically via Figure 2.22 in Section 2.4.

48
Observations of Figure 2.22 in conjunction with Figure 2.8 demonstrate that at a
synchronous machine based DG penetration level of 5.2 MVA, the short circuit characteristics of
the suburban distribution system will yield simultaneous operation of the bus 4 coordination paths
recloser and fuse hence coordination is lost.
In order to determine if the bus 4 fault presents the lowest synchronous machine based DG
penetration level before loss of fuse-recloser coordination, the bus 1 DG connected suburban
distributed system in Figure 2.21 is faulted at bus 2 (three phase fault). As per APPENDIX B, a
bus 2 fault yields a short circuit current of 4776 A experienced by the recloser. Through the use of
Figure 2.10 a recloser current of 4776 A yields an operating time (time) of 0.0273 seconds. The
fuse along the bus 2 coordination path in Figure 2.5 will operate at 0.0273 seconds once the short
circuit level reaches 5115 A. For a 5.2 MVA synchronous machine based DG at bus 1, the fault
current at bus 2 is 4955 A, less than the required 5115 A, meaning that coordination between the
fuse and recloser is maintained along the bus 2 coordination path. The time response for this
condition and level of DG penetration can be depicted graphically via Figure 3.2.
Figure 3.2: Time-domain RMS current simulation for a three phase fault applied at bus 2 with a
5.2 MVA synchronous machine based DG source integrated at bus 1.
0
1,000
2,000
3,000
4,000
5,000
6,000
7,000
8,000
8.95 8.97 8.99 9.01 9.03 9.05 9.07 9.09
Cu
rren
t (A
)
Time (s)
Ifault
Ifeeder

49
Observations of Figure 3.2 in conjunction with Figure 2.10 demonstrate that at a
synchronous machine based DG penetration level of 5.2 MVA, the short circuit characteristics of
the suburban distribution system along the bus 2 coordination path will yield a trip time of 0.0273
and 0.0282 seconds for the recloser and fuse respectively, hence fuse coordination is maintained.
From this it is apparent that the synchronous machine based DG penetration level before loss of
coordination between fuse and recloser of at least one coordination path occurs, is 5.2 MVA.
3.2.2.2 Bus 2 DG Connection
Figure 3.3: Suburban distribution system with DG integration at bus 2.
5 MVA 3 km
5 MVA
Bus 3
3 km
Bus 2
2.1 MVA,
0.9 p.f. lag.
residential
load
Fuse
Fuse
Fuse
2.1 MVA,
0.9 p.f. lag.
residential
load
1 km
1 km
Breaker and
recloser
Tie-
breaker
2 Ω reactor
M
100 MVA 100 MVA
25 kV
230 kV
1 km
1 km
Bus 1
∞
Bus 5
Bus 4
1 km
1 km
Utility
C1 C
1
C1 = 20 MVAR
P + j Q
6 remaining
feeders, 100
MVA, p.f. 0.95
lag.
P + j Q 5 remaining feeders,
84 MVA, p.f. 0.95
lag.
1 MVA,
0.9 p.f.
lag.
industrial
load
1 MVA, 0.9
p.f. lag.
commercial
load
Fuse
Vin
= 1.041
DG
1 km

50
The bus 2 DG connected (synchronous machine based source) suburban distribution
system can be depicted by Figure 3.3.
As observed in APPENDIX B, for a three phase fault at bus 4 of the system depicted in
Figure 3.3, the short circuit current experienced by the recloser is 4041 A. Through the use of
Figure 2.8, a recloser current of 4041 A yields an operating time (fast) of 0.0287 seconds. The
fuse along the bus 4 coordination path in Figure 2.3 will operate at 0.0287 seconds once the short
circuit level reaches 4176 A. In order for the fault current to lower to 4176 A, the DG source
connected at bus 2 needs to be reduced. Following the steps presented in Figure 3.1, a synchronous
machine based DG size of 5.5 MVA is found to cause the recloser fast characteristic to yield the
same trip time as the fuse along the bus 4 coordination path. The time response for this condition
and level of DG penetration can be depicted graphically via Figure 3.4.
Figure 3.4: Time-domain RMS current simulation for a three phase fault applied at bus 4 with a
5.5 MVA synchronous machine based DG source integrated at bus 2.
Observations of Figure 3.4 in conjunction with Figure 2.8 demonstrate that at a
synchronous machine based DG penetration level of 5.5 MVA, the short circuit characteristics of
the suburban distribution system will yield simultaneous operation of the bus 4 coordination paths
recloser and fuse, resulting in coordination loss.
0
1,000
2,000
3,000
4,000
5,000
6,000
8.95 8.97 8.99 9.01 9.03 9.05 9.07 9.09
Cu
rren
t (A
)
Time (s)
Ifault
Ifeeder

51
In order to determine if the bus 4 fault presents the lowest synchronous machine based DG
penetration level before loss of fuse-recloser coordination, the bus 2 DG connected suburban
distribution system in Figure 3.3 is faulted at bus 2 (three phase fault). As per APPENDIX B, a
bus 2 fault yields a short circuit current of 4724 A experienced by the recloser. Through the use of
Figure 2.10, a recloser current of 4724 A yields an operating time (time) of 0.0274 seconds. The
fuse along the bus 2 coordination path in Figure 2.5 will operate at 0.0274 seconds once the short
circuit level reaches 5084 A. For a 5.5 MVA synchronous machine based DG at bus 2, the fault
current at bus 2 is 5028 A, less than the required 5084 A, meaning that coordination between the
fuse and recloser is maintained along the bus 2 coordination path. The time response for this
condition and level of DG penetration can be depicted graphically via Figure 3.5.
Figure 3.5: Time-domain RMS current simulation for a three phase fault applied at bus 2 with a
5.5 MVA synchronous machine based DG source integrated at bus 2.
Observations of Figure 3.5 in conjunction Figure 2.10 demonstrate that at a synchronous
machine based DG penetration level of 5.5 MVA, the short circuit characteristics of the suburban
distribution system along the bus 2 coordination path will yield a trip time of 0.0274 and 0.0281
seconds for the recloser and fuse respectively, hence fuse coordination is maintained.
0
1,000
2,000
3,000
4,000
5,000
6,000
7,000
8,000
8.95 8.97 8.99 9.01 9.03 9.05 9.07 9.09
Cu
rren
t (A
)
Time (s)
Ifault
Ifeeder

52
From this it is apparent that the synchronous machine based DG penetration level of the
suburban distribution system depicted in Figure 3.3 is 5.5 MVA, before loss of coordination occurs
between the fuse and recloser of at least one coordination path.
3.2.2.3 Bus 4 DG Connection
Similar to Section 3.2.2.2, the bus 4 DG connected (synchronous machine based source)
suburban distribution system can be depicted by Figure 3.6.
Figure 3.6: Suburban distribution system with DG integration at bus 4.
5 MVA 3 km
5 MVA
Bus 3
3 km
Bus 2
2.1 MVA,
0.9 p.f. lag.
residential
load
Fuse
Fuse
Fuse
2.1 MVA,
0.9 p.f. lag.
residential
load
1 km
1 km
Breaker and
recloser
Tie-
breaker
2 Ω reactor
M
100 MVA 100 MVA
25 kV
230 kV
1 km
1 km
Bus 1
∞
Bus 5
Bus 4
1 km
1 km
Utility
C1 C
1
C1 = 20 MVAR
P + j Q
6 remaining
feeders, 100
MVA, p.f. 0.95
lag.
P + j Q 5 remaining feeders,
84 MVA, p.f. 0.95
lag.
1 MVA,
0.9 p.f.
lag.
industrial
load
1 MVA, 0.9
p.f. lag.
commercial
load
Fuse
Vin
= 1.041
DG
1 km

53
As observed in APPENDIX B, for a three phase fault at bus 4 of the system depicted in
Figure 3.6, the short circuit current experienced by the recloser is 3917 A. As illustrated in
Figure 2.8, a recloser current of 3917 yields an operating time (fast) of 0.0292 seconds. The fuse
along the bus 4 coordination path in Figure 2.3 will operate at 0.0292 seconds once the short circuit
level reaches 4152 A. In order for the fault current to lower to 4152 A, the DG source connected
at bus 4 needs to be reduced. Following the steps presented in Figure 3.1, a synchronous machine
based DG size of 3.8 MVA is found to cause the recloser fast characteristic to yield the same trip
time as the fuse along the bus 4 coordination path. The time response for this condition and level
of DG penetration can be depicted graphically via Figure 3.7.
Figure 3.7: Time-domain RMS current simulation for a three phase fault applied at bus 4 with a
3.8 MVA synchronous machine based DG source integrated at bus 4.
Observations of Figure 3.7 in conjunction with Figure 2.8 demonstrate that at a
synchronous machine based DG penetration level of 3.8 MVA, the short circuit characteristics of
the suburban distribution system will yield simultaneous operation of the bus 4 coordination path
recloser and fuse, resulting in coordination loss.
0
1,000
2,000
3,000
4,000
5,000
6,000
7,000
8,000
8.95 8.97 8.99 9.01 9.03 9.05 9.07 9.09
Cu
rren
t (A
)
Time (s)
Ifault
Ifeeder

54
In order to determine if the bus 4 fault presents the lowest synchronous machine based DG
penetration level before loss of fuse-recloser coordination, the bus 4 DG connected suburban
distributed system in Figure 3.6 is faulted at bus 2 (three phase fault). As per APPENDIX B, a bus
2 fault yields a short circuit current of 4724 A experienced by the recloser. Through the use of
Figure 2.10, a recloser current of 4724 A yields an operating time (time) of 0.0274 seconds. The
fuse along the bus 2 coordination path in Figure 2.5 will operate at 0.0274 seconds once the short
circuit level reaches 5084 A. For a 3.8 MVA synchronous machine based DG at bus 4, the fault
current at bus 2 is 4919 A, less than the required 5084 A, meaning that coordination between the
fuse and recloser is maintained along the bus 2 coordination path. The time response for this
condition and level of DG penetration can be depicted graphically via Figure 3.8.
Figure 3.8: Time-domain RMS current simulation for a three phase fault applied at bus 2 with a
3.8 MVA synchronous machine based DG source integrated at bus 4.
Observations of Figure 3.8 in conjunction with Figure 2.10 demonstrate that at a
synchronous machine based DG penetration level of 3.8 MVA, the short circuit characteristics of
the suburban distribution system along the bus 2 coordination path will yield a trip time of 0.0274
and 0.0282 seconds for the recloser and fuse respectively, hence fuse coordination is maintained.
0
1,000
2,000
3,000
4,000
5,000
6,000
7,000
8,000
8.95 8.97 8.99 9.01 9.03 9.05 9.07 9.09
Cu
rren
t (A
)
Time (s)
Ifault
Ifeeder

55
From this it is apparent that the synchronous machine based DG penetration level of the
suburban distribution system depicted in Figure 3.6 is 3.8 MVA, before loss of coordination
between the fuse and recloser of at least one coordination path occurs.
3.2.2.4 Bus 5 DG Connection
The bus 5 DG connected (synchronous machine based source) suburban distribution
system can be depicted by Figure 3.9.
Figure 3.9: Suburban distribution system with DG integration at bus 5.
5 MVA 3 km
5 MVA
Bus 3
3 km
Bus 2
2.1 MVA,
0.9 p.f. lag.
residential
load
Fuse
Fuse
Fuse
2.1 MVA,
0.9 p.f. lag.
residential
load
1 km
1 km
Breaker and
recloser
Tie-
breaker
2 Ω reactor
M
100 MVA 100 MVA
25 kV
230 kV
1 km
1 km
Bus 1
∞
Bus 5
Bus 4
1 km
1 km
Utility
C1 C
1
C1 = 20 MVAR
P + j Q
6 remaining
feeders, 100
MVA, p.f. 0.95
lag.
P + j Q 5 remaining
feeders, 84 MVA,
p.f. 0.95 lag.
1 MVA,
0.9 p.f.
lag.
industrial
load
1 MVA, 0.9
p.f. lag.
commercial
load
Fuse
Vin
= 1.041
DG 1 km

56
As observed in APPENDIX B, for a three phase fault at bus 4 of the system depicted in
Figure 3.9, the short circuit current experienced by the recloser is 3917 A. Through the use of
Figure 2.8, a recloser current of 3917 yields an operating time (fast) of 0.0292 seconds. The fuse
along the bus 4 coordination path in Figure 2.3 will operate at 0.0292 seconds once the short circuit
level reaches 4152 A (342 A lower than the 8.4 MVA DG). In order for the fault current to lower
to 4152 A, the DG source connected at bus 5 needs to be reduced. Following the steps presented
in Figure 3.1, A synchronous machine based DG size of 3.8 MVA is found to cause the recloser
fast characteristic to yield the same trip time as the fuse along the bus 4 coordination path. The
time response for this condition and level of DG penetration can be depicted graphically via Figure
3.10.
Figure 3.10: Time-domain RMS current simulation for a three phase fault applied at bus 4 with a
3.8 MVA synchronous machine based DG source integrated at bus 5.
Observations of Figure 3.10 in conjunction with Figure 2.8 demonstrate that at a
synchronous machine based DG penetration level of 3.8 MVA, the short circuit characteristics of
the suburban distribution system will yield simultaneous operation of the bus 4 coordination paths
recloser and fuse hence coordination is lost.
0
1,000
2,000
3,000
4,000
5,000
6,000
8.95 8.97 8.99 9.01 9.03 9.05 9.07 9.09
Cu
rren
t (A
)
Time (s)
Ifault
Ifeeder

57
In order to determine if the bus 4 fault presents the lowest synchronous machine based DG
penetration level before loss of fuse-recloser coordination, the bus 5 DG connected suburban
distribution system in Figure 3.9 is faulted at bus 2 (three phase fault). As per APPENDIX B, a
bus 2 fault yields a short circuit current of 4724 A experienced by the recloser. Through the use of
Figure 2.10, a recloser current of 4724 A yields an operating time (time) of 0.0274 seconds. The
fuse along the bus 2 coordination path in Figure 2.5 will operate at 0.0274 seconds once the short
circuit level reaches 5084 A. For a 3.8 MVA synchronous machine based DG at bus 5, the fault
current at bus 2 is 4909 A, less than the required 5084 A, meaning that coordination between the
fuse and recloser is maintained along the bus 2 coordination path. The time response for this
condition and level of DG penetration can be depicted graphically via Figure 3.11.
Figure 3.11: Time-domain RMS current simulation for a three phase fault applied at bus 2 with a
3.8 MVA synchronous machine based DG source integrated at bus 5.
Observations of Figure 3.11 in conjunction with Figure 2.10 demonstrate that at a
synchronous machine based DG penetration level of 3.8 MVA, the short circuit characteristics of
the suburban distribution system along the bus 2 coordination path will yield a trip time of 0.0274
and 0.0286 seconds for the recloser and fuse respectively, hence coordination is maintained.
0
1,000
2,000
3,000
4,000
5,000
6,000
7,000
8,000
8.95 8.97 8.99 9.01 9.03 9.05 9.07 9.09
Cu
rren
t (A
)
Time (s)
Ifault
Ifeeder

58
From this it is apparent that the synchronous machine based DG penetration level the
suburban distribution system depicted in Figure 3.9 is 3.8 MVA before loss of coordination
between the fuse and recloser of at least one coordination path occurs.
3.2.2.5 DG Connection Summary
The results for Sections 3.2.2.1 to 3.2.2.4 can be summarized as per Figure 3.12.
Figure 3.12: Synchronous machine based DG penetration levels for differing interconnection
points in the suburban distribution system before loss of fuse-recloser coordination
occurs.
Observations of Figure 3.12 in conjunction with Figure 2.1 makes it apparent that loss of
fuse-recloser coordination will occur for the suburban distribution system for relatively low levels
of synchronous machine based DG (24% of load demand) of interconnection types specified in
APPENDIX B. At these levels of penetration, the DG source supplements power delivered by the
utility, improving system supply quality. However, the increased short circuit level due to the fault
current contribution by the DG source nullifies existing fuse saving protection schemes.
0
1
2
3
4
5
6
5 4 3 2
DG
Siz
e (M
VA
)
DG Interconnection Location (Bus)
DG Level

59
3.3 Loss of Sensitivity Assessment due to Interconnection of DG sources
3.3.1 Loss of Sensitivity Definition and Method of Assessment
Increasing the size of a DG source can lead to downstream protective devices experiencing
greater fault levels than those that are upstream [11, 30]. The issue with this in the context of
sensitivity is that if the fault current contribution from the DG surpasses that of the contribution
from the utility then the main feeder circuit breaker may not be able to detect the fault condition.
In order to determine when a loss of sensitivity will occur, the algorithm adapted from the ideas in
[2] and presented in Figure 3.13 is useful. This can be explained by:
1. Firstly a synchronous machine based DG source is connected to a previously determined
candidate connection point.
2. A load bus is selected with a fault that yields the lowest short circuit current being
applied to the selection.
3. The algorithm allows the engineer to determine if loss of recloser sensitivity has
occurred, through analysis of the time overcurrent characteristics of the equipment for
the given coordination path.
4. If loss of recloser sensitivity has occurred then it is necessary to look at the previous
iteration of the algorithm. If this is the first iteration, or the previous iteration caused loss
of sensitivity, then the DG size needs to be decreased. Otherwise the DG size must be
recorded for future use.
5. If loss of recloser coordination has not occurred then it is necessary to look at the
previous iteration of the algorithm. If this is the first iteration or the previous iteration
did not cause loss of sensitivity then the DG size needs to be increased. Otherwise the
DG size must be recorded for future use.
6. After the DG size has been recorded, the algorithm needs to be repeated for all
coordination paths.
7. The algorithm ends with the result being the lowest DG size recorded from the analysis,
since this will be the largest DG size for the selected candidate point before the recloser
will no longer be sensitive to the smallest phase fault.

60
Figure 3.13: Algorithm for the determination of DG penetration level before the occurrence of
recloser loss of sensitivity.
3.3.2 Loss of Recloser Sensitivity Case Study
For faults between the utility and the DG source, the utility contribution becomes
independent of DG size. If the DG is connected in between the substation and a fault, the utilities
contribution to the short circuit current is decreased based on DG interconnection and source type.
The most extreme effect of the DG source connection is that it can have the capacity to decrease
the main feeder short circuit current to a point where the head end recloser/relay is no longer able
to sense fault conditions [2].
No
No
Yes
Yes
No
No
Yes
Yes
DG penetration level that first
causes loss of sensitivity for
specified connection point is
the lowest of the DG sizes
recorded
Select candidate DG
connection point
Place DG source at selected
connection point
Decrease
DG size
Select a load bus yielding lowest
fault current
Apply the fault yielding lowest
short circuit current
Did
previous DG
size cause loss of sensitivity?
Has loss of sensitivity
occurred?
Increase
DG size
Did
previous DG size
cause loss of sensitivity?
Record DG size for fault at
specified bus
Have all load buses been
faulted?

61
Observation of results given in APPENDIX B makes it apparent that for the suburban
distribution system given in Figure 2.1, the lowest short circuit current experienced by the network
is a line to line fault at the bus 5 load corresponding to the coordination path in Figure 2.6. For this
coordination path the recloser pick up current is 560 A. Observation of APPENDIX B
demonstrates that the penetration level for a synchronous machine based DG source, with a wye
ground/wye ground transformer, needs to be increased for each connection point before loss of
recloser sensitivity will occur. Interconnection data is given in APPENDIX A.
3.3.2.1 Bus 1 DG Connection
Following the steps presented in Figure 3.13, a synchronous machine based DG size of
55.6 MVA is found to cause the recloser to become insensitive to a line to line faulted condition
at the bus 5 load. The time response for this condition and level of DG penetration as well as 8.4
MVA and no DG can be depicted graphically via Figure 3.14.
Figure 3.14: Time-domain recloser RMS current simulation for a line to line fault applied at the
bus 5 load with synchronous machine based DG sources integrated at bus 1.
Through observation of Figure 3.14 in conjunction with the recloser pick up setting of 560
A, it is apparent that for a synchronous machine based DG penetration level of 55.6 MVA, the
head end recloser is no longer able to detect every fault condition.
0
100
200
300
400
500
600
700
800
900
1,000
8.95 8.97 8.99 9.01 9.03 9.05 9.07 9.09
Cu
rren
t (A
)
Time (s)
8.4 MVA DG
55.6 MVA DG
No DG

62
3.3.2.2 Bus 2 DG Connection
In order to assess the level of synchronous machine based DG penetration at bus 2 that the
suburban distribution system is able to receive before loss of recloser sensitivity occurs, the
algorithm present in Figure 3.13 is utilized.
Following the steps presented in Figure 3.13, a synchronous machine based DG size of
55.5 MVA is found to cause the recloser to become insensitive to a line to line faulted condition
at the bus 5 load. The time response for this condition and level of DG penetration as well as 8.4
MVA and no DG can be depicted graphically via Figure 3.15.
Figure 3.15: Time-domain recloser RMS current simulation for a line to line fault applied at the
bus 5 load with synchronous machine based DG sources integrated at bus 2.
Through observation of Figure 3.15 in conjunction with the recloser pick up setting of 560
A, it is apparent that for a synchronous machine based DG penetration level 55.5 MVA, the head
end recloser is no longer able to detect every fault condition.
0
100
200
300
400
500
600
700
800
900
1,000
8.95 8.97 8.99 9.01 9.03 9.05 9.07 9.09
Cu
rren
t (A
)
Time (s)
8.4 MVA DG
55.5 MVA DG
No DG

63
3.3.2.3 Bus 4 DG Connection
In order to assess the level of synchronous machine based DG penetration at bus 4 that the
suburban distribution system is able to receive before loss of recloser sensitivity occurs, the
algorithm present in Figure 3.13 is utilized.
Following the steps presented in Figure 3.13, a synchronous machine based DG size of
50.5 MVA is found to cause the recloser to become insensitive to a line to line faulted condition
at the bus 5 load. The time response for this condition and level of DG penetration as well as 8.4
MVA and no DG can be depicted graphically via Figure 3.16.
Figure 3.16: Time-domain recloser RMS current simulation for a line to line fault applied at the
bus 5 load with synchronous machine based DG sources integrated at bus 4.
Through observation of Figure 3.16 in conjunction with the recloser pick up setting of 560
A, it is apparent that for a synchronous machine based DG penetration level 50.5 MVA, the head
end recloser is no longer able to detect every fault condition.
0
100
200
300
400
500
600
700
800
900
1,000
8.95 8.97 8.99 9.01 9.03 9.05 9.07 9.09
Cu
rren
t (A
)
Time (s)
8.4 MVA DG
50.5 MVA DG
No DG

64
3.3.2.4 Bus 5 DG Connection
In order to assess the level of synchronous machine based DG penetration at bus 5 that the
suburban distribution system is able to receive before loss of recloser sensitivity occurs, the
algorithm present in Figure 3.13 is utilized.
Following the steps presented in Figure 3.13, a synchronous machine based DG size of
48.8 MVA is found to cause the recloser to become insensitive to a line to line faulted condition
at the bus 5 load. The time response for this condition and varying level of DG penetration can be
depicted graphically via Figure 3.17.
Figure 3.17: Time-domain recloser RMS current simulation for a line to line fault applied at the
bus 5 load with synchronous machine based DG sources integrated at bus 5.
Through observation of Figure 3.17 in conjunction with the recloser pick up setting of 560
A, it is apparent that for a synchronous machine based DG penetration level of 48.8 MVA, the
head end recloser is no longer able to detect every fault condition.
0
100
200
300
400
500
600
700
800
900
1,000
8.95 8.97 8.99 9.01 9.03 9.05 9.07 9.09
Cu
rren
t (A
)
Time (s)
8.4 MVA DG
48.8 MVA DG
No DG

65
3.3.2.5 DG Connection Summary
The results for Sections 3.3.2.1 to 3.3.2.4 can be summarized as per Figure 3.12.
Figure 3.18: Synchronous machine based DG penetration levels for differing interconnection
points in the suburban distribution system before loss of recloser sensitivity occurs.
Observation of Figure 3.12 in conjunction with Figure 2.1 makes it apparent that loss of
recloser sensitivity will occur for the suburban distribution system for high levels of synchronous
machine based DG (at least 300% of the load demand) of interconnection types specified in
APPENDIX A. At these levels of penetration, the DG source supplies power to the utility, removing
the unidirectional power flow scheme typical of radial distribution networks (utility to load
direction). This loss of sensitivity violates the fuse-saving scheme employed in radial distribution
networks due to the failure of the recloser to detect short circuit conditions, leaving the utility
susceptible to feeding faulted lines should the fuse protection fail to operate for permanent faults.
Additionally, comparison of varying DG source levels in Figures 3.14, 3.15, 3.16 and 3.17
makes it apparent that increasing levels of synchronous machine based DG penetration yield lower
0
10
20
30
40
50
60
5 4 3 2
DG
Siz
e (M
VA
)
DG Interconnection Location (Bus)
DGLevel

66
short circuit currents experienced by the head end recloser for faults downstream of the utility and
DG connection point.
3.4 Bi-Directionality Assessment due to Interconnection of DG sources
3.4.1 Bi-Directionality Definition and Method of Assessment
Increasing the size of a DG source can lead to unwanted bi-directionality behavior of the
main system, while adjacent feeders experience faulted conditions [2]. This situation can be
observed via Figure 3.19.
Figure 3.19: Short circuit contribution for a radial distribution network with DG integration [2].
In regular radial distribution networks, when a fault occurs on a feeder, the short circuit
current source is purely from the utility connection [11], hence the current level experienced by
feeder 2 is zero. This is no longer the case for DG integrated networks as the fault can be fed from
multiple sources [2], resulting in additional short circuit current in the fault level.
As per Figure 3.19, if the short circuit current contribution from the DG source at feeder 2
to a fault on feeder 1 (adjacent) is sufficient, there is a possibility that the relay/recloser (B2)
protecting feeder 2 will operate faster than that at B1 for a fault on feeder 1. This results in

67
unnecessary interruption of the healthy feeder (2) which can degrade power quality [2]. In order
to determine when bi-directionality will occur, the following algorithm adapted from the ideas in
[2] and presented in Figure 3.20 is useful. This can be explained by:
1) Firstly a DG source is connected to a previously determined candidate connection point.
2) An adjacent feeder is created that is of a larger size than the main feeder. Double the load
size will be adequate [2]
3) If the steady state current of the system exceeds the rating of the network equipment then
the DG needs to decrease in size. The steady state current analysis is repeated until the DG
size does not cause currents to exceed equipment ratings.
4) A three phase fault is applied to the adjacent feeder.
5) The algorithm then requires the engineer to determine if bi-directionality has occurred.
This can be done through analysis of the time overcurrent characteristics of the protective
devices of both the adjacent and main feeder. If the main feeder trips before the adjacent
feeder, then bi-directionality has occurred at an unacceptable level.
6) If bi-directionality has occurred, it is necessary to look at the previous iteration of the
algorithm. If this is the first iteration or the previous iteration caused bi-directionality then
the DG size needs to be decreased. Otherwise the DG size must be recorded and the
algorithm terminates.
7) If bi-directionality did not occur following a three phase fault on the adjacent feeder then
the previous steady state solution must be observed. If the previous iteration of the
algorithm caused the steady state current of the system to exceed rated capacity then the
DG size needs to be recorded and the algorithm terminates. If the previous iteration did not
cause exceeded capacity and did not cause bi-directionality then the DG size needs to be
increased. If the previous iteration did not cause exceeded capacity but did cause bi-
directionality then the DG size needs to be recorded and the algorithm terminates. If this
was the first iteration then the DG size is required to be increased.
This algorithm is applied to all DG candidate connection points.

68
Figure 3.20: Algorithm for the determination of DG penetration level before the occurrence of
recloser bi-directionality.
3.4.2 Bi-Directionality Case Study
For all coordination paths in the suburban distribution network, the recloser pick up current
is 560 A and 280 A for the phase and ground respectively. In accordance with Figure 3.20, to
perform a recloser bi-directionality assessment of the suburban distribution network a PQ load of
32.4 MVA is placed parallel to the main feeder. The head end recloser of the adjacent feeder is
No
No
Yes No
Yes
Yes
Record DG size for
specified DG connection
point
Select candidate DG
connection point
Place DG source at selected
connection point
Decrease
DG size
Select a load bus
Apply a three-phase fault to the
adjacent feeder
Did
previous DG
size cause bi-directionality?
Has bi-directionality
occurred?
Increase
DG size
Did
previous DG size
cause bi-directionality?
Create an adjacent feeder with double
the load size of the main feeder

69
assumed to be a Schweitzer 351R G&W VIPER, Phase trip: 1120 A, Fast curve: 101, Slow curve:
132, Ground Trip: 560 A, Fast curve: 101, Slow curve: 138. The TCC curves of both the phase
and ground are shown in Figures 3.21 and 3.22 superimposed over the recloser TCC curves for the
main feeder [11, 18].
Figure 3.21: Phase Time-Current Characteristics of the main and parallel feeder head end recloser.
Figure 3.22: Ground Time-Current Characteristics of the main and parallel feeder head end
recloser.
Observation of Figures 3.21 and 3.22 makes it apparent that the recloser of the main feeder
will operate simultaneously with the recloser on the parallel when the short circuit current exceeds
1151 A and 624 A for the phase and ground respectively. The most severe fault in the suburban
distribution system is three phase and double line to ground for the phase and ground respectively.
0.01
0.1
1
10
100
1 10 100 1000 10000 100000 1000000
Tim
e (s
)
Current (A)
Parallel Feeder (1) Fast
Parallel Feeder (1)Slow
Main Feeder(2) Fast
Main Feeder (2) Slow
0.01
0.1
1
10
100
1000
1 10 100 1000 10000 100000
Tim
e (s
)
Current (A)
Parallel Feeder (1)FastParallel Feeder (1)Slow

70
3.4.2.1 Bus 1 DG Connection
In order to assess the level of synchronous machine based DG penetration at bus 1 that the
suburban distribution system is able to receive before recloser bi-directionality occurs for a fault
on a parallel feeder, the algorithm present in Figure 3.20 is utilized.
Following the steps presented in Figure 3.20, a synchronous machine based DG size of 4.7
MVA is found to cause the recloser to operate for a parallel feeder double line to ground fault
before primary protection is able to react. The time response for the main feeder head end recloser
following a double line to ground fault on the adjacent feeder with a 4.7 MVA and 8.4 MVA level
of DG penetration can be depicted graphically via Figure 3.23.
Figure 3.23: Time-domain primary feeder recloser RMS current simulation for a line to line to
ground fault applied at the parallel feeder with main feeder synchronous machine
based DG source integration at bus 1.
In order to determine if the double line to ground fault presents the lowest synchronous
machine based DG penetration level before the occurrence of bi-directional operation, a three
phase fault is applied to the parallel feeder. The time response for the main feeder head end recloser
following a three phase fault on the adjacent feeder with a 4.7 MVA and 8.4 MVA level of DG
penetration can be depicted graphically via Figure 3.24.
0
200
400
600
800
1,000
1,200
8.95 8.97 8.99 9.01 9.03 9.05 9.07 9.09
Cu
rren
t (A
)
Time (s)
8.4 MVA DG
4.7 MVA DG

71
Figure 3.24: Time-domain primary feeder recloser RMS current simulation for a three phase fault
applied at the parallel feeder with main feeder synchronous machine based DG
source integration at bus 1.
Through observation of Figures 3.23 and 3.24 in conjunction with the recloser pick up
settings, it is apparent that for a synchronous machine based DG penetration level of 4.7 MVA,
the head end recloser of the main feeder will operate before the parallel feeder protection for a
double line to ground fault but not for a three phase. For a DG penetration level of 8.4 MVA the
main feeder recloser current exceeds the 1151 A and 624 A for three phase and double line to
ground faults respectively, yielding main feeder recloser operation before the parallel feeder. From
this it is apparent that the ground fault characteristic is what will cause bi-directionality behavior
before the phase. Note that the parallel feeder fault current exceeds 30 kA.
3.4.2.2 Bus 2 DG Connection
In order to assess the level of synchronous machine based DG penetration at bus 2 that the
suburban distribution system is able to receive before recloser bi-directionality occurs for a fault
on a parallel feeder, the algorithm present in Figure 3.20 is utilized.
Following the steps presented in Figure 3.20, a synchronous machine based DG size of 5
MVA is found to cause the recloser to operate for a parallel feeder double line to ground fault
0
200
400
600
800
1,000
1,200
8.95 8.97 8.99 9.01 9.03 9.05 9.07 9.09
Cu
rren
t (A
)
Time (s)
8.4 MVA DG
4.7 MVA DG

72
before primary protection is able to react. The time response for the main feeder head end recloser
following a double line to ground fault on the adjacent feeder with a 5 MVA and 8.4 MVA level
of DG penetration can be depicted graphically via Figure 3.25.
Figure 3.25: Time-domain primary feeder recloser RMS current simulation for a line to line to
ground fault applied at the parallel feeder with main feeder synchronous machine
based DG source integration at bus 2.
Through observation of Figure 3.25 in conjunction with the recloser ground settings, it is
apparent that for a synchronous machine based DG penetration level of 5 MVA, the head end
recloser of the main feeder will operate before the parallel feeder protection for a double line to
ground fault. Note that the parallel feeder fault current exceeds 30 kA.
3.4.2.3 Bus 4 DG Connection
In order to assess the level of synchronous machine based DG penetration at bus 4 that the
suburban distribution system is able to receive before recloser bi-directionality occurs for a fault
on a parallel feeder, the algorithm present in Figure 3.20 is utilized.
0
200
400
600
800
1,000
1,200
8.95 8.97 8.99 9.01 9.03 9.05 9.07 9.09
Cu
rren
t (A
)
Time (s)
8.4 MVA DG
5 MVA DG

73
Following the steps presented in Figure 3.20, a synchronous machine based DG size of 5.5
MVA is found to cause the recloser to operate for a parallel feeder double line to ground fault
before primary protection is able to react. The time response for the main feeder head end recloser
following a double line to ground fault on the adjacent feeder with a 5.5 MVA and 8.4 MVA level
of DG penetration can be depicted graphically via Figure 3.26.
Figure 3.26: Time-domain primary feeder recloser RMS current simulation for a line to line to
ground fault applied at the parallel feeder with main feeder synchronous machine
based DG source integration at bus 4.
Through observation of Figure 3.26 in conjunction with the recloser ground settings, it is
apparent that for a synchronous machine based DG penetration level of 5.5 MVA, the head end
recloser of the main feeder will operate before the parallel feeder protection for a double line to
ground fault. Note that the parallel feeder fault current exceeds 30 kA.
3.4.2.4 Bus 5 DG Connection
In order to assess the level of synchronous machine based DG penetration at bus 5 that the
suburban distribution system is able to receive before recloser bi-directionality occurs for a fault
on a parallel feeder, the algorithm present in Figure 3.20 is utilized.
0
100
200
300
400
500
600
700
800
900
1,000
8.95 8.97 8.99 9.01 9.03 9.05 9.07 9.09
Cu
rren
t (A
)
Time (s)
8.4 MVA DG
5.5 MVA DG

74
Following the steps presented in Figure 3.20, a synchronous machine based DG size of 5.8
MVA is found to cause the recloser to operate for a parallel feeder double line to ground fault
before primary protection is able to react. The time response for the main feeder head end recloser
following a double line to ground fault on the adjacent feeder with a 5.8 MVA and 8.4 MVA level
of DG penetration can be depicted graphically via Figure 3.27.
Figure 3.27: Time-domain primary feeder recloser RMS current simulation for a line to line to
ground fault applied at the parallel feeder with main feeder synchronous machine
based DG source integration at bus 5.
Through observation of Figure 3.27 in conjunction with the recloser ground settings, it is
apparent that for a synchronous machine based DG penetration level of 5.8 MVA, the head end
recloser of the main feeder will operate before the parallel feeder protection for a double line to
ground fault. Note that the parallel feeder fault current exceeds 30 kA.
0
100
200
300
400
500
600
700
800
900
1,000
8.95 8.97 8.99 9.01 9.03 9.05 9.07 9.09
Cu
rren
t (A
)
Time (s)
8.4 MVA DG
5.8 MVA DG

75
3.4.2.5 DG Connection Summary
The results for Sections 3.4.2.1 to 3.4.2.4 can be summarized as per Figure 3.28.
Figure 3.28: Synchronous machine based DG penetration levels for differing interconnection
points in the suburban distribution system before bi-directionality occurs for an
adjacent feeder.
Observation of Figure 3.28 in conjunction with Figure 2.1 makes it apparent that bi-
directionality of recloser operation can occur for the suburban distribution system for low
penetration levels of synchronous machine based DG (as low as 29% of the load demand) of
interconnection types specified in APPENDIX A. At these levels of penetration, the DG source is
able to supply short circuit current to a fault in an adjacent feeder in addition to the utility.
Consequently, the DG source causes bi-directional power flow, meaning the main feeder recloser
in Figure 2.1 is able to detect the fault condition of the adjacent feeder. This bi-directional behavior
of the main head end recloser causes unnecessary interruption of the supply to the healthy feeder
compromising system power quality and reliability of supply.
0
1
2
3
4
5
6
7
5 4 3 2
DG
Siz
e (M
VA
)
DG Interconnection Location (Bus)
DGLevel
76
Additionally, comparison of varying DG source levels in Figures 3.24, 3.25, 3.26 and 3.27
makes it apparent that increasing levels of synchronous machine based DG penetration yield more
severe bi-directional behavior of the head end recloser of the main feeder.
3.5 Summary
Chapter 3 has provided methods for the assessment of loss of fuse-recloser coordination,
loss of head end recloser sensitivity and recloser bi-directionality behavior for adjacent feeder
faults that have been applied to the suburban distribution network. Detailed digital time-domain
simulations and explanations into the effects of synchronous machine based DG integration into
the suburban distribution system for varying connection points are presented. Results obtained
demonstrate that low levels of synchronous machine based DG penetration can yield loss of fuse-
recloser coordination as well as recloser bi-directionality behavior for adjacent feeder faults, while
high penetration is required for recloser sensitivity loss.

77
4. THE UTILIZATION OF FCLS IN THE
MITIGATION OF SYNCHRONOUS MACHINE
BASED DG INFLUENCES ON FUSE-RECLOSER
PROTECTION INFRASTRUCTURE
4.1 Introduction
This chapter examines the use of superconducting fault current limiters as a solution to
mitigation of the detrimental effects that synchronous machine based DG integration has on system
short circuit currents during faulted conditions. The proposed approach utilizes FCLs at the DG
side of the interconnection transformer as per Figure 4.1. This is in conjunction with the algorithms
presented in Figures 3.1, 3.13 and 3.20 and the case study in Section 2.4; the purpose to determine
FCL (each type presented in Section 2.3.7) effectiveness for mitigation of subsequent effects on
fuse-recloser protection infrastructure in the suburban distribution network presented in Chapter
3.
Figure 4.1: A DG interconnecting scheme with the presence of FCLs.
4.2 Fault Current Contribution from Synchronous Machine Based DG Integration in
the Presence of FCLs
The case study presented in Section 2.4 demonstrates the effect of synchronous machine
based DG integration on short-circuit levels of the suburban distribution network. In order to
G
Collector Feeder
∞
DG Source
Interconnecting
Transformer
Utility Network
FCL

78
determine the effectiveness of each FCL type presented in Section 2.3.7 in the use of mitigation
of these increased short circuit currents, the method presented in Section 2.4 is utilized.
As per Figure 4.2, an 8.4 MVA synchronous machine based DG source is integrated into
the suburban distribution system at bus 1 with an FCL placed as per Figure 4.1.
Figure 4.2: Suburban distribution system bus voltages with DG integration at bus 1 with FCL
presence.
5 MVA 3 km
5 MVA
Bus 3
3 km
Bus 2
2.1 MVA,
0.9 p.f. lag.
residential
load
Fuse
Fuse
Fuse
2.1 MVA,
0.9 p.f. lag.
residential
load
1 km
1 km
Breaker and
recloser
Tie-
breaker
2 Ω reactor
M
100 MVA 100 MVA
25 kV
230 kV
1 km
1 km
Bus 1
∞
Bus 5
Bus 4
1 km
1 km
Utility
C1 C
1
C1 = 20 MVAR
P + j Q
6 remaining
feeders, 100
MVA, p.f. 0.95
lag.
P + j Q 5 remaining feeders,
84 MVA, p.f. 0.95
lag.
1 MVA,
0.9 p.f. lag.
industrial
load
1 MVA, 0.9
p.f. lag.
commercial
load
Fuse
Vfeed
= 0.9788
Vin
= 1.041
DG
1 km
FCL
V1 = 0.9763
V2 = 0.9743
V3 = 0.9729
V4 = 0.9721
V5 = 0.9716
V5L = 0.9656

79
A three phase fault is applied to the bus 4 load. The time-domain short circuit currents
experienced by the bus 4 fuse and head end-recloser for each FCL type is presented in Figures 4.3,
4.4 and 4.5 with a summary presented in Figure 4.6
Figure 4.3: Time-domain RMS current simulation for a three phase fault applied at bus 4 with 8.4
MVA DG integration at bus1 in the presence of a 60 Ω R type FCL.
Figure 4.4: Time-domain RMS current simulation for a three phase fault applied at bus 4 with 8.4
MVA DG integration at bus1 in the presence of a 0.16 H L type FCL.
0
1000
2000
3000
4000
5000
6000
8.95 8.97 8.99 9.01 9.03 9.05 9.07 9.09
Cu
rren
t (A
)
Time (s)
Ifault
Ifeeder
0
1000
2000
3000
4000
5000
6000
8.95 8.97 8.99 9.01 9.03 9.05 9.07 9.09
Cu
rren
t (A
)
Time (s)
Ifault
Ifeeder

80
Figure 4.5: Time-domain RMS current simulation for a three phase fault applied at bus 4 with 8.4
MVA DG integration at bus1 in the presence of a resonant type FCL.
Figure 4.6: Summary of short circuit currents with an 8.4 MVA synchronous machined based DG
source integrated at bus 1 in the suburban distribution system with a three phase fault
applied at bus 4.
0
1000
2000
3000
4000
5000
6000
8.95 8.97 8.99 9.01 9.03 9.05 9.07 9.09
Cu
rren
t (A
)
Time (s)
Ifault
Ifeeder
3600
3800
4000
4200
4400
4600
4800
Feeder Fault
Fau
lt c
urr
ent
(A)
Current Type
No FCL FCL_R FCL_L FCL_LC No FCL/DG

81
Analysis of Figure 4.6 demonstrates that the introduction of the R, L and resonant type
FCL’s into the system presented in Figure 4.1 yields 0.8%, 0.7% and 0.1% differences in fault
current when compared to that of the original short circuit characteristic presented in Figure 2.19,
an improvement from the 12% difference experienced without the presence of FCL’s. Observation
of Figure 4.6 makes it apparent that the utilization of FCLs on the DG side of the interconnection
infrastructure’s transformer yields mitigation of synchronous machine based DG source effects on
system short circuit current.
In commercial applications there are a wide variety of resistive and inductive type FCLs of
varying magnitudes of resistances and inductances. In order to reflect results consistent with
varying resistive values, the resistive and inductive type FCLs in the system presented in Figure
4.2 are varied in magnitude. Figures 4.7, 4.8, 4.9 and 4.10 show the time domain simulations and
Figures 4.11 and 4.12 shows a summary for each FCL type for a three phase fault at bus 4 for the
8.4 MVA synchronous machine based DG integrated suburban distribution system with the R and
L type FCL’s values being varied between 20 Ω - 50 Ω and 0.05 H - 0.13 H respectively.
Figure 4.7: Time-domain RMS current simulation for a three phase fault applied at bus 4 with 8.4
MVA DG integration at bus1 in the presence of a 50 Ω R type FCL.
0
1000
2000
3000
4000
5000
6000
8.95 8.97 8.99 9.01 9.03 9.05 9.07 9.09
Cu
rren
t (A
)
Time (s)
Ifault
Ifeeder

82
Figure 4.8: Time-domain RMS current simulation for a three phase fault applied at bus 4 with 8.4
MVA DG integration at bus1 in the presence of a 20 Ω R type FCL.
Figure 4.9: Time-domain RMS current simulation for a three phase fault applied at bus 4 with 8.4
MVADG integration at bus1 in the presence of a 0.13 H L type FCL.
0
1000
2000
3000
4000
5000
6000
8.95 8.97 8.99 9.01 9.03 9.05 9.07 9.09
Cu
rren
t (A
)
Time (s)
Ifault
Ifeeder
0
1000
2000
3000
4000
5000
6000
8.95 8.97 8.99 9.01 9.03 9.05 9.07 9.09
Cu
rren
t (A
)
Time (s)
Ifault
Ifeeder

83
Figure 4.10: Time-domain RMS current simulation for a three phase fault applied at bus 4 with
8.4 MVA DG integration at bus1 in the presence of a 0.05 H L type FCL.
Figure 4.11: Summary of short circuit currents for varying resistive FCL magnitudes with an 8.4
MVA synchronous machine based DG source integrated at bus 1 in the suburban
distribution system with a three phase fault applied at bus 4.
0
1000
2000
3000
4000
5000
6000
8.95 8.97 8.99 9.01 9.03 9.05 9.07 9.09
Cu
rren
t (A
)
Time (s)
Ifault
Ifeeder
3600
3800
4000
4200
4400
4600
4800
Feeder Fault
Fau
lt c
urr
ent
(A)
No FCL R 60ohm R 50ohm R 20ohm No FCL/DG

84
Figure 4.12: Summary of short circuit currents for varying inductive FCL magnitudes with an 8.4
MVA synchronous machine based DG source integrated at bus 1 in the suburban
distribution system with a three phase fault applied at bus 4.
Observation of Figures 4.11 and 4.12 makes it apparent that increasing the impedance of a
superconducting FCL yields a higher efficiency mitigation capability of synchronous machine
based DG integration influences on radial system short circuit characteristics.
In the case of both the resistive and inductive type FCL’s, it is apparent that increasing the
resistive state impedance yields stronger similarity in short circuit levels when compared to the
original non DG integrated systems.
From results obtained it is apparent that the introduction of FCL’s on the DG side of the
interconnecting transformer of a synchronous machine based DG source can drastically change
the effect that DG integration can impose on existing system short circuit characteristics.
4.3 The Use of FCLs for the Mitigation of Synchronous Machine Based DG Influences
on Fuse-Recloser Coordination
In order to determine the effectiveness of each type of FCL in mitigating the effect of
synchronous machine based DG sources on existing system fuse-recloser coordination, the
algorithm presented in Figure 3.1 is utilized.
3600
3800
4000
4200
4400
4600
4800
Feeder Fault
Fau
lt c
urr
ent
(A)
No FCL L 0.16H L 0.13H L 0.05H No FCL/DG
85
4.3.1 Bus 1 DG Connection
In order to illustrate the effect of FCL (each type) utilization in the mitigation of
synchronous machine based DG influences on fuse-recloser coordination in fuse-saving schemes,
consider the case study presented in Section 4.2. As depicted in Figures 4.3, 4.4, 4.5 and 4.6, the
short circuit current experienced by the lateral load fuse at bus 4 with synchronous machine based
DG source integration with FCL installation decreases to 3901 A, 3896 A, and 3853 A for the
resistive (60 Ω), inductive (0.16 H) and resonant type FCLs respectively, when compared to the
4319 A experienced without FCL connection. As shown in APPENDIX B, for the base suburban
distribution system (no DG), the short circuit current experienced by the lateral fuse at bus 4 for a
three phase fault condition is 3869 A. Comparison highlights that FCL integration reduces the
discrepancy between initial non DG integrated short circuit characteristics from 12% to less than
1% for each FCL type.
In contrast, the short circuit current experienced by the head end recloser increases to 3937
A, 3901 A, and 3947 A for the resistive (60 Ω), inductive (0.16 H) and resonant type FCLs
respectively when compared to 3750 A experienced without FCL connection. As shown in
APPENDIX B, for the base suburban distribution system (no DG), the short circuit current
experienced by the head end recloser for a three phase fault condition at bus 4 is 3917 A.
Comparison highlights that FCL integration reduces the discrepancy between initial non DG
integrated short circuit characteristics from 5% to less than 1% for each FCL type.
Consequently, through the utilization of the coordination chart presented in Figure 2.8, it
is apparent that the synchronous machine based DG integrated suburban distribution system with
FCL connection, yields a recloser operating time (fast curve) of 0.029 seconds for each of the FCL
types. In contrast, the lateral fuse protecting the bus 4 load will operate in 0.0314, 0.0315, and
0.0318 seconds respectively, hence the head end recloser will operate before the fuse resulting in
the revalidation of the fuse-saving scheme initially employed. Comparison to the original suburban
distribution system bus 4 coordination path demonstrates that for initial short circuit characteristics
for a three phase fault at bus 4, the fuse operates in 0.0316 seconds and the head end recloser in
0.029 seconds. Observations show that the discrepancy between the original coordination and FCL
installed synchronous machine based DG integrated system is less than 1% and original fuse-
saving schemes are still valid. Considering that the three phase fault is the most severe [10], it is
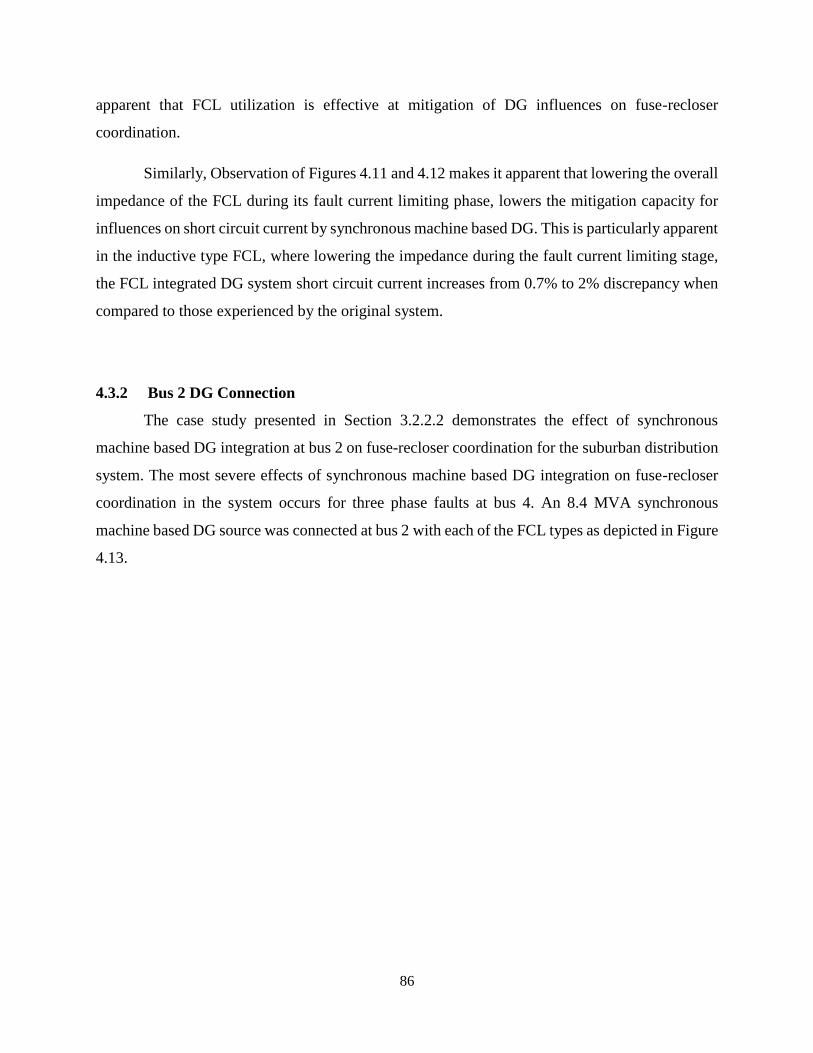
86
apparent that FCL utilization is effective at mitigation of DG influences on fuse-recloser
coordination.
Similarly, Observation of Figures 4.11 and 4.12 makes it apparent that lowering the overall
impedance of the FCL during its fault current limiting phase, lowers the mitigation capacity for
influences on short circuit current by synchronous machine based DG. This is particularly apparent
in the inductive type FCL, where lowering the impedance during the fault current limiting stage,
the FCL integrated DG system short circuit current increases from 0.7% to 2% discrepancy when
compared to those experienced by the original system.
4.3.2 Bus 2 DG Connection
The case study presented in Section 3.2.2.2 demonstrates the effect of synchronous
machine based DG integration at bus 2 on fuse-recloser coordination for the suburban distribution
system. The most severe effects of synchronous machine based DG integration on fuse-recloser
coordination in the system occurs for three phase faults at bus 4. An 8.4 MVA synchronous
machine based DG source was connected at bus 2 with each of the FCL types as depicted in Figure
4.13.

87
Figure 4.13: Suburban distribution system with DG integration at bus 2 with FCL presence.
A three phase fault is applied to the bus 4 load. The time-domain short circuit currents
experienced by the bus 4 fuse and head end-recloser for each FCL type is presented in Figures
4.14 and 4.15 with a summary presented in Figure 4.16.
5 MVA 3 km
5 MVA
Bus 3
3 km
Bus 2
2.1 MVA,
0.9 p.f. lag.
residential
load
Fuse
Fuse
Fuse
2.1 MVA,
0.9 p.f. lag.
residential
load
1 km
1 km
Breaker and
recloser
Tie-
breaker
2 Ω reactor
M
100 MVA 100 MVA
25 kV
230 kV
1 km
1 km
Bus 1
∞
Bus 5
Bus 4
1 km
1 km
Utility
C1 C
1
C1 = 20 MVAR
P + j Q
6 remaining
feeders, 100
MVA, p.f. 0.95
lag.
P + j Q 5 remaining feeders,
84 MVA, p.f. 0.95
lag.
1 MVA,
0.9 p.f. lag.
industrial
load
1 MVA, 0.9
p.f. lag.
commercial
load
Fuse
Vin
= 1.041
DG
1 km

88
Figure 4.14: Time-domain RMS fault current simulation for a three phase fault applied at bus 4 with 8.4 MVA
DG integration at bus 2 in the presence of a varying FCL types.
Figure 4.15: Time-domain RMS recloser current simulation for a three phase fault applied at bus 4 with 8.4 MVA
DG integration at bus 2 in the presence of varying FCL types.
0
1000
2000
3000
4000
5000
6000
8.95 8.97 8.99 9.01 9.03 9.05 9.07 9.09
Cu
rren
t (A
)
Time (s)
R 60ohmL 0.16HResonantNo DGNo FCL
0
1000
2000
3000
4000
5000
6000
8.95 8.97 8.99 9.01 9.03 9.05 9.07 9.09
Cu
rren
t (A
)
Time (s)
R 60ohm
L 0.16H
Resonant
No DG
No FCL

89
Figure 4.16: Summary of short circuit currents with an 8.4 MVA synchronous machine based DG
source integrated at bus 2 in the suburban distribution system with a three phase fault
applied at bus 4.
Similar to Section 4.3.1, Analysis of Figure 4.16 demonstrates that the introduction of the
R, L and resonant type FCL’s into the system presented in Figure 4.13 yields 0.4%, 0.9% and 1.4%
differences in fault current when compared to that of the original short circuit characteristic, an
improvement from the 10% difference experienced without the presence of FCL’s. As depicted in
Figure 4.16, the short circuit current experienced by the lateral load fuse at bus 4 with synchronous
machine based DG source integration with FCL installation decreases to 3857 A, 3904 A, and
3921 A for the resistive (60 Ω), inductive (0.16 H) and resonant type FCLs respectively, when
compared to the 4245 A experienced without FCL connection. As shown in APPENDIX B, for
the base suburban distribution system (no DG), the short circuit current experienced by the lateral
fuse at bus 4 for a three phase fault condition is 3869 A. Comparison highlights that FCL
integration reduces the discrepancy between initial non DG integrated short circuit characteristics
from 10% to less than 1% for the inductive and resistive FCL types and 1.4% for the resonant.
3600
3800
4000
4200
4400
4600
4800
Feeder Fault
Fau
lt c
urr
ent
(A)
No FCL FCL_R FCL_L FCL_LC No FCL/DG

90
In contrast, the short circuit current experienced by the head end recloser changes to 3911
A, 3904 A, and 3894 A for the resistive (60 Ω), inductive (0.16 H) and resonant type FCLs
respectively when compared to 3826 A experienced without FCL connection. As shown in
APPENDIX B, for the base suburban distribution system (no DG), the short circuit current
experienced by the head end recloser for a three phase fault condition at bus 4 is 3917 A.
Consequently, through the utilization of the coordination chart presented in Figure 2.8, it
is apparent that the synchronous machine based DG integrated suburban distribution system with
FCL connection, yields a recloser operating time (fast curve) of 0.029 seconds for each of the FCL
types. In contrast, the lateral fuse protecting the bus 4 load will operate in 0.0318, 0.0314, and
0.0313 seconds respectively, hence the head end recloser will operate before the fuse, resulting in
the revalidation of the fuse-saving scheme initially employed. Comparison to the original suburban
distribution system bus 4 coordination path demonstrates that for initial short circuit characteristics
for a three phase fault at bus 4, the fuse operates in 0.0316 seconds and head end recloser in 0.029
seconds. Observations show that the discrepancy between the original coordination and FCL
installed synchronous machine based DG integrated system is less than 1% and original fuse-
saving schemes are still valid. Considering that the three phase fault is the most severe [10], it is
apparent that FCL utilization is effective at mitigation of DG influences on fuse-recloser
coordination. It should also be noted that no synchronous machine based DG penetration level was
found that caused loss of fuse-recloser coordination.
4.3.3 Bus 4 DG Connection
The case study presented in Section 3.2.2.3 demonstrates the effect of synchronous
machine based DG integration at bus 4 on fuse-recloser coordination for the suburban distribution
system. The most severe effects of synchronous machine based DG integration on fuse-recloser
coordination in the system occurs for three phase faults at bus 4. An 8.4 MVA synchronous
machine based DG source was connected at bus 4 with each of the FCL types, as depicted in Figure
4.17.

91
Figure 4.17: Suburban distribution system with DG integration at bus 4 with FCL presence.
A three phase fault is applied to the bus 4 load. The time-domain short circuit currents
experienced by the bus 4 fuse and head end-recloser for each FCL type is presented in Figures
4.18 and 4.19 with a summary presented in Figure 4.20.
5 MVA 3 km
5 MVA
Bus 3
3 km
Bus 2
2.1 MVA,
0.9 p.f. lag.
residential
load
Fuse
Fuse
Fuse
2.1 MVA,
0.9 p.f. lag.
residential
load
1 km
1 km
Breaker and
recloser
Tie-
breaker
2 Ω reactor
M
100 MVA 100 MVA
25 kV
230 kV
1 km
1 km
Bus 1
∞
Bus 5
Bus 4
1 km
1 km
Utility
C1 C
1
C1 = 20 MVAR
P + j Q
6 remaining
feeders, 100
MVA, p.f. 0.95
lag.
P + j Q 5 remaining feeders,
84 MVA, p.f. 0.95
lag.
1 MVA,
0.9 p.f. lag.
industrial
load
1 MVA, 0.9
p.f. lag.
commercial
load
Fuse
Vin
= 1.041
DG
1 km

92
Figure 4.18: Time-domain RMS fault current simulation for a three phase fault applied at bus 4 with 8.4 MVA
DG integration at bus 4 in the presence of a varying FCL types.
Figure 4.19: Time-domain RMS recloser current simulation for a three phase fault applied at bus 4 with 8.4 MVA
DG integration at bus 4 in the presence of varying FCL types.
0
1000
2000
3000
4000
5000
6000
8.95 8.97 8.99 9.01 9.03 9.05 9.07 9.09
Cu
rren
t (A
)
Time (s)
R 60ohmL 0.16HResonantNo DGNo FCL
0
1000
2000
3000
4000
5000
6000
8.95 8.97 8.99 9.01 9.03 9.05 9.07 9.09
Cu
rren
t (A
)
Time (s)
R 60ohm
L 0.16H
Resonant
No DG
No FCL

93
Figure 4.20: Summary of short circuit currents with an 8.4 MVA synchronous machine based DG
source integrated at bus 4 in the suburban distribution system with a three phase fault
applied at bus 4.
Similar to Section 4.3.2, analysis of Figure 4.20 demonstrates that the introduction of the
R, L and resonant type FCL’s into the system presented in Figure 4.17 yields 0.1%, 1.5% and 2.2%
difference in fault current when compared to that of the original short circuit characteristic, an
improvement from the 14% difference experienced without the presence of FCL’s. As depicted in
Figure 4.20, the short circuit current experienced by the lateral load fuse at bus 4 with synchronous
machine based DG source integration with FCL installation decreases to 3864 A, 3924 A, and
3953 A for the resistive (60 Ω), inductive (0.16 H) and resonant type FCLs respectively, when
compared to the 4415 A experienced without FCL connection. As shown in APPENDIX B, for
the base suburban distribution system (no DG), the short circuit current experienced by the lateral
fuse at bus 4 for a three phase fault condition is 3869 A.
3600
3800
4000
4200
4400
4600
4800
Feeder Fault
Fau
lt c
urr
ent
(A)
No FCL FCL_R FCL_L FCL_LC No FCL/DG

94
In contrast, the short circuit current experienced by the head end recloser remains
unchanged, consistent with findings presented in Section 3.3.2. As shown in APPENDIX B, for
the base suburban distribution system (no DG), the short circuit current experienced by the head
end recloser for a three phase fault condition at bus 4 is 3917 A.
Consequently, through the utilization of the coordination chart presented in Figure 2.8, it
is apparent that the synchronous machine based DG integrated suburban distribution system with
FCL connection, yields a recloser operating time (fast curve) of 0.029 seconds for each of the FCL
types. In contrast, the lateral fuse protecting the bus 4 load will operate in 0.0318, 0.0313, and
0.0308 seconds respectively, hence the head end recloser will operate before the fuse resulting in
the fuse-saving scheme initially employed being revalidated. Comparison to the original suburban
distribution system bus 4 coordination path demonstrates that for initial short circuit characteristics
for a three phase fault at bus 4, the fuse operates in 0.0316 seconds and head end recloser in 0.029
seconds. Observations shows that the discrepancy between the original coordination and FCL
installed synchronous machine based DG integrated system is less than 1% for the resistive and
inductive types and 3.5% for the resonant type. Considering that the three phase fault is the most
severe [10], it is apparent that FCL utilization is effective at mitigation of DG influences on fuse-
recloser coordination. It should also be noted that no synchronous machine based DG penetration
level was found that caused loss of fuse-recloser coordination.
4.3.4 Bus 5 DG Connection
The case study presented in Section 3.2.2.4 demonstrates the effect of synchronous
machine based DG integration at bus 5 on fuse-recloser coordination for the suburban distribution
system. The most severe effects of synchronous machine based DG integration on fuse-recloser
coordination in the system occurs for three phase faults at bus 4. An 8.4 MVA synchronous
machine based DG source was connected at bus 4 with each of the FCL types as depicted in Figure
4.21.
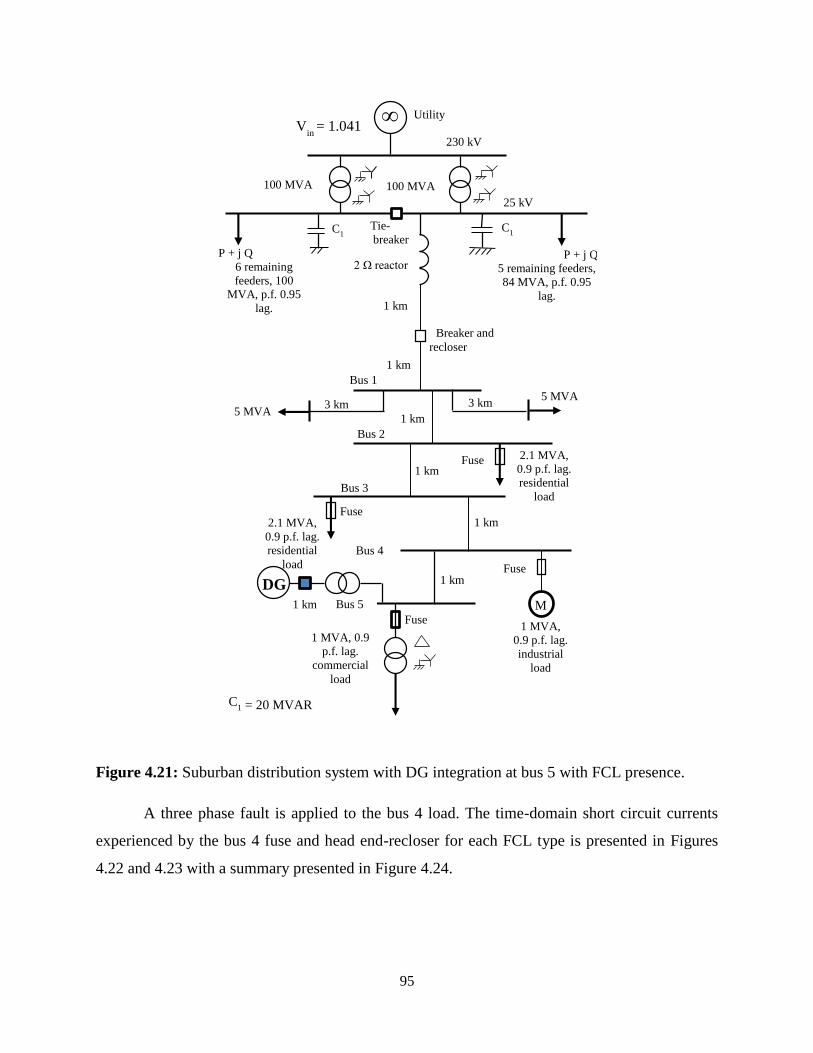
95
Figure 4.21: Suburban distribution system with DG integration at bus 5 with FCL presence.
A three phase fault is applied to the bus 4 load. The time-domain short circuit currents
experienced by the bus 4 fuse and head end-recloser for each FCL type is presented in Figures
4.22 and 4.23 with a summary presented in Figure 4.24.
5 MVA 3 km
5 MVA
Bus 3
3 km
Bus 2
2.1 MVA,
0.9 p.f. lag.
residential
load
Fuse
Fuse
Fuse
2.1 MVA,
0.9 p.f. lag.
residential
load
1 km
1 km
Breaker and
recloser
Tie-
breaker
2 Ω reactor
M
100 MVA 100 MVA
25 kV
230 kV
1 km
1 km
Bus 1
∞
Bus 5
Bus 4
1 km
1 km
Utility
C1 C
1
C1 = 20 MVAR
P + j Q
6 remaining
feeders, 100
MVA, p.f. 0.95
lag.
P + j Q 5 remaining feeders,
84 MVA, p.f. 0.95
lag.
1 MVA,
0.9 p.f. lag.
industrial
load
1 MVA, 0.9
p.f. lag.
commercial
load
Fuse
Vin
= 1.041
DG
1 km
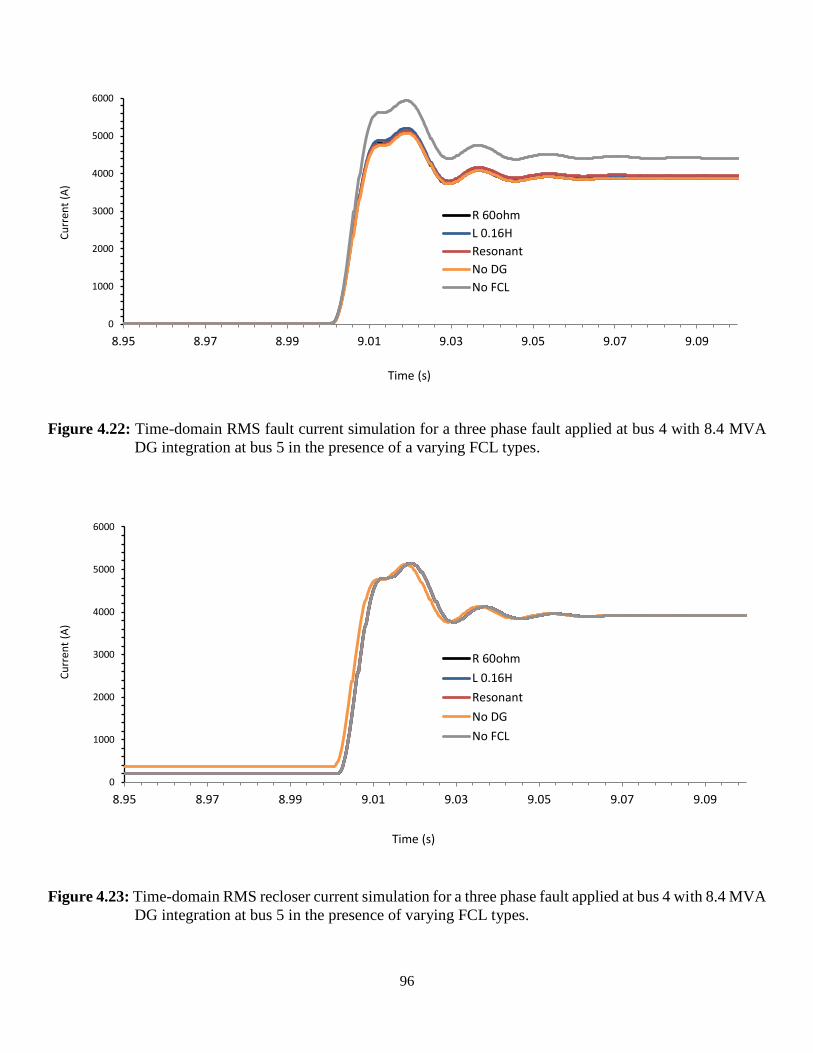
96
Figure 4.22: Time-domain RMS fault current simulation for a three phase fault applied at bus 4 with 8.4 MVA
DG integration at bus 5 in the presence of a varying FCL types.
Figure 4.23: Time-domain RMS recloser current simulation for a three phase fault applied at bus 4 with 8.4 MVA
DG integration at bus 5 in the presence of varying FCL types.
0
1000
2000
3000
4000
5000
6000
8.95 8.97 8.99 9.01 9.03 9.05 9.07 9.09
Cu
rren
t (A
)
Time (s)
R 60ohm
L 0.16H
Resonant
No DG
No FCL
0
1000
2000
3000
4000
5000
6000
8.95 8.97 8.99 9.01 9.03 9.05 9.07 9.09
Cu
rren
t (A
)
Time (s)
R 60ohm
L 0.16H
Resonant
No DG
No FCL

97
Figure 4.24: Summary of short circuit currents with an 8.4 MVA synchronous machine based DG
source integrated at bus 5 in the suburban distribution system with a three phase fault
applied at bus 4.
Similar to Section 4.3.3, analysis of Figure 4.24 demonstrates that the introduction of the
R, L and resonant type FCL’s into the system presented in Figure 4.21 yields 0.1%, 1.5% and 2.2%
differences in fault current when compared to that of the original short circuit characteristic, an
improvement from the 14% difference experienced without the presence of FCL’s. As depicted in
Figure 4.24, the short circuit current experienced by the lateral load fuse at bus 4 with synchronous
machine based DG source integration with FCL installation decreases to 3871 A, 3931 A, and
3958 A for the resistive (60 Ω), inductive (0.16H) and resonant type FCLs respectively when
compared to the 4430 A experienced without FCL connection. As shown in APPENDIX B, for
the base suburban distribution system (no DG), the short circuit current experienced by the lateral
fuse at bus 4 for a three phase fault condition is 3873 A.
In contrast, the short circuit current experienced by the head end recloser remains
unchanged, consistent with findings presented in Section 3.3.2. As shown in APPENDIX B, for
3600
3800
4000
4200
4400
4600
4800
Feeder Fault
Fau
lt c
urr
ent
(A)
No FCL FCL_R FCL_L FCL_LC No FCL/DG

98
the base suburban distribution system (no DG), the short circuit current experienced by the head
end recloser for a three phase fault condition at bus 4 is 3917 A.
Consequently, through the utilization of the coordination chart presented in Figure 2.8, it
is apparent that the synchronous machine based DG integrated suburban distribution system with
FCL connection, yields a recloser operating time (fast curve) of 0.029 seconds for each of the FCL
types. In contrast, the lateral fuse protecting the bus 4 load will operate in 0.0316, 0.0312, and
0.0307 seconds respectively, hence the head end recloser will operate before the fuse resulting in
revalidation of the fuse-saving scheme initially employed. Comparison to the original suburban
distribution system bus 4 coordination path demonstrates that for initial short circuit characteristics
for a three phase fault at bus 4, the fuse operates in 0.0316 seconds and head end recloser in 0.029
seconds. Considering that the three phase fault is the most severe [10], it is apparent that FCL
utilization is effective at mitigation of DG influences on fuse-recloser coordination. It should also
be noted that no synchronous machine based DG penetration level was found that caused loss of
fuse-recloser coordination.
4.3.5 DG Connection Summary
Comparison of results from Section 4.3 makes it apparent that the utilization of
superconducting FCLs of resistive, inductive and resonant types are effective at mitigation of
synchronous machine based DG influences on existing system fuse-recloser protection
coordination. Increasing the impedance of the resistive and inductive type FCLs yields more
efficient mitigation capabilities. Analysis of Figures 4.6, 4.16, 4.20 and 4.24 makes it apparent
that the resistive type FCL is consistently effective, with discrepancies between non-DG and FCL
DG integrated short circuit characteristics being limited to less than 1% for each connection point.
Furthermore, it is apparent that the resonant and inductive type FCLs become less effective for
DG connections closer to the fault location, however they are still able to restore original
coordination schemes.

99
4.4 The use of FCLs for the Mitigation of Synchronous Machine Based DG Influences
on Recloser Sensitivity
As demonstrated in Section 3.3, for the suburban distribution system given in Figure 2.1,
the lowest short circuit current experienced by the network is a line to line fault at the bus 5 load
corresponding to the coordination path in Figure 2.6. For this coordination path the recloser pick
up current is 560 A. In order to determine the effectiveness of each type of FCL in mitigating the
effect of synchronous machine based DG sources on existing system recloser sensitivity, the
algorithm presented in Figure 3.13 is utilized.
4.4.1 Bus 1 DG Connection
The case study presented in Section 3.3.2.1 demonstrates the effect of synchronous
machine based DG integration at bus 1 on recloser sensitivity for the suburban distribution system.
An 8.4 MVA and 55.6 MVA synchronous machine based DG source was connected at bus 1 (each
connected for separate tests) with each of the FCL types as depicted in Figure 4.2. A line to line
fault is applied to the bus 5 load. The time-domain short circuit currents experienced by the head
end-recloser for each DG size and FCL type is presented in Figures 4.25 and 4.26 with a summary
presented in Figure 4.27.
Figure 4.25: Time-domain recloser RMS current simulation for a line to line fault applied at the
bus 5 load with an 8.4 MVA synchronous machine based DG source integrated at
bus 1 with FCL presence.
0
100
200
300
400
500
600
700
800
900
1000
8.95 8.97 8.99 9.01 9.03 9.05 9.07 9.09
Cu
rren
t (A
)
Time (s)
R 60ohmL 0.16HResonantNo DGNo FCL

100
Figure 4.26: Time-domain recloser RMS current simulation for a line to line fault applied at the
bus 5 load with a 55.6 MVA synchronous machine based DG source integrated at
bus 1 with FCL presence.
Figure 4.27: Summary of recloser short circuit currents with an 8.4 MVA and 55.6 MVA
synchronous machine based DG source integrated at bus 1 in the suburban
distribution system with a line to line fault applied at the bus 5 load with FCL
presence.
0
100
200
300
400
500
600
700
800
900
1000
8.95 8.97 8.99 9.01 9.03 9.05 9.07 9.09
Cu
rren
t (A
)
Time (s)
R 60ohm
L 0.16H
Resonant
No DG
No FCL
0
100
200
300
400
500
600
700
800
900
1000
8.4MVA 55.6MVA
Fau
lt c
urr
ent
(A)
No FCL FCL_R FCL_L

101
Observation of Figures 4.25 and 4.26 in conjunction with Figure 4.27 makes it apparent
that each FCL type is successfully able to mitigate synchronous machine based DG influences for
increasing levels of penetration. In the case of the 55.6 MVA DG source, the discrepancy between
the original suburban distribution system short circuit behavior and the DG integrated network
improves from 34% to 0.2%, 1.3% and 5.7% for the resistive, inductive and resonant FCL type
respectively. It should also be noted that no synchronous machine based DG penetration level was
found that caused loss of fuse-recloser coordination.
As mentioned in Section 4.3.1, in commercial applications there are a wide variety of
resistive and inductive type FCLs of varying magnitude of resistances and inductances. In order to
reflect results consistent with varying resistive values, the resistive and inductive type FCLs in the
system presented in Figure 4.2 are varied in magnitude. Figures 4.28, 4.29, 4.30 and 4.31 show the
time domain simulations. Figures 4.32 and 4.33 show a summary for each FCL type for a line to
line fault at the bus 5 load for the 8.4 MVA and 55.6 MVA synchronous machine based DG
integrated suburban distribution system with the R and L type FCL’s values being varied between
20 Ω - 60 Ω and 0.05 H - 0.16 H respectively.
Figure 4.28: Time-domain recloser RMS current simulation for a line to line fault applied at the
bus 5 load with an 8.4 MVA synchronous machine based DG source integrated at
bus 1 with varying resistive FCL impedance.
0
100
200
300
400
500
600
700
800
900
1000
8.95 8.97 8.99 9.01 9.03 9.05 9.07 9.09
Cu
rren
t (A
)
Time (s)
R 60ohmR 50ohmR 20ohmNo DGNo FCL

102
Figure 4.29: Time-domain recloser RMS current simulation for a line to line fault applied at the
bus 5 load with a 55.6 MVA synchronous machine based DG source integrated at
bus 1 with varying resistive FCL impedance.
Figure 4.30: Time-domain recloser RMS current simulation for a line to line fault applied at the
bus 5 load with an 8.4 MVA synchronous machine based DG source integrated at
bus 1 with varying inductive FCL impedance.
0
100
200
300
400
500
600
700
800
900
1000
8.95 8.97 8.99 9.01 9.03 9.05 9.07 9.09
Cu
rren
t (A
)
Time (s)
R 60ohm
R 50ohm
R 20ohm
No DG
No FCL
0
100
200
300
400
500
600
700
800
900
1000
8.95 8.97 8.99 9.01 9.03 9.05 9.07 9.09
Cu
rren
t (A
)
Time (s)
L 0.16H
L 0.13H
L 0.05H
No DG
No FCL

103
Figure 4.31: Time-domain recloser RMS current simulation for a line to line fault applied at the
bus 5 load with a 55.6 MVA synchronous machine based DG source integrated at
bus 1 with varying inductive FCL impedance.
Figure 4.32: Summary of recloser short circuit currents with an 8.4 MVA and 55.6 MVA
synchronous machine based DG source integrated at bus 1 in the suburban
distribution system with a line to line fault applied at the bus 5 load with varying
resistive FCL impedance.
0
100
200
300
400
500
600
700
800
900
1000
8.95 8.97 8.99 9.01 9.03 9.05 9.07 9.09
Cu
rren
t (A
)
Time (s)
L 0.16H
L 0.13H
L 0.05H
No DG
No FCL
0
100
200
300
400
500
600
700
800
900
1000
8.4MVA 55.6MVA
Fau
lt c
urr
ent
(A)
No FCL FCL_R=60ohm FCL_R=50ohm

104
Figure 4.33: Summary of recloser short circuit currents with an 8.4 MVA and 55.6 MVA
synchronous machine based DG source integrated at bus 1 in the suburban
distribution system with a line to line fault applied at the bus 5 load with varying
inductive FCL impedance.
Observation of Figure 4.32 in conjunction with Figure 4.33 confirms the hypothesis
presented in Section 4.3.1, as it is apparent that lowering the impedance of the resistive and
inductive FCL is detrimental to the effectiveness of the FCL in mitigation of synchronous machine
based DG influences on recloser sensitivity. In both cases, for the 55.6 MVA DG the discrepancy
between original system short circuit characteristics and the DG integrated decreases from 0.2%
to 1.1% and 1.3% to 4.9% for the resistive and inductive type FCL respectively.
4.4.2 Bus 2 DG Connection
The case study presented in Section 3.3.2.2 demonstrates the effect of synchronous
machine based DG integration at bus 2 on recloser sensitivity for the suburban distribution system.
An 8.4 MVA and 55.5 MVA synchronous machine based DG source is connected at bus 2 (each
connected for separate tests) with each of the FCL types as depicted in Figure 4.13. A line to line
fault is applied to the bus 5 load. The time-domain short circuit currents experienced by the head
end-recloser for each DG size and FCL type are presented in Figures 4.34 and 4.35 with a summary
presented in Figure 4.36.
0
100
200
300
400
500
600
700
800
900
1000
8.4MVA 55.6MVA
Fau
lt c
urr
ent
(A)
No FCL FCL_L=0.16H FCL_L=0.13H

105
Figure 4.34: Time-domain recloser RMS current simulation for a line to line fault applied at the
bus 5 load with an 8.4 MVA synchronous machine based DG source integrated at
bus 2 with FCL presence.
Figure 4.35: Time-domain recloser RMS current simulation for a line to line fault applied at the
bus 5 load with a 55.5 MVA synchronous machine based DG source integrated at
bus 2 with FCL presence.
0
100
200
300
400
500
600
700
800
900
1000
8.95 8.97 8.99 9.01 9.03 9.05 9.07 9.09
Cu
rren
t (A
)
Time (s)
R 60ohm
L 0.16H
Resonant
No DG
No FCL
0
200
400
600
800
1000
1200
8.95 8.97 8.99 9.01 9.03 9.05 9.07 9.09
Cu
rren
t (A
)
Time (s)
R 60ohm
L 0.16H
Resonant
No DG
No FCL

106
Figure 4.36: Summary of recloser short circuit currents with an 8.4 MVA and 55.5 MVA
synchronous machine based DG source integrated at bus 2 in the suburban
distribution system with a line to line fault applied at the bus 5 load with FCL
presence.
Observation of Figures 4.34 and 4.35 in conjunction with Figure 4.36 makes it apparent
that each FCL type is successfully able to mitigate synchronous machine based DG influences for
increasing levels of penetration. In the case of the 55.5 MVA DG source, the discrepancy between
the original suburban distribution system short circuit behavior and the DG integrated network
improves from 34% to 0.2%, 1.4% and 6.1% for the resistive, inductive and resonant FCL type
respectively. It should also be noted that no synchronous machine based DG penetration level was
found that caused loss of fuse-recloser coordination.
4.4.3 Bus 4 DG Connection
The case study presented in Section 3.3.2.3 demonstrates the effect of synchronous
machine based DG integration at bus 4 on recloser sensitivity for the suburban distribution system.
An 8.4 MVA and 50.5 MVA synchronous machine based DG source is connected at bus 4 (each
connected for separate tests) with each of the FCL types, as depicted in Figure 4.17. A line to line
fault is applied to the bus 5 load. The time-domain short circuit currents experienced by the head
end-recloser for each DG size and FCL type is presented in Figures 4.37 and 4.38 with a summary
presented in Figure 4.39.
0
100
200
300
400
500
600
700
800
900
1000
8.4MVA 55.5MVA
Fau
lt c
urr
ent
(A)
No FCL FCL_R FCL_L

107
Figure 4.37: Time-domain recloser RMS current simulation for a line to line fault applied at the
bus 5 load with an 8.4 MVA synchronous machine based DG source integrated at
bus 4 with FCL presence.
Figure 4.38: Time-domain recloser RMS current simulation for a line to line fault applied at the
bus 5 load with a 50.5 MVA synchronous machine based DG source integrated at
bus 4 with FCL presence.
0
100
200
300
400
500
600
700
800
900
1000
8.95 8.97 8.99 9.01 9.03 9.05 9.07 9.09
Cu
rren
t (A
)
Time (s)
R 60ohmL 0.16HResonantNo DGNo FCL
0
200
400
600
800
1000
1200
8.95 8.97 8.99 9.01 9.03 9.05 9.07 9.09
Cu
rren
t (A
)
Time (s)
R 60ohm
L 0.16H
Resonant
No DG
No FCL

108
Figure 4.39: Summary of recloser short circuit currents with an 8.4 MVA and 50.5 MVA
synchronous machine based DG source integrated at bus 1 in the suburban
distribution system with a line to line fault applied at the bus 5 load with FCL
presence.
Observation of Figures 4.37 and 4.38 in conjunction with Figure 4.39 makes it apparent
that each FCL type is successfully able to mitigate synchronous machine based DG influences for
increasing levels of penetration. In the case of the 50.5 MVA DG source, the discrepancy between
the original suburban distribution system short circuit behavior and the DG integrated network
improves from 35% to 0.3%, 1.5% and 6.5% for the resistive, inductive and resonant FCL types
respectively. It should also be noted that no synchronous machine based DG penetration level was
found that caused loss of fuse-recloser coordination.
4.4.4 Bus 5 DG Connection
The case study presented in Section 3.3.2.4 demonstrates the effect of synchronous
machine based DG integration at bus 5 on recloser sensitivity for the suburban distribution system.
An 8.4 MVA and 48.8 MVA synchronous machine based DG source is connected at bus 5 (each
connected for separate tests) with each of the FCL types as depicted in Figure 4.21. A line to line
fault is applied to the bus 5 load. The time-domain short circuit currents experienced by the head
end-recloser for each DG size and FCL type is presented in Figures 4.40 and 4.41, with a summary
presented in Figure 4.42.
0
100
200
300
400
500
600
700
800
900
1000
8.4MVA 50.5MVA
Fau
lt c
urr
ent
(A)
No FCL FCL_R FCL_L

109
Figure 4.40: Time-domain recloser RMS current simulation for a line to line fault applied at the
bus 5 load with an 8.4 MVA synchronous machine based DG source integrated at
bus 5 with FCL presence.
Figure 4.41: Time-domain recloser RMS current simulation for a line to line fault applied at the
bus 5 load with a 48.8 MVA synchronous machine based DG source integrated at
bus 5 with FCL presence.
0
100
200
300
400
500
600
700
800
900
1000
8.95 8.97 8.99 9.01 9.03 9.05 9.07 9.09
Cu
rren
t (A
)
Time (s)
R 60ohmL 0.16HResonantNo DGNo FCL
0
200
400
600
800
1000
1200
8.95 8.97 8.99 9.01 9.03 9.05 9.07 9.09
Cu
rren
t (A
)
Time (s)
R 60ohmL 0.16HResonantNo DGNo FCL

110
Figure 4.42: Summary of recloser short circuit currents with an 8.4 MVA and 48.8 MVA
synchronous machine based DG source integrated at bus 5 in the suburban
distribution system with a line to line fault applied at the bus 5 load with FCL
presence.
Observation of Figures 4.40 and 4.41 in conjunction with Figure 4.42 makes it apparent
that each FCL type is successfully able to mitigate synchronous machine based DG influences for
increasing levels of penetration. In the case of the 48.8 MVA DG source, the discrepancy between
the original suburban distribution system short circuit behavior and the DG integrated network
improves from 35% to 0.4%, 1.6% and 6.6% for the resistive, inductive and resonant FCL type
respectively. It should also be noted that no synchronous machine based DG penetration level was
found that caused loss of fuse-recloser coordination.
4.4.5 DG Connection Summary
Observation of results obtained in Section 4.4 makes it apparent that the utilization of
superconducting FCLs of resistive, inductive and resonant types are effective at mitigation of
synchronous machine based DG influences on existing system recloser protection sensitivity, even
at DG penetration levels as high as 300% load demand. Resistive type FCL’s are consistently
effective with discrepancies between non-DG and FCL DG integrated short circuit characteristics
being limited to less than 1% for each connection point. Furthermore, it is apparent that the
resonant and inductive type FCLs become less effective for DG connections closer to the fault
location, however, they are still able to restore recloser sensitivity at high penetration levels.
0
100
200
300
400
500
600
700
800
900
1000
8.4MVA 48.8MVA
Fau
lt c
urr
ent
(A)
No FCL FCL_R FCL_L

111
4.5 The use of FCLs for the Mitigation of Synchronous Machine Based DG Influences
on Recloser Bi-Directionality
As demonstrated in Section 3.4, for the suburban distribution system given in Figure 2.1,
the lowest level of synchronous machine based DG penetration required for bi-directional recloser
behavior occurs for a line to line to ground fault on an adjacent feeder. For bi-directional current
to cause main feeder recloser nuisance tripping, the short circuit level experienced by the recloser
needs to exceed 624 A for the grounded fault condition. In order to determine the effectiveness of
each type of FCL in mitigating the effect of synchronous machine based DG sources on existing
system recloser bi-directionality, the algorithm presented in Figure 3.20 is utilized.
4.5.1 Bus 1 DG Connection
The case study presented in Section 3.4.2.1 demonstrates the effect of synchronous
machine based DG integration at bus 1 on recloser bi-directionality for the suburban distribution
system. 4.7 MVA and 8.4 MVA synchronous machine based DG sources are connected at bus 1
(each connected for separate tests) with each of the FCL types as depicted in Figure 4.2. A line to
line to ground fault is applied to the double load feeder specified in Section 3.4.2.1. The time-
domain short circuit currents experienced by the head end-recloser for each DG size and FCL type
is presented in Figures 4.43 and 4.44 with a summary presented in Figure 4.45.
Figure 4.43: Time-domain recloser RMS current simulation for a line to line to ground fault
applied at the double load adjacent feeder with a 4.7 MVA synchronous machine
based DG source integrated at bus 1 with FCL presence.
0
100
200
300
400
500
600
700
800
8.95 8.97 8.99 9.01 9.03 9.05 9.07 9.09
Cu
rren
t (A
)
Time (s)
R 60ohm
L 0.16H
Resonant
No FCL

112
Figure 4.44: Time-domain recloser RMS current simulation for a line to line to ground fault
applied at the double load adjacent feeder with a 8.4 MVA synchronous machine
based DG source integrated at bus 1 with FCL presence.
Figure 4.45: Summary of recloser short circuit currents with a 4.7 MVA and 8.4 MVA
synchronous machine based DG source integrated at bus 1 in the suburban
distribution system with a line to line to ground fault applied at double load adjacent
feeder with FCL presence.
0
200
400
600
800
1000
1200
8.95 8.97 8.99 9.01 9.03 9.05 9.07 9.09
Cu
rren
t (A
)
Time (s)
R 60ohm
L 0.16H
Resonant
No FCL
0
100
200
300
400
500
600
700
800
900
1000
8.4MVA 4.7MVA
Fau
lt c
urr
ent
(A)
No FCL FCL_R FCL_L FCL_LC
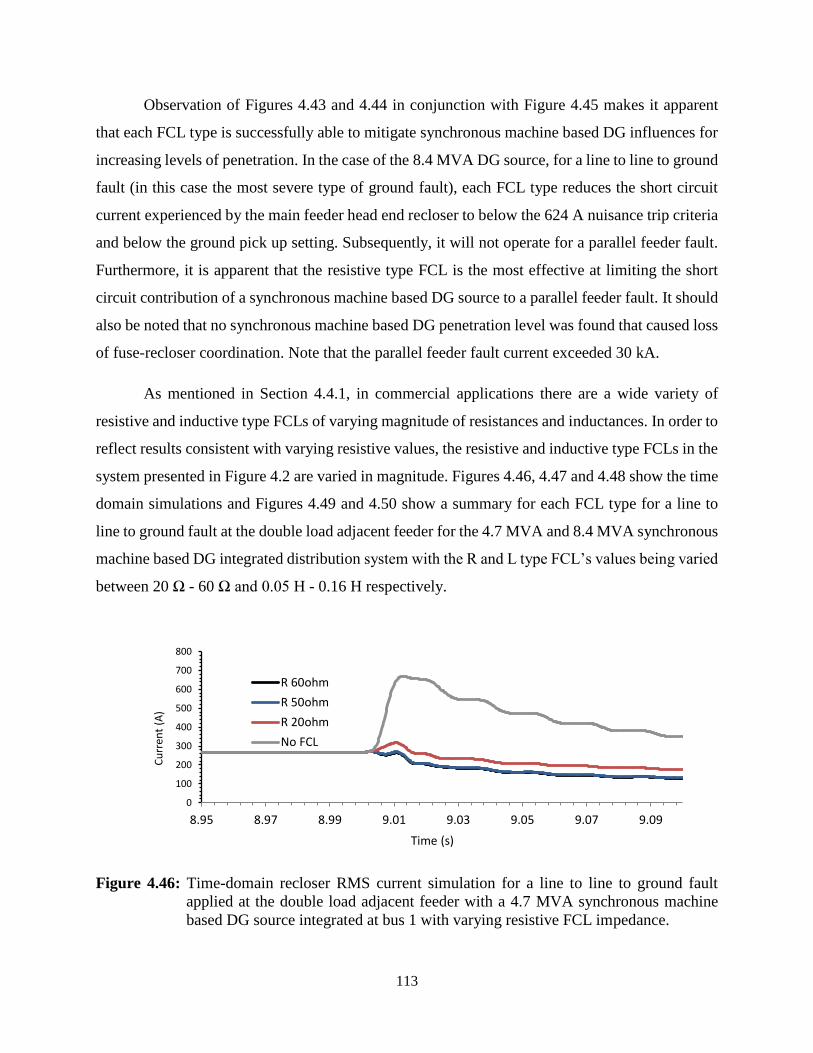
113
Observation of Figures 4.43 and 4.44 in conjunction with Figure 4.45 makes it apparent
that each FCL type is successfully able to mitigate synchronous machine based DG influences for
increasing levels of penetration. In the case of the 8.4 MVA DG source, for a line to line to ground
fault (in this case the most severe type of ground fault), each FCL type reduces the short circuit
current experienced by the main feeder head end recloser to below the 624 A nuisance trip criteria
and below the ground pick up setting. Subsequently, it will not operate for a parallel feeder fault.
Furthermore, it is apparent that the resistive type FCL is the most effective at limiting the short
circuit contribution of a synchronous machine based DG source to a parallel feeder fault. It should
also be noted that no synchronous machine based DG penetration level was found that caused loss
of fuse-recloser coordination. Note that the parallel feeder fault current exceeded 30 kA.
As mentioned in Section 4.4.1, in commercial applications there are a wide variety of
resistive and inductive type FCLs of varying magnitude of resistances and inductances. In order to
reflect results consistent with varying resistive values, the resistive and inductive type FCLs in the
system presented in Figure 4.2 are varied in magnitude. Figures 4.46, 4.47 and 4.48 show the time
domain simulations and Figures 4.49 and 4.50 show a summary for each FCL type for a line to
line to ground fault at the double load adjacent feeder for the 4.7 MVA and 8.4 MVA synchronous
machine based DG integrated distribution system with the R and L type FCL’s values being varied
between 20 Ω - 60 Ω and 0.05 H - 0.16 H respectively.
Figure 4.46: Time-domain recloser RMS current simulation for a line to line to ground fault
applied at the double load adjacent feeder with a 4.7 MVA synchronous machine
based DG source integrated at bus 1 with varying resistive FCL impedance.
0
100
200
300
400
500
600
700
800
8.95 8.97 8.99 9.01 9.03 9.05 9.07 9.09
Cu
rren
t (A
)
Time (s)
R 60ohm
R 50ohm
R 20ohm
No FCL

114
Figure 4.47: Time-domain recloser RMS current simulation for a line to line to ground fault
applied at the double load adjacent feeder with a 8.4 MVA synchronous machine
based DG source integrated at bus 1 with varying resistive FCL impedance.
Figure 4.48: Time-domain recloser RMS current simulation for a line to line to ground fault
applied at the double load adjacent feeder with a 4.7 MVA synchronous machine
based DG source integrated at bus 1 with varying inductive FCL impedance.
0
200
400
600
800
1000
1200
8.95 8.97 8.99 9.01 9.03 9.05 9.07 9.09
Cu
rren
t (A
)
Time (s)
R 60ohmR 50ohmR 20ohmNo FCL
0
100
200
300
400
500
600
700
800
8.95 8.97 8.99 9.01 9.03 9.05 9.07 9.09
Cu
rren
t (A
)
Time (s)
L 0.16HL 0.13HL 0.05HNo FCL

115
Figure 4.49: Time-domain recloser RMS current simulation for a line to line to ground fault
applied at the double load adjacent feeder with a 8.4 MVA synchronous machine
based DG source integrated at bus 1 with varying inductive FCL impedance.
Figure 4.50: Summary of recloser short circuit currents with a 4.7 MVA and 8.4 MVA
synchronous machine based DG source integrated at bus 1 in the suburban
distribution system with a line to line to ground fault applied at double load adjacent
feeder with varying resistive FCL impedance.
0
200
400
600
800
1000
1200
8.95 8.97 8.99 9.01 9.03 9.05 9.07 9.09
Cu
rren
t (A
)
Time (s)
L 0.16HL 0.13HL 0.05HNo FCL
0
100
200
300
400
500
600
700
800
900
1000
8.4MVA 4.7MVA
Fau
lt c
urr
ent
(A)
No FCL FCL_R=60ohm
FCL_R=50ohm FCL_R=20ohm

116
Figure 4.51: Summary of recloser short circuit currents with a 4.7 MVA and 8.4 MVA
synchronous machine based DG source integrated at bus 1 in the suburban
distribution system with a line to line to ground fault applied at double load adjacent
feeder with varying inductive FCL impedance.
Observation of Figure 4.50 in conjunction with Figure 4.51 confirms the hypothesis
presented in Section 4.4.1 as it is apparent that lowering the impedance of the resistive and
inductive FCL is detrimental in the effectiveness of the FCL in mitigation of synchronous machine
based DG influences on recloser bi-directionality. In both cases, for lower impedance values the
short circuit current contribution from the synchronous machine based DG source increased to
levels where the recloser was able to detect the fault condition.
4.5.2 Bus 2 DG Connection
The case study presented in Section 3.4.2.2 demonstrates the effect of synchronous
machine based DG integration at bus 2 on recloser bi-directionality for the suburban distribution
system. A 5 MVA and 8.4 MVA synchronous machine based DG source is connected at bus 2
(each connected for separate tests) with each of the FCL types as depicted in Figure 4.13. A line
to line to ground fault is applied to the double load feeder specified in Section 3.4.2.2. The time-
domain short circuit currents experienced by the head end-recloser for each DG size and FCL type
is presented in Figures 4.53 and 4.54 with a summary presented in Figure 4.55.
0
100
200
300
400
500
600
700
800
900
1000
8.4MVA 4.7MVA
Fau
lt c
urr
ent
(A)
No FCL
FCL_L=0.16H

117
Figure 4.52: Time-domain recloser RMS current simulation for a line to line to ground fault
applied at the double load adjacent feeder with a 5 MVA synchronous machine
based DG source integrated at bus 2 with FCL presence.
Figure 4.53: Time-domain recloser RMS current simulation for a line to line to ground fault
applied at the double load adjacent feeder with a 5 MVA synchronous machine
based DG source integrated at bus 2 with FCL presence.
0
100
200
300
400
500
600
700
800
8.95 8.97 8.99 9.01 9.03 9.05 9.07 9.09
Cu
rren
t (A
)
Time (s)
R 60ohmL 0.16HResonantNo FCL
0
100
200
300
400
500
600
700
800
8.95 8.97 8.99 9.01 9.03 9.05 9.07 9.09
Cu
rren
t (A
)
Time (s)
R 60ohm
L 0.16H
Resonant
No FCL

118
Figure 4.54: Time-domain recloser RMS current simulation for a line to line to ground fault
applied at the double load adjacent feeder with a 8.4 MVA synchronous machine
based DG source integrated at bus 2 with FCL presence.
Figure 4.55: Summary of recloser short circuit currents with a 5 MVA and 8.4 MVA synchronous
machine based DG source integrated at bus 2 in the suburban distribution system
with a line to line to ground fault applied at double load adjacent feeder with FCL
presence.
0
200
400
600
800
1000
1200
8.95 8.97 8.99 9.01 9.03 9.05 9.07 9.09
Cu
rren
t (A
)
Time (s)
R 60ohm
L 0.16H
Resonant
No FCL
0
100
200
300
400
500
600
700
800
900
1000
8.4MVA 5MVA
Fau
lt c
urr
ent
(A)
No FCL FCL_R
FCL_L FCL_LC

119
Observation of Figures 4.53 and 4.54 in conjunction with Figure 4.55 makes it apparent
that each FCL type is successfully able to mitigate synchronous machine based DG influences for
increasing levels of penetration. In the case of the 8.4 MVA DG source, for a line to line to ground
fault (in this case the most severe type of ground fault), each FCL type reduces the short circuit
current experienced by the main feeder head end recloser to below the 624 A nuisance trip criteria
and below the ground pick up setting. Subsequently, it will not operate for a parallel feeder fault.
Furthermore, it is apparent that the resistive type FCL is the most effective at limiting the short
circuit contribution of a synchronous machine based DG source to a parallel feeder fault. It should
also be noted that no synchronous machine based DG penetration level was found that caused loss
of fuse-recloser coordination. Note that the parallel feeder fault current exceeded 30 kA.
4.5.3 Bus 4 DG Connection
The case study presented in Section 3.4.2.3 demonstrates the effect of synchronous
machine based DG integration at bus 4 on recloser bi-directionality for the suburban distribution
system. A 5.5 MVA and 8.4 MVA synchronous machine based DG source was connected at bus
4 (each connected for separate tests) with each of the FCL types as depicted in Figure 4.17. A line
to line to ground fault is applied to the double load feeder specified in Section 3.4.2.3. The time-
domain short circuit currents experienced by the head end-recloser for each DG size and FCL type
is presented in Figures 4.56 and 4.57 with a summary presented in Figure 4.58.
Figure 4.56: Time-domain recloser RMS current simulation for a line to line to ground fault
applied at the double load adjacent feeder with a 5.5 MVA synchronous machine
based DG source integrated at bus 4 with FCL presence.
0
100
200
300
400
500
600
700
800
8.95 8.97 8.99 9.01 9.03 9.05 9.07 9.09
Cu
rren
t (A
)
Time (s)
R 60ohm
L 0.16H
Resonant
No FCL
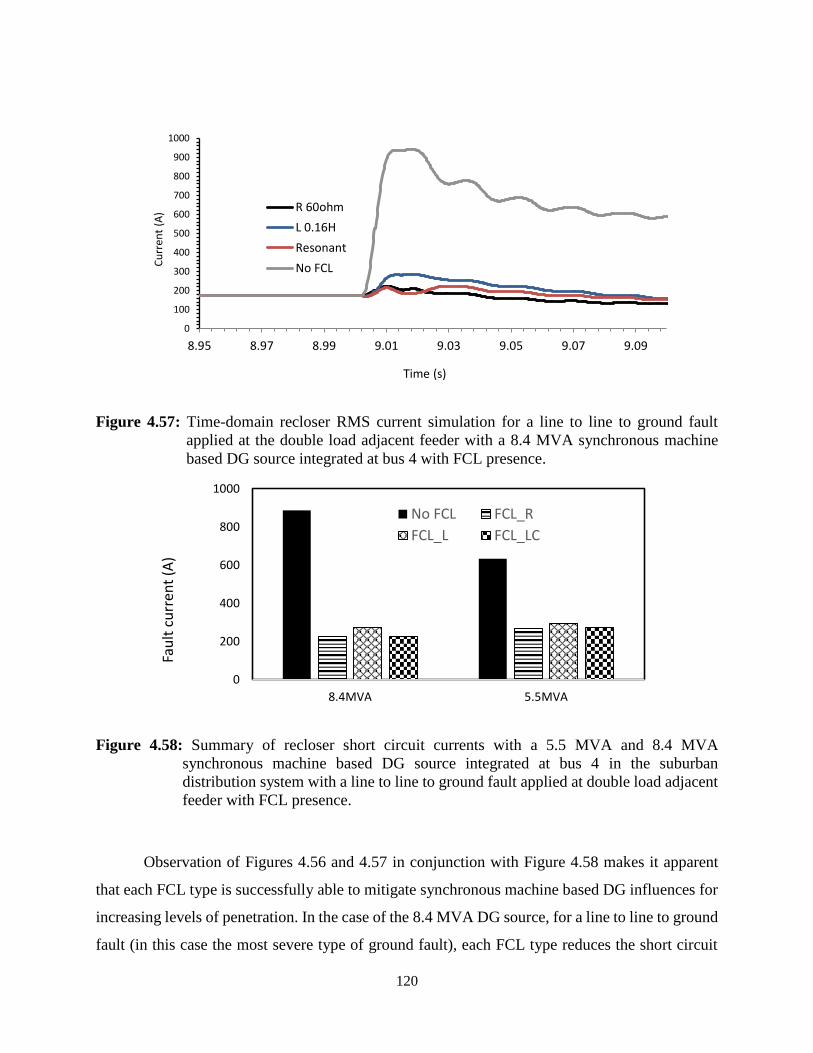
120
Figure 4.57: Time-domain recloser RMS current simulation for a line to line to ground fault
applied at the double load adjacent feeder with a 8.4 MVA synchronous machine
based DG source integrated at bus 4 with FCL presence.
Figure 4.58: Summary of recloser short circuit currents with a 5.5 MVA and 8.4 MVA
synchronous machine based DG source integrated at bus 4 in the suburban
distribution system with a line to line to ground fault applied at double load adjacent
feeder with FCL presence.
Observation of Figures 4.56 and 4.57 in conjunction with Figure 4.58 makes it apparent
that each FCL type is successfully able to mitigate synchronous machine based DG influences for
increasing levels of penetration. In the case of the 8.4 MVA DG source, for a line to line to ground
fault (in this case the most severe type of ground fault), each FCL type reduces the short circuit
0
100
200
300
400
500
600
700
800
900
1000
8.95 8.97 8.99 9.01 9.03 9.05 9.07 9.09
Cu
rren
t (A
)
Time (s)
R 60ohm
L 0.16H
Resonant
No FCL
0
200
400
600
800
1000
8.4MVA 5.5MVA
Fau
lt c
urr
ent
(A)
No FCL FCL_R
FCL_L FCL_LC

121
current experienced by the main feeder head end recloser to below the 624 A nuisance trip criteria
and below the ground pick up setting. Subsequently, it will not operate for a parallel feeder fault.
Furthermore, it is apparent that the resistive type FCL is the most effective at limiting the short
circuit contribution of a synchronous machine based DG source to a parallel feeder fault. It should
also be noted that no synchronous machine based DG penetration level was found that caused loss
of fuse-recloser coordination. Note that the parallel feeder fault current exceeded 30 kA.
4.5.4 Bus 5 DG Connection
The case study presented in Section 3.4.2.4 demonstrates the effect of synchronous
machine based DG integration at bus 5 on recloser bi-directionality for the suburban distribution
system. A 5.8 MVA and 8.4 MVA synchronous machine based DG source is connected at bus 5
(each connected for separate tests) with each of the FCL types as depicted in Figure 4.21. A line
to line to ground fault is applied to the double load feeder specified in Section 3.4.2.4. The time-
domain short circuit currents experienced by the head end-recloser for each DG size and FCL type
is presented in Figures 4.59 and 4.60 with a summary presented in Figure 4.61.
Figure 4.59: Time-domain recloser RMS current simulation for a line to line to ground fault
applied at the double load adjacent feeder with a 5.8 MVA synchronous machine
based DG source integrated at bus 5 with FCL presence.
0
100
200
300
400
500
600
700
800
8.95 8.97 8.99 9.01 9.03 9.05 9.07 9.09
Cu
rren
t (A
)
Time (s)
R 60ohm
L 0.16H
Resonant
No FCL

122
Figure 4.60: Time-domain recloser RMS current simulation for a line to line to ground fault
applied at the double load adjacent feeder with a 8.4 MVA synchronous machine
based DG source integrated at bus 5 with FCL presence.
Figure 4.61: Summary of recloser short circuit currents with a 5.8 MVA and 8.4 MVA
synchronous machine based DG source integrated at bus 5 in the suburban
distribution system with a line to line to ground fault applied at double load adjacent
feeder with FCL presence.
0
100
200
300
400
500
600
700
800
900
1000
8.95 8.97 8.99 9.01 9.03 9.05 9.07 9.09
Cu
rren
t (A
)
Time (s)
R 60ohm
L 0.16H
Resonant
No FCL
0
100
200
300
400
500
600
700
800
900
1000
8.4MVA 5.8MVA
Fau
lt c
urr
ent
(A)
No FCL FCL_R FCL_L FCL_LC

123
Observation of Figures 4.59 and 4.60 in conjunction with Figure 4.61 makes it apparent
that each FCL type is successfully able to mitigate synchronous machine based DG influences for
increasing levels of penetration. In the case of the 8.4 MVA DG source, for a line to line to ground
fault (in this case the most severe type of ground fault), each FCL type reduces the short circuit
current experienced by the main feeder head end recloser to below the 624 A nuisance trip criteria
and below the ground pick up setting. Subsequently, it will not operate for a parallel feeder fault.
Furthermore, it is apparent that the resistive type FCL is the most effective at limiting the short
circuit contribution of a synchronous machine based DG source to a parallel feeder fault. It should
also be noted that no synchronous machine based DG penetration level was found that caused loss
of fuse-recloser coordination. Note that the parallel feeder fault current exceeded 30 kA.
4.5.5 DG Connection Summary
Observation of results obtained in Section 4.5 makes it apparent that the utilization of
superconducting FCLs of resistive, inductive and resonant types are effective at mitigation of
synchronous machine based DG influences on existing system recloser bi-directionality for faults
on adjacent feeders. The resistive type FCL is consistently more effective with the recloser short
circuit current consistently being further below the pickup setting than the inductive and resonant
type FCL. Furthermore, it is apparent that the resonant type FCL is more efficient than the
inductive type in the context of bi-directionality.
4.6 Summary
Chapter 4 has demonstrated the effectiveness of the use of resistive, inductive and resonant
type FCLs in the mitigation of synchronous machine based DG source influences on fuse-recloser
protection. Detailed digital time-domain simulations and explanations into the effects FCL use in
synchronous machine based DG integration in the suburban distribution system for varying
connection points are presented. Results obtained demonstrate that FCLs are useful in the context
of mitigation of DG influences on protection, with the resistive type being consistently most
effective.

124
5. SUMMARY AND CONCLUSIONS
5.1 Critical Analysis of Results
Comparison of results obtained in Chapter 4 makes it apparent that the proposed use of
FCLs in mitigating synchronous machine based DG effects during fault conditions is plausible. As
demonstrated in Sections 3.2 and 3.4, when no FCL is integrated at the DG connection point, there
is a low synchronous machine based DG source penetration requirement before adverse effects on
the suburban distribution system’s short circuit characteristics results in violation of existing
protection infrastructure settings. This level of penetration is mainly related to the loading demands
of the main feeders in distribution networks whereby a higher load draws a higher current. The
higher the load the more DG penetration is able to be introduced without adversely affecting the
protection settings [34]. Further analysis of results obtained in Chapter 3 demonstrate that adverse
effects are first observable in fuse-recloser coordination for synchronous machine based DG
penetration levels as low as 24% of the load demand.
Observation of results obtained in Sections 4.2 to 4.5 makes it apparent that FCL use at the
connection point of synchronous machine based DG sources is effective in mitigation of DG
influences on system short circuit characteristics and consequently existing protective
infrastructure schemes and settings. As demonstrated in Section 4.2, the introduction of FCL
technology into the 52% load demand synchronous machine based DG penetrated suburban
distribution system can improve the DG influence on short circuit characteristics from 1% to less
than 1% in each FCL case. Furthermore it can be seen that the mitigation capability in the case of
the inductive and resonant type FCL reduces relative to distance between DG interconnection and
fault location.
Analysis of results obtained in Section 4.3 in conjunction with those in Section 4.2 makes
it apparent that resistive, inductive and resonant type FCLs can reduce synchronous machine based
DG influences on fuse-recloser coordination. In the case of the resistive type FCL, the short circuit
and fuse-recloser operating characteristic of the DG integrated suburban distribution system
returns to within 1% of the non-DG connected network. For other FCL types, the short circuit and
fuse-recloser operating characteristic returns to within 1.5% and 2.2% of the non-DG connected
network for the inductive and resonant type respectively, although coordination is still restored.

125
As demonstrated in Section 4.4, the introduction of synchronous machine based DG
sources can results in recloser inability to detect faulted conditions. The introduction of resistive,
inductive and resonant type FCLs for penetration levels of above 300% can result in the mitigation
of DG effects from 35% to less than 1%, 1.6% and 6.6% for each type respectively, when
compared to original short circuit currents experienced by the suburban distribution system head
end recloser.
Examination of results presented in Section 4.5 highlight the efficient use of resistive,
inductive and resonant FCL types in the mitigation of synchronous machine based DG source
influences on short circuit characteristics following parallel feeder faults in radial distribution
networks. As discussed, in regular radial distribution networks, when a fault occurs on an adjacent
feeder, the short circuit current experienced by the main feeder head end recloser is zero. The
introduction of synchronous machine based DG infrastructure results in short circuit current
contribution to adjacent feeder faults consequently allowing possible nuisance tripping of the main
feeder recloser. Although the introduction of the resistive, inductive and resonant type FCLs does
not reduce the short circuit contribution by the DG source to zero, it does mitigate the influences.
Results obtained in Section 4.5 highlight that for a line to line to ground fault, the parallel feeder
experiences a short circuit current in excess of 30 kA. In the worst case scenario, the head end
recloser of the main feeder experiences 300 A, 52% below the required 624 A nuisance trip
requirement. Additionally, the influence on the adjacent feeder fault characteristic is less than 1%
for each FCL type. Consequently the influence of the main feeder synchronous machine based DG
source on a parallel feeder’s short circuit characteristic is negligible, ensuring existing protection
infrastructure characteristic adequacy.
Comparison of results obtained in Sections 4.2.1, 4.3.1, 4.4.1 and 4.5.1 makes it apparent
that increasing the impedance of a superconducting FCL yields a higher efficiency mitigation
capability of synchronous machine based DG integration influences on radial system short circuit
characteristics. In the case of both the resistive and inductive type FCL’s, comparison demonstrates
that increasing the resistive state impedance yields stronger similarities in short circuit levels when
compared to the original non DG integrated systems.
Furthermore comparison and analysis of results obtained in Chapter 3 and 4 demonstrate
that the introduction of FCL’s on the DG side of the interconnecting transformer of a synchronous

126
machine based DG source can drastically change the effect that DG integration can impose on
existing system short circuit characteristics. The use of the algorithms presented in Chapter 3 are
also useful in the determination of synchronous machine base DG penetration level requirements
before mitigation effects of FCL technology is required.
Pricing and economic concerns are key factors affecting the practicality of introducing the
proposed approach into the market. Engineers should consider the comparative cost of re-
evaluating the existing protection settings or the cost of purchasing, maintaining, and installing
FCLs.
Practical applications of the proposed approach are in regions that have an expanding
population size which requires network expansion to meet increases in power demand from an
expanding consumer base, increasing the strain on generating units. This increased demand is
likely to lead to faster fatigue of existing generation sources, decreasing system supply security
and highlighting the need for DG sources.
Given the results obtained it is apparent that implementation of the proposed methods in
Chapter 3 and 4 will be dependent on economic considerations and forward network planning.
5.2 Summary
Due to the growing complexity of modern utility grids and increasing consumer energy
demand, power utilities worldwide are seeking methods of increasing generation capacities. One
low capital outlay method of increasing this capacity is presented in this research through the
inclusion of small synchronous machine based generators on the distribution side of the grid to
meet local power demands. The resultant increased capacity yields improvement in distribution
system voltage profile, reliability and generation capability however, it also has detrimental effects
on existing operational characteristics and network design.
The main objective of this research is to determine the efficiency in the use of resistive,
inductive and resonant superconducting FCLs for mitigation of synchronous machine based DG
source influences on radial distribution system short circuit characteristics and its consequential
effect on fuse-recloser coordination, recloser sensitivity, and recloser bi-directionality during fault

127
conditions. In this context, the effectiveness of the proposed FCL approach at the DG side of the
interconnection transformer is scrutinized and investigated through comprehensive time-domain
studies on the suburban distribution system so as to prevent DG source disconnection requirements
as per IEEE Std. 1547 or redesign of coordination schemes to restore protective design adequacy.
In Chapter 2, the system under study is introduced along with the details associated with
the modelling of individual components. A sample case study is also presented in this chapter.
Chapter 3 outlines the approach taken for DG impact assessment on fuse-recloser loss of
coordination, recloser loss of sensitivity and recloser bi-directionality. Case studies are also
presented for each problem.
Chapter 4 presents results in the validation of the use of FCLs in mitigating the effects of
synchronous machine based DG integration on distribution networks during fault conditions. A
critical analysis of results is also presented in this chapter.
5.3 Conclusions
Studies in this thesis yield the following conclusions for the suburban distribution system:
1. Synchronous machine based DG sources have the capacity to adversely affect existing
radial power system short circuit characteristics based on both size relative to load demand
and location.
2. The consequential effects on short circuit characteristic yield deterioration of existing fuse-
recloser coordination often resulting in invalidation of fuse-saving schemes.
3. Malfunction and inability of head end reclosers in detection of downstream faults with
upstream synchronous machine based DG source connection is yielded consequentially to
increasing levels of DG penetration.
4. Increased synchronous machine based DG source penetration has detrimental effects on
unidirectional power flow characteristics which can consequentially result in recloser
nuisance tripping for adjacent feeder faults in the same system.
5. Algorithms are presented for the assessment of synchronous machine based DG influences
on radial distribution networks on fuse-recloser coordination, recloser sensitivity and
recloser bi-directionality.

128
6. The introduction of resistive, inductive and resonant type FCLs is effective in the
mitigation of synchronous machine based DG influences on system short circuit
characteristics.
7. Consequentially, utilization of each FCL results in restoration of existing protection
infrastructure adequacy.
8. Reduction in resistive and inductive FCL impedances yields lower efficiencies in
mitigation characteristics.
9. The resistive type FCL consistently mitigates the effect of synchronous machine based DG
influences on short circuit and consequentially protection infrastructure characteristics to
within 1% of original system designs outperforming other FCL types at penetration levels
ranging from 23% to 343% of load demands.
10. The inductive type FCL consistently mitigates the effect of synchronous machine based
DG influences on short circuit and consequentially protection infrastructure characteristics
to within 2% of original system designs at penetration levels ranging from 23% to 343%
of load demands.
11. The resonant type FCL consistently mitigates the effect of synchronous machine based DG
influences on short circuit and consequentially protection infrastructure characteristics to
within 3% of original system designs for penetration levels at 23%. Inefficiencies become
apparent at higher penetration levels particularly in the context of recloser sensitivity.
12. The proposed DG integration assessment method in conjunction with the use of FCLs
offers significant practical value in the domain of network expansion planning and
reinforcement options in power distribution networks, as well as demonstrating the effect
of synchronous machine based DG penetration on existing protection infrastructure in
power systems.
This thesis is a stepping-stone in the direction of more research on DG influence mitigation
on existing distribution system short circuit characteristics and fuse-recloser protection
infrastructure. It is hoped that the research work documented in this thesis will provide useful
guidance for conducting more studies and analyzing other technical issues that might be impacted
by DG source integration.

129
REFERENCES
[1] G. Pepermans, J. Driesen, D. Haeseldonckx, R. Belmans and W. D'Haeseleer, "Distributed
generation: Definition, benefits and issues," Energy Policy - Elsevier, vol. 33, no. 6, pp. 787-798,
April 2005.
[2] T. K. Abdel-Galil, A. E. B. Abu-Elanin, E. F. El-Saadany, A. Girgis, A. R. I. Mohamed, M. M. A.
Salama and H. H. M. Zeineldin, "Protection Coordination Planning with Distributed Generation,"
Qualsys Engco Inc, 2007.
[3] G. M. Masters, Renewable and Efficient Electric Power Systems, Hoboken: John Wiley & Sons,
2004.
[4] "Renewable Energy," United Nations High-Level Group on Sustainable Energy for all, 2012.
[Online]. Available: http://www.se4all.org/our-vision/our-objectives/renewable-energy/. [Accessed
4 November 2014].
[5] L. Fried, S. Sawyer, S. Shukla and L. Qiao, "Global Wind Report Annual Market Update 2013,"
Global Wind Energy Council, Brussels, 2014.
[6] U. Karaagac, S. O. Faried, J. Mahseredjian and A.A. Edris, "Coordinated Control of Wind Energy
Conversion Systems for Mitigating Subsynchronous Interaction in DFIG-Based Wind Farms," IEEE
Transactions on Smart Grid, vol. 5, no. 5, pp. 2440-2449, September 2014.
[7] O. Anaya-Lara, N. Jenkins, J. Ekanayake, P. Cartwright and M. Hughes, Wind Energy Generation:
Modeling and Control, John Wiley and Sons, 2006.
[8] C. J. Mozina, "Impact of Green Power Generation on Distribution Systems in a Smart Grid," in
Power Systems Conference and Exposition (PSCE), Phoenix, 2011.
[9] A. T. Moore, "Distributed Generation (DG) Protection Overview," 5 May 2008. [Online]. Available:
http://www.eng.uwo.ca/people/tsidhu/Documents/DG%20Protection%20V4.pdf. [Accessed 20
June 2014].

130
[10] D. J. Glover, M. S. Sarma and T. J. Overbye, Power System Analysis and Design, 4th ed., Stamford:
Cengage Learning, 2008.
[11] P. M. Anderson, Power System Protection, Hoboken: John Wiley & Sons, 1999.
[12] N. Rajaei, M. H. Ahmed, M. M. A. Salama and R. K. Varma, "Fault Current Management Using
Inverter-Based Distributed Generators in Smart Grids," IEEE Transactions on Smart Grid, vol. 5,
no. 5, pp. 2183-2193, September 2014.
[13] F. Sulla, "Fault Behaviour of Wind Turbines," Ph.D. dissertation, Dept. Measurement Tech.
Industrial Elect. Eng., Lund University, Lund, 2012.
[14] S. J. Chapman, Electric Machinery Fundamentals, 4th ed., New York: McGraw-Hill, 2005.
[15] T. Gonen, Electric Power Distribution System Engineering, 2nd ed., Boca Raton: Taylor & Francis
Group, 2008.
[16] Cooper Power Systems, "Kearney Type T TCC," 2013. [Online]. Available:
http://www.cooperindustries.com/content/dam/public/powersystems/resources/library/Kearney/K5
1000AB.pdf. [Accessed 15 July 2014].
[17] A. S. Rones V and K. P. Vittal, "Modeling of Recloser and Sectionalizer and their Coordination
Using PSCAD," in International Conference on Circuits, Power and Computing Technologies,
Nagercoil, 2013.
[18] IEEE guide for Automatic Reclosing of Line Circuit Breakers for AC Distribution and Transmission
Lines, IEEE Standard C37.104, 2002.
[19] Asea Brown Boveri (ABB), "ABB PCD Control Protection Curves," September 2002. [Online].
Available:
http://www05.abb.com/global/scot/scot235.nsf/veritydisplay/1bc69ae25de85ac585256c44005e98c
4/$file/pcd%20protection%20curves.pdf. [Accessed 15 July 2014].
[20] IEEE Standard Inverse-Time Characteristic Equations for Overcurrent Relays, IEEE Standard
C37.112, 1997.

131
[21] T. A. Short, Electric Power Distribution Handbook, Boca Raton: CRC Press, 2004.
[22] A. Zamani, T. S. Sidhu and A. Yazdani, "A Strategy for Protection Coordination in Radial
Distribution Networks with Distributed Generators," in Power and Energy Society General Meeting,
Minneapolis, 2010.
[23] U.S. Department of Energy, "Fault Current Limiters," 6 November 2009. [Online]. Available:
http://energy.gov/sites/prod/files/oeprod/DocumentsandMedia/hts_fcl_110609.pdf. [Accessed 29
May 2014].
[24] M. Elsamahy, S. O. Faried and T. S. Sidhu, "Impact of Superconducting Fault Current Limiters on
the Coordination Between Generator Distance Phase Backup Protection and Generator Capability
Curves," IEEE Transactions on Power Delivery, vol. 26, no. 3, pp. 1854-1863, July 2011.
[25] L. Wang, P. Jiang and D. Wang, "Summary of Superconducting Fault Current Limiter Technology,"
in Frontiers in Computer Education, Berlin, Springer, 2012, pp. 819-825.
[26] H. Arai, M. Inaba, T. Ishigohka, H. Tanaka, K. Arai, M. Furuse and M. Umeda, "Fundamental
Characteristics of Superconducting Fault Current Limiter Using LC Resonance Circuit," IEEE
Transactions on Applied Superconductivity, vol. 16, no. 2, pp. 642-645, June 2006.
[27] S. O. Faried and M. Elsamahy, "Incorporating superconducting fault current limiters in the
probabilistic evaluation of transient recovery voltage," IET Generation, Transmission &
Distribution, vol. 5, no. 1, pp. 101-107, 2011.
[28] M. Dewadasa, Protection of distributed generation interfaced networks, PhD dissertation, Dept.
Elect. Eng., Queensland University of Technology, Queensland, 2010.
[29] IEEE Standard for Interconnecting Distributed Resources with Electric Power Systems, IEEE
Standard 1547, 2003.
[30] A. Zamani, T. S. Sidhu and A. Yazdani, "A Protection Strategy and Microprocessor-Based Relay
for Low-Voltage Microgrids," IEEE Transactions on Power Delivery, vol. 26, no. 3, pp. 1873-1883,
July 2011.

132
[31] J. O. Williams, "Narrow-band analyzer,” PhD dissertaion," Department of Electrical Engineering,
Harvard University, Cambridge, MA, 1993.
[32] S. M. Brahma and A. A. Girgis, "Development of adaptive protection scheme for distribution
systems with high penetration of distributed generation," IEEE Transactions on Power Delivery,
vol. 19, pp. 56-63, 2004.
[33] E. Sortomme, S. S. Venkata and J. Mitra, "Microgrid Protection using Communication-Assisted
Digital Relays," IEEE Transactions on Power Delivery, vol. 25, no. 4, pp. 2789-2796, October 2010.
[34] W. El-Khattam and T. S. Sidhu, "Restoration of Directional Overcurrent Relay Coordination in
Distributed Generation Systems Utilizing Fault Current Limiter," IEEE Transactions on Power
Delivery, vol. 23, no. 2, pp. 576-585, April 2008.
[35] L. Chen, C. Deng, F. Guo, Y. Tang, J. Shi and L. Ren, "Reducing the Fault Current and Overvoltage
in a Distribution System with Distributed Generation Units Through and Active Type SFCL," IEEE
Transactions on Applied Superconductivity, vol. 24, no. 3, June 2014.
[36] Manitoba HVDC Research Centre, PSCAD Power System Computer Aided Design, Winnipeg:
Manitoba Hydro International Ltd., 2010.
[37] Manitoba HVDC Research Centre, Applications of PSCAD/EMTDC, Winnipeg: Manitoba Hydro
International Ltd., 2008.
[38] J. M. Gers and E. J. Holmes, Protection of Electricity Distribution Networks, 2nd ed., London: The
Institution of Engineering and Technology, 2004.
[39] H. Joshi, Residential, Commercial and Industrial Electrical Systems, vol. 3, New Delhi: Tata
McGraw-Hill, 2008.
[40] P. Kundur, Power System Stability and Control, New York: McGraw-Hill, 1994.
133
[41] J. C. Das, Power System Analysis Short-Circuit Load Flow and Harmonics, New York: Marcel
Dekker, 2002.
[42] L. Pham, "Dynamic Enhancement of the Future SaskPower Interconnected North and South
Systems: The HVDC Connection," M.S. Thesis, Dept. Elect. Eng., University of Saskatchewan,
Saskatoon, 2014.
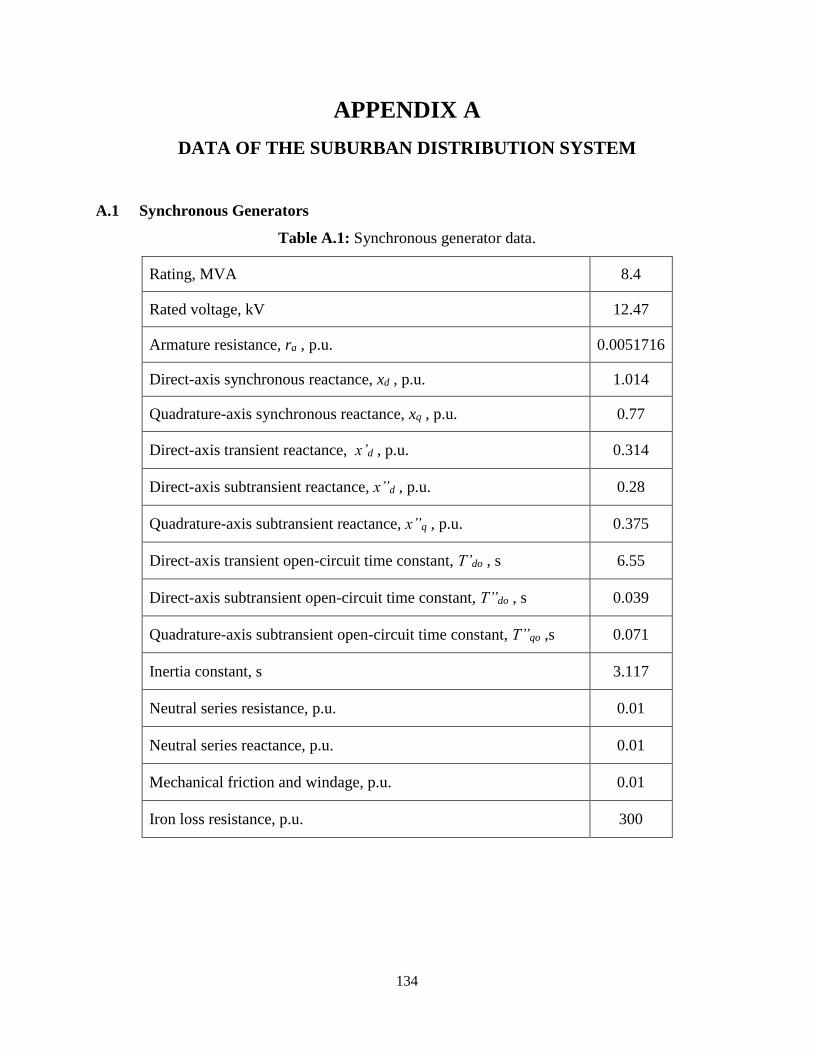
134
APPENDIX A
DATA OF THE SUBURBAN DISTRIBUTION SYSTEM
A.1 Synchronous Generators
Table A.1: Synchronous generator data.
Rating, MVA 8.4
Rated voltage, kV 12.47
Armature resistance, ra , p.u. 0.0051716
Direct-axis synchronous reactance, xd , p.u. 1.014
Quadrature-axis synchronous reactance, xq , p.u. 0.77
Direct-axis transient reactance, x’d , p.u. 0.314
Direct-axis subtransient reactance, x”d , p.u. 0.28
Quadrature-axis subtransient reactance, x”q , p.u. 0.375
Direct-axis transient open-circuit time constant, T’do , s 6.55
Direct-axis subtransient open-circuit time constant, T”do , s 0.039
Quadrature-axis subtransient open-circuit time constant, T”qo ,s 0.071
Inertia constant, s 3.117
Neutral series resistance, p.u. 0.01
Neutral series reactance, p.u. 0.01
Mechanical friction and windage, p.u. 0.01
Iron loss resistance, p.u. 300

135
A.2 Transformers
Table A.2: Transformer data.
Interconnecting Transformer Substation Bus 5 Load Motor
Scenario
DG size
less than 16
MVA
16 MVA<DG<75
MVA N/A N/A N/A
Rating, MVA 16 75 100 2 2
Rated voltage,
kV 12.47/25 12.47/25 240/25 25/0.208 12.47/25
No load losses,
p.u. 0.001 0.001 0.005 0.005 0.005
Copper losses,
p.u. 0.002 0.002 0.003 0.003 0.003
Leakage
reactance, xT ,
p.u.
0.1 0.46875 0.1 0.03 0.0614
Configuration Wye-Gnd/
Wye-Gnd Wye-Gnd/ Wye-Gnd
Wye-Gnd/
Wye-Gnd
Delta/Wye-
Gnd
Wye-
Gnd/Delta
A.3 Line and Cable Data
Table A.3: Line and cable data.
Feeder cables Underground
Cable
Collector
Feeder
Positive Sequence Resistance (mΩ/ m) .166 0.0601 .166
Positive Sequence Reactance (mΩ/ m) .29 0.07979 .29
Positive Sequence Capacitive
Reactance (MΩ×m) 170 4237350 170
Zero Sequence Multiplication Factor 3 0.575 3

136
A.4 Induction Motor Data
1 MW, 12.47 kV, 60 Hz
Stator/Rotor turns ratio = 1.3, Angular Moment of Inertia = 0.7267 seconds, Mechanical
Damping = 0.001 p.u, Rs = 0.005 p.u., Wound Rotor Resistance = 0.008 p.u., Magnetizing
Inductance = 4.362 p.u., Stator Leakage Inductance = 0.102 p.u., Wound Rotor Inductance =
0.11 p.u.
A.5 Other Components
Main Feeder Load = 14.58 MW + 7.06 MVAR
Resistive FCL values: RFCL = 60, 50, 20Ω, Rp = 0
Inductive FCL values: IFCL = 0.16, 0.13, 0.05H, LTC = 0
Resonant FCL values: Lf = 0.187, Cf = 37.665µF

137
APPENDIX B
SHORT CIRCUIT CURRENTS FOR THE NORMAL AND
SYNCHRONOUS MACHINE BASED DG INTEGRATED SUBURBAN
DISTRIBUTION SYSTEM
Table B.1: Short circuit currents for varying fault types at the bus 5 load.
Synchronous Machine Based DG Interconnection Point
Bus 1 Bus 2 Bus 4 Bus 5 No DG
Type Ifeed Ifault Ifeed Ifault Ifeed Ifault Ifeed Ifault Ifeed Ifault
3ø 806 1156 791 1176 790 1212 801 1227 1171 1059
LG 705 735 699 742 688 758 682 766 937 701
LLG 609 704 599 714 582 736 574 749 889 657
LL 653 577 650 584 643 599 640 608 853 545
Table B.2: Short circuit currents for varying fault types at the bus 4.
Synchronous Machine Based DG Interconnection Point
Bus 1 Bus 2 Bus 4 Bus 5 No DG
Type Ifeed Ifault Ifeed Ifault Ifeed Ifault Ifeed Ifault Ifeed Ifault
3P 3750 4319 4041 4315 3919 4503 3917 4494 3917 3869
LG 1835 2277 1881 2429 2114 2935 3446 2879 2102 2034
LLG 3323 3863 3359 3947 3447 4146 2101 2878 3516 3402
LL 3371 3808 3403 3887 3472 4056 3473 4053 3534 3342
Table B.3: Short circuit currents for varying fault types at the bus 3.
Synchronous Machine Based DG Interconnection Point
Bus 1 Bus 2 Bus 4 Bus 5 No DG
Type Ifeed Ifault Ifeed Ifault Ifeed Ifault Ifeed Ifault Ifeed Ifault
3P 4403 4627 4300 4711 4283 4878 4283 4881 4283 4186
LG 2221 2766 2308 2969 2455 3264 2446 3218 2476 2420
LLG 3700 4311 3747 4346 3801 4519 3805 4513 3868 3781
LL 3712 4233 3750 4262 3793 4413 3793 4409 3854 3649

138
Table B.4: Short circuit currents for varying fault types at the bus 2.
Synchronous Machine Based DG Interconnection Point
Bus 1 Bus 2 Bus 4 Bus 5 No DG
Type Ifeed Ifault Ifeed Ifault Ifeed Ifault Ifeed Ifault Ifeed Ifault
3P 4776 5229 4725 5303 4724 5331 4724 5336 4724 4707
LG 2813 3519 2988 3872 2972 3788 2966 3749 3023 2988
LLG 4184 4878 4255 4980 4252 4987 4253 4981 4313 4256
LL 4128 4709 4172 4792 4174 4799 4178 4797 4240 4098