mitigation of united kingdom pm2.5 concentrations · air quality expert group mitigation of united...
TRANSCRIPT

AIR QUALITY EXPERT GROUP
Mitigation of United Kingdom PM2.5 Concentrations
Prepared for:Department for Environment, Food and Rural Affairs;Scottish Government; Welsh Government; andDepartment of the Environment in Northern Ireland
AIR QUALITY EXPERT GROUP
Mitigation of United Kingdom PM2.5 Concentrations
Prepared for:
Department for Environment, Food and Rural Affairs;
Scottish Government; Welsh Government; and
Department of the Environment in Northern Ireland

This is a report from the Air Quality Expert Group to the Department for Environment, Food and Rural Affairs; Scottish Government; Welsh Government; and Department of the Environment in Northern Ireland, on linking emission inventories and ambient measurements.
© Crown copyright 2013
United Kingdom Air Quality information received from the automatic monitoring sites and forecasts may be accessed via the following media:
Freephone Air Pollution Information 0800 556677 Service
Internet http://uk-air.defra.gov.uk
PB14161

I
Terms of referenceThe Air Quality Expert Group (AQEG) is an expert committee of the Department for Environment, Food and Rural Affairs (Defra) and considers current knowledge on air pollution and provides advice on such things as the levels, sources and characteristics of air pollutants in the UK. AQEG reports to Defra’s Chief Scientific Adviser, Defra Ministers, Scottish Ministers, the Welsh Government and the Department of the Environment in Northern Ireland (the Government and devolved administrations). Members of the Group are drawn from those with a proven track record in the fields of air pollution research and practice.
AQEG’s functions are to:
• Provide advice to, and work collaboratively with, officials and key office holders in Defra and the devolved administrations, other delivery partners and public bodies, and EU and international technical expert groups;
• Report to Defra’s Chief Scientific Adviser (CSA): Chairs of expert committees will meet annually with the CSA, and will provide an annual summary of the work of the Committee to the Science Advisory Council (SAC) for Defra’s Annual Report. In exception, matters can be escalated to Ministers;
• Support the CSA as appropriate during emergencies;
• Contribute to developing the air quality evidence base by analysing, interpreting and synthesising evidence;
• Provide judgements on the quality and relevance of the evidence base;
• Suggest priority areas for future work, and advise on Defra’s implementation of the air quality evidence plan (or equivalent);
• Give advice on current and future levels, trends, sources and characteristics of air pollutants in the UK;
• Provide independent advice and operate in line with the Government’s Principles for Scientific Advice and the Code of Practice for Scientific Advisory Committees (CoPSAC).
Expert Committee Members are independent appointments made through open competition, in line with the Office of the Commissioner for Public Appointments (OCPA) guidelines on best practice for making public appointments. Members are expected to act in accord with the principles of public life.
Further information on AQEG can be found on the Group’s website at: https://www.gov.uk/government/policy-advisory-groups/air-quality-expert-group

II
Membership
Chair
Professor Paul Monks University of Leicester
Members
Dr David Carruthers Cambridge Environmental Research Consultants (CERC)
Dr David Carslaw King’s College London
Dr Chris Dore Aether Ltd
Professor Roy Harrison OBE University of Birmingham
Dr Mat Heal University of Edinburgh
Dr Mike Jenkin Atmospheric Chemistry Services
Professor Alastair Lewis National Centre for Atmospheric Science, University of York
John Stedman Ricardo AEA
Professor Alison Tomlin University of Leeds
Professor Martin Williams King’s College London
III
Ex officio members
Central Management and Control Unit of the automatic urban and rural networks: Dr Richard Maggs, Bureau Veritas
National Atmospheric Emissions Inventory: Dr Tim Murrells, Ricardo AEA
Particles, metals, PAHs and black carbon monitoring networks: Dr Paul Quincey, National Physical Laboratory
Quality Assurance and Quality Control of the automatic urban network and the non-automatic monitoring networks: Dr Paul Willis, Ricardo AEA
Assessors and observers
Simon Baldwin Welsh Government
Barry McCauley Department of the Environment in Northern Ireland
Andrew Taylor Scottish Government
Alison Gowers Department of Health/Public Health England
Secretariat
Dr Sarah Moller Department for Environment, Food and Rural Affairs and National Centre for Atmospheric Science
Peter Coleman Department for Environment, Food and Rural Affairs

IV
AcknowledgementsThe Air Quality Expert Group would like to acknowledge the following individuals and organisations for their help in the preparation of this report:
Sally Cooke, Ricardo-AEA
Dr Eiko Nemitz, Centre for Ecology and Hydrology
Dr Massimo Vieno, Centre for Ecology and Hydrology
V
ContentsExecutive summary 1
1 Introduction 3
2 Contribution of UK sources to UK PM2.5 5
2.1 UK vs. non-UK contributions to UK PM2.5 – Annual averages 5
2.2 UK vs. non-UK contributions to UK PM2.5 – Episodes 11
3 What is the role of ammonia? 17
3.1 Reductions in secondary inorganic aerosol (SIA) 17
3.2 How do reductions in ammonia emissions compare with reductions in other pollutants in reducing PM2.5? 21
3.3 Emission reduction effectiveness in future years 30
3.4 Some qualifying remarks and uncertainties 33
4 Conclusions and recommendations 35
Annex A: AQEG (2012) report on PM2.5 source attribution 37
References 39
VI
ABBREVIATIONSAEI – Average Exposure Indicator
AGANet – Acid Gas and Aerosol Network
CMB – chemical mass balance (receptor model)
CTM – chemical transport model
EC – elemental carbon
EMEP – European Monitoring and Evaluation Programme
EMEP-MSC-W – EMEP Meteorological Synthesizing Centre – West
NAEI – National Atmospheric Emissions Inventory
NAMN – National Ammonia Monitoring Network
NH3 – ammonia
NMVOCs – non-methane volatile organic compounds
NO – nitric oxide
NOx – nitrogen oxides (NO + NO2)
NO2 – nitrogen dioxide
OC – organic carbon
OM – organic matter
PCM – Pollution Climate Mapping model
PM – particulate matter
PM2.5 – particulate matter with a diameter less than 2.5 micrometres
PM10 – particulate matter with a diameter less than 10 mirometres
PMF – positive matrix factorisation (receptor model)
PTM – UK Photochemical Trajectory Model
SIA – secondary inorganic aerosol
SOx – oxides of sulphur
SO2 – sulphur dioxide
SOA – secondary organic aerosol
UKIAM – UK Integrated Assessment Model
VOCs – volatile organic compounds
1
Executive summary This report addresses two issues: first, the contribution to PM2.5 (particulate matter with a diameter less than 2.5 µm) concentrations in the UK which arises from sources within the UK and which therefore sets a limit on the extent to which UK source abatement measures can mitigate UK PM2.5 concentrations; and second, the related issue of the role of ammonia emission reductions in mitigating PM2.5 concentrations compared with reductions in other sources/components of PM2.5, in particular primary combustion sources of PM2.5.
The analysis presented in this report has shown that UK emissions contribute around 50-55% of total annual average PM2.5 in the UK. This limits the extent to which long-term average concentrations can be reduced by UK action alone and demonstrates that action by neighbouring countries is important in reducing annual UK PM2.5 concentrations. The largest contributions arise from France and the Benelux countries, Germany and Poland, but their relative importance can vary from year to year depending on meteorology.
A detailed analysis of PM2.5 episodes has not been feasible in this report, but many episodes occur on easterly winds. Consequently, it is likely that the non-UK contribution to episodic concentrations of PM2.5 is even higher than for annual averages. However, model simulations indicate that some SIA (secondary inorganic aerosol) episodes are also driven by UK emissions into stagnant air. The chemical composition of PM2.5 in different episodes can also be variable. A more detailed analysis of UK and non-UK contributions to episodes of PM2.5 and PM10 is recommended.
The analysis in this report has provided some new insights into the most effective ways of reducing PM2.5 mass in the UK. The work has shown that total PM2.5 mass is relatively insensitive to reductions in any one individual component, such as the precursors of SIA or primary PM2.5 emissions. The relative insensitivity of SIA to precursor emission reductions is due largely to non-linearities in the relationship between SIA precursors and the resulting ambient concentrations.
Reductions in emissions of primary PM2.5 and ammonia are the most effective in reducing PM2.5 mass out of the five alternatives studied (reductions in primary particulate matter (PM), sulphur dioxide (SO2), nitrogen oxides (NOx), volatile organic compounds (VOCs) and ammonia emissions), as measured by the Average Exposure Indicator (AEI). For the same percentage reductions in emissions of ammonia and primary PM, reductions in NOx, SO2 or VOC emissions result in smaller changes in total PM2.5 mass concentrations. These statements refer to reductions in each of these precursors individually.
Reductions of primary PM2.5 emissions in the UK deliver reductions in PM2.5 mass predominantly in areas of higher population density, while ammonia reductions lead to decreases mainly in non-urban areas. This observation suggests that if the aim is to reduce impacts of PM2.5 on public health, as indicated by the AEI, reducing primary PM emissions is likely to be an effective strategy. If the focus is on ecosystem damage and reducing spatially-averaged PM2.5 concentrations across the UK, then ammonia reduction would be the more effective approach.
Executive summary
Mitigation of United Kingdom PM2.5 Concentrations
2
Several qualifying remarks are in order here:
• The data on the effects of emission reductions are from two models which essentiallyshare the same chemical schemes. There are, however, good reasons for havingconfidence in the findings. First, the modelled reductions for past years show goodagreement with measured trends, and second, the conclusions are in line with findingsfrom an independent model which treats the chemistry and physics of particle formation ina sophisticated way.
• The results of the mitigation scenarios are for a single year. Interannual variability inmeteorology may also have an influence.
• The emissions reductions were applied to pollutants individually. In reality, emissionsreductions for pollutants may occur simultaneously.
• A potentially more relevant mitigation scenario calculation would assess the effect ofemission reductions at some future date, e.g. 2020 or thereabouts, to take account ofthe fact that reductions in the emission of SIA precursors and primary PM are already intrain. In this report, this has only been carried out using one of the models (the PollutionClimate Mapping model, PCM); both models (PCM and EMEP4UK) have been used forhypothetical reductions only from a ‘current’ level. For additional robustness it would beworth modelling such future scenarios with a deterministic chemical transportmodel (CTM).
• No consideration has been given to the practicalities or costs of emissions reductions forparticular species and particular sectors on top of future emissions reductions already inthe pipeline.
• No consideration has been given to the potential differential toxicity of differentcomponents of PM2.5 which could, as evidence emerges, also influence the priorities forPM2.5 mitigation.
3
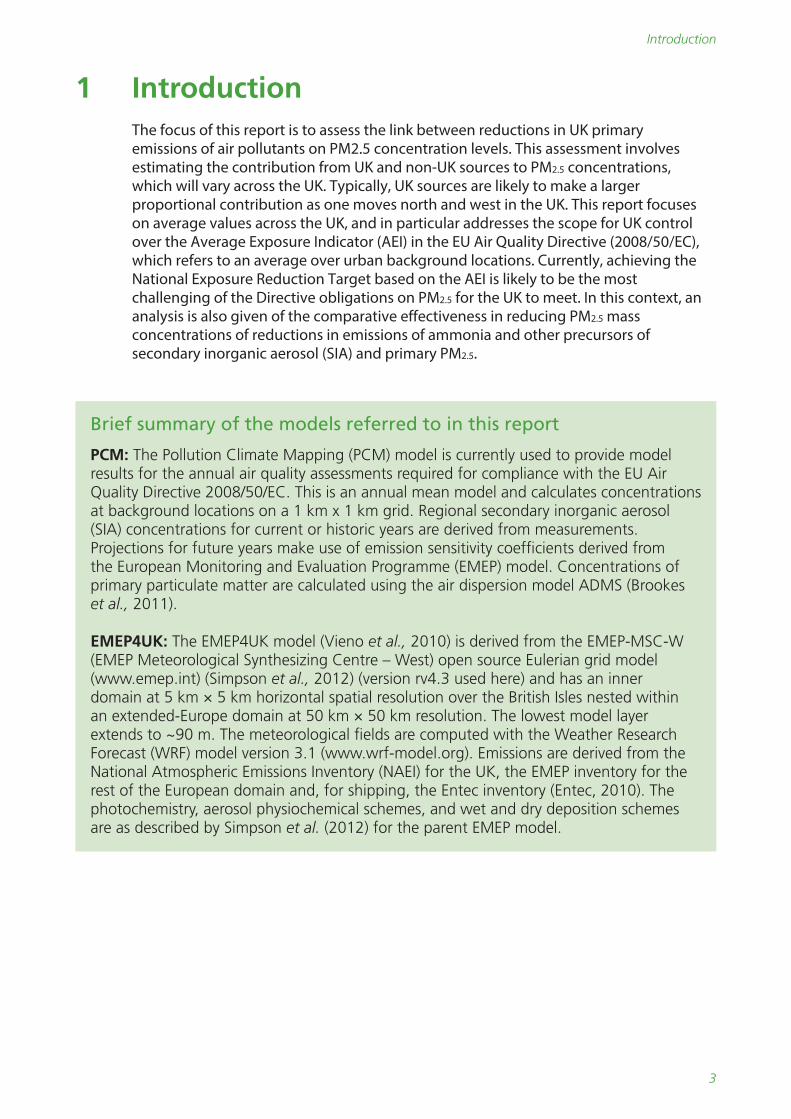
1 Introduction The focus of this report is to assess the link between reductions in UK primary emissions of air pollutants on PM2.5 concentration levels. This assessment involves estimating the contribution from UK and non-UK sources to PM2.5 concentrations, which will vary across the UK. Typically, UK sources are likely to make a larger proportional contribution as one moves north and west in the UK. This report focuses on average values across the UK, and in particular addresses the scope for UK control over the Average Exposure Indicator (AEI) in the EU Air Quality Directive (2008/50/EC), which refers to an average over urban background locations. Currently, achieving the National Exposure Reduction Target based on the AEI is likely to be the most challenging of the Directive obligations on PM2.5 for the UK to meet. In this context, an analysis is also given of the comparative effectiveness in reducing PM2.5 mass concentrations of reductions in emissions of ammonia and other precursors of secondary inorganic aerosol (SIA) and primary PM2.5.
Brief summary of the models referred to in this report
PCM: The Pollution Climate Mapping (PCM) model is currently used to provide model results for the annual air quality assessments required for compliance with the EU Air Quality Directive 2008/50/EC. This is an annual mean model and calculates concentrations at background locations on a 1 km x 1 km grid. Regional secondary inorganic aerosol (SIA) concentrations for current or historic years are derived from measurements. Projections for future years make use of emission sensitivity coefficients derived from the European Monitoring and Evaluation Programme (EMEP) model. Concentrations of primary particulate matter are calculated using the air dispersion model ADMS (Brookes et al., 2011).
EMEP4UK: The EMEP4UK model (Vieno et al., 2010) is derived from the EMEP-MSC-W (EMEP Meteorological Synthesizing Centre – West) open source Eulerian grid model (www.emep.int) (Simpson et al., 2012) (version rv4.3 used here) and has an inner domain at 5 km × 5 km horizontal spatial resolution over the British Isles nested within an extended-Europe domain at 50 km × 50 km resolution. The lowest model layer extends to ~90 m. The meteorological fields are computed with the Weather Research Forecast (WRF) model version 3.1 (www.wrf-model.org). Emissions are derived from the National Atmospheric Emissions Inventory (NAEI) for the UK, the EMEP inventory for the rest of the European domain and, for shipping, the Entec inventory (Entec, 2010). The photochemistry, aerosol physiochemical schemes, and wet and dry deposition schemes are as described by Simpson et al. (2012) for the parent EMEP model.
Introduction

Mitigation of United Kingdom PM2.5 Concentrations
4
Brief summary of the models referred to in this report (cont’d...)
PTM: The enhanced UK Photochemical Trajectory Model (PTM) is a Lagrangian box model enhanced to better describe boundary layer meteorological processes by use of data for temperature, relative humidity and mixing depths and a better description of insolation. The in-cloud oxidation of sulphur dioxide has been incorporated as well as estimates of emissions of sea salt aerosol. The partition of reactive gases such as ammonia and nitric acid between vapour and the condensed phase is described through the thermodynamic model ISORROPIA II, which describes the equilibrium processes within an internally mixed aerosol as a function of temperature and relative humidity. The features of the model are described in Beddows et al. (2012) and the predictions of secondary inorganic aerosol mitigation measures are reported in Harrison et al. (2013), where a horizontal grid size of 10 km was used.
NAME: NAME (Numerical Atmospheric Dispersion Modelling Environment) is a Lagrangian dispersion model that simulates the dispersion, chemistry and deposition processes occurring in the atmosphere. The model runs employ three-dimensional meteorological fields from the Met Office Unified Model (Davies et al., 2005). The model is well documented and has numerous applications, for example modelling volcanic eruptions, accidental releases of radionuclides, the spread of foot and mouth disease, and air quality. A detailed description of the NAME model physics can be found in Jones et al. (2007). A description of the atmospheric chemistry model applications can be found in Redington et al. (2009), although the chemistry scheme has been updated since then to include simple parameterisations to represent the formation of both anthropogenic secondary organic aerosol (ASOA) and biogenic secondary organic aerosol (BSOA). A simple scheme that allows the oxidation of toluene to form ASOA has been included, where the toluene is scaled up to represent the total amount of VOC that produces ASOA. BSOA is formed largely from the atmospheric oxidation of the biogenic terpenes. A simple scheme that forms a SOA precursor from α-pinene which undergoes reversible uptake into the particle phase has also been included.
5
2 Contribution of UK sources to UK PM2.5
Some information on the question of UK versus non-UK contributions to PM2.5 is already available in a 2012 Air Quality Expert Group (AQEG) report (AQEG, 2012), but this study aims to incorporate more recent work which has emerged since then.
The initial estimates in AQEG (2012), based on (i) the PCM (Pollution Climate Mapping) model,1 and (ii) the UK Integrated Assessment Model (UKIAM), are shown in Annex A. While these tables are helpful, they do not fully address the issue of UK contributions raised in the introduction (Section 1). A more comprehensive approach is included in Table 1, which includes best estimates from modelling studies and from analyses of monitoring data, primarily using receptor modelling.
Models can, at least in principle, provide source attribution numbers directly, albeit with a degree of uncertainty. Direct measurements of particulate matter (PM) components and inferred source attribution from receptor models (e.g. chemical mass balance, CMB, and positive matrix factorisation, PMF, techniques), as well as other techniques, can potentially offer ‘ground truth’ information. However, such analyses of monitoring results invariably address source types/sectors rather than UK/non-UK splits, so that when analyses of monitoring results are used, a combination of data from measurements and models will be necessary to arrive at estimates of the values for the cells in Table 1. For example, the total mass of a component in Table 1 might be known quite accurately from measurements, but the UK/non-UK split would in general need modelling to resolve. The discussion will begin by summarising the breakdown of total PM2.5 – as an annual average and in episodes – by chemical/physical components and sources, before going on to address potential reductions in PM in relation to emission reductions and the role of ammonia.
2.1 UK vs. non-UK contributions to UK PM2.5 – Annual averages A breakdown of total PM2.5 in the UK is given in Table 1. The two main sources of the
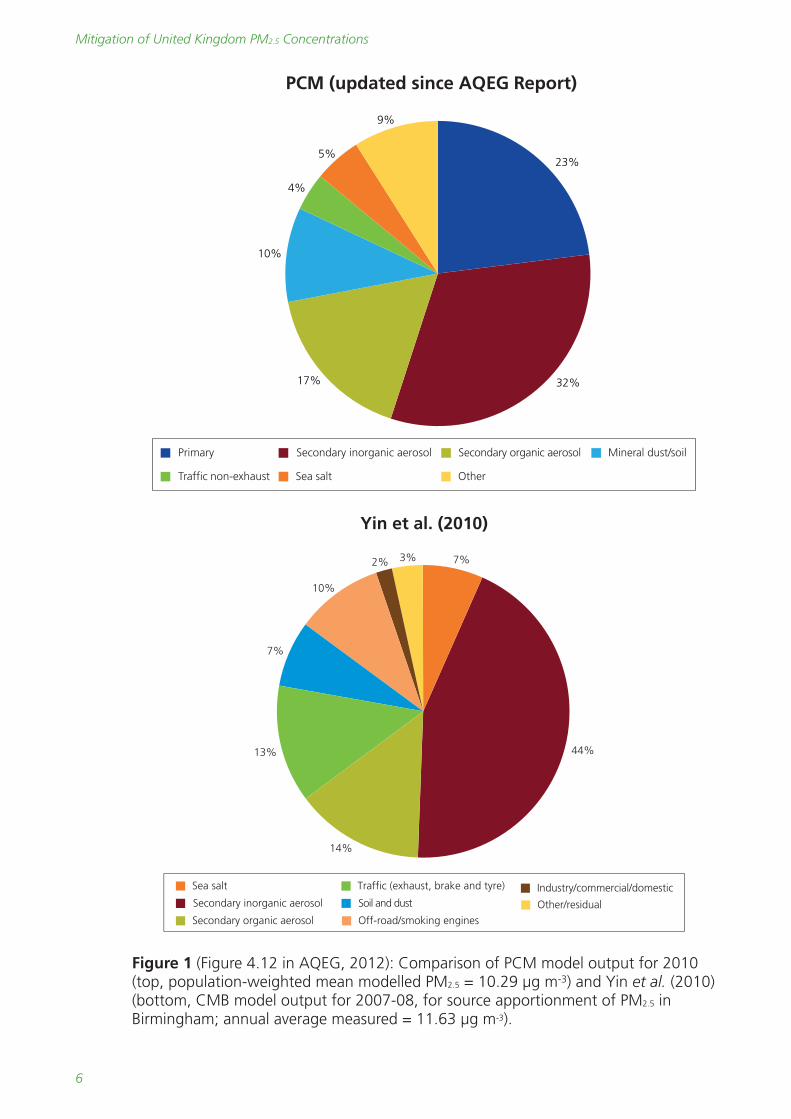
information contained in this table are the PCM model from Ricardo-AEA (AQEG, 2012) and the receptor modelling mass-closure study of Yin et al. (2010) based on measurements in Birmingham (results from this study are also shown in Figure 1). These have been supplemented by studies of secondary inorganic aerosol (SIA) by Vieno and Heal (2013) and Nemitz et al. (2014) using the EMEP4UK model, and a study of secondary organic aerosol (SOA) by Redington and Derwent (2013) using the Numerical Atmospheric Dispersion Modelling Environment (NAME) model. The percentage reduction in SIA from switching off UK sources calculated from the EMEP4UK model is shown in Figure 2.
1 PCM uses emission sensitivity coefficients derived from the results of the European Monitoring and Evaluation Programme (EMEP) model to assign secondary inorganic aerosol (SIA) concentrations to different source areas. The in-house Ricardo-AEA TRACK model is used to estimate regional concentrations of primary particulate matter (PM) and this model also provides the split between UK and non-UK primary PM.
Contribution of UK sources to UK PM2.5
Mitigation of United Kingdom PM2.5 Concentrations
6
Traffic non-exhaust Sea salt Other
Secondary inorganic aerosol Secondary organic aerosol Mineral dust/soilPrimary
PCM (updated since AQEG Report)
23%
32%17%
10%
4%
5%
9%
Yin et al. (2010)
Soil and dust
Off-road/smoking engines
Industry/commercial/domestic
Other/residual
Traffic (exhaust, brake and tyre)
Secondary inorganic aerosol
Secondary organic aerosol
Sea salt
7%
44%
14%
13%
7%
10%
2% 3%
Figure 1 (Figure 4.12 in AQEG, 2012): Comparison of PCM model output for 2010 (top, population-weighted mean modelled PM2.5 = 10.29 µg m-3) and Yin et al. (2010) (bottom, CMB model output for 2007-08, for source apportionment of PM2.5 in Birmingham; annual average measured = 11.63 µg m-3).
7
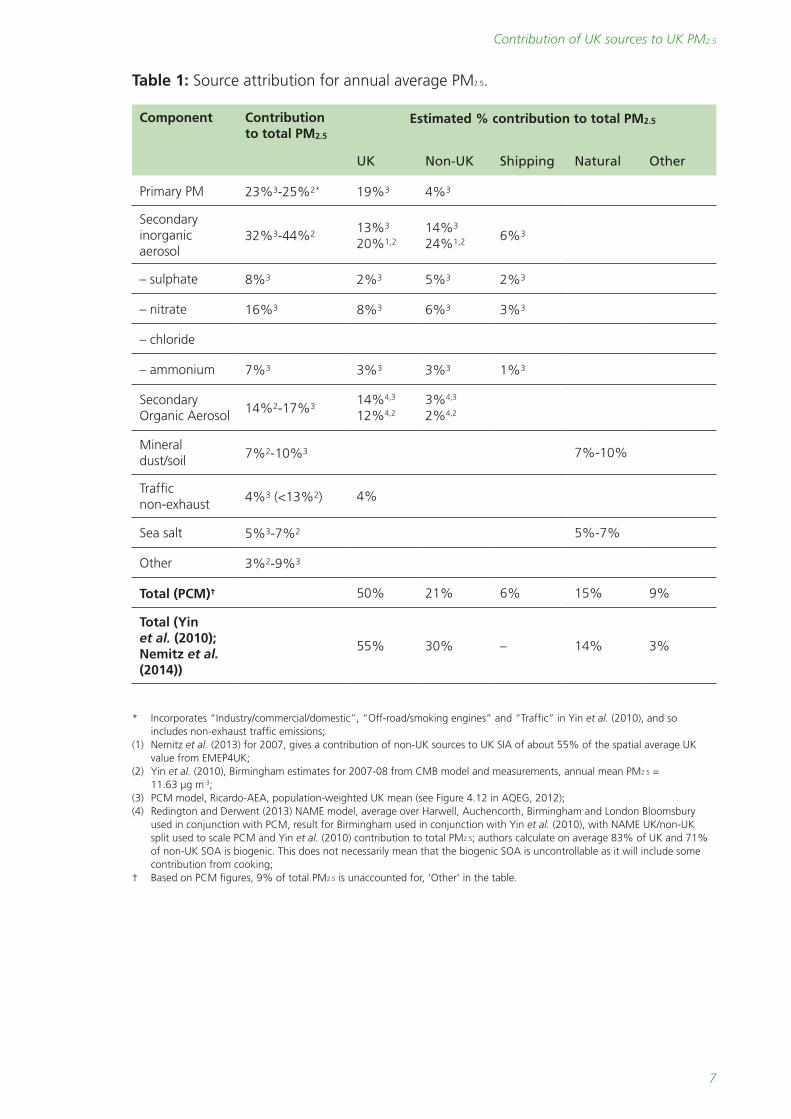
Table 1: Source attribution for annual average PM2.5.
Component Contribution to total PM2.5
Estimated % contribution to total PM2.5
UK Non-UK Shipping Natural Other
Primary PM 23%3-25%2* 19%3 4%3
Secondary inorganic aerosol
32%3-44%2 13%3 20%1,2
14%3 24%1,2 6%3
– sulphate 8%3 2%3 5%3 2%3
– nitrate 16%3 8%3 6%3 3%3
– chloride
– ammonium 7%3 3%3 3%3 1%3
Secondary Organic Aerosol 14%2-17%3 14%4,3
12%4,2
3%4,3 2%4,2
Mineral dust/soil 7%2-10%3 7%-10%
Traffic non-exhaust 4%3 (<13%2) 4%
Sea salt 5%3-7%2 5%-7%
Other 3%2-9%3
Total (PCM)† 50% 21% 6% 15% 9%
Total (Yin et al. (2010); Nemitz et al. (2014))
55% 30% – 14% 3%
* Incorporates “Industry/commercial/domestic”, “Off-road/smoking engines” and “Traffic” in Yin et al. (2010), and so includes non-exhaust traffic emissions;
(1) Nemitz et al. (2013) for 2007, gives a contribution of non-UK sources to UK SIA of about 55% of the spatial average UK value from EMEP4UK;
(2) Yin et al. (2010), Birmingham estimates for 2007-08 from CMB model and measurements, annual mean PM2.5 = 11.63 µg m-3;
(3) PCM model, Ricardo-AEA, population-weighted UK mean (see Figure 4.12 in AQEG, 2012); (4) Redington and Derwent (2013) NAME model, average over Harwell, Auchencorth, Birmingham and London Bloomsbury
used in conjunction with PCM, result for Birmingham used in conjunction with Yin et al. (2010), with NAME UK/non-UK split used to scale PCM and Yin et al. (2010) contribution to total PM2.5; authors calculate on average 83% of UK and 71% of non-UK SOA is biogenic. This does not necessarily mean that the biogenic SOA is uncontrollable as it will include some contribution from cooking;
† Based on PCM figures, 9% of total PM2.5 is unaccounted for, ‘Other’ in the table.
Contribution of UK sources to UK PM2.5
Mitigation of United Kingdom PM2.5 Concentrations
8
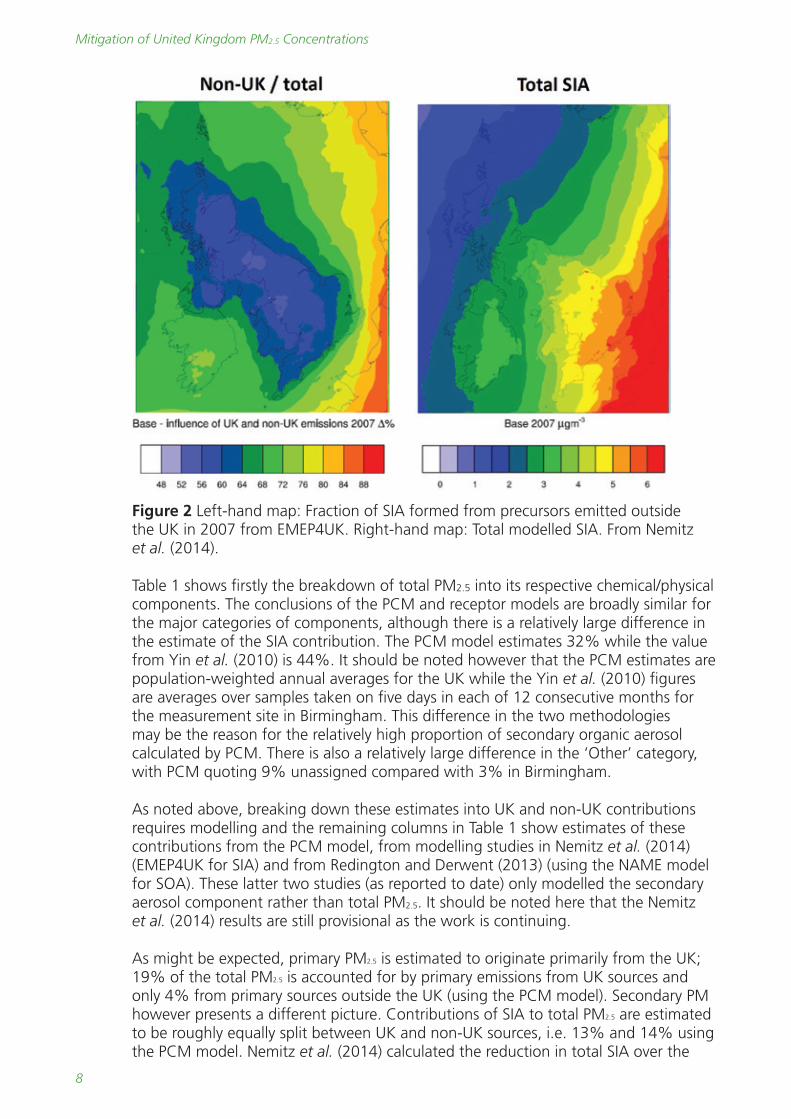
Figure 2 Left-hand map: Fraction of SIA formed from precursors emitted outside the UK in 2007 from EMEP4UK. Right-hand map: Total modelled SIA. From Nemitz et al. (2014).
Table 1 shows firstly the breakdown of total PM2.5 into its respective chemical/physical components. The conclusions of the PCM and receptor models are broadly similar for the major categories of components, although there is a relatively large difference in the estimate of the SIA contribution. The PCM model estimates 32% while the value from Yin et al. (2010) is 44%. It should be noted however that the PCM estimates are population-weighted annual averages for the UK while the Yin et al. (2010) figures are averages over samples taken on five days in each of 12 consecutive months for the measurement site in Birmingham. This difference in the two methodologies may be the reason for the relatively high proportion of secondary organic aerosol calculated by PCM. There is also a relatively large difference in the ‘Other’ category, with PCM quoting 9% unassigned compared with 3% in Birmingham.
As noted above, breaking down these estimates into UK and non-UK contributions requires modelling and the remaining columns in Table 1 show estimates of these contributions from the PCM model, from modelling studies in Nemitz et al. (2014) (EMEP4UK for SIA) and from Redington and Derwent (2013) (using the NAME model for SOA). These latter two studies (as reported to date) only modelled the secondary aerosol component rather than total PM2.5. It should be noted here that the Nemitz et al. (2014) results are still provisional as the work is continuing.
As might be expected, primary PM2.5 is estimated to originate primarily from the UK; 19% of the total PM2.5 is accounted for by primary emissions from UK sources and only 4% from primary sources outside the UK (using the PCM model). Secondary PM however presents a different picture. Contributions of SIA to total PM2.5 are estimated to be roughly equally split between UK and non-UK sources, i.e. 13% and 14% using the PCM model. Nemitz et al. (2014) calculated the reduction in total SIA over the
9
whole UK arising from switching off UK sources as 46% (rounding 45.8% to a whole number) and from switching off the sources in the rest of Europe as 65%. There thus appears to be a small degree of non-linearity in the modelled results. Accordingly the UK/non-UK split was assumed to be pro rata with 46% and 65%. Taking the PCM and Yin et al. (2010) estimates of the SIA contribution in mass terms to total PM2.5 mass gives an SIA contribution based on Nemitz et al. (2014) from non-UK sources of 15%-20% of total PM2.5. The comparison with the source-apportioned PCM model and this estimate of Nemitz et al. (2014) is thus very good (14% compared with 15% from non-UK sources) but the higher end of the range driven by the Yin et al. (2010) estimate is rather larger.
A recent study by Redington and Derwent (2013) found that the greatest import of PM from Europe was seen in southern England. The model found that European emissions contribute 20-30% of PM2.5 in southern England. Of this, sulphate and nitrate aerosol together make up ~75% of imported PM2.5. Shipping emissions contribute 5-10% of PM2.5 in southern England.
The estimates of contributions to SOA from Redington and Derwent (2013) averaged over four sites across the UK (Auchencorth, Birmingham Centre, Harwell and London Bloomsbury) are, in mass terms, 1.0 µg m-3 and 0.2 µg m-3 from UK and non-UK sources respectively. The authors calculate that 83% of UK SOA and 71% of non-UK SOA is biogenic in origin. This will not all be uncontrollable as the biogenic SOA will include some contribution from cooking. The UK and non-UK splits in Table 1 have been calculated by splitting the estimated contribution to total PM2.5 in the ratio of the NAME modelled UK/non-UK splits of Redington and Derwent (2013). So, for the PCM model, SOA contributes 17% of the total PM2.5 and this has been split in the ratio 1:0.2. It should be noted that the concentrations of SOA are subject to at least an order of magnitude uncertainty since the authors scaled up the non-methane volatile organic compound (NMVOC) emissions in the model by a factor of 5 to allow for unaccounted for large carbon number VOC emissions in the inventories.
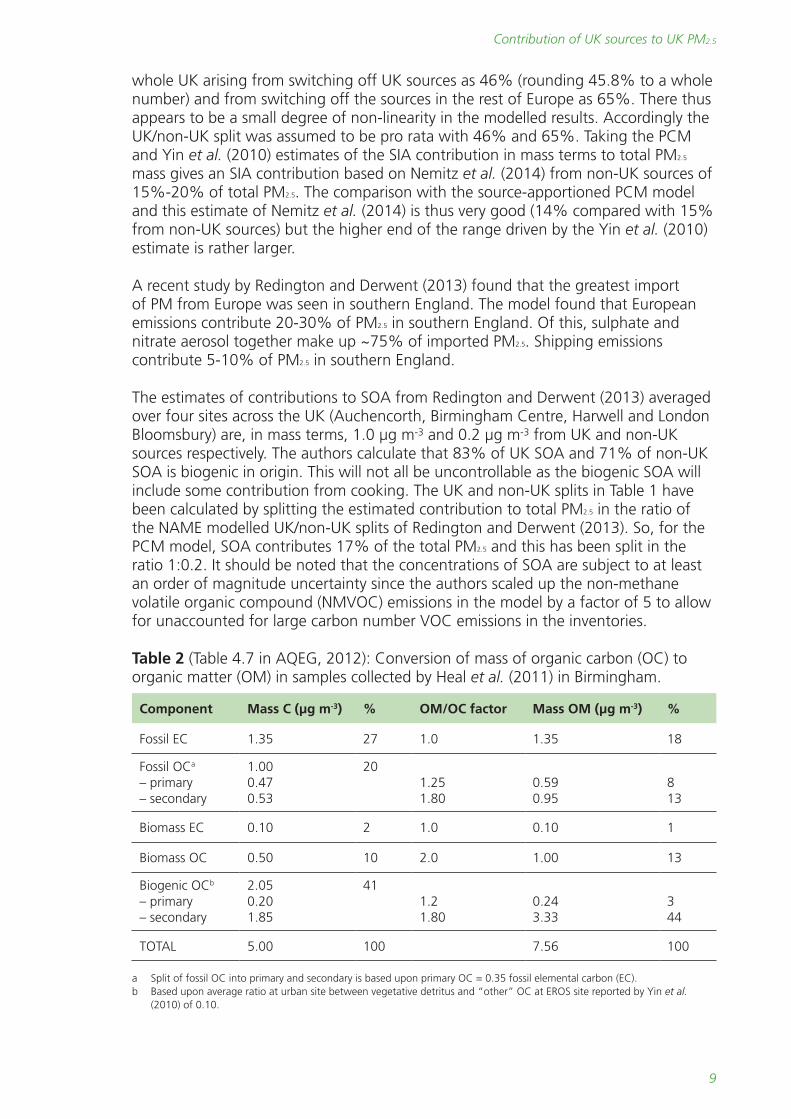
Table 2 (Table 4.7 in AQEG, 2012): Conversion of mass of organic carbon (OC) to organic matter (OM) in samples collected by Heal et al. (2011) in Birmingham.
Component Mass C (µg m-3) % OM/OC factor Mass OM (µg m-3) %
Fossil EC 1.35 27 1.0 1.35 18
Fossil OCa
– primary– secondary
1.000.470.53
201.251.80
0.590.95
813
Biomass EC 0.10 2 1.0 0.10 1
Biomass OC 0.50 10 2.0 1.00 13
Biogenic OCb
– primary– secondary
2.050.201.85
411.21.80
0.243.33
344
TOTAL 5.00 100 7.56 100
a Split of fossil OC into primary and secondary is based upon primary OC = 0.35 fossil elemental carbon (EC).b Based upon average ratio at urban site between vegetative detritus and “other” OC at EROS site reported by Yin et al.
(2010) of 0.10.
Contribution of UK sources to UK PM2.5
Mitigation of United Kingdom PM2.5 Concentrations
10
The results for carbonaceous components of PM2.5 shown in Table 2, based on measurements in Birmingham, are broadly consistent with the results of Redington and Derwent (2013), in that the larger part of the SOA arises from biogenic sources. Direct comparisons of the two studies are difficult as the two papers disaggregate the aerosol into different categories. The results in Table 2 show that, in terms of mass of organic matter (OM), fossil elemental carbon (EC) + fossil organic carbon (OC) is 2.89 µg m-3, while biomass EC + biomass OC + biogenic OC is 4.67 µg m-3
at this particular site in Birmingham. As noted elsewhere, it is likely that some of the biomass fraction results from cooking activities and biomass combustion so the biomass fraction is not all uncontrollable.
In summary, we can conclude that the data shown in Table 1 suggest that around 50% of the PM2.5 measured in the UK (as a population-weighted mean over the whole territory) arises from UK sources. About 15% arises from natural sources (mineral dust, soil, sea salt, etc.). However, this figure of ~50% from UK sources may be an underestimate. The results of the PCM model suggest that 9% of the PM2.5 is unaccounted for. If all this were from UK sources then, including some UK shipping, the total arising from UK sources could be as high as ~60%.
Alternatively, we could base the estimates on the source apportionment of Yin et al. (2010) and use the split of SIA from Nemitz et al. (2014) which finds reductions in total SIA of 64.6% when European sources are switched off, and 45.8% when UK sources are switched off. The SIA contribution of Yin et al. (2010) has therefore been given a UK fraction of 45.8/(45.8+64.6) or ~41% and the non-UK fraction is estimated as 59%. Using these figures the UK contribution is ~55% as stated in Table 1, i.e. the UK contribution is roughly the same as the PCM estimate of ~50% (bearing in mind however that the latter may be an underestimate) but the two differ in the contribution from non-UK sources. The Yin et al. (2010) based figures show a lower ‘Other’ category (3% compared to 9%) but a higher contribution from non-UK emission sources of 30% compared with 21% from the PCM model.2
In conclusion, we can estimate the UK contribution to annual average PM2.5 concentrations across the whole UK to be at least 50% and possibly as high as 60%; other European sources contribute around 21-30% and natural sources about 15%. This suggests that action in the UK to reduce PM2.5 concentrations is important, but so too is co-operative action within the EU.
2 Note that the EU Air Quality Directive does not consider resuspended soil as ‘natural’ unless it is soil from naturally dusty places, like the Sahara.
11
2.2 UK vs. non-UK contributions to UK PM2.5 – Episodes In this section, the term ‘episode’ is generally taken to mean periods with daily
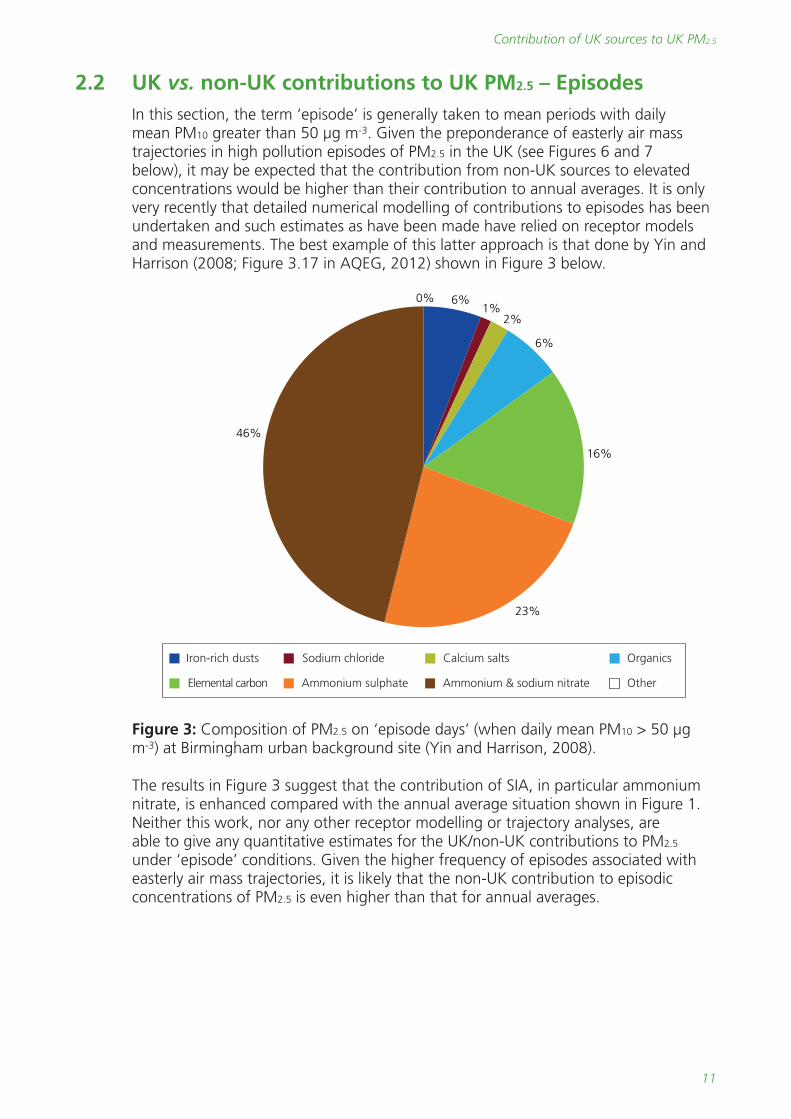
mean PM10 greater than 50 µg m-3. Given the preponderance of easterly air mass trajectories in high pollution episodes of PM2.5 in the UK (see Figures 6 and 7 below), it may be expected that the contribution from non-UK sources to elevated concentrations would be higher than their contribution to annual averages. It is only very recently that detailed numerical modelling of contributions to episodes has been undertaken and such estimates as have been made have relied on receptor models and measurements. The best example of this latter approach is that done by Yin and Harrison (2008; Figure 3.17 in AQEG, 2012) shown in Figure 3 below.
Elemental carbon Ammonium sulphate Ammonium & sodium nitrate
Sodium chloride Calcium salts Organics
Other
Iron-rich dusts
6%0%1%
2%
6%
16%
23%
46%
Figure 3: Composition of PM2.5 on ‘episode days’ (when daily mean PM10 > 50 µg m-3) at Birmingham urban background site (Yin and Harrison, 2008).
The results in Figure 3 suggest that the contribution of SIA, in particular ammonium nitrate, is enhanced compared with the annual average situation shown in Figure 1. Neither this work, nor any other receptor modelling or trajectory analyses, are able to give any quantitative estimates for the UK/non-UK contributions to PM2.5 under ‘episode’ conditions. Given the higher frequency of episodes associated with easterly air mass trajectories, it is likely that the non-UK contribution to episodic concentrations of PM2.5 is even higher than that for annual averages.
Contribution of UK sources to UK PM2.5
Mitigation of United Kingdom PM2.5 Concentrations
12
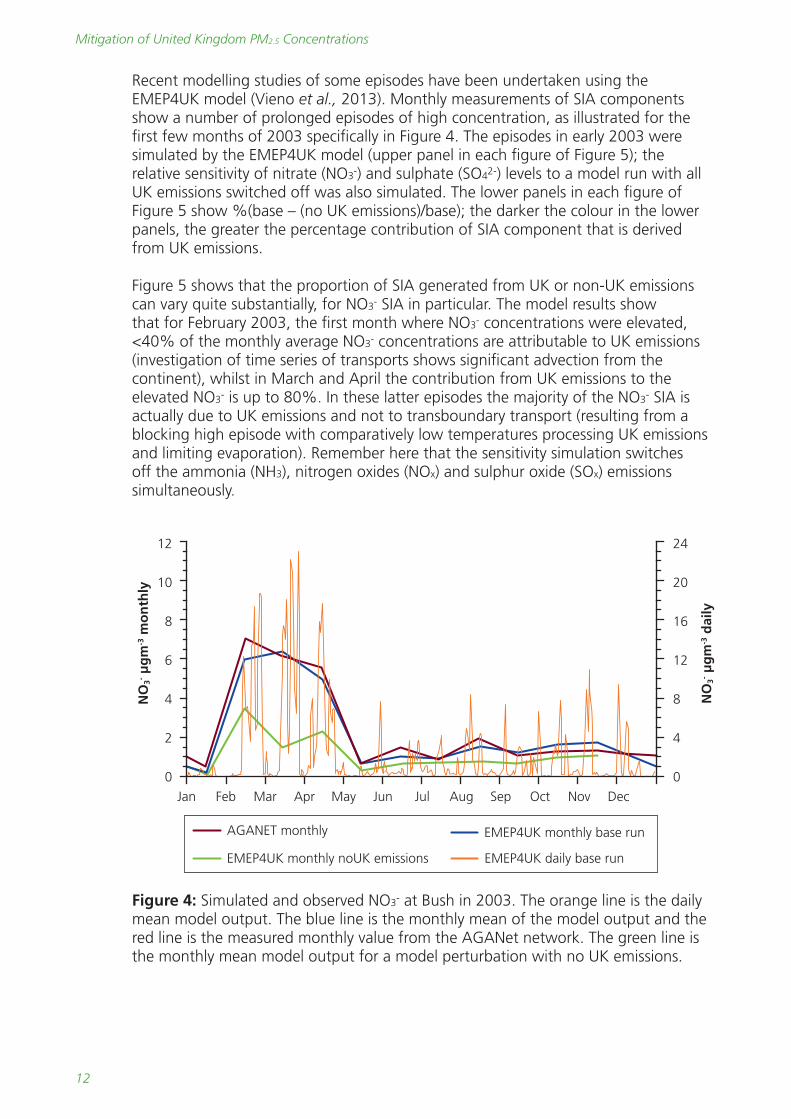
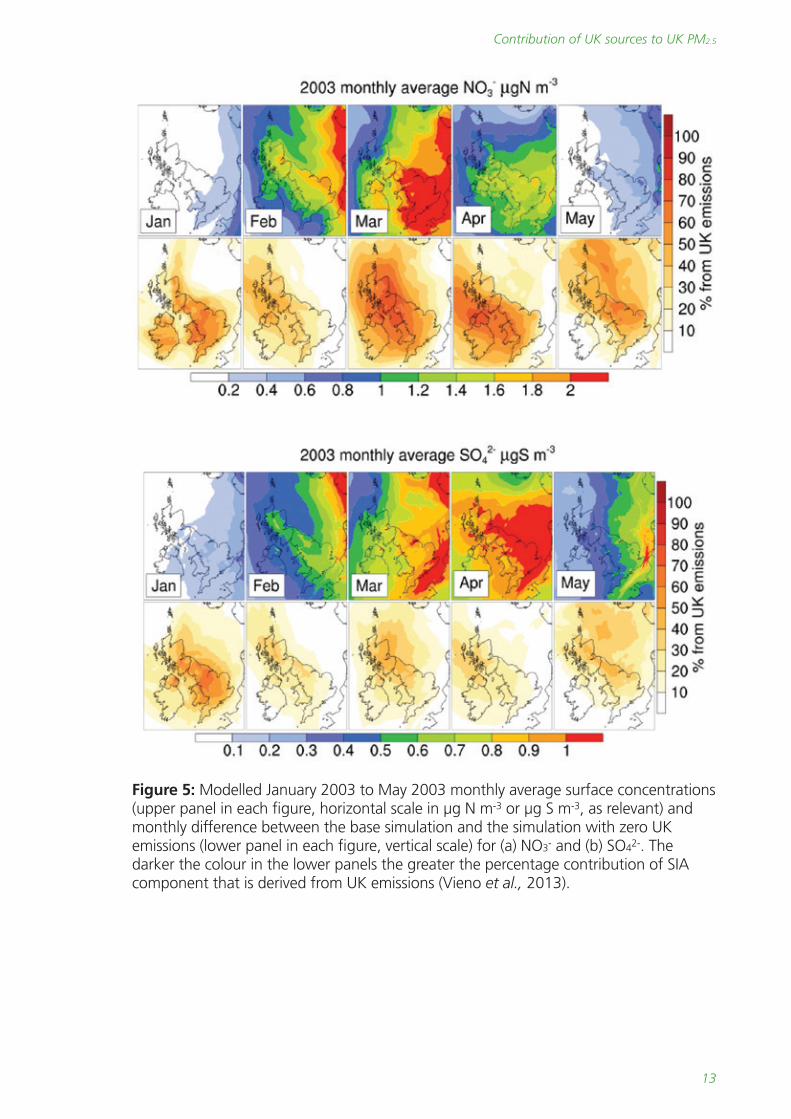
Recent modelling studies of some episodes have been undertaken using the EMEP4UK model (Vieno et al., 2013). Monthly measurements of SIA components show a number of prolonged episodes of high concentration, as illustrated for the first few months of 2003 specifically in Figure 4. The episodes in early 2003 were simulated by the EMEP4UK model (upper panel in each figure of Figure 5); the relative sensitivity of nitrate (NO3-) and sulphate (SO42-) levels to a model run with all UK emissions switched off was also simulated. The lower panels in each figure of Figure 5 show %(base – (no UK emissions)/base); the darker the colour in the lower panels, the greater the percentage contribution of SIA component that is derived from UK emissions.
Figure 5 shows that the proportion of SIA generated from UK or non-UK emissions can vary quite substantially, for NO3- SIA in particular. The model results show that for February 2003, the first month where NO3- concentrations were elevated, <40% of the monthly average NO3- concentrations are attributable to UK emissions (investigation of time series of transports shows significant advection from the continent), whilst in March and April the contribution from UK emissions to the elevated NO3- is up to 80%. In these latter episodes the majority of the NO3- SIA is actually due to UK emissions and not to transboundary transport (resulting from a blocking high episode with comparatively low temperatures processing UK emissions and limiting evaporation). Remember here that the sensitivity simulation switches off the ammonia (NH3), nitrogen oxides (NOx) and sulphur oxide (SOx) emissions simultaneously.
12
10
8
6
4
2
0Jan Feb Mar Apr May Jun Jul Aug Sep Oct Nov Dec
NO
3- µg
m-3 m
on
thly
24
20
16
12
8
4
0
NO
3- µg
m-3 d
aily
AGANET monthly EMEP4UK monthly base run
EMEP4UK monthly noUK emissions EMEP4UK daily base run
Figure 4: Simulated and observed NO3- at Bush in 2003. The orange line is the daily mean model output. The blue line is the monthly mean of the model output and the red line is the measured monthly value from the AGANet network. The green line is the monthly mean model output for a model perturbation with no UK emissions.
13
Figure 5: Modelled January 2003 to May 2003 monthly average surface concentrations (upper panel in each figure, horizontal scale in µg N m-3 or µg S m-3, as relevant) and monthly difference between the base simulation and the simulation with zero UK emissions (lower panel in each figure, vertical scale) for (a) NO3- and (b) SO42-. The darker the colour in the lower panels the greater the percentage contribution of SIA component that is derived from UK emissions (Vieno et al., 2013).
Contribution of UK sources to UK PM2.5
Mitigation of United Kingdom PM2.5 Concentrations
14
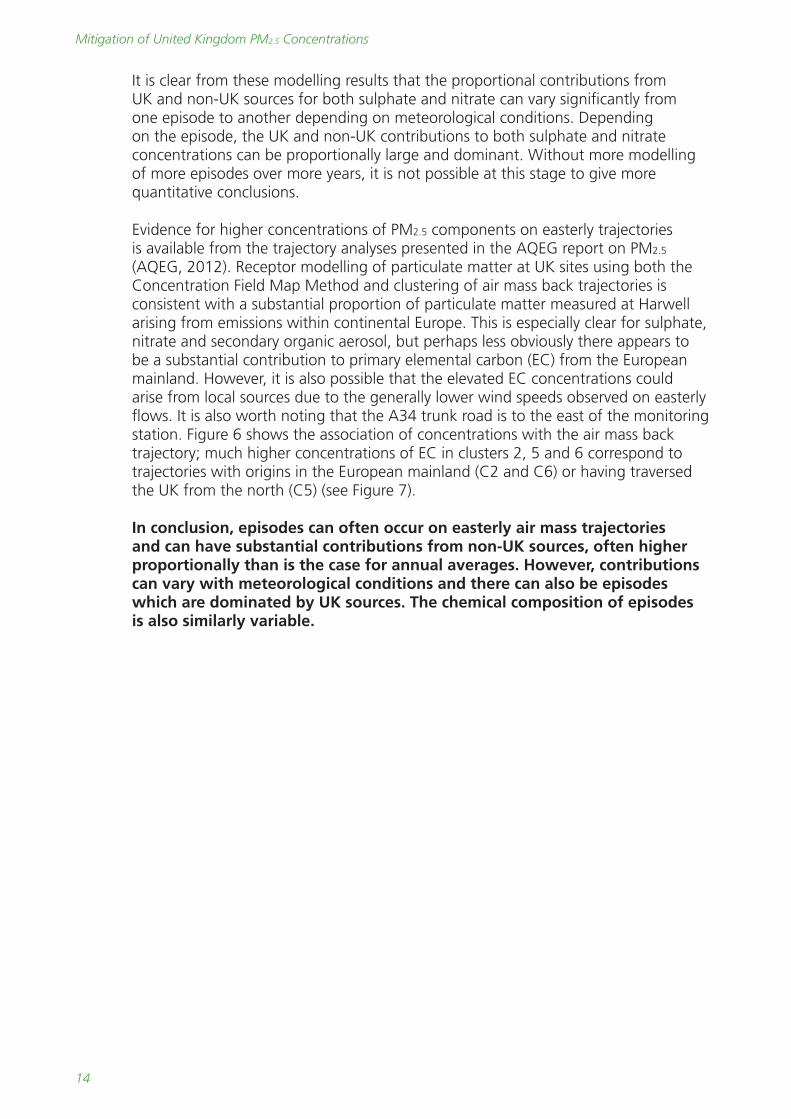
It is clear from these modelling results that the proportional contributions from UK and non-UK sources for both sulphate and nitrate can vary significantly from one episode to another depending on meteorological conditions. Depending on the episode, the UK and non-UK contributions to both sulphate and nitrate concentrations can be proportionally large and dominant. Without more modelling of more episodes over more years, it is not possible at this stage to give more quantitative conclusions.
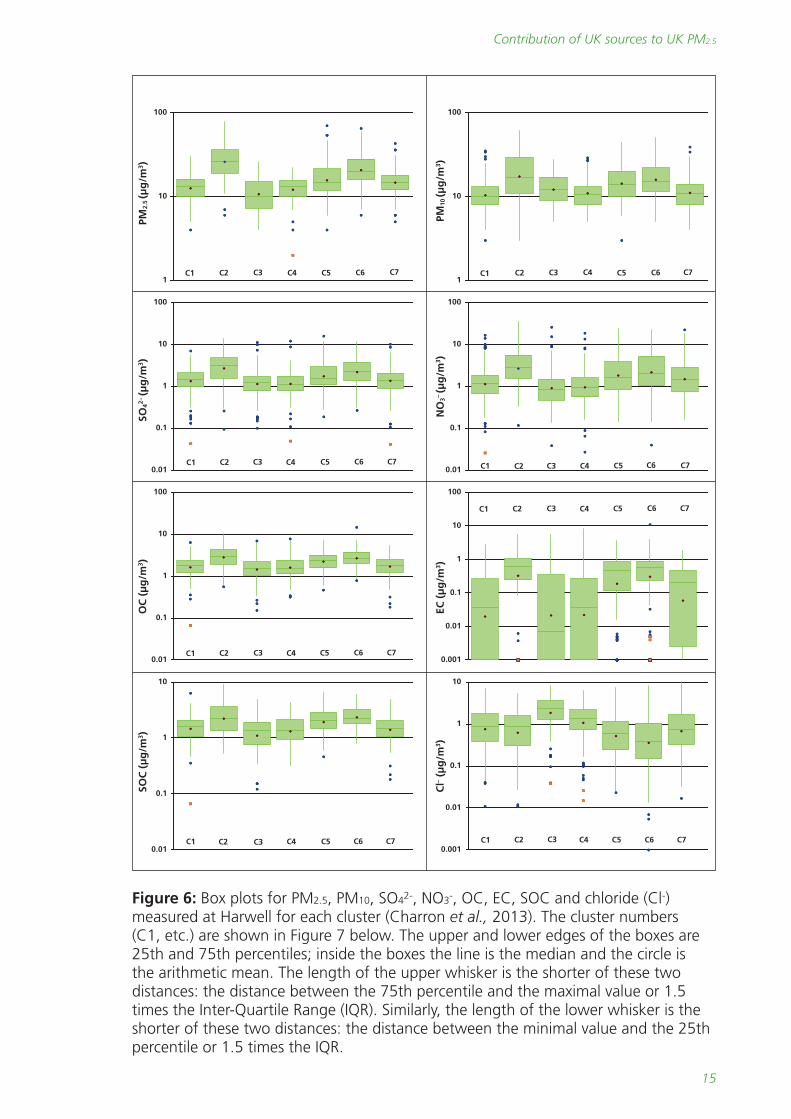
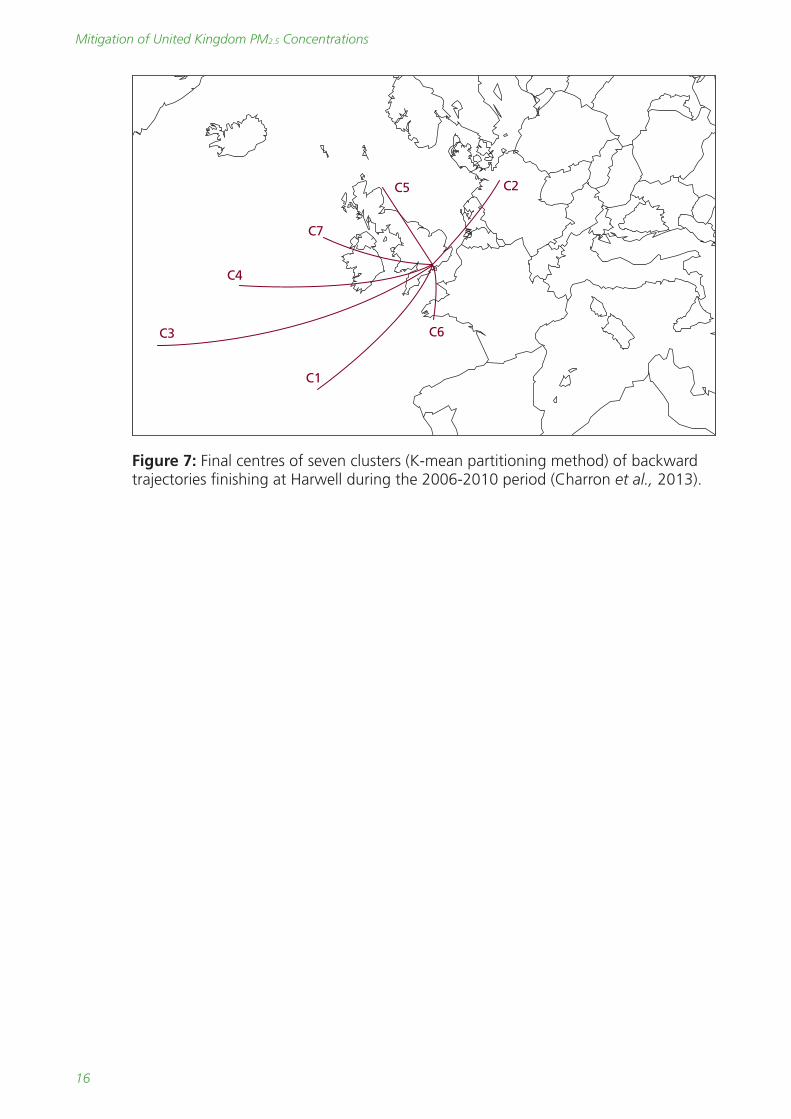
Evidence for higher concentrations of PM2.5 components on easterly trajectories is available from the trajectory analyses presented in the AQEG report on PM2.5 (AQEG, 2012). Receptor modelling of particulate matter at UK sites using both the Concentration Field Map Method and clustering of air mass back trajectories is consistent with a substantial proportion of particulate matter measured at Harwell arising from emissions within continental Europe. This is especially clear for sulphate, nitrate and secondary organic aerosol, but perhaps less obviously there appears to be a substantial contribution to primary elemental carbon (EC) from the European mainland. However, it is also possible that the elevated EC concentrations could arise from local sources due to the generally lower wind speeds observed on easterly flows. It is also worth noting that the A34 trunk road is to the east of the monitoring station. Figure 6 shows the association of concentrations with the air mass back trajectory; much higher concentrations of EC in clusters 2, 5 and 6 correspond to trajectories with origins in the European mainland (C2 and C6) or having traversed the UK from the north (C5) (see Figure 7).
In conclusion, episodes can often occur on easterly air mass trajectories and can have substantial contributions from non-UK sources, often higher proportionally than is the case for annual averages. However, contributions can vary with meteorological conditions and there can also be episodes which are dominated by UK sources. The chemical composition of episodes is also similarly variable.
15
1
10
100
C1 C2 C3 C4 C5 C6 C7
PM2.
5 (µg
/m3 )
1
10
100
C1 C2 C3 C4 C5 C6 C7
PM10
(µg
/m3 )
0.01
0.1
1
10
100
C1 C2 C3 C4 C5 C6 C7
SO42–
(µg
/m3 )
0.01
0.1
1
10
100
C1 C2 C3 C4 C5 C6 C7
NO
3– (µ
g/m
3 )
0.01
0.1
1
10
100
C1 C2 C3 C4 C5 C6 C7
OC
(µ
g/m
3 )
0.001
0.01
0.1
1
10
100
C1 C2 C3 C4 C5 C6 C7
EC (
µg
/m3 )
0.01
0.1
1
10
C1 C2 C3 C4 C5 C6 C7
SOC
(µ
g/m
3 )
0.001
0.01
0.1
1
10
C1 C2 C3 C4 C5 C6 C7
Cl– (
µg
/m3 )
Figure 6: Box plots for PM2.5, PM10, SO42-, NO3-, OC, EC, SOC and chloride (Cl-) measured at Harwell for each cluster (Charron et al., 2013). The cluster numbers (C1, etc.) are shown in Figure 7 below. The upper and lower edges of the boxes are 25th and 75th percentiles; inside the boxes the line is the median and the circle is the arithmetic mean. The length of the upper whisker is the shorter of these two distances: the distance between the 75th percentile and the maximal value or 1.5 times the Inter-Quartile Range (IQR). Similarly, the length of the lower whisker is the shorter of these two distances: the distance between the minimal value and the 25th percentile or 1.5 times the IQR.
Contribution of UK sources to UK PM2.5
Mitigation of United Kingdom PM2.5 Concentrations
16
C5 C2
C6
C1
C4
C7
C3
Figure 7: Final centres of seven clusters (K-mean partitioning method) of backward trajectories finishing at Harwell during the 2006-2010 period (Charron et al., 2013).
17
What is the role of ammonia?
3 What is the role of ammonia? The discussion in the previous section showed that ammonium sulphate and nitrate
make up a large proportion of the total mass of PM2.5 in the UK in annual average terms and probably even more on episode days. What is less well known is the role of ammonia (NH3) in reduction strategies – if one wished to reduce the PM2.5 burden, reductions of which precursor(s) would be most effective? Is the reduction of PM2.5 ammonia limited or limited by sulphur dioxide (SO2) and/or nitrogen oxides (NOx)? How strong is the case for reducing ammonia emissions, the one pollutant which has remained relatively resistant to reductions compared with other pollutants over the past few decades?
It is worth noting here that the size of the reduction in total PM2.5 mass arising from the reduction in any single component will depend to some extent on the proportional contribution of that component to the total. Moreover, there will be some components of PM2.5 which are not amenable to control – sea salt and wind-blown mineral dust being two examples – and this in turn can contribute to non-proportionality between emission reductions and resulting reductions in PM2.5 mass concentrations.
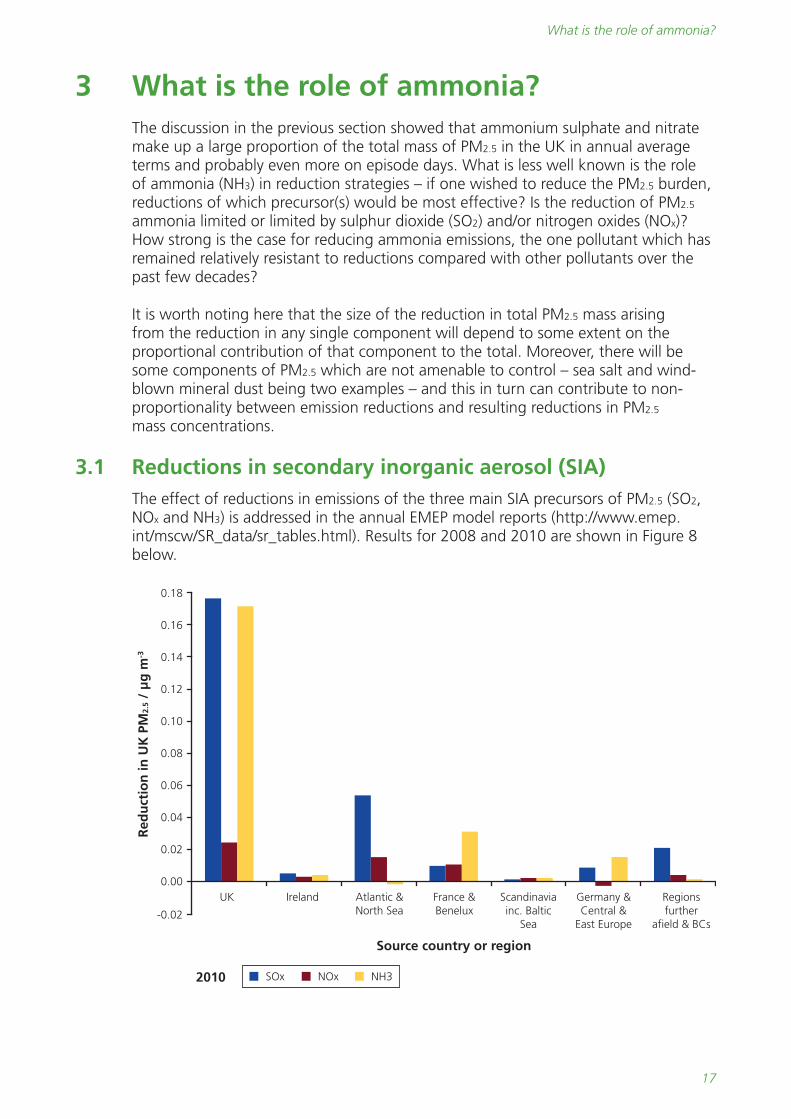
3.1 Reductions in secondary inorganic aerosol (SIA) The effect of reductions in emissions of the three main SIA precursors of PM2.5 (SO2,
NOx and NH3) is addressed in the annual EMEP model reports (http://www.emep.int/mscw/SR_data/sr_tables.html). Results for 2008 and 2010 are shown in Figure 8 below.
Red
uct
ion
in U
K P
M2.
5 /
µg
m-3
Source country or region
SOx NOx NH32010
0.18
0.16
0.12
0.14
0.10
0.08
0.06
0.04
0.02
0.00
-0.02
UK Ireland Atlantic &North Sea
France &Benelux
Scandinaviainc. Baltic
Sea
Germany &Central &
East Europe
Regionsfurther
afield & BCs

Mitigation of United Kingdom PM2.5 Concentrations
18
Red
uct
ion
in U
K P
M2.
5 /
µg
m-3
Source country or region
SOx NOx NH32008
0.08
0.07
0.06
0.05
0.04
0.03
0.02
0.01
0.00UK Ireland Atlantic &
North SeaFrance &Benelux
Scandinaviainc. Baltic
Sea
Germany &Central &
East Europe
Regionsfurther
afield & BCs
Figure 8: Reductions in UK PM2.5 due to 15% reductions in precursors of SIA in various European regions. Derived using data from www.emep.int. (Note ‘BCs’ here refers to boundary conditions in the EMEP model.)
Figure 8 illustrates the modelled reductions in UK surface PM2.5 (for 2010 and for 2008) arising from 15% reductions in anthropogenic emissions of SOx, NOx and NH3 individually from either the UK or from the other countries or geographic areas shown (data show the average change in PM2.5 across the whole of the UK).
The reduction in UK PM2.5 arising from reductions in UK emissions of NH3 is comparable to or greater than the reductions in PM2.5 arising from the same proportional reductions in UK emissions of SOx, and substantially greater than the modest reductions in UK PM2.5 arising from reductions in UK emissions of NOx.
Likewise, UK PM2.5 is considerably more sensitive to reductions in emissions of NH3 from France and the Benelux countries (Belgium, the Netherlands and Luxembourg) than to the same proportional reductions in emissions of either SOx or NOx from these countries, or even NOx from the UK. The same is also the case for reductions in NH3 emissions from Germany and other central and eastern European countries. UK PM2.5 has roughly comparable sensitivity to reductions in emissions of NH3, SOx or NOx from Ireland or from the Scandinavian countries, but the absolute contributions of emissions from these countries to UK PM2.5 are small.
The two source regions illustrated in Figure 8 where UK PM2.5 is insensitive to NH3 emissions reductions are: (i) the Atlantic and North Sea – because NH3 is not emitted from shipping; and (ii) regions further afield than those described above (i.e. Mediterranean countries, Ukraine, Bulgaria and countries eastwards, plus import at the boundary of the full EMEP domain) – this is because the shorter lifetime of NH3 makes it less subject to long-range transport. For both these latter two source regions, UK SIA PM2.5 is, as expected, most sensitive to reductions in SOx emissions.
19
What is the role of ammonia?
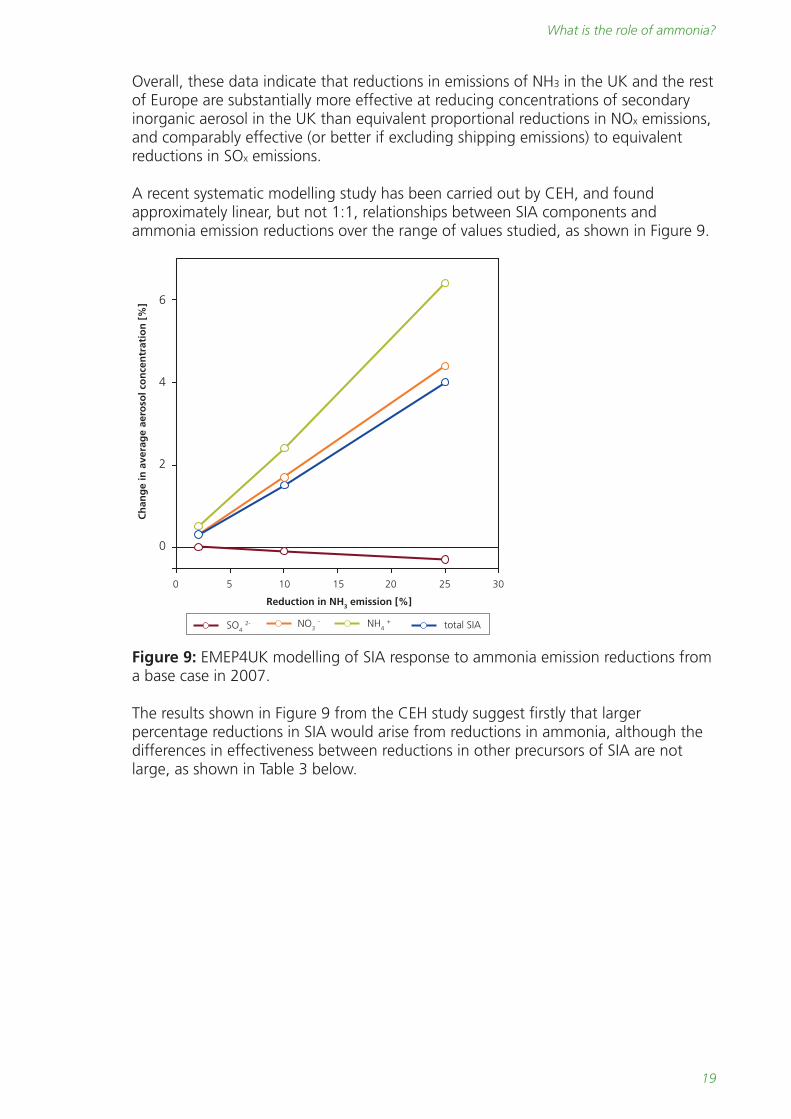
Overall, these data indicate that reductions in emissions of NH3 in the UK and the rest of Europe are substantially more effective at reducing concentrations of secondary inorganic aerosol in the UK than equivalent proportional reductions in NOx emissions, and comparably effective (or better if excluding shipping emissions) to equivalent reductions in SOx emissions.
A recent systematic modelling study has been carried out by CEH, and found approximately linear, but not 1:1, relationships between SIA components and ammonia emission reductions over the range of values studied, as shown in Figure 9.
0 5 10 15 20 25 30
6
4
2
0
Ch
ang
e in
ave
rag
e ae
roso
l co
nce
ntr
atio
n [
%]
Reduction in NH3 emission [%]
SO4 2- total SIA NO3
- NH4 +
Figure 9: EMEP4UK modelling of SIA response to ammonia emission reductions from a base case in 2007.
The results shown in Figure 9 from the CEH study suggest firstly that larger percentage reductions in SIA would arise from reductions in ammonia, although the differences in effectiveness between reductions in other precursors of SIA are not large, as shown in Table 3 below.
Mitigation of United Kingdom PM2.5 Concentrations
20
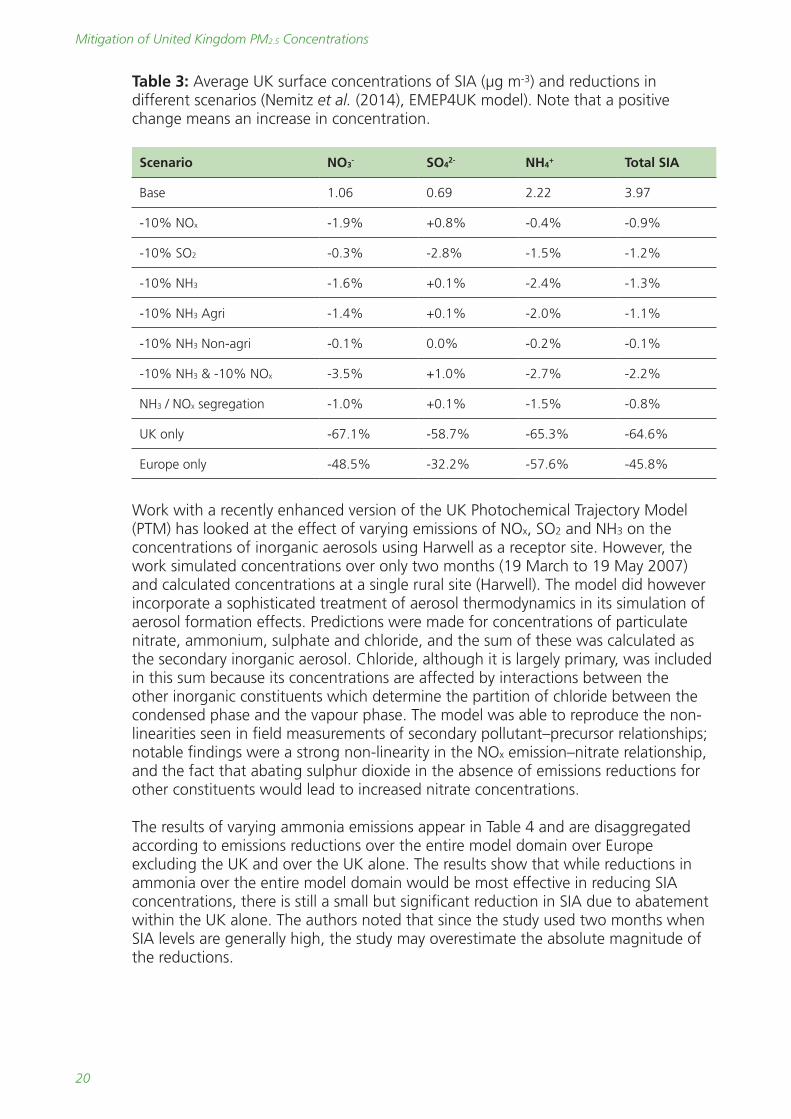
Table 3: Average UK surface concentrations of SIA (µg m-3) and reductions in different scenarios (Nemitz et al. (2014), EMEP4UK model). Note that a positive change means an increase in concentration.
Scenario NO3- SO4
2- NH4+ Total SIA
Base 1.06 0.69 2.22 3.97
-10% NOx -1.9% +0.8% -0.4% -0.9%
-10% SO2 -0.3% -2.8% -1.5% -1.2%
-10% NH3 -1.6% +0.1% -2.4% -1.3%
-10% NH3 Agri -1.4% +0.1% -2.0% -1.1%
-10% NH3 Non-agri -0.1% 0.0% -0.2% -0.1%
-10% NH3 & -10% NOx -3.5% +1.0% -2.7% -2.2%
NH3 / NOx segregation -1.0% +0.1% -1.5% -0.8%
UK only -67.1% -58.7% -65.3% -64.6%
Europe only -48.5% -32.2% -57.6% -45.8%
Work with a recently enhanced version of the UK Photochemical Trajectory Model (PTM) has looked at the effect of varying emissions of NOx, SO2 and NH3 on the concentrations of inorganic aerosols using Harwell as a receptor site. However, the work simulated concentrations over only two months (19 March to 19 May 2007) and calculated concentrations at a single rural site (Harwell). The model did however incorporate a sophisticated treatment of aerosol thermodynamics in its simulation of aerosol formation effects. Predictions were made for concentrations of particulate nitrate, ammonium, sulphate and chloride, and the sum of these was calculated as the secondary inorganic aerosol. Chloride, although it is largely primary, was included in this sum because its concentrations are affected by interactions between the other inorganic constituents which determine the partition of chloride between the condensed phase and the vapour phase. The model was able to reproduce the non-linearities seen in field measurements of secondary pollutant–precursor relationships; notable findings were a strong non-linearity in the NOx emission–nitrate relationship, and the fact that abating sulphur dioxide in the absence of emissions reductions for other constituents would lead to increased nitrate concentrations.
The results of varying ammonia emissions appear in Table 4 and are disaggregated according to emissions reductions over the entire model domain over Europe excluding the UK and over the UK alone. The results show that while reductions in ammonia over the entire model domain would be most effective in reducing SIA concentrations, there is still a small but significant reduction in SIA due to abatement within the UK alone. The authors noted that since the study used two months when SIA levels are generally high, the study may overestimate the absolute magnitude of the reductions.
21
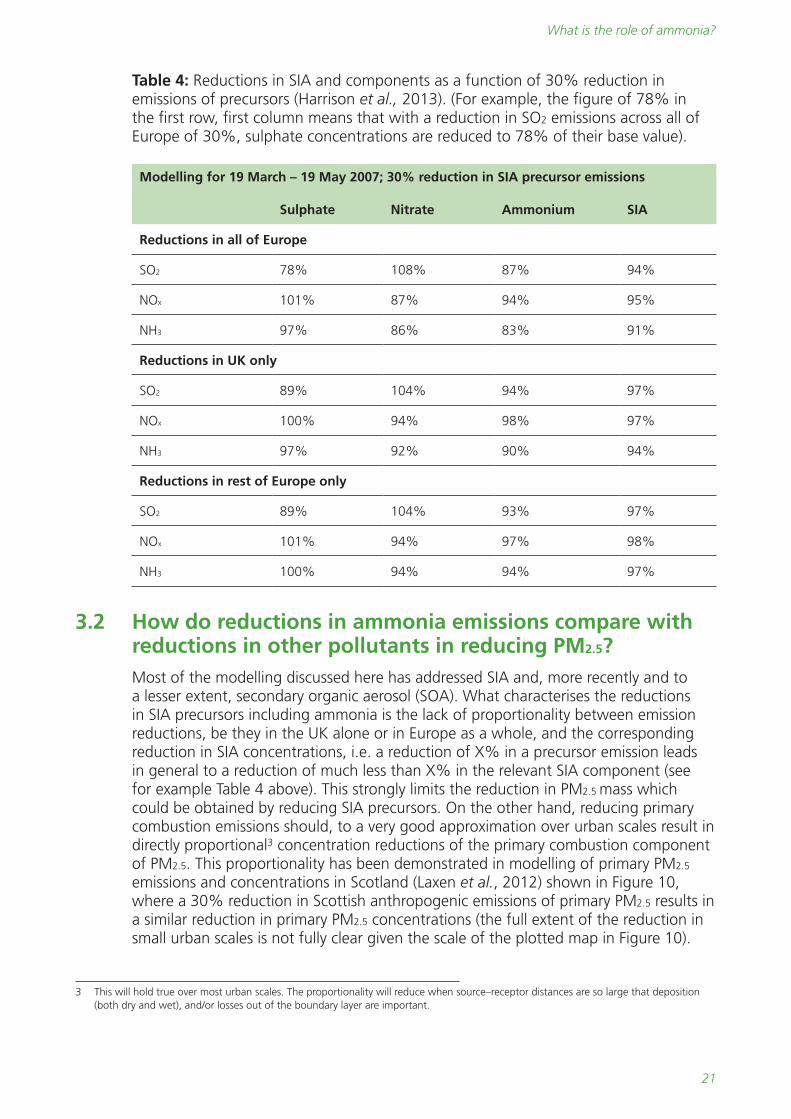
Table 4: Reductions in SIA and components as a function of 30% reduction in emissions of precursors (Harrison et al., 2013). (For example, the figure of 78% in the first row, first column means that with a reduction in SO2 emissions across all of Europe of 30%, sulphate concentrations are reduced to 78% of their base value).
Modelling for 19 March – 19 May 2007; 30% reduction in SIA precursor emissions
Sulphate Nitrate Ammonium SIA
Reductions in all of Europe
SO2 78% 108% 87% 94%
NOx 101% 87% 94% 95%
NH3 97% 86% 83% 91%
Reductions in UK only
SO2 89% 104% 94% 97%
NOx 100% 94% 98% 97%
NH3 97% 92% 90% 94%
Reductions in rest of Europe only
SO2 89% 104% 93% 97%
NOx 101% 94% 97% 98%
NH3 100% 94% 94% 97%
3.2 How do reductions in ammonia emissions compare with reductions in other pollutants in reducing PM2.5?
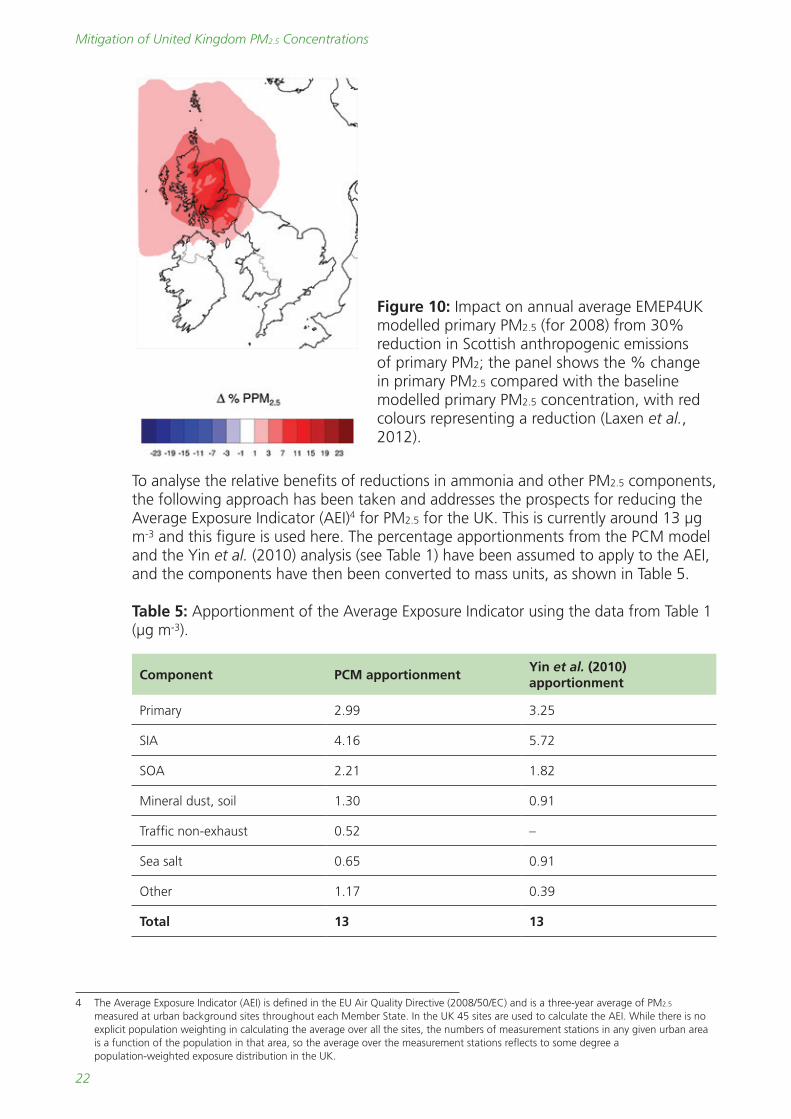
Most of the modelling discussed here has addressed SIA and, more recently and to a lesser extent, secondary organic aerosol (SOA). What characterises the reductions in SIA precursors including ammonia is the lack of proportionality between emission reductions, be they in the UK alone or in Europe as a whole, and the corresponding reduction in SIA concentrations, i.e. a reduction of X% in a precursor emission leads in general to a reduction of much less than X% in the relevant SIA component (see for example Table 4 above). This strongly limits the reduction in PM2.5 mass which could be obtained by reducing SIA precursors. On the other hand, reducing primary combustion emissions should, to a very good approximation over urban scales result in directly proportional3 concentration reductions of the primary combustion component of PM2.5. This proportionality has been demonstrated in modelling of primary PM2.5 emissions and concentrations in Scotland (Laxen et al., 2012) shown in Figure 10, where a 30% reduction in Scottish anthropogenic emissions of primary PM2.5 results in a similar reduction in primary PM2.5 concentrations (the full extent of the reduction in small urban scales is not fully clear given the scale of the plotted map in Figure 10).
3 This will hold true over most urban scales. The proportionality will reduce when source–receptor distances are so large that deposition (both dry and wet), and/or losses out of the boundary layer are important.
What is the role of ammonia?
Mitigation of United Kingdom PM2.5 Concentrations
22
To analyse the relative benefits of reductions in ammonia and other PM2.5 components, the following approach has been taken and addresses the prospects for reducing the Average Exposure Indicator (AEI)4 for PM2.5 for the UK. This is currently around 13 µg m-3 and this figure is used here. The percentage apportionments from the PCM model and the Yin et al. (2010) analysis (see Table 1) have been assumed to apply to the AEI, and the components have then been converted to mass units, as shown in Table 5.
Table 5: Apportionment of the Average Exposure Indicator using the data from Table 1 (µg m-3).
Component PCM apportionmentYin et al. (2010) apportionment
Primary 2.99 3.25
SIA 4.16 5.72
SOA 2.21 1.82
Mineral dust, soil 1.30 0.91
Traffic non-exhaust 0.52 –
Sea salt 0.65 0.91
Other 1.17 0.39
Total 13 13
4 The Average Exposure Indicator (AEI) is defined in the EU Air Quality Directive (2008/50/EC) and is a three-year average of PM2.5 measured at urban background sites throughout each Member State. In the UK 45 sites are used to calculate the AEI. While there is no explicit population weighting in calculating the average over all the sites, the numbers of measurement stations in any given urban area is a function of the population in that area, so the average over the measurement stations reflects to some degree a population-weighted exposure distribution in the UK.
Figure 10: Impact on annual average EMEP4UK modelled primary PM2.5 (for 2008) from 30% reduction in Scottish anthropogenic emissions of primary PM2; the panel shows the % change in primary PM2.5 compared with the baseline modelled primary PM2.5 concentration, with red colours representing a reduction (Laxen et al., 2012).
23
As a first example, we will address reductions of 15% in various sources across Europe as a whole, largely to allow comparison with the EMEP-MSC-W results shown in Figure 8. We will assume that a 15% reduction in primary combustion PM2.5 will result in a 15% reduction in ambient concentrations of the primary combustion component of PM2.5; this amounts to reductions of 0.45-0.49 µg m-3 using the PCM and Yin et al. (2010) apportionments respectively.
On the basis of the Nemitz et al. (2014) study results, shown in Table 3, a 15% reduction in ammonia results in a reduction in SIA of 1.9% (assuming linearity from the 10% reduction used in Table 3), and a 15% reduction in SO2 results in a reduction in SIA of 1.8%. Ignoring this difference between the ammonia and SO2 reductions in mass terms, from Table 5, these SIA reductions are then 0.08-0.11 µg m-3. This is considerably smaller than the potential reductions in primary combustion PM2.5. It is worth noting that the modelled mass concentration of SIA in the Nemitz et al. (2014) study is 3.97-4.09 µg m-3, in good agreement with the PCM estimate in Table 5 above, derived from the Acid Gas and Aerosol Network (AGANet) measurements.
The full EMEP model reports the effect of 15% reductions in SIA precursors of PM2.5 annually, and results for 2010 and 2008 in terms of reduction of PM2.5 mass were shown in Figure 8. The problem with using these results to assess the effectiveness of emission reductions is that the accuracy of the mass reductions is unknown. Moreover, EMEP does not appear to report the total calculated mass of PM2.5 or SIA, so percentage reductions are not available.
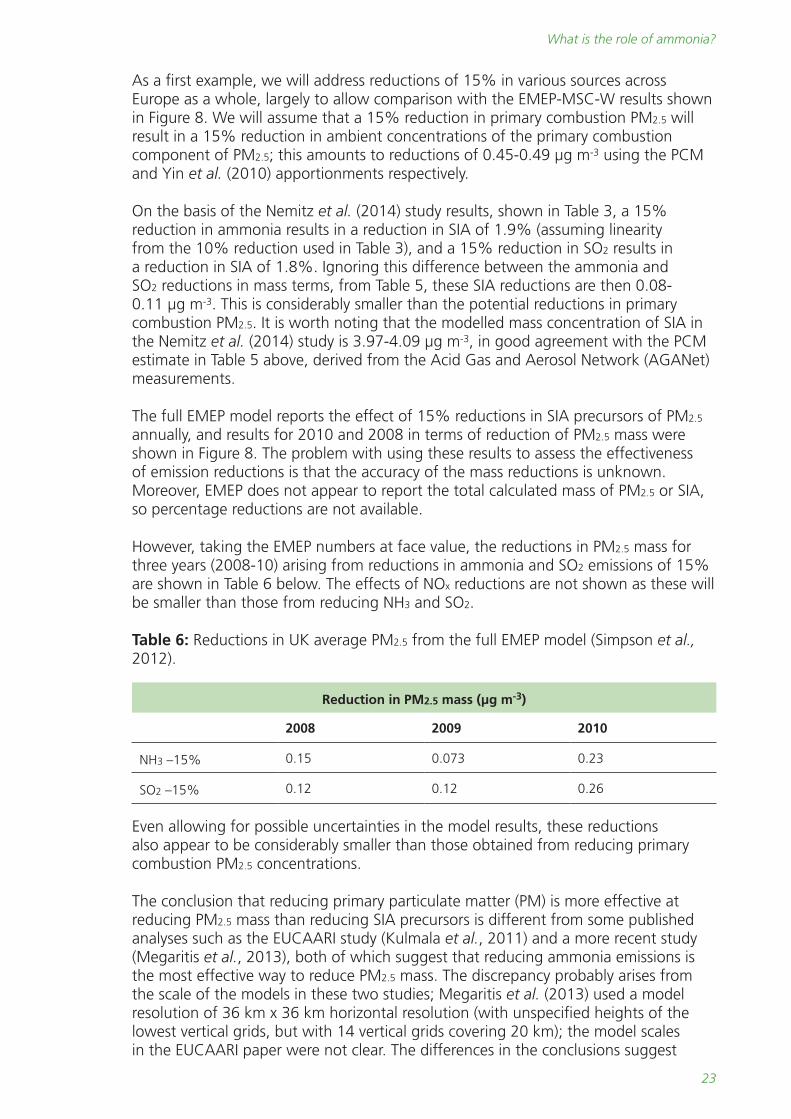
However, taking the EMEP numbers at face value, the reductions in PM2.5 mass for three years (2008-10) arising from reductions in ammonia and SO2 emissions of 15% are shown in Table 6 below. The effects of NOx reductions are not shown as these will be smaller than those from reducing NH3 and SO2.
Table 6: Reductions in UK average PM2.5 from the full EMEP model (Simpson et al., 2012).
Reduction in PM2.5 mass (µg m-3)
2008 2009 2010
NH3 –15% 0.15 0.073 0.23
SO2 –15% 0.12 0.12 0.26
Even allowing for possible uncertainties in the model results, these reductions also appear to be considerably smaller than those obtained from reducing primary combustion PM2.5 concentrations.
The conclusion that reducing primary particulate matter (PM) is more effective at reducing PM2.5 mass than reducing SIA precursors is different from some published analyses such as the EUCAARI study (Kulmala et al., 2011) and a more recent study (Megaritis et al., 2013), both of which suggest that reducing ammonia emissions is the most effective way to reduce PM2.5 mass. The discrepancy probably arises from the scale of the models in these two studies; Megaritis et al. (2013) used a model resolution of 36 km x 36 km horizontal resolution (with unspecified heights of the lowest vertical grids, but with 14 vertical grids covering 20 km); the model scales in the EUCAARI paper were not clear. The differences in the conclusions suggest
What is the role of ammonia?
Mitigation of United Kingdom PM2.5 Concentrations
24
that the models used in the EUCAARI study and in Megaritis et al. (2013) may have underestimated the contribution from urban-scale primary combustion sources and hence given too much weight to larger-scale secondary chemical processes.
Further evidence for the relative effectiveness of reductions in SIA precursors and primary PM2.5 emissions is provided by results from the EMEP4UK model (Vieno and Heal, 2013).
The EMEP4UK model, which is derived from the EMEP open source model version rv4.3 (www.emep.int), was used to calculate hourly surface concentrations of PM2.5 for the year 2010. The model uses two domains, European at 50 km x 50 km, within which the domain covering the British Isles is nested at a resolution of 5 km x 5 km. The meteorological fields are computed with the Weather Research Forecast (WRF) model version 3.1. The 2010 emissions are derived from the EMEP inventory (for the European domain), the National Atmospheric Emissions Inventory (NAEI) (for the UK) and, for shipping, the Entec inventory (Entec, 2010).
A base run and a set of five variation experiments were carried out. The experiments applied 30% reductions to UK emissions for each of the following pollutants individually:
1. NH3
2. NOx
3. SOx
4. Anthropogenic non-methane volatile organic compounds (NMVOCs)
5. Primary PM2.5
This 30% perturbation was applied to land-based emissions only; shipping emissions (both domestic and international) were left unchanged.
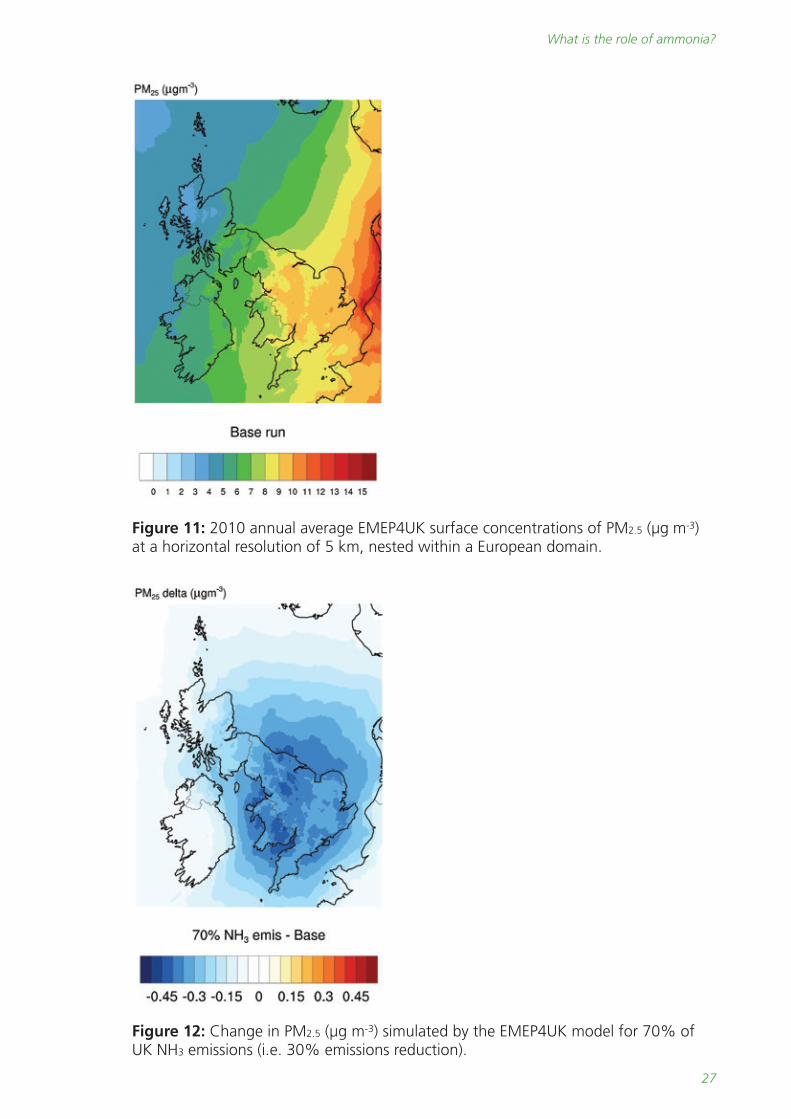
The 2010 annual average surface concentrations for PM2.5 (in µg m-3) are shown at the 5 km resolution of the domain covering the British Isles in Figure 11.
The change in annual average PM2.5 levels (in µg m-3) (compared to the baseline run of unperturbed emissions) for each model grid square resulting from the five emissions reduction experiments are shown in Figures 12-16.
The UK 2010 annual average surface concentrations of PM2.5 (Figure 11) are generally lower compared with neighbouring continental countries such as France, the Netherlands and Germany.
Overall, Figures 12-16 indicate that PM2.5 in the UK is relatively insensitive to UK reductions in emissions of individual components/precursors. The maximum reduction in UK PM2.5 concentrations reaches ~0.5 µg m-3 (~6%) for 30% reductions in UK emissions of individual species, and in most locations the reductions in PM2.5 concentrations are considerably lower. This implies that PM2.5 in the UK (where annual average concentrations are concerned) is substantially influenced by import of PM2.5, and/or by PM2.5 formed from emissions of precursors outside of the UK (and,
25
in the case of SIA, by non-linearities in the SIA chemistry). The strong influence of continental Europe is revealed by the decreasing PM2.5 concentrations away from the continent in Figure 11.
On average across the UK, the effectiveness of 30% reductions in UK emissions on PM2.5 declines in the order primary NH3, PM2.5, SOx, NOx and NMVOC, but see below key points about geographical differences in the PM2.5 reductions:
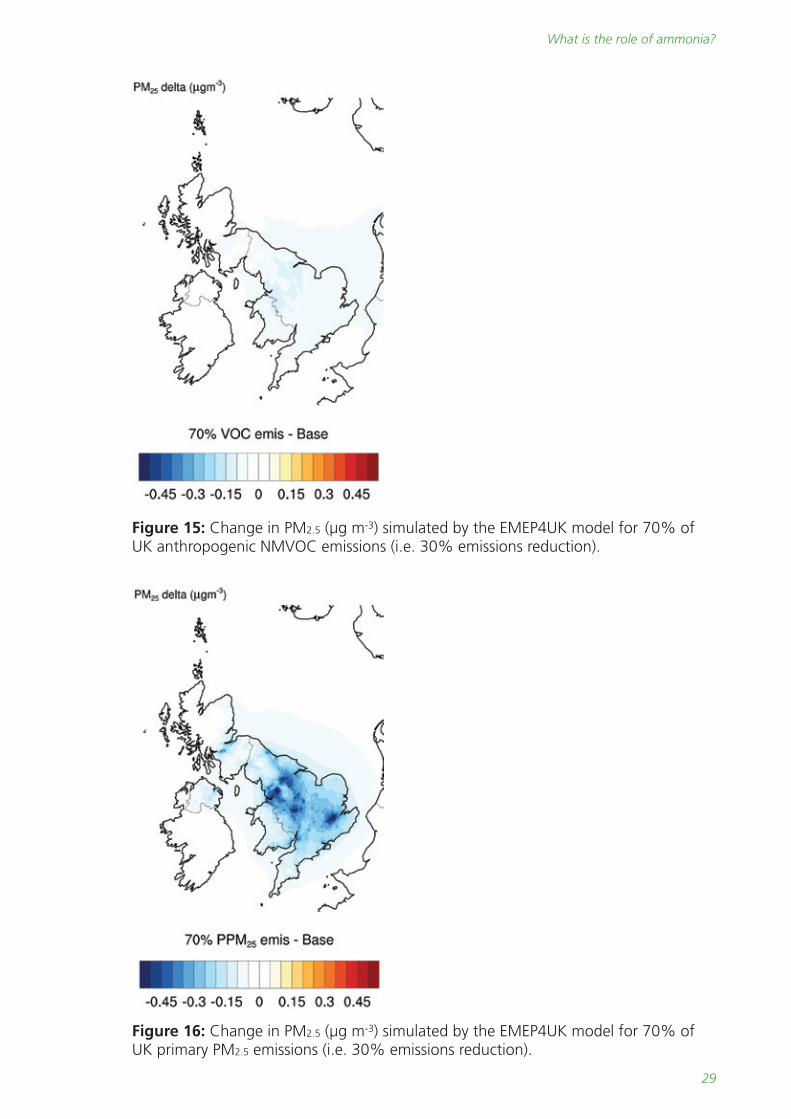
• NMVOC: The 30% reductions in NMVOC yield a maximum of 0.15 µg m-3
(1.5%) reductions in PM2.5 in central and northern England and centralScotland (Figure 15).
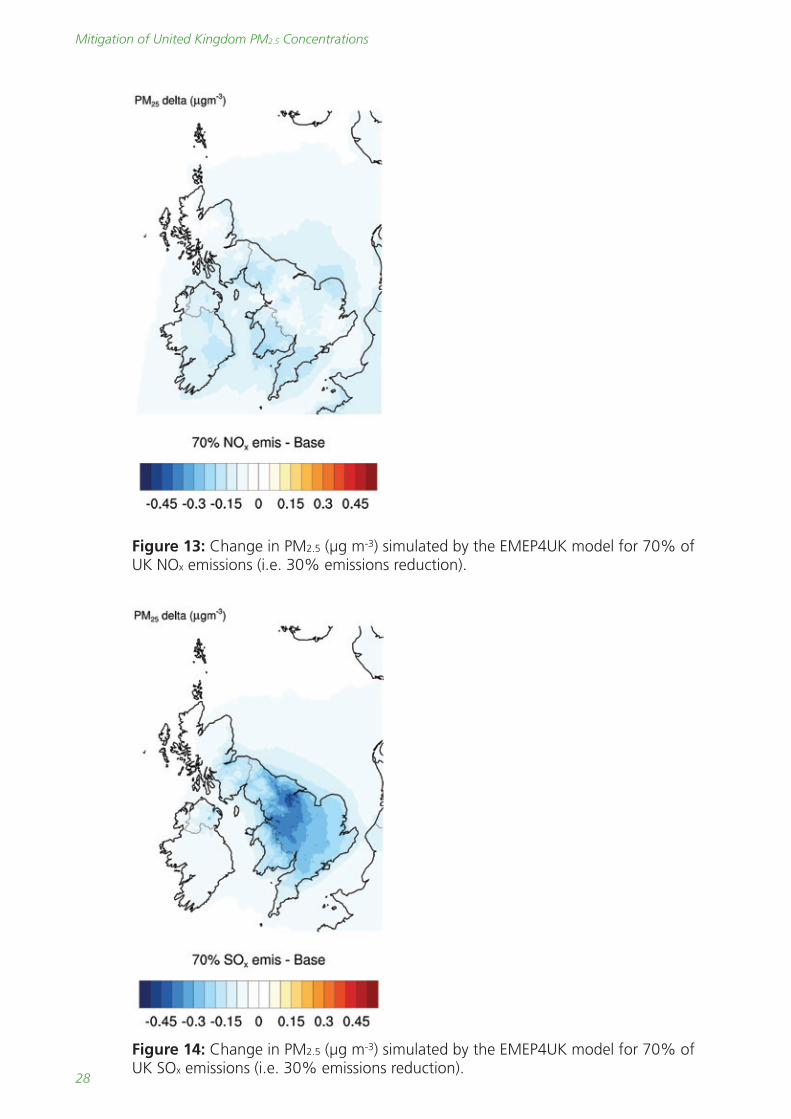
• NOx: The 30% reductions in NOx yield around 0.2 µg m-3 (3%) reductions inPM2.5 over a few rural areas, and generally a maximum of 0.15 µg m-3 (1.5%)reductions in PM2.5 over other rural areas (Figure 13). A key observation is thatreductions in PM2.5 over urban centres are smaller (no more than 0.15 µg m-3)than in rural areas for these NOx emissions reductions.
• SOx: The 30% reductions in SOx yield up to ~0.45-0.5 µg m-3 (5%) reductionsin PM2.5 in the Trent valley and up to around 0.3-0.35 µg m-3 (3%) reductionsin PM2.5 over quite wide areas of central and northern England and centralScotland (Figure 14). Again, the PM2.5 benefit is not, in general, associatedwith the major urban areas, except where these also have major SOx sourcesin the vicinity. However, it should be noted that the greater sensitivity toSOx close to power plants may be an artefact of the model assumption that5% of SOx emissions are directly in the form of SO42-, which may no longerbe appropriate for these sources or for models running at relatively highhorizontal spatial resolution.
• NH3 and PM2.5: The 30% reductions in NH3 and primary PM2.5 yield thegreatest reductions in PM2.5 (Figures 12 and 16), up to 0.45 µg m-3 for NH3
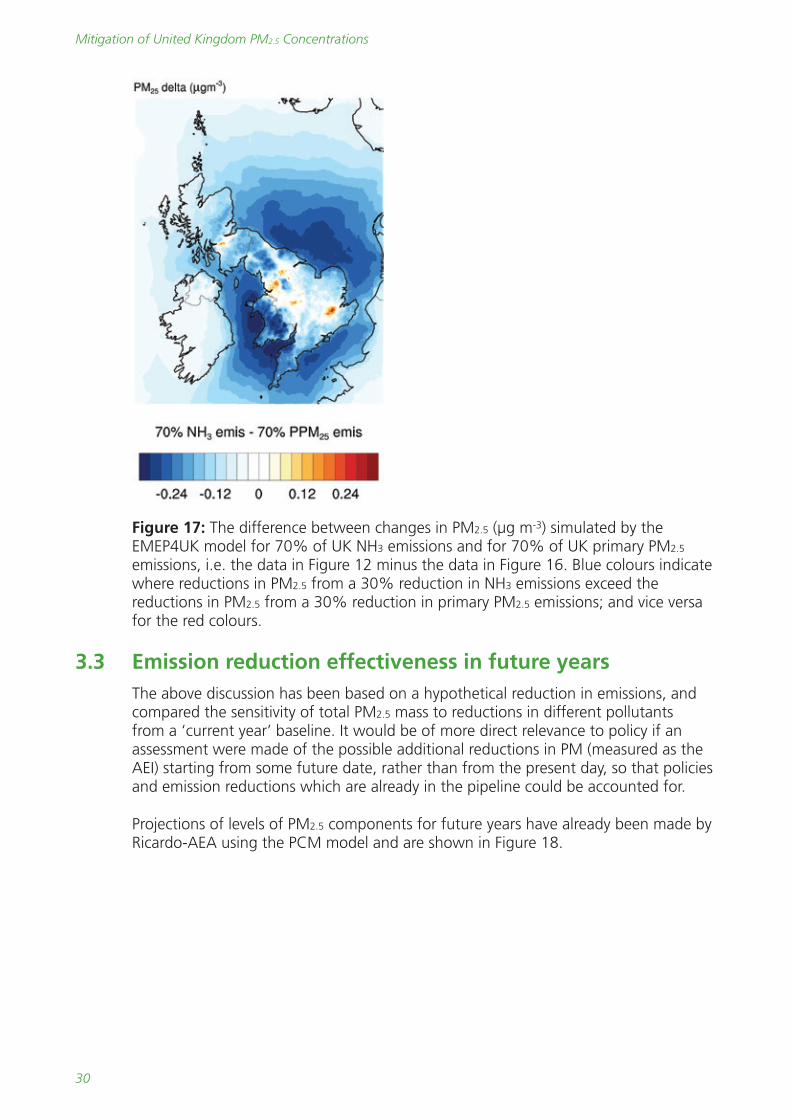
reductions and greater for primary PM2.5 reductions (up to ~6% in both cases),but the key observation is the inverse relationship in the geographic patternsof PM2.5 sensitivity to these two components. The reductions in NH3 emissionsresult in the largest PM2.5 concentration decrease in rural areas, whereasthe reductions in primary PM2.5 give the largest decrease in areas of highpopulation density. This reflects the geographical pattern of the sources andthe fact that, because of the short atmospheric lifetime of NH3, UK emissionsof NH3 generally have short-range impact. The contrast is illustrated in Figure17 which shows the data in Figure 12 minus the data in Figure 16. Bluecolours in Figure 17 indicate where reductions in PM2.5 from a 30% reductionin NH3 emissions exceed the reductions in PM2.5 from a 30% reduction inprimary PM2.5 emissions, whilst red colours indicate where reductions in PM2.5
from a 30% reduction in primary PM2.5 emissions exceed the reductionsin PM2.5 from a 30% reduction in NH3 emissions. White colours indicatecomparable reductions in PM2.5 via primary PM2.5 or NH3 emissions reductions.
What is the role of ammonia?
Mitigation of United Kingdom PM2.5 Concentrations
26
Although specific calculations for population-weighted concentrations have not been undertaken, these simulations give a clear indication that if the focus is on policies for the reduction of simple spatially-averaged PM2.5 concentrations (i.e. an ecosystem focus) then the most effective UK control (via individual precursors) is via NH3 (and SOx), but that if the focus is on human health as indicated by the AEI the most effective UK control is via UK primary PM2.5 emissions. Simulations also show that reductions in UK emissions of inorganic precursors (individually) actually have a lower impact on population exposure-weighted PM2.5 concentrations than on PM2.5 concentrations overall. EMEP4UK model results have been summarised in terms of the Average Exposure Indicator (AEI) and are presented in the next section.
Some further comments are relevant here:
• These data arise from model simulations from a single model for a single year.Other atmospheric chemistry transport models differently configured may yielddifferent values.
• Interannual variability in meteorology may also have an influence.
• The emissions reductions were applied to pollutants individually. In realityemissions reductions for pollutants may occur simultaneously.
• These simulations are based on reductions to 2010 emissions. Noconsideration has been given to the practicalities of emissions reductionsfor particular species and to particular sectors on top of future emissionsreductions already in the pipeline, although hypothetical reductions inemissions from a 2020 baseline are considered below to take into account theeffects of policies already in place.
• No consideration has been given to the potential differential toxicity ofdifferent components of PM2.5. In addition, PM2.5 has many impacts other thanon human health (although reduction in urban background concentrationsthrough the PM2.5 Average Exposure Indicator is part of legislation).
27
What is the role of ammonia?
Figure 11: 2010 annual average EMEP4UK surface concentrations of PM2.5 (µg m-3) at a horizontal resolution of 5 km, nested within a European domain.
Figure 12: Change in PM2.5 (µg m-3) simulated by the EMEP4UK model for 70% of UK NH3 emissions (i.e. 30% emissions reduction).
Mitigation of United Kingdom PM2.5 Concentrations
28
Figure 13: Change in PM2.5 (µg m-3) simulated by the EMEP4UK model for 70% of UK NOx emissions (i.e. 30% emissions reduction).
Figure 14: Change in PM2.5 (µg m-3) simulated by the EMEP4UK model for 70% of UK SOx emissions (i.e. 30% emissions reduction).
29
What is the role of ammonia?
Figure 15: Change in PM2.5 (µg m-3) simulated by the EMEP4UK model for 70% of UK anthropogenic NMVOC emissions (i.e. 30% emissions reduction).
Figure 16: Change in PM2.5 (µg m-3) simulated by the EMEP4UK model for 70% of UK primary PM2.5 emissions (i.e. 30% emissions reduction).
Mitigation of United Kingdom PM2.5 Concentrations
30
Figure 17: The difference between changes in PM2.5 (µg m-3) simulated by the EMEP4UK model for 70% of UK NH3 emissions and for 70% of UK primary PM2.5 emissions, i.e. the data in Figure 12 minus the data in Figure 16. Blue colours indicate where reductions in PM2.5 from a 30% reduction in NH3 emissions exceed the reductions in PM2.5 from a 30% reduction in primary PM2.5 emissions; and vice versa for the red colours.
3.3 Emission reduction effectiveness in future years The above discussion has been based on a hypothetical reduction in emissions, and compared the sensitivity of total PM2.5 mass to reductions in different pollutants from a ‘current year’ baseline. It would be of more direct relevance to policy if an assessment were made of the possible additional reductions in PM (measured as the AEI) starting from some future date, rather than from the present day, so that policies and emission reductions which are already in the pipeline could be accounted for.
Projections of levels of PM2.5 components for future years have already been made by Ricardo-AEA using the PCM model and are shown in Figure 18.
31
What is the role of ammonia?
02010 2015 2020 2025 2030
2
4
6
8
10
12
14
Co
ntr
ibu
tio
n t
o a
nn
ual
mea
n P
M2.
5 (µ
g m
-3)
Year
Contributions to annual mean PM2.5 (µg m-3) for AEI sites: AEI average (ER = -16%)
Urban: OtherUrban: Shipping
Urban: Aircraft
Urban: Off road mobile machinery
Urban: Domestic
Urban: Commercial
Urban: Industry
Urban: Traffic (road abrasion)
Urban: Traffic (brake and tyre wear)
Urban: Traffic (exhaust emissions)
Urban: Urban dusts
Regional: Rural Dusts
Regional: Primary PM: Member State
Regional: Primary PM: Transboundary
Regional: SIA Member State
Regional: SIA Transboundary Shipping
Regional: SIA Transboundary Other
Regional: SOA
Regional: Residual
Regional: Sea Salt
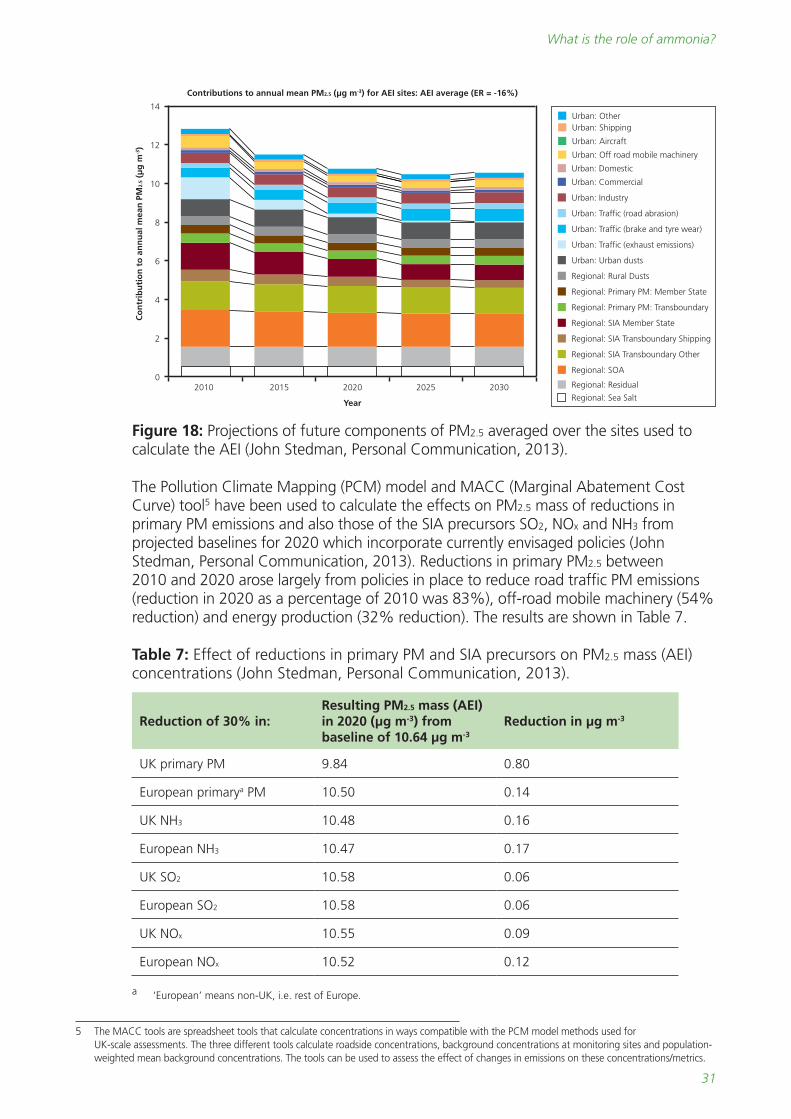
Figure 18: Projections of future components of PM2.5 averaged over the sites used to calculate the AEI (John Stedman, Personal Communication, 2013).
The Pollution Climate Mapping (PCM) model and MACC (Marginal Abatement Cost Curve) tool5 have been used to calculate the effects on PM2.5 mass of reductions in primary PM emissions and also those of the SIA precursors SO2, NOx and NH3 from projected baselines for 2020 which incorporate currently envisaged policies (John Stedman, Personal Communication, 2013). Reductions in primary PM2.5 between 2010 and 2020 arose largely from policies in place to reduce road traffic PM emissions (reduction in 2020 as a percentage of 2010 was 83%), off-road mobile machinery (54% reduction) and energy production (32% reduction). The results are shown in Table 7.
Table 7: Effect of reductions in primary PM and SIA precursors on PM2.5 mass (AEI) concentrations (John Stedman, Personal Communication, 2013).
Reduction of 30% in:Resulting PM2.5 mass (AEI) in 2020 (µg m-3) from baseline of 10.64 µg m-3
Reduction in µg m-3
UK primary PM 9.84 0.80
European primarya PM 10.50 0.14
UK NH3 10.48 0.16
European NH3 10.47 0.17
UK SO2 10.58 0.06
European SO2 10.58 0.06
UK NOx 10.55 0.09
European NOx 10.52 0.12
a ‘European’ means non-UK, i.e. rest of Europe.
5 The MACC tools are spreadsheet tools that calculate concentrations in ways compatible with the PCM model methods used for UK-scale assessments. The three different tools calculate roadside concentrations, background concentrations at monitoring sites and population-weighted mean background concentrations. The tools can be used to assess the effect of changes in emissions on these concentrations/metrics.
Mitigation of United Kingdom PM2.5 Concentrations
32
From these results it can be seen that, as was the case for the reductions in the ‘current year’, reducing primary PM is more effective than reducing any one of the SIA precursors alone. Reducing primary PM emissions across Europe results in a reduction of 0.94 µg m-3 with the bulk of this (0.80 µg m-3) arising from reductions in UK emissions, whereas reducing NH3 emissions alone across the whole of Europe only gives a reduction of 0.33 µg m-3. However, reducing all three SIA precursors over the whole of Europe results in a reduction of 0.66 µg m-3, much larger than any one single SIA precursor but still less than the effect of primary PM reductions and, in particular, less than the effects of reductions in primary PM emissions in the UK alone.
This analysis therefore suggests that the most effective marginal reductions beyond existing policies for reducing total PM2.5 mass as measured by the AEI (i.e. reflecting in a broad approximate sense overall population exposure in the UK) are likely to come from reducing primary emissions in the UK. What this analysis has not considered is the detail of how such emission reductions might be achieved, or even whether they are practicable. Nor has the analysis dealt with possible reductions in precursors of secondary organic aerosol (SOA); for good reason, since the understanding of the mechanisms, the emissions of precursors and in particular the split between natural biogenic SOA and controllable SOA are not well known at this stage. One further point to note here is that the reductions in total PM2.5 mass are relatively small, although if both primary PM and SIA precursors were reduced by 30% across the whole of Europe reductions in the AEI would amount to 1.60 µg m-3 on a base figure of 10.64 µg m-3.
Table 8 shows a comparison of the results from the PCM and EMEP4UK models for reductions in UK emissions. AEI concentrations have been calculated for each model run. A number of observations can be made. The total AEI concentration predicted by the EMEP4UK model is lower than that for the PCM model, even though the PCM model results are for a lower emission, 2020 case. This finding is partly due to the different spatial resolutions of the models. The AEI results for the PCM model are 10.64 µg m-3 for 2020 and 12.64 µg m-3 for 2010. The value for 2010 is reduced to 11.77 µg m-3 for the PCM model if calculated from 5 km x 5 km grid square averages of the 1 km x 1km grid square model results.
This difference between the PCM and EMEP4UK model results also reflects the fact that the EMEP4UK model does not include any water associated with the chemical components or include local resuspension components. The PCM model predicts a much larger reduction in AEI concentration for a 30% reduction in primary PM emissions than EMEP4UK, this is probably largely due to the different spatial resolutions of the models. The PCM model predicts a rather smaller reduction in AEI than EMEP4UK for reductions in UK NH3 or SO2 emissions and a similar reduction in AEI for reductions in UK NOx emissions.
33
What is the role of ammonia?
Table 8: Comparison between reductions in AEI concentrations arising from reductions in UK emissions calculated from PCM and EMEP4UK (µg m-3).
PCM EMEP4UK
Year 2020 2010
Baseline AEI 10.64 9.33
30% reduction in primary PM emissions -0.80 -0.38
30% reduction in NH3 emissions -0.15 -0.34
30% reduction in SO2 emissions -0.06 -0.28
30% reduction in NOx emissions -0.09 -0.10
30% reduction in VOC emissions not assessed -0.08
30% reduction in all emissions -1.10 -1.11
3.4 Some qualifying remarks and uncertainties The analysis presented in this report has used one regional chemical transport model
(EMEP4UK) and a semi-empirical model (PCM) using several methods depending on the scales of transport and dispersion. An important aspect of PCM for the analysis presented here is the method used to estimate the effect of emission reductions of precursors on SIA concentrations. Here PCM uses emission sensitivities derived from the EMEP model, so that although two models have ostensibly been used, key components of both – the SIA chemistry – derive from the same source. Nonetheless, there are good reasons for having confidence in the results.
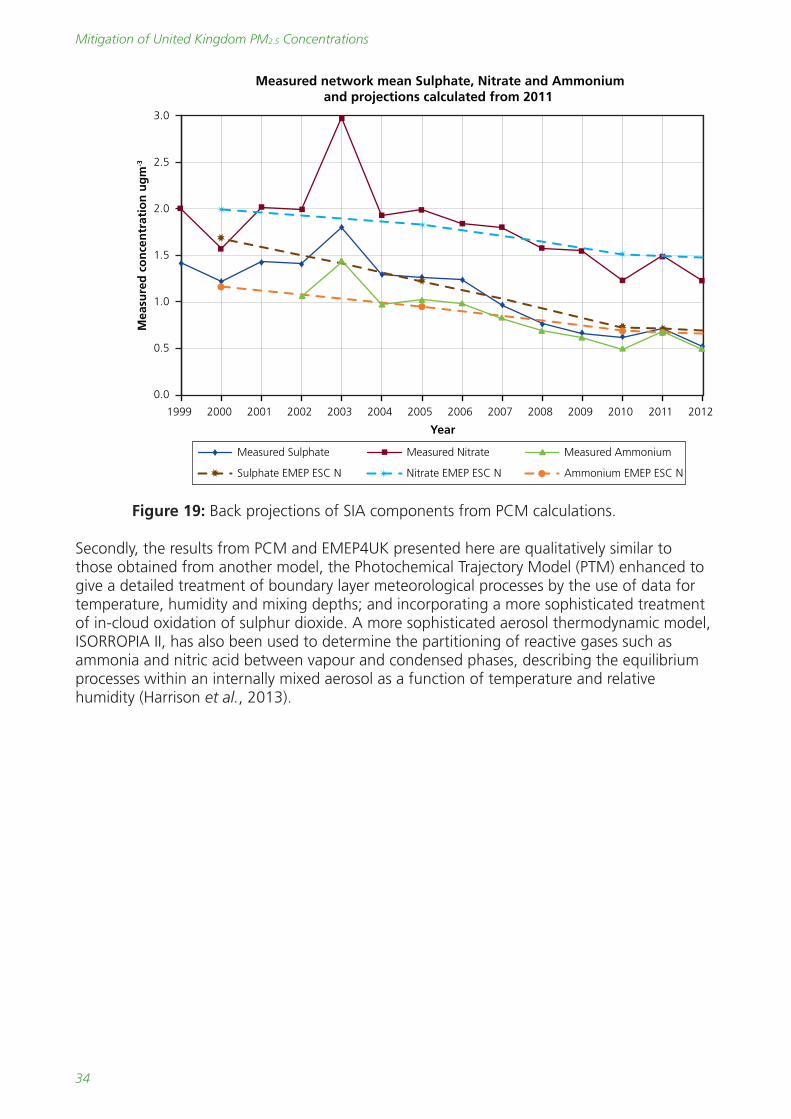
Firstly, the reductions in SIA components calculated by PCM have been compared with measurements and shown to reproduce measured trends reasonably well. Figure 19 shows backwards projections for sulphate, nitrate and ammonium calculated using the emission sensitivity coefficients from EMEP used within the PCM model, and historic emissions data from the NAEI and the EMEP inventory for the rest of Europe. These results show that these emission sensitivity coefficients can be used reasonably successfully to reproduce the observed trends in ambient concentrations (as a mean across the 12 long-running Acid Gas and Aerosol Network (AGANet) and National Ammonia Monitoring Network (NAMN) stations) and this provides some confidence in using these emission sensitivity coefficients for future projections.
Mitigation of United Kingdom PM2.5 Concentrations
34
0.0
0.5
1.0
1.5
2.0
2.5
3.0
1999 2000 2001 2002 2003 2004 2005 2006 2007 2008 2009 2010 2011 2012
Mea
sure
d c
on
cen
trat
ion
ug
m-3
Year
Measured network mean Sulphate, Nitrate and Ammoniumand projections calculated from 2011
Measured Sulphate Measured Nitrate Measured Ammonium
Sulphate EMEP ESC N Nitrate EMEP ESC N Ammonium EMEP ESC N
Figure 19: Back projections of SIA components from PCM calculations.
Secondly, the results from PCM and EMEP4UK presented here are qualitatively similar to those obtained from another model, the Photochemical Trajectory Model (PTM) enhanced to give a detailed treatment of boundary layer meteorological processes by the use of data for temperature, humidity and mixing depths; and incorporating a more sophisticated treatment of in-cloud oxidation of sulphur dioxide. A more sophisticated aerosol thermodynamic model, ISORROPIA II, has also been used to determine the partitioning of reactive gases such as ammonia and nitric acid between vapour and condensed phases, describing the equilibrium processes within an internally mixed aerosol as a function of temperature and relative humidity (Harrison et al., 2013).
35
Conclusions and recommendations
4. Conclusions and recommendations• The analysis has shown that UK emissions contribute around 50-55% of total
annual average PM2.5 in the UK. This limits the extent to which long-termaverage concentrations can be reduced by UK action alone, so that action byneighbouring countries in the EU is important in reducing annual UK PM2.5
concentrations. The largest contributions arise from France and the Beneluxcountries, Germany and Poland, but their relative importance can vary fromyear to year depending on meteorology.
• A similarly detailed analysis of PM2.5 episodes has not been feasible in thisreport, but many episodes occur on easterly winds. Consequently, given thehigher frequency of easterly air mass trajectories in episode conditions, it islikely that the non-UK contribution to episodic concentrations of PM2.5 is evenhigher than for annual averages. However, model simulations indicate thatsome secondary inorganic aerosol (SIA) episodes are also driven by UKemissions into stagnating air. The chemical composition of PM2.5 in differentepisodes can also be variable. A more detailed analysis of UK and non-UKcontributions to episodes of PM2.5 and PM10 is recommended.
• The analysis has provided some new insights into the most effective ways ofreducing PM2.5 mass in the UK. The work has shown that total PM2.5 mass isrelatively insensitive to reductions in any one individual component, such as theprecursors of SIA or primary PM2.5 emissions. The relative insensitivity of SIA toprecursor emission reductions is due largely to non-linearities in therelationship between SIA precursors and the resulting ambient concentrations.
• Reductions in emissions of primary PM2.5 and ammonia are the most effective inreducing PM2.5 mass out of the five alternatives studied (reductions in primaryparticulate matter (PM), sulphur dioxide (SO2), nitrogen oxides (NOx), volatileorganic compounds (VOCs) and ammonia emissions), as measured by theAverage Exposure Indicator (AEI). For the same percentage reductions inemissions of ammonia and primary PM, reductions in NOx, SO2 or VOCemissions result in smaller changes in total PM2.5 mass concentrations. Thesestatements refer to reductions in each of these precursors individually.
• Reductions of primary PM2.5 emissions in the UK deliver reductions in PM2.5 masspredominantly in areas of high population density, while ammonia reductions lead to decreases mainly in non-urban areas. This suggests that if the aim is to reduce impacts of PM2.5 on public health as indicated by the AEI, reducing primary PM emissions is likely to be the most effective strategy. If the focus is on ecosystem damage and reducing spatially-averaged PM2.5 concentrations across the UK, then ammonia reduction would be the more effective approach.
• Several qualifying remarks are in order here:
– The data on the effects of emission reductions are from two models whichessentially share the same chemical schemes. There are, however, goodreasons for having confidence in the findings. First, the modelledreductions for past years show good agreement with measured trends,and second, the conclusions are in line with findings from an independentmodel which treats the chemistry and physics of particle formation in asophisticated way.
Mitigation of United Kingdom PM2.5 Concentrations
36
– The results of the mitigation scenarios are for a single year. Interannual variabilityin meteorology may also have an influence.
– The emissions reductions were applied to pollutants individually. In reality,emissions reductions for pollutants may occur simultaneously.
– A potentially more relevant mitigation scenario calculation would assess the effectof emission reductions at some future date, e.g. 2020 or thereabouts, to takeaccount of the fact that reductions in the emissions of SIA precursors and primaryPM are already in train. In this report, this has only been carried out using one ofthe models (the Pollution Climate Mapping model, PCM); both models (PCM andEMEP4UK) have been used for hypothetical reductions only from a ‘current’ level.For additional robustness it would be worth modelling such future scenarios witha deterministic chemical transport model (CTM).
– No consideration has been given to the practicalities or costs of emissionsreductions for particular species and particular sectors on top of future emissionsreductions already in the pipeline.
– No consideration has been given to the potential differential toxicity of differentcomponents of PM2.5 which could, as evidence emerges, also influence thepriorities for PM2.5 mitigation.
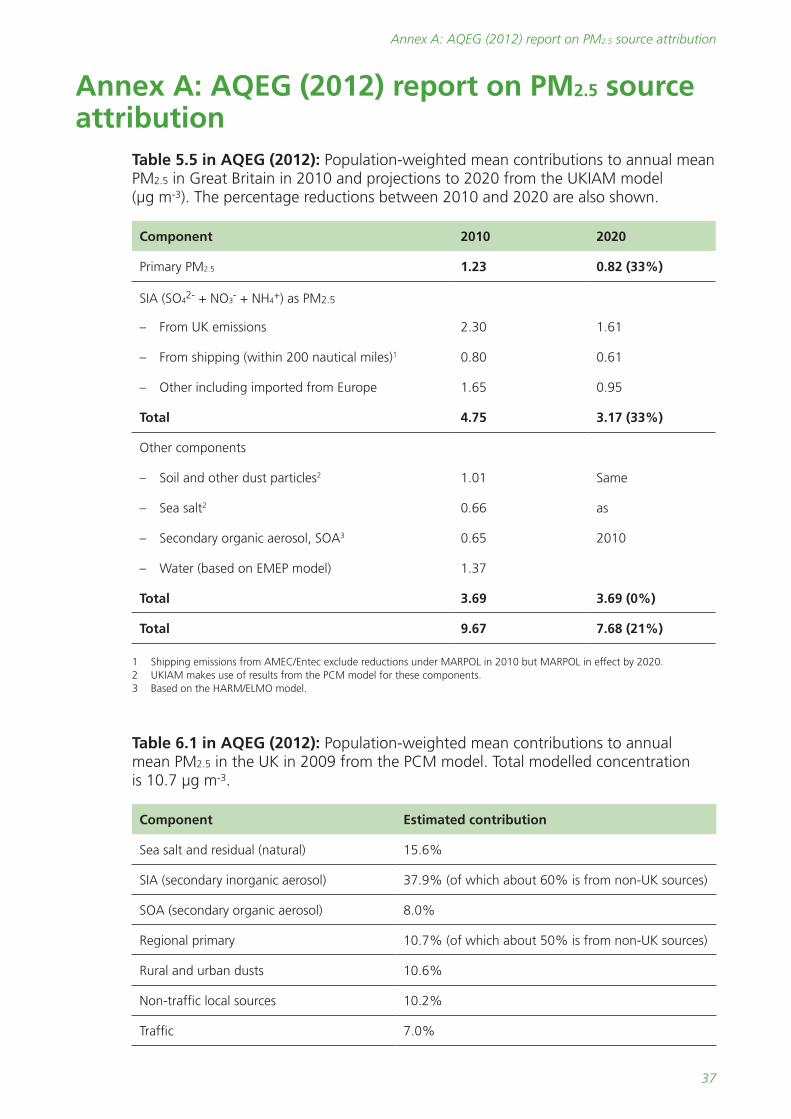
37
Annex A: AQEG (2012) report on PM2.5 source attribution
Annex A: AQEG (2012) report on PM2.5 source attribution Table 5.5 in AQEG (2012): Population-weighted mean contributions to annual mean
PM2.5 in Great Britain in 2010 and projections to 2020 from the UKIAM model (µg m-3). The percentage reductions between 2010 and 2020 are also shown.
Component 2010 2020
Primary PM2.5 1.23 0.82 (33%)
SIA (SO42- + NO3
- + NH4+) as PM2.5
– From UK emissions 2.30 1.61
– From shipping (within 200 nautical miles)1 0.80 0.61
– Other including imported from Europe 1.65 0.95
Total 4.75 3.17 (33%)
Other components
– Soil and other dust particles2 1.01 Same
– Sea salt2 0.66 as
– Secondary organic aerosol, SOA3 0.65 2010
– Water (based on EMEP model) 1.37
Total 3.69 3.69 (0%)
Total 9.67 7.68 (21%)
1 Shipping emissions from AMEC/Entec exclude reductions under MARPOL in 2010 but MARPOL in effect by 2020. 2 UKIAM makes use of results from the PCM model for these components. 3 Based on the HARM/ELMO model.
Table 6.1 in AQEG (2012): Population-weighted mean contributions to annual mean PM2.5 in the UK in 2009 from the PCM model. Total modelled concentration is 10.7 µg m-3.
Component Estimated contribution
Sea salt and residual (natural) 15.6%
SIA (secondary inorganic aerosol) 37.9% (of which about 60% is from non-UK sources)
SOA (secondary organic aerosol) 8.0%
Regional primary 10.7% (of which about 50% is from non-UK sources)
Rural and urban dusts 10.6%
Non-traffic local sources 10.2%
Traffic 7.0%
39
References
References AQEG (2012). Fine particulate matter (PM2.5) in the United Kingdom. Report by the Air Quality Expert Group (AQEG) prepared for the Department for Environment, Food and Rural Affairs (Defra), Scottish Executive, Welsh Government and the Department of the Environment in Northern Ireland. Available at: https://www.gov.uk/government/uploads/system/uploads/attachment_data/file/69635/pb13837-aqeg-fine-particle-matter-20121220.pdf
Beddows, D.C.S., Hayman, G.D. and Harrison, R.M. (2012). Enhancements to the UK photochemical trajectory model for simulation of secondary inorganic aerosol. Atmospheric Environment, 57, 278-288.
Brookes, D.M., Stedman, J.R., Grice, S.E., Kent, A.J., Walker, H.L., Cooke, S.L., Vincent, K.J., Lingard, J.J.N., Bush, T.J. and Abbott, J. (2011). UK air quality modelling under the Air Quality Directive (2008/50/EC) for 2010 covering the following air quality pollutants: SO2, NOx, NO2, PM10, PM2.5, lead, benzene, CO, and ozone. Report for the Department for Environment, Food and Rural Affairs (Defra), Welsh Government, Scottish Government and the Department of the Environment in Northern Ireland. AEA report. AEAT/ENV/R/3215 Issue 1. Available at: http://uk-air.defra.gov.uk/reports/cat09/1204301513_AQD2010mapsrep_master_v0.pdf
Charron, A., Degrendele, C., Laongsri, B. and Harrison, R.M. (2013). Receptor modelling of secondary and carbonaceous particulate matter at a southern UK site. Atmospheric Chemistry and Physics, 13, 1879-1894.
Davies, T., Cullen, M.J.P., Malcolm, A.J., Mawson, M.H., Staniforth, A., White, A.A. and Wood, N. (2005). A new dynamical core for the Met Office’s global and regional modelling of the atmosphere. Quarterly Journal of the Royal Meteorological Society, 608, 1759-1782.
Entec 2010, UK Ship emissions inventory. Report for Defra. Available at: http://uk-air.defra.gov.uk/reports/cat15/1012131459_21897_Final_Report_291110.pdf
Harrison, R.M., Jones, A.M., Beddows, D.C.S. and Derwent, R.G. (2013). The effect of varying primary emissions on the concentrations of inorganic aerosols predicted by the enhanced UK Photochemical Trajectory Model. Atmospheric Environment, 69, 211-218.
Heal, M.R., Naysmith, P., Cook, G.T., Xu, S., Raventos Duran, T. and Harrison, R.M. (2011). Application of 14C analyses to source apportionment of carbonaceous PM2.5 in the UK. Atmospheric Environment, 45, 2341-2348.
Jones, A.R., Thomson, D.J., Hort, M. and Devenish, B. (2007). The UK Met Office’s next generation atmospheric dispersion model, NAME III. In: Borrego, C. and Norman, A.-L. (Eds.). Air Pollution Modelling and Its Application XVII. Proceedings of the 27th NATO/CCMS International Technical Meeting on Air Pollution Modelling and Its Application. Springer. Pages 580-589.
Kulmala, M., Asmi, A., Lappalainen, H. et al. (2011). General overview: European Integrated project on Aerosol Cloud Climate and Air Quality interactions (EUCAARI) – Integrating aerosol research from nano to global scales. Atmospheric Chemistry and Physics, 11, 13061-13143.
Laxen, D., Laxen, K., Heal, M.R., Vieno, M. and Bigg, M. (2012). PM2.5 in Scotland. A report for the Scottish Environment Protection Agency. Available at: http://www.sepa.org.uk/air/idoc.ashx?docid=56d39371-fccd-4a80-8389-30e109d22c01&version=-1
Mitigation of United Kingdom PM2.5 Concentrations
40
Megaritis, A.G., Fountoukis, C., Charalampidis, P.E., Pilinis, C. and Pandis, S.N. (2013).
Response of fine particulate matter concentrations to changes of emissions and temperature in Europe. Atmospheric Chemistry and Physics, 13, 3423-3443.
Nemitz, E., et al., (2014). EMEP4UK Annual Report 2013. In preparation, to be published at: http://uk-air.defra.gov.uk/library/
Redington, A.L. and Derwent, R.G. (2013). Modelling secondary organic aerosol in the United Kingdom. Atmospheric Environment, 64, 349-357.
Redington, A.L., Derwent, R.G., Witham, C.S. and Manning, A.J. (2009). Sensitivity of modelled sulphate and nitrate aerosol to cloud, pH and ammonia emissions. Atmospheric Environment, 43, 3227-3234.
Simpson, D., Benedictow, A., Berge, H., Bergström, R., Emberson, L.D., Fagerli, H., Flechard, C.R., Hayman, G.D., Gauss, M., Jonson, J.E., Jenkin, M.E., Nyiri, A., Richter, C., Semeena, V.S., Tsyro, S., Tuovinen, J.P., Valdebenito, A. and Wind, P. (2012). The EMEP MSC-W chemical transport model – Technical description. Atmospheric Chemistry and Physics, 12, 7825-7865.
Vieno, M., Heal, M.R., Williams, M. and Reis, S. (2014). The impact of UK emissions reductions on surface concentrations of PM2.5. In preparation for journal submission, 2014.
Vieno, M., Dore, A.J., Stevenson, D.S., Doherty, R., Heal, M.R., Reis, S., Hallsworth, S., Tarrason, L., Wind, P., Fowler, D., Simpson, D. and Sutton, M.A. (2010). Modelling surface ozone during the 2003 heat-wave in the UK. Atmospheric Chemistry and Physics, 10, 7963-7978.
Vieno, M., Heal, M.R., Hallsworth, S., Famulari, D., Doherty, R.M., Dore, A.J., Tang, Y.S., Braban, C., Leaver, D., Sutton, M.A. and Reis, S. (2013). The role of long-range transport and domestic emissions in determining atmospheric secondary inorganic aerosol concentrations across the UK. Atmospheric Chemistry and Physics Discussion, 13, 33433-33462.
Yin, J.X. and Harrison, R.M. (2008). Pragmatic mass closure study for PM1.0, PM2.5 and PM10 at roadside, urban background and rural sites. Atmospheric Environment, 42, 980-988.
Yin, J., Harrison, R.M., Chen, Q., Rutter, A. and Schauer, J.J. (2010). Source apportionment of fine particles at urban background and rural sites in the UK atmosphere. Atmospheric Environment, 44, 841-885.

PB14161
Nobel House 17 Smith Square London SW1P 3JR
www.defra.gov.uk
Llywodraeth CymruWelsh Government