mitochondrial introgression and replacement between...
TRANSCRIPT

Mitochondrial introgression and replacement betweenyellowhammers (Emberiza citrinella) and pine buntings(Emberiza leucocephalos) (Aves: Passeriformes)bij_1282 422..438
DARREN E. IRWIN1*, ALEXANDER S. RUBTSOV1,2 and EUGENE N. PANOV3
1Biodiversity Research Centre, and Department of Zoology, University of British Columbia, 6270University Boulevard, Vancouver, BC, V6T 1Z4, Canada2State Darwin Museum, Moscow 117292, Russia3Severtsov Institute of Ecology and Evolution, Moscow 117071, Russia
Received 21 October 2008; accepted for publication 4 April 2009
In studies of phylogeography and taxonomy, strong emphasis is usually placed on the study of mitochondrial(mt)DNA. In the present study, we present a remarkable case in which highly phenotypically divergent specieshave almost no divergence in mtDNA. Yellowhammers (Emberiza citrinella Linnaeus) and pine buntings (Emberizaleucocephalos S. G. Gmelin) differ noticeably in appearance and song but hybridize in some areas of contact. Theyshare a variety of closely-related mtDNA haplotypes, with little divergence in frequencies, indicating a mitochon-drial divergence time sometime during or after the last major glacial period. By contrast, nuclear DNA (amplifiedfragment length polymorphism markers and CHD1Z gene sequences) differs more strongly between the species,and these differences can be used to identify intermediate genetic signatures of hybrids. The combined amount ofmitochondrial diversity within yellowhammers and pine buntings is very low compared to other Emberiza speciespairs, whereas the level of variation at the nuclear gene CHD1Z is comparable to that within other species pairs.Although it is difficult to completely reject the possibility that the two species split extremely recently andexperienced rapid nuclear and phenotypic differentiation, we argue that the evidence better supports anotherpossibility: the two species are older and mtDNA has recently introgressed between them, most likely as a resultof a selective sweep. Mismatches between mitochondrial and nuclear phylogeographic patterns may occur morecommonly than previously considered, and could have important implications for the fields of phylogeography andtaxonomy. © 2009 The Linnean Society of London, Biological Journal of the Linnean Society, 2009, 98, 422–438.
ADDITIONAL KEYWORDS: AFLP – CHD1Z – hybridization – mtDNA – phylogeography – Siberia –speciation.
INTRODUCTION
The study of variation in mitochondrial (mt)DNA hasplayed a central role in studies of taxonomy andphylogeography (Avise, 2004; Ballard & Whitlock,2004; Zink & Barrowclough, 2008). MitochondrialDNA is unusual in that, in most taxa (such as birds),it is inherited solely through the maternal line. Asa result, mtDNA generally has a lower effectivepopulation size than nuclear DNA, causing mtDNAwithin a single population to have a lower expected
coalescence time than most nuclear genes, assumingthat no selection is involved. This characteristicpotentially makes mtDNA more useful than a singlenuclear gene in inferring phylogeographic history(Avise, 2004; Zink & Barrowclough, 2008).
Despite these advantages, the sole use of mtDNA ininferring history has recently come under criticism(Irwin, 2002; Ballard & Whitlock, 2004; Edwardset al., 2005; Rubinoff & Holland, 2005; Bazin, Glémin& Galtier, 2006), primarily because the entire mito-chondrial genome is inherited as a single unit andcaptures only a portion of phylogeographic history.Because of stochastic effects, sex-biased gene flow,lack of recombination between distinct mitochondrial*Corresponding author. E-mail: [email protected]
Biological Journal of the Linnean Society, 2009, 98, 422–438. With 6 figures
© 2009 The Linnean Society of London, Biological Journal of the Linnean Society, 2009, 98, 422–438422
lineages, and direct selection on mitochondrial varia-tion (Dowling, Friburg & Lindell, 2008), patterns ofgeographic variation in mtDNA might be highly dis-cordant with patterns of variation throughout thenuclear genome. In response to these criticisms, Zink& Barrowclough (2008) have defended the primaryuse of mtDNA, emphasizing its greater ability tocapture patterns of population division because of itslower effective population size and arguing that theuse of mtDNA leads to accurate conclusions regardingtaxonomic relationships the great majority of thetime. Zink (2004) even argued that mtDNA is ofgreater importance than phenotypic traits in deter-mining correct subspecies boundaries. In the presentstudy, we explore these issues by studying patterns ofgenetic differentiation in mitochondrial and nuclearDNA between two phenotypically distinct but hybrid-izing taxa that have been considered distinct speciesever since their scientific description in the late1700s.
The debate regarding the importance of mtDNA asan indicator of population history has importantimplications for the study of speciation, in whichgenetic patterns are compared between relativelyyoung taxa. Past variation in climate and habitatdistribution (e.g. during the Pleistocene glaciations)has frequently divided species ranges into geographi-cally separated areas, and then allowed those areas toexpand and come into contact, producing contactzones between divergent groups. Such contact zonesenable an examination of interactions betweenclosely-related taxa and an assessment of whetherthey are reproductively isolated. One region wheresuch contact zones are common is central Siberia(Haffer, 1989; Rogacheva, 1992; Newton, 2003; Irwin& Irwin, 2005), where many pairs of related westernand eastern forms meet. Siberia was treeless(although not highly glaciated) for long periods duringthe Pleistocene glaciations (Frenzel, 1968; Adams &Faure, 1997); hence, any forest-dependent speciesfound there now must have expanded from otherregions. In birds, patterns of migratory behavior(Irwin & Irwin, 2005) and molecular biogeography(Irwin, Bensch & Price, 2001; Irwin et al., 2005)suggest that many species expanded into Siberia froma forested refugium in central Asia (i.e. the regionwest and north-west of the Tibetan Plateau andTaklamakan Desert), whereas others expanded froma refugium in eastern or north-eastern China (ornearby regions such as the Korean Peninsula; Naza-renko, 1990). Some species had related forms in bothof these regions.
Thus, central Siberia is a meeting place of distinctavian faunas, making it a prime location for the studyof how related forms interact when they come intosecondary contact. Yet little research has focused on
the genetic relationships between western andeastern relatives in central Siberia. In perhaps theonly previous such study, genetic variation indicatedthat western and eastern forms of greenish warblers[Phylloscopus trochiloides viridanus and Phylloscopus(trochiloides) plumbeitarsus] started diverging longbefore the last major period of Pleistocene glaciationand then moved into central Siberia from differentdirections: one from central Asia and the other fromeastern China (Irwin et al., 2001, 2005).
In the present study, we investigate interactionsbetween the yellowhammer (Emberiza citrinella Lin-naeus 1758) and the pine bunting (Emberiza leuco-cephalos S. G. Gmelin 1771), two sister taxa in theEmberizinae family (Alström et al., 2007). Both speciesbreed across a wide region of western and centralSiberia, with yellowhammers extending westward towestern Europe and pine buntings extending eastwardto the Russian Far East (Fig. 1). The two species differnoticeably in plumage patterns, although a variety ofphenotypic intermediates across the sympatric areasuggest that they hybridize extensively (Panov, 1989;Panov, Rubtsov & Monzikov, 2003; Panov, Rubtsov &Mordkovich, 2007). The two forms are similar morpho-metrically but apparently differ to some degree inhabitat preference, with yellowhammers being morelikely to inhabit shrubby habitat along forest edgesand in mountain steppe vegetation, and pine buntingsbeing more likely to inhabit open forests where conif-erous trees predominate (Ravkin, 1973; Panov et al.,2003).
The present study was motivated by the desire touse yellowhammers and pine buntings as a modelsystem for the study of speciation between westernand eastern Palearctic forms. Our primary goal wasto use patterns of genetic differentiation to: (1) recon-struct the time of population splitting betweenyellowhammers and pine buntings and (2) clarifypatterns of current introgression due to hybridization.We hypothesized that genetic variation would indi-cate that the two forms started diverging sometimebefore the last of a long series of major Pleistoceneglaciations; this last glacial period began approxi-mately 110 000 years ago (Adams & Faure, 1997). Weintended to use mtDNA as the primary geneticmarker in this effort, as is often done in the field ofphylogeography (Avise, 2004; Zink & Barrowclough,2008). Our surprising initial results indicating virtu-ally no mitochondrial divergence between the speciesprompted us to investigate patterns of variation inthe nuclear genome as well, using amplified fragmentlength polymorphism (AFLP) analysis and thesequencing of a sex-linked gene (CHD1Z) on theZ-chromosome. Given the large phenotypic differencesbetween yellowhammers and pine buntings, wehypothesized that the two groups are genetically
MITOCHONDRIAL INTROGRESSION IN EMBERIZA 423
© 2009 The Linnean Society of London, Biological Journal of the Linnean Society, 2009, 98, 422–438

divergent in nuclear DNA, even though they are sosimilar in mtDNA. We also aimed to use nuclearDNA markers that differed between yellowhammersand pine buntings to test whether phenotypicallyintermediate individuals (i.e. apparent hybrids)have intermediate patterns of genetic variation. Theresults reveal a variety of nuclear markers that differbetween the taxa and are useful in identifyinghybrids. More importantly, our findings indicate rapidmitochondrial introgression and fixation, a phenom-enon that is often not considered in the fields ofphylogeography and taxonomy.
MATERIAL AND METHODSSAMPLING
We obtained blood and/or tissue (muscle or liver)samples from field-caught birds and from museumspecimens. In total, we examined 156 yellowham-mers, 87 pine buntings, and 20 phenotypic hybrids(see Supporting information, Table S1). Each indi-vidual from which a sample was obtained (both livebirds and museum specimens) was photographed anddescribed phenotypically according to the standardscoring system used by Panov et al. (2003). We alsoobtained samples of eight other Emberiza species inorder to estimate the genetic relationships of theyellowhammer/pine bunting complex to other specieswithin the genus. Sample sizes and localities areshown in Figure 1 (see also Supporting information,Table S1).
From birds captured in the field, we took approxi-mately 50 mL of blood and diluted it in 500 mL of‘Queen’s Lysis Buffer’ (Seutin, White & Boag, 1991).Blood samples were stored in a cool place during fieldwork and frozen just after returning from the field.Tissue samples from the museum collections werestored in 96% ethanol. DNA was extracted using astandard phenol–chloroform protocol.
DNA SEQUENCE ANALYSIS
To test whether yellowhammers and pine buntingsdiffer in mtDNA we sequenced a subset of samples ofeach species from allopatric populations: yellowham-mers from the Baltic Sea, Kursk, and Krasnodarregions (41 samples), and pine buntings from Chitaand Sakhalin regions (33 samples; for locations, seeSupporting information, Table S1). We amplified1032 bp of the ND2 gene using the primers L5215:5!-TATCGGGCCCATACCCCGAAAAT-3! and 1064:5!-CTTTGAAGGCCTTCGGTTTA-3! (Drovetski et al.,2004). Polymerase chain reaction (PCR) amplificationwas conducted using 1 mM each of primers L5215 and1064, 1 ¥ PCR buffer and 1.5 U Taq DNA polymerase(New England Biolabs), 2.5 mM MgCl2 (Invitrogen),and 0.25 mM dNTP-mix (New England Biolabs) in a25-mL total volume. PCR included an initial denatur-ing step of 94 °C for 3 min, followed by 35 cyclesof 94 °C for 30 s, 55 °C for 30 s, and 72 °Cfor 1 min, and a final elongation step at 72 °C for10 min. To compare levels of ND2 variation in the
5
8
15
2
55
66
15 169 3
6
11
2013 5
102
1921
63
3
27
9
8
2000 km
Figure 1. Geographic distribution of yellowhammers (Emberiza citrinella; solid lines) and pine buntings (Emberizaleucocephalos; dashed lines), which hybridize extensively in their area of overlap in western and central Siberia. Samplingsites are indicated by small circles (one sample) or large circles (multiple samples, with numbers indicating sample sizes).Phenotypic yellowhammers are indicated by light grey circles, phenotypic hybrids by dark grey, and phenotypic pinebuntings by black.
424 D. E. IRWIN ET AL.
© 2009 The Linnean Society of London, Biological Journal of the Linnean Society, 2009, 98, 422–438

yellowhammer/pine bunting species complex withthat throughout the Emberiza genus, we sequencedthe same ND2 fragment from eight other species:Emberiza aureola, Emberiza calandra, Emberizacioides, Emberiza cirlus, Emberiza hortulana,Emberiza spodocephala, Emberiza stewarti, andEmberiza tristrami (see Supporting information,Table S1).
We are reasonably confident that our ND2sequences are from the mitochondrial genome ratherthan from a nuclear pseudogene (Sorenson & Quinn,1998) for several reasons. First, we used a combina-tion of tissue samples and blood samples, andthe two sources of DNA gave compatible results(pseudogenes are more likely to be amplified fromblood than from tissue). Second, our resulting ND2phylogeny of ten Emberiza species (see Results) ishighly consistent with the cytochrome b (cytb) phy-logeny presented by Alström et al. (2007), differingonly slightly in nodes that received low bootstrapsupport in the cytb phylogeny (e.g. the placement ofE. cirlus). Third, our ND2 phylogeny had muchgreater depth than our CHD1Z phylogeny, consistentwith the expectation that mitochondrial sequencesevolve more quickly than nuclear sequences (Soren-son & Quinn, 1998).
We sequenced 612 bp of an intron of a sex-linkedgene, CHD1Z on the Z-chromosome (Fridolfsson &Ellegren, 1999), from 173 samples representing bothparental species and their hybrids. PCR amplificationwas performed using 1 mM each of primers 2550F(5!-GTTACTGATTCGTCTACGAGA-3!) and 2718R(5!-ATTGAAATGATCCAGTGCTTG-3!; Fridolfsson &Ellegren, 1999) and other PCR reagents as describedabove for ND2, in a 25-mL total volume. PCR includedan initial denaturing step of 94 °C for 3 min, followedby 35 cycles of 94 °C for 30 s, 50 °C for 30 s, and 72 °Cfor 40 s, and a final elongation step at 72 °C for10 min. To compare CHD1Z variation within theyellowhammer/pine bunting species complex withthat throughout the genus, we sequenced the sameCHD1Z fragment from four other species: E. calan-dra, E. hortulana, E. cirlus, and E. stewarti (seeSupporting information, Table S1). Purification andsequencing of PCR products for both the ND2 geneand the CHD1Z intron were performed by Macrogen(Seoul, South Korea).
Sequences were aligned and edited using BIOEDIT(Hall, 1999). Both avian sex chromosomes (Z and W)have a copy of the CHD1Z gene, but the intronused differs in length between these chromosomes(Fridolfsson & Ellegren, 1999). For sequencing, weused the samples obtained from the homogametic sex(males) only, to avoid sequencing complications fromthe presence of the W-chromosome copy. To recon-struct haplotypes from unphased genotypes we used
the software FASTPHASE under default settings(Scheet & Stephens, 2006).
For both ND2 and CHD1Z, we produced minimumspanning haplotype networks with the assistance ofthe software TCS (Clement, Posada & Crandall, 2000)and ARLEQUIN, version 3.11 (Excoffier, Laval &Schneider, 2005), which produced identical results.ARLEQUIN was also used to calculate FST, defined asthe fraction of variance in pairwise sequence differ-ences (i.e. the number of mismatches) that isexplained by the difference between two groups(Excoffier et al., 2006; FST takes into account bothgenetic distance between and frequency of haplo-types, and is therefore not equivalent to some formu-lations of FST that use only haplotype frequency).
To estimate genetic distances and phylogenetic treesamong Emberiza species based on ND2 and CHD1Z,we used the software TREE-PUZZLE (Schmidt et al.,2002), which uses a maximum likelihood approach. Weused an HKY + G model of sequence evolution (Price,2008: 38–40), eight gamma-distributed rate categories,and accurate parameter estimation using neighbour-joining trees. A likelihood ratio test as implemented inTREE-PUZZLE revealed that, for both the ND2 andthe CHD1Z trees, the assumption of a constantmolecular clock does not significantly decrease thelikelihood of the tree; hence, we use the clock-like treesfor illustration.
Although there is support for a reasonably constantmolecular clock for mtDNA in birds (Weir & Schluter,2008), we did not assume the same clock would applyto CHD1Z. To calculate a range of reasonable esti-mates for the CHD1Z molecular clock that was inde-pendent of the yellowhammer/pine bunting data, wecompared ND2 distances with CHD1Z distances forthe other species pairs that were in both datasets (E.calandra, E. hortulana, E. cirlus, and E. stewarti).
DNA sequences have been deposited in GenBank(accession numbers GQ370010–GQ370064).
DEMOGRAPHIC MODELLING BASED ON MTDNAMany studies of phylogeography, historical demogra-phy, and conservation genetics rely heavily on infer-ence from mtDNA-based demographic modelling,using a variety of methods. We used such methods toexplore the range of historical scenarios that areconsistent with the mitochondrial data under certainassumptions. We note that our goal was not to inferthe precise history of the two species; rather, wewished to determine whether the historical scenariosinferred using mtDNA were consistent with variationin nuclear DNA and phenotypic traits.
To test whether the ND2 data were consistent withneutral evolution under constant population size, weused ARLEQUIN to perform three tests of selective
MITOCHONDRIAL INTROGRESSION IN EMBERIZA 425
© 2009 The Linnean Society of London, Biological Journal of the Linnean Society, 2009, 98, 422–438

neutrality, each tested for significance using 10 000simulations: Tajima’s D-test (Tajima, 1989), Fu’sFS test (Fu, 1997), and Ewens–Watterson–Slatkin’sexact test (Slatkin, 1996).
To estimate the time of divergence and demo-graphic history of allopatric yellowhammers and allo-patric pine buntings based on mitochondrial ND2data and an assumption of neutrality, we used thesoftware IMa (Hey, 2007; Hey & Nielsen, 2007), whichused a Bayesian Markov chain Monte Carlo approachto fit the ND2 sequence data to an ‘Isolation withMigration’ model (Nielsen & Wakeley, 2001). Thismodel assumes that two populations (in this case,allopatric yellowhammers and allopatric pine bun-tings) split some time ago from a single population,and that there has been some constant rateof gene exchange subsequent to the populationssplitting. Given an estimated mutation rate, IMaattempts to simultaneously estimate six parameters:the effective population sizes of both current popula-tions and the ancestral population, the time splittingof the populations, and the migration rates of eachpopulation to the other. The model assumes selectiveneutrality and no recombination within a locus.
We ran IMa under two scenarios, using ND2sequence data from allopatric yellowhammers andallopatric pine buntings. The purpose of these modelruns was not to determine precisely the true historyof the two species; the model assumptions are toorestrictive and simple for that purpose. Rather, ourgoal was to estimate the range of population splittingtimes that are consistent with the mitochondrial ND2data, in the hope that this information would help usto determine whether mitochondrial patterns wereconsistent with patterns in nuclear DNA. First, weran IMa to estimate all six parameters simulta-neously. Second, we ran the model with the maximummigration rate in each direction set to zero, effectivelymaking the model into a two-island isolation model.Several preliminary runs were conducted under eachscenario to determine proper upper bounds on param-eters, as well as the run times necessary to achieveconvergence and have sufficient sampling (Hey, 2007).Each model was run with a burn period of 107 stepsfollowed by a recording period of 108 steps. Eachscenario was run twice using different randomnumber seeds, to check repeatability of results. In theruns that included post-split migration, we used IMato record the mean time of migration events (Won &Hey, 2005).
Conversion of the IMa parameters t and qA todivergence time in years and effective population sizerequires an estimate of generation time and mutationrate (Hey, 2007). We used an estimated generationtime of 1.7 years (i.e. the average time for sevenpasserine species; Kondo et al., 2008; after Sæther
et al., 2005; note that using a different estimate ofgeneration time would affect estimates of populationsize but would not affect the resulting estimate of timein years since population expansion). We based ourestimate of the ND2 mutation rate on the well-supported mitochondrial molecular clock estimate of1% mutation per million years along a single lineage(2% between lineages; Lovette, 2004; Weir, 2006; Weir& Schluter, 2008). This rate corresponds to 1.03 ¥ 10-5
mutations per entire ND2 sequence (1032 bp) peryear, or an estimate for m of 1.75 ¥ 10-5 per generation.To account for uncertainty in the rate of mutation, wealso calculated parameter values for both 0.5% and1.5% per million year mutation rates, which appearedto be appropriate given the apparent variation incalibrated rates reported by Weir & Schluter (2008).
AFLP ANALYSIS
Whereas mitochondrial DNA is inherited matrilin-eally as a single unit, AFLP markers are spreadthroughout the nuclear genome and represent avariety of genealogical histories. To generate AFLPmarkers, we used the protocol provided by LI-CORBiosciences (2003), based on the method developed byVos et al. (1995). We used the restriction enzymesEcoRI and MseI to digest genomic DNA, and thensynthetic oligonucleotides (‘adaptors’) were ligated tothe fragments. We performed two rounds of PCRusing primers corresponding to the adaptor plus onearbitrary base pair in the first round and the adaptorplus three arbitrary base pairs in the second round.Fluorescein-labelled primers were used in the secondround of PCR (the ‘selective amplification’). The prod-ucts were separated in 6.5% KBPlus gels and visualizedusing a LI-COR 4300 DNA Analyzer.
We generated two sets of AFLP data for subsequentanalysis; each allowed particular questions to be add-ressed most effectively.
AFLP dataset 1: genetic differentiation between taxaHere, our goal was to obtain an unbiased estimate ofgenetic differentiation between allopatric yellowham-mers and allopatric pine buntings. We scored allAFLP bands, regardless of their patterns of variation,from five primer combinations. This was performedfor a subset of samples from allopatric yellowham-mers (N = 13) and allopatric pine buntings (N = 15).We did not include bands that appeared in three orfewer individuals. We summarized variation in theresulting presence/absence matrix using principalcomponents analysis (PCA), using R (R DevelopmentCore Team, 2006).
We used AFLP-SURV (Vekemans, 2002) to calculateFST, the proportion of total variance in allele frequen-cies that is explained by differences between the two
426 D. E. IRWIN ET AL.
© 2009 The Linnean Society of London, Biological Journal of the Linnean Society, 2009, 98, 422–438

species. Estimation of allele frequencies was per-formed using a Bayesian approach (with non-uniformprior distributions of allele frequencies) assumingHardy–Weinberg equilibrium within each species.This approach is necessary to avoid biases in theestimation of allele frequencies from dominantmarkers (Lynch & Milligan, 1994; Zhivotovsky, 1999).A locus-specific FST was generated using these allelefrequencies, using the equation:
Fp p p p
p pST = "( ) + "( )"( )
12
22
2 1,
where px is the frequency of the allele for band pres-ence in population x, and p is the mean of p1 and p2.
Some previous AFLP studies of population differ-entiation have reported an alternative FST statisticthat is based on AFLP band frequencies rather thanallele frequencies. This statistic is based simply ontwo phenotypes, these being presence or absence ofeach AFLP band. Because a number of other studiesreport this statistic (Svensson et al., 2004; Bensch &Åkesson, 2005; Helbig et al., 2005; Irwin et al., 2005;Parchman, Benkman & Britch, 2006; Toews & Irwin,2008), for purposes of comparison we also calculatedit for our data, using ARLEQUIN, version 3.11(Excoffier et al., 2005).
AFLP dataset 2: selected markers for distinguishingtaxa and hybridsHere, our goal was to select only the most usefulmarkers in distinguishing the taxa and presumablyin identifying hybrids as well. We examined AFLPprofiles from ten primer combinations and deter-mined AFLP markers that differed in presence/absence frequencies between 26 allopatric yellow-hammers (group 1 below) and 15 allopatric pine bun-tings (group 7 below) according to two criteria: weselected all markers that were (1) at least 1.5-foldmore common in one of the groups than in the otherand (2) present in at least 50% of individuals in thegroup with the highest frequency of that marker.These criteria ensured that selected markers werepicked objectively and had a large difference in fre-quency between the two groups.
This procedure resulted in 20 selected markers,which were then also scored in individuals fromwithin or close to the contact zone. In total, thisanalysis included 65 samples divided into seven phe-notypic groups (for detailed descriptions of eachgroup, see Panov et al., 2003): (1) allopatric yel-lowhammers (from Baltic Sea, Kursk, Moscow, andOrenburg) (N = 26); (2) phenotypic yellowhammersfrom the contact zone (N = 4); (3) yellow hybrids(N = 8); (4) white hybrids (N = 7); (5) pine buntingswith slight hybrid phenotypes (N = 2); (6) pine bun-
tings in or near the contact zone (N = 3); and (7)allopatric pine buntings (from East Transbaikalia andSakhalin) (N = 15). We again summarized variation inthe resulting presence/absence matrix using PCA,using R (R Development Core Team, 2006). We alsoused STRUCTURE, version 2.2 (Pritchard, Stephens& Donnelly, 2000; Falush, Stephens & Pritchard,2007) to calculate assignment probabilities of indi-viduals to two genetic clusters based on their AFLPsignatures.
RESULTSMITOCHONDRIAL DNA
Allopatric yellowhammers and pine buntings differremarkably little in mtDNA (Fig. 2A), with manyhaplotypes shared between the two species. FST isonly 0.025, which does not differ significantly fromzero (P = 0.073). Out of 1032 bp sequenced, theaverage pairwise difference between species, aftercorrection for within-species polymorphism, was only0.056 bp (uncorrected pairwise differences betweenspecies: 2.231 bp; within yellowhammers: 2.285 bp;within pine buntings: 2.064 bp). This amounts toa percentage divergence of 0.0054%, which is anextraordinarily low amount for such phenotypicallydivergent taxa.
A variety of analyses indicate that mtDNA of bothyellowhammers and pine buntings have experienceda selective sweep and/or population growth. Tajima’stest of selective neutrality (Tajima, 1989) was signifi-cant for yellowhammers (D = -1.49, P = 0.049) andpine buntings (D = -1.81, P = 0.018), as well as for allsamples combined (D = -2.06, P = 0.004), where sig-nificance indicates rejection of the neutral model.Fu’s (1997) test also rejected neutrality in each case(yellowhammer: FS = -9.87, P < 0.00001; pine bunt-ing: FS = -9.16, P = 0.00010; all samples combined:FS = -24.37, P < 0.00001). Finally, Ewens–Watterson–Slatkin’s exact test (Slatkin, 1996) also indicated aselective sweep and/or population growth (yellowham-mer: P = 0.0182; pine bunting: P = 0.0007; all samplescombined: P < 0.00001).
The IMa analyses provided fairly precise estimatesof the time of population splitting of yellowhammerand pine bunting mtDNA. All four runs (two allowedmigration after the split and two did not) producedsimilar posterior probability distributions for the timeof the split (see Supporting information, Fig. S1), withthe peak time being 32 000 years ago [95% confidenceinterval (CI) = 20 000–48 000]. The analysis also pro-duced a narrow range of estimates of the ancestraleffective population size (see Supporting information,Fig. S1), which was relatively small, with the peakestimate being 110 000 (95% CI = 47 000–290 000).
MITOCHONDRIAL INTROGRESSION IN EMBERIZA 427
© 2009 The Linnean Society of London, Biological Journal of the Linnean Society, 2009, 98, 422–438
Incorporating uncertainty in the rate of mutation inthe range 0.5–1.5% per million years along a lineage,these 95% CIs expand to 14 000–97 000 years ago forthe time of splitting and the ancestral effective popu-lation size of 31 000–580 000. The IMa runs were notable to produce stable distributions for the estimatesof present population sizes, nor migration rates after
the time of the split (see Supporting information,Fig. S1).
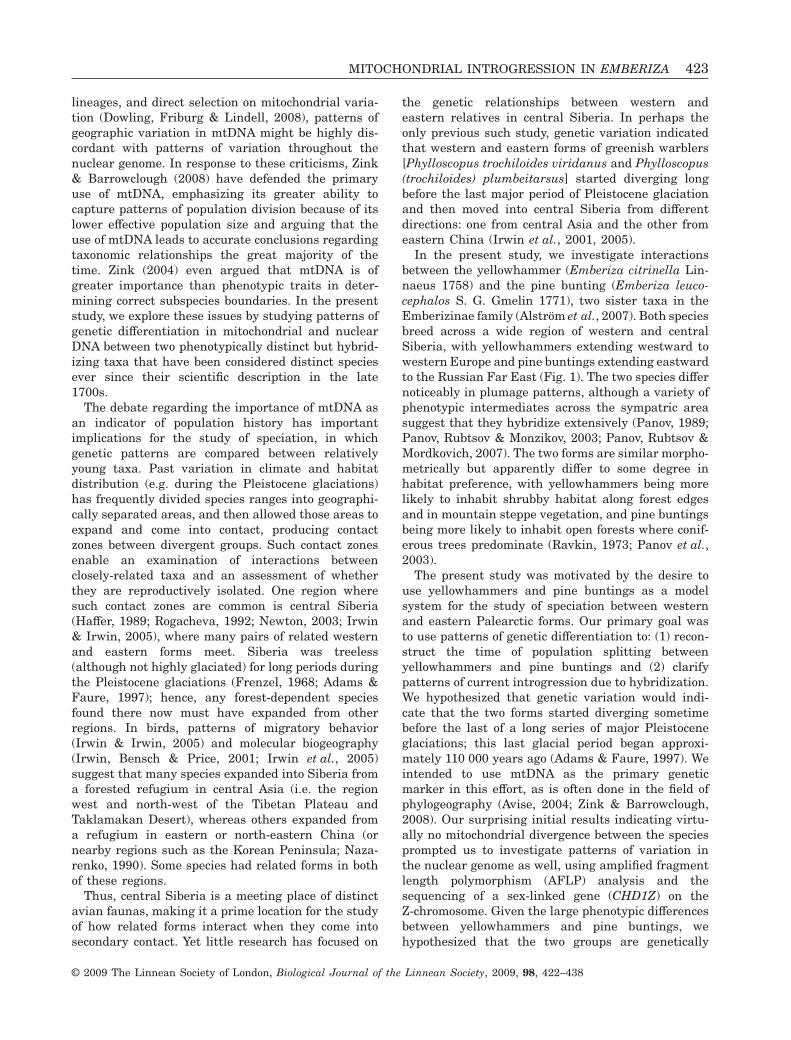
The most divergent mitochondrial haplotypeswithin the yellowhammer/pine bunting complex differby only eight substitutions, or 0.8% sequence diver-gence. This maximal amount of sequence divergencewithin the yellowhammer/pine bunting complex is
*
*
72 E
1 H
GOTGCT
GOCGCAGTTGCA
GTTGTTAOCGCA
AOCACA
GTCGTT
AOCGCT
GTTGTA
GTCGCA
GOTGCA
**
(A) ND2
(B) CHD1Z
Figure 2. Minimum spanning network showing the relationships among (A) ND2 haplotypes and (B) CHD1Z haplotypesof allopatric yellowhammers (light gray) and pine buntings (dark gray). In (A), circle area is proportional to the numberof samples with that haplotype, with the smallest size corresponding to a single sample, and small dots representingmissing haplotypes. Asterisks indicate the two most distantly-related haplotypes in the two species; these haplotypes wereused in the interspecific phylogeny (Fig. 3A) and to calculate maximum genetic distance (Table 1). In (B), the circle areais proportional to the number of haplotypes of that sequence (with a single individual represented by GTCGTT). The lightand dark areas of the circles represent the relative frequencies of particular haplotypes in yellowhammer and pinebuntings, respectively. Missing haplotypes are indicated by small dots. Most haplotypes could have been produced byrecombination of the two most common haplotypes (GTTGTT, which is more common in yellowhammers; and AOCGCA,which is more common in pine buntings). These two most common haplotypes (marked with asterisks) were used in thephylogenetic reconstruction in Fig. 3B.
428 D. E. IRWIN ET AL.
© 2009 The Linnean Society of London, Biological Journal of the Linnean Society, 2009, 98, 422–438

very low compared to that between other species ofEmberiza buntings (Fig. 3A, Table 1; to represent yel-lowhammers and pine buntings in the phylogeny, weused the most divergent sequences, denoted withasterisks, in Fig. 2A). The genetic distance betweenthe most divergent haplotypes in the pine bunting/yellowhammer complex is 16-fold less than thatbetween the pine bunting and another closely-relatedspecies, the chestnut-breasted bunting (E. stewarti).These results closely parallel the patterns seen at themitochondrial cytb gene, as reported by Alström et al.(2007).
CHD1Z SEQUENCES
Sequences from 173 samples revealed five singlenucleotide polymorphisms and one insertion/deletion
(‘indel’) within 613 bp of the CHD1Z intron. Posi-tions of these polymorphisms in the sequence, andthe alternative characters at those positions, are:132:A/G, 160:T/O, 241:T/C, 379:G/A, 495:T/C, 501:T/A,where ATGC represent mononucleotides and O rep-resents a deletion. The software FASTPHASE (Scheet& Stephens, 2006) revealed that the genotypes mostlikely consist of 11 haplotypes, five of which arequite rare (Fig. 2B). Common haplotypes are sharedbetween species, indicating that CHD1Z would be oflittle use in characterizing the genetic origin of indi-viduals in the hybrid zone. We therefore focused ouranalysis on allopatric yellowhammers (75 samples)and pine buntings (36 samples), addressing the ques-tion of how genetically divergent the two groups are.FST between the allopatric groups based on CHD1Z
is 0.176, which is significantly different than zero(P < 10-5) and much larger than FST based on ND2(0.025, see above). This is a surprising result because,under neutral theory, estimates of FST based on mito-chondrial sequences are expected to exceed estimatesof FST based on nuclear genes (Zink & Barrowclough,2008).
The haplotype network shows multiple possiblepathways by which haplotypes might have arisen, anapparent pattern of reticulate evolution suggesting arole for recombination in generating new haplotypes(Fig. 2B). Explaining the pattern without recombina-tion would require postulating that several cases ofpoint mutations arose multiple times, which seemsunlikely. The two most highly diverged of the commonhaplotypes differ substantially in frequency betweenthe species, with GTTGTT being more common inyellowhammers (chi-squared contingency test: c2 =10.7, P = 0.002) and AOCGCA more common in pinebuntings (c2 = 26.0, P < 10-6; Fig. 2B). Taken together,a possible explanation for these patterns is thatGTTGTT is an ancestral yellowhammer allele,whereas AOCGCA is an ancestral pine bunting allele.All of the other haplotypes, with the sole exception ofthe low-frequency haplotype AOCACA, could havearisen through hybridization and recombinationwithout any novel point mutation.
For the purpose of estimating the CHD1Z relation-ships of the yellowhammer and pine bunting withfour other bunting species, we took the common hap-lotypes in the two species (GTTGTT for yellowham-mer and AOCGCA for pine bunting) as representingthese species, respectively. In contrast with themtDNA result, CHD1Z shows a genetic distancebetween the yellowhammer and pine bunting compa-rable with other closely-related species, E. cirlus andE. stewarti (Fig. 3B, Table 1). A comparison of theCHD1Z distances and ND2 distances for the otherspecies pairs that were in both datasets (E. calandra,E. hortulana, E. cirlus, and E. stewarti), and assum-
E. citrinella
E. leucocephalos
100
E. stewarti
100
E. cirlus
95
E. hortulana
98
E. cioides
85
E. calandra
E. aureola
E. spodocephala
98
E. tristrami
100
100
54
100
0.1
0.01
E. cirlus
E. leucocephalos
E. calandra
E. stewarti
E. hortulana
E. citrinella
(A) ND2
(B) CHD1Z
Figure 3. Phylogenetic trees of Emberiza species basedon (A) ND2 and (B) CHD1Z. Numbers to the left of nodesrepresent quartet puzzling support values, with numbersabove 90 indicating very strong confidence in the cladejoined at that node. Scale bars indicate expected rates ofnucleotide divergence between two lineages, under theHKY + G substitution model (see Material and methods).The grey areas between Emberiza citrinella and Emberizaleucocephalos denote haplotype sharing between the twospecies, presumably as a result of ongoing gene flow. Forthese two species, highly divergent haplotypes were usedto represent the two species in the phylogeny (indicatedwith asterisks in Fig. 2; see Results).
MITOCHONDRIAL INTROGRESSION IN EMBERIZA 429
© 2009 The Linnean Society of London, Biological Journal of the Linnean Society, 2009, 98, 422–438
ing an ND2 molecular clock of 2% per million years,results in CHD1Z clock estimates ranging from 0.1%(E. hortulana – E. stewarti) to 0.2% (E. calandra – E.stewarti) per million years. Applying this range ofestimates to the divergence between the two mostcommon haplotypes leads to an estimated time ofdivergence of these two haplotypes of approximately3–6 million years ago.
AFLP ANALYSIS
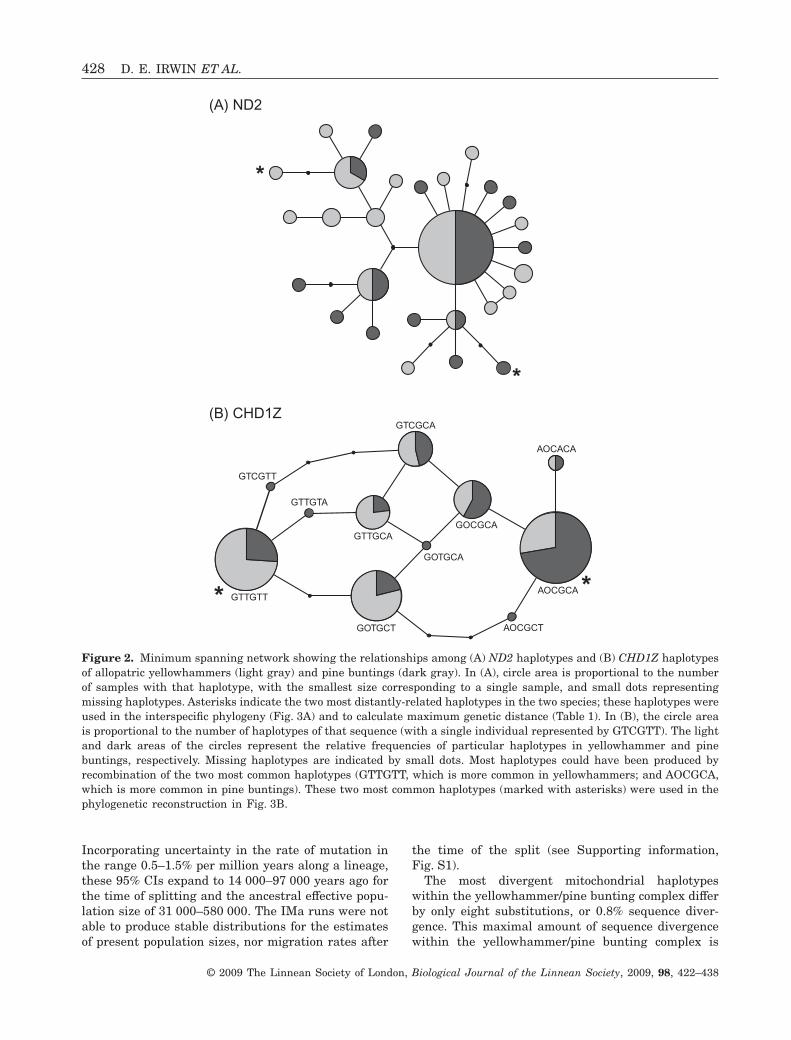
Genomic differentiation between taxaAFLP analysis of allopatric yellowhammers and allo-patric pine buntings reveals a moderately strongsignal of divergence in their nuclear genomes. Ouranalysis of five AFLP primer pairs (AFLP dataset 1)revealed 367 AFLP markers in 13 allopatric yel-lowhammers and 15 allopatric pine buntings. Ofthese, 63 markers (17.2%) were variable. A PCA(Fig. 4) reveals that the two taxa are clearly sepa-rated along the first principal component (PC1),which explains 11.4% of the variance in the dataset.This difference in PC1 is highly significant (t-test:t26 = 13.57, P < 10-12). FST, defined as the fraction ofvariance in AFLP signatures that is explained by thedifference between two groups, is 0.078 based onestimated allele frequencies (using AFLP-SURV) and0.140 based on band frequencies (using ARLEQUIN),both of which are significantly different from zero(P < 10-5 and P < 10-4, respectively). Although theoverall signal of differentiation between the speciesis clear, it is due to a relatively small number ofmarkers (Fig. 5), a pattern that is generally expectedfor multilocus genetic data (Whitlock, 2008).
AFLP analysis of hybridizationBy examining bands produced by ten AFLP primercombinations, we identified 20 markers that showed
strong frequency differences between 26 allopatricyellowhammers and 15 allopatric pine buntings(Table 2; see Material and Methods). A PCA of these20 markers on all phenotypic groups (AFLP dataset2) reveals that phenotypic hybrids tend to haveintermediate AFLP signatures (Fig. 6), and theSTRUCTURE analysis produced similar results (seeSupporting information, Fig. S2). Many of the pheno-typic hybrids are generally more similar to allopatricyellowhammers than to allopatric pine buntings.
Table 1. Pairwise genetic distances (see Material and Methods for details) between the ten species of Emberiza genusfor mtDNA (ND2 gene, below the diagonal) and Z-chromosome (CHD1Z intron, above the diagonal)
1 2 3 4 5 6 7 8 9 10
1. Emberiza calandra – 0.023 0.031 0.028 0.032 0.0282. Emberiza tristrami 0.394 –3. Emberiza aureola 0.419 0.140 –4. Emberiza spodocephala 0.463 0.126 0.117 –5. Emberiza cioides 0.249 0.404 0.456 0.466 –6. Emberiza hortulana 0.313 0.505 0.545 0.545 0.234 – 0.016 0.012 0.015 0.0127. Emberiza cirlus 0.346 0.524 0.510 0.545 0.302 0.308 – 0.010 0.010 0.0108. Emberiza stewarti 0.265 0.466 0.471 0.490 0.243 0.213 0.179 – 0.010 0.0079. Emberiza citrinella 0.307 0.490 0.562 0.558 0.275 0.243 0.216 0.084 – 0.007
10. Emberiza leucocephalos 0.307 0.494 0.566 0.563 0.282 0.239 0.222 0.082 0.005 –
For yellowhammers (E. citrinella) and pine buntings (E. leucocephalos), haplotypes indicated with asterisks in Fig. 2 wereused to calculate genetic distances.
-4 -2 0 2 4AFLP PC1
-4
-2
-6
0
2
4
6
AFLPPC2
Figure 4. Variation in amplified fragment length poly-morphism (AFLP) signatures (based on AFLP dataset 1)among allopatric yellowhammers (open circles) and pinebuntings (filled diamonds), illustrated using principalcomponents analysis. All variable markers (63 total, notchosen based on their pattern of variation but simplyincluded if they were variable) from five primer combina-tions were used (these were only determined for allopatricsamples; see Material and Methods). PC1 explains 11.4%of the variation, while PC2 explains 8.7%. There is nooverlap between the two species in their AFLP signatures,and the difference in PC1 is highly significant (t-test:t26 = 13.57, P < 10-12).
430 D. E. IRWIN ET AL.
© 2009 The Linnean Society of London, Biological Journal of the Linnean Society, 2009, 98, 422–438

DISCUSSIONGENETIC DIFFERENTIATION BETWEEN THE SPECIES
Yellowhammers and pine buntings differ noticeably inplumage, song, and geographic distributions (Panovet al., 2003, 2007; Rubtsov, 2007), suggesting a longperiod of allopatric divergence. Thus, we expected tofind sizeable genetic divergence between them. Sur-prisingly, patterns of mtDNA variation were extraor-dinarily similar between the species, with manyshared haplotypes, a nonsignificant FST of 0.025, anda corrected sequence divergence of only 0.00054%.The estimated mitochondrial divergence date betweenspecies based on both the isolation model and theisolation with migration model is only approximately30 000 years ago, which is an extraordinarily shorttime compared to most estimated divergence timesbetween avian sister species, the bulk of which arebetween one and six million years ago (Weir &Schluter, 2007). A variety of analyses (Tajima’s D,Fu’s FS, Ewens–Watterson–Slatkin’s exact test, andIMa results) all indicate that mtDNA has undergonesubstantial population growth and/or selective
FST
Num
ber
of m
arke
rs
0.50.40.30.20.10.0
0
10
20
30
Figure 5. Distribution of FST values between allopatricyellowhammers and allopatric pine buntings for 63 vari-able amplified fragment length polymorphism (AFLP)markers from five primer combinations (AFLP dataset 1).FST was calculated based on allele frequencies estimatedusing AFLP-SURV (Vekemans, 2002). Most markers differlittle in frequency between the species, but a small per-centage show a strong difference (seven out of 63, or 11%,show an FST larger than 0.1).
Table 2. Identities of the 20 informative AFLP fragments that differ in frequency (see Material and Methods for criteria)between allopatric yellowhammers and pine buntings
EcoRI primer*(NNN-3!)
MseI primer†(NNN-3!)
Approximatefragmentlength
Frequency inyellowhammers
Frequencyin pinebuntings
AAC CTT 112 0.19 0.73AAC CTT 135 0.62 0.07ACA CTA 231 0.08 0.53ACA CTA 406 0.27 0.53ACC CAA 65 0.31 0.53ACC CAA 223 0.38 0.67ACC CAA 323 0.00 1.00ACC CAT 468 0.19 0.80ACT CAA 64 0.46 1.00ACT CAA 225 0.31 0.60ACT CAA 226 0.27 0.80ACT CAA 236 0.23 0.60ACT CAA 251 0.23 0.67ACT CAT 176 0.38 1.00ACT CAT 182 0.15 0.60ACT CAT 279 0.31 0.53ACT CAT 303 0.31 0.60AGC CTT 245 0.58 0.20AGG CTA 187 0.69 0.13AGG CTA 552 0.15 0.67
*EcoRI primer: 5!-GACTGCGTACCAATTCNNN-3!.†MseI primer: 5!-GATGAGTCCTGAGTAANNN-3!.
MITOCHONDRIAL INTROGRESSION IN EMBERIZA 431
© 2009 The Linnean Society of London, Biological Journal of the Linnean Society, 2009, 98, 422–438
sweeps, and that the pattern in yellowhammers andpine buntings are remarkably similar.
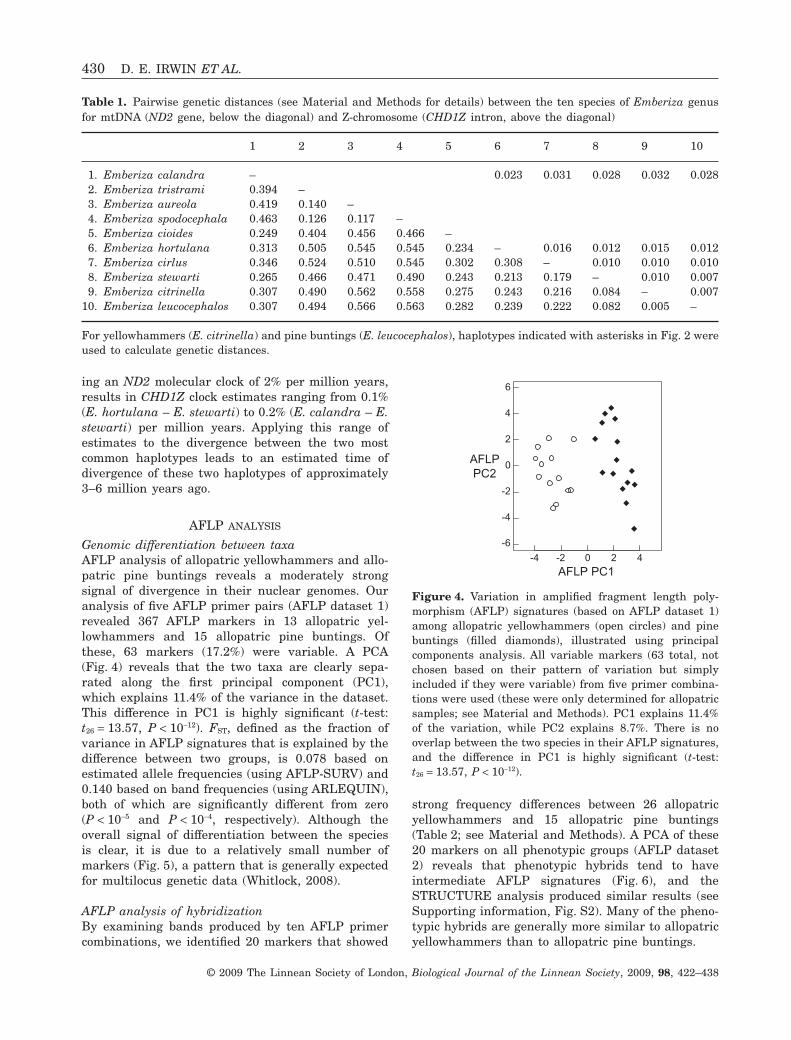
In contrast to mtDNA, nuclear markers do showmoderately strong divergence between yellowham-mers and pine buntings. Significant divergence wasobserved at the nuclear CHD1Z intron in frequenciesof alleles, although alleles were shared between thespecies. In AFLP markers, there is a clear signal ofdivergence, although it is relatively modest comparedto the amounts of AFLP divergence between otheravian species pairs. Our FST estimate based on AFLPband frequencies is 0.14, whereas this measurement ofdivergence is 0.18 between greater and lesser spottedeagles (Aquila clanga and Aquila pomarina; Helbiget al., 2005), 0.38 between white-winged crossbills andHispaniolan crossbills (Loxia leucoptera and Loxiamegaplaga; Parchman et al., 2006), 0.4 between tworeproductively isolated taxa of greenish warbler [P. t.viridanus and P. (t.) plumbeitarsus; Irwin et al., 2005),and 0.42 between two cryptic species of winter wrens(Troglodytes troglodytes and Troglodytes (Troglodytes)pacificus; Toews & Irwin, 2008]. In three of these othercases, divergence in mtDNA has been assessed and isquite substantial (eagles: 1.75% in cytb; warblers: 5%in control region; wrens: 6.2% in ND2).
These findings lead to two strong conclusions. First,the two species do differ genetically, suggesting thatthe two species are evolutionarily significant unitsthat have experienced some period of relatively inde-pendent evolution. Second, this genetic difference canbe clearly seen only in approximately 10% of thegenome (Fig. 5). These results demonstrate that esti-mates of genetic divergence can differ dramaticallybetween different molecular markers, and that asmall but important subset of the genome can differmarkedly even when most of the genome does not. Itis possible that the few AFLP markers that show highdivergence between the species are closely linked togenes that are under divergent selection in the twospecies.
These patterns can be explained in two ways. First,if we were to assume that the mitochondrial relation-ships are representative of true history, we wouldhave to conclude that yellowhammers and pinebuntings shared a common ancestor approximately30 000 years ago (95% CI = 14 000–97 000 years).Under this scenario, the differentiation in phenotypesand in some AFLP markers would have occurredextremely rapidly, most likely as a result of strongselection. This would qualify as one of the fastestknown cases of bird speciation, which, in most cases,takes more than a million years (Price, 2008). Thisscenario is extremely difficult to reconcile with thenoticeable divergence in plumage colour, songs,ecology, and nuclear DNA.
Second, a much more parsiminoious explanationof these patterns is recent introgression of mtDNAbetween divergent forms. Recent hybridization mighthave introduced mtDNA from one species into theother, and that mitochondrial clade might have thenbecome fixed in both species. This process can intheory occur rather easily, even when there is fairlystrong selection against hybrids (Takahata & Slatkin,1984). The smaller effective population size of mtDNAcompared to nuclear DNA makes mtDNA particularlysusceptible to fixation of foreign haplotypes (Funk &Omland, 2003). A selective advantage of one type ofmitochondria over another could have hastened thisprocess (Grant, Spies & Canino, 2006; Dowling et al.,2008). This process of introgression, drift, and pos-sible selection would also apply to nuclear genes.Over a long period of hybridization, much of thegenome could have become homogenized between thespecies, whereas parts that were strongly selected indifferent directions continued to diverge between thespecies. We suggest that this second scenario, of intro-gression between two highly distinctive species, iseasier to reconcile with the observed patterns.
The estimated time at which this mitochondrialintrogression occurred (14 000–97 000 years ago) isdifficult to reconcile with paleoclimatological history
1 2 3 4 5 6 7
Group
0
4
-4
AFLPPC1
Figure 6. Genetic variation among yellowhammers, pinebuntings, and phenotypic hybrids. The primary axis ofvariation (PC1) in a principal components analysis of 20informative amplified fragment length polymorphism(AFLP) markers (AFLP dataset 2) is shown for sevenphenotypic categories (Panov et al., 2003), with eachdiamond representing a single individual. Group numbersalong the horizontal axis indicate (1) allopatric yellowham-mers, (2) yellowhammers from the contact zone, (3) yellowhybrids, (4) white hybrids, (5) pine buntings with slighthybrid phenotypes, (6) pine buntings in or near the contactzone, and (7) allopatric pine buntings. PC1 explains 20.1%of the variance, and varies significantly among phenotypicgroups (analysis of variance: F = 65.98, d.f. = 6 and 58,P < 10-15). AFLP variation clearly distinguishes the twospecies (t-test between allopatric groups: t39 = -19.56,P < 10-15), and hybrids have a range of intermediatevalues.
432 D. E. IRWIN ET AL.
© 2009 The Linnean Society of London, Biological Journal of the Linnean Society, 2009, 98, 422–438

because this span of time occurred during the lastmajor glacial period, which began approximately110 000 years ago and ended approximately 12 000years ago (Adams & Faure, 1997). If yellowhammersand pine buntings were confined to separate refugia(e.g. the former in Europe or central Asia, the latterin south-east Asia), it might be unlikely that hybrid-ization would have occurred during this major glacialperiod. However, there is evidence that the periodfrom 55 000–25 000 years ago was relatively mild,with evidence for some wooded vegetation acrossSiberia (Adams & Faure, 1997). Hence, it is possiblethat yellowhammers and pine buntings did hybridizeduring that period, which would be consistent withthe estimates from IMa. This is the first study thatwe of aware of to provide evidence of such geneticcontact between western and eastern Palearctic refu-gial forms during that more mild phase of the lastglacial period. An important caveat is that the IMaanalysis assumes selective neutrality; it is possiblethat introgression of mtDNA may have occurred muchmore recently through the actions of selection.
CHD1Z patterns are remarkably supportive of thisintrogression scenario rather than a scenario of recentspeciation. The CHD1Z haplotype network stronglysuggests a recombinant origin of many haplotypes;the alternative explanation of so many identical muta-tions occurring multiple times is implausible. The twomost common haplotypes (GTTGTT, the most commonhaplotype in yellowhammers; and AOCGCA, the mostcommon haplotype in pine buntings) are also themost divergent of all haplotypes (except for one rarehaplotype, AOCACA), suggesting that they representthe haplotypes ancestral in the two species. Thesetwo haplotypes are roughly as divergent as we mightexpect sister species of Emberiza to be, given thegenetic distances throughout the Emberiza phylogeny(e.g. the GTTGTT and AOCGCA haplotypes are asdivergent as the GTTGTT haplotype is from E. stew-arti). All of the other haplotypes, with the sole excep-tion of AOCACA, are simple combinations of thesemajor haplotypes. If mutation rates were high, wewould expect to see many haplotypes that differ froma common one by a single mutation, a pattern notseen. Overall, the patterns are suggestive of recombi-nation between highly divergent forms of CHD1Z.These forms likely correspond to distinct yellowham-mer and pine bunting forms of CHD1Z before hybrid-ization, recombination, and introgression led to thecurrent mixed pattern. The estimated time of diver-gence between these haplotypes, three to six millionyears ago, provides a very approximate maximumestimate for when the two species started diverging.It should be noted that the Z chromosome may playan especially large role in speciation in female-heterogametic groups such as birds, and may be less
subject to genetic mixing between incipient speciescompared to other parts of the genome (Qvarnström &Bailey, 2009).
MOLECULAR IDENTIFICATION OF HYBRIDIZATION
Our analysis strongly supports the hypothesis thathybrids can be identified based on appearance, asindividuals with apparent hybrid phenotypes usuallyhad intermediate AFLP signatures. This result con-firms the utility of screening large numbers of AFLPmarkers between two allopatric samples, and thenusing a subset of markers that are most divergent infrequency to test whether there is hybridization insympatry and to compare the genetic signatures ofbirds in the hybrid zone to those in allopatry. Itwould require much further analysis, as well aslarger sample sizes, to accurately assign birds in thecontact zone to hybrid categories, such as F1, F2,backcross, etc.; this goal is beyond the scope of thepresent study.
Most phenotypic hybrids are more similar to allo-patric yellowhammers than they are to allopatric pinebuntings. This pattern suggests that gene flow fromthe contact zone has affected allopatric Europeanpopulations of yellowhammers to a greater extentthan allopatric populations of pine buntings. Perhapsbackcrosses with yellowhammers have higher fitnessthan backcrosses with pine buntings, or perhaps yel-lowhammers have larger dispersal distances, leadingto greater gene flow across their range. Whatever thecause of this pattern, it is in accordance with thedistribution of various colour phenotypes within theyellowhammer breeding range. Populations of yel-lowhammers in the eastern part of their range tend tohave some chestnut coloration on the throat; this andother plumage traits have led some authors to treatthem as a distinct subspecies (Emberiza citrinellaerythrogenys; Cramp & Perrins, 1994; Byers, Curson& Olsson, 1995), although this variation is subtle andvaries clinally from the traits of the EuropeanEmberiza citrinella citrinella. The suggestion ofPanov et al. (2003) that E. c. erythrogenys could be aproduct of ancient hybridization between yellowham-mers and pine buntings appears to be consistent withour molecular data. These results indicate the possi-bility of hybridization being a creative force, rear-ranging gene combinations to create novel phenotypesthat are relatively successful over time (Arnold,1997).
MITOCHONDRIAL INTROGRESSION
There is growing recognition that introgression ofmtDNA between species might be quite common
MITOCHONDRIAL INTROGRESSION IN EMBERIZA 433
© 2009 The Linnean Society of London, Biological Journal of the Linnean Society, 2009, 98, 422–438
(Good et al., 2008), as is suggested by the high rateof species paraphyly and polyphyly in interspecificmitochondrial gene trees (Funk & Omland, 2003).Cases of partial introgression of heterospecificmtDNA has been observed in a variety of species(Rohwer, Bermingham & Wood, 2001; Wecksteinet al., 2001; Good et al., 2003, 2008; Deffontaineet al., 2005; Melo-Ferreira et al., 2005; Plötner et al.,2008), although the case of the yellowhammer andpine bunting is unusual in the magnitude of phe-notypic differentiation between the species and theextent of mitochondrial blending, with the type ofone species apparently completely replacing that ofthe other. Such complete replacement is remarkablebetween species that differ so noticeably in appear-ance. Cases of complete replacement might be muchmore common than presently thought because theyare difficult to detect. When mtDNA has only par-tially introgressed, it is detectable because membersof one species have two very divergent forms ofmtDNA, one of which is similar to the other species(Plötner et al., 2008). When complete replacementhas occurred, there are no surviving examples of theextinct haplotype group to reveal the presence ofintrogression; the remaining pattern is simply oneof mtDNA similarity between the two species, whichcould be mistakenly interpreted as recent populationsplitting.
It is increasingly recognised that mitochondrialDNA could often be under selection, challenging theassumption of neutrality that is common to manyanalytical methods used in studies of phylogeography,speciation, and conservation genetics (Ballard &Whitlock, 2004; Bazin et al., 2006; Dowling et al.,2008). Selection can occur in many ways, includinglocal adaptation of different mtDNA variants to dif-ferent environmental conditions, coevolution betweenmitochondrial and nuclear genes (Dowling et al.,2008), and selective sweeps of universally favouredmitochondrial mutations. We suggest that a selectivesweep is the likely explanation for the mitochondrialintrogression between yellowhammers and pine bun-tings, as it is implausible that a complete replacementof one species’ mtDNA by another occurred by driftalone. A possible scenario consistent with the data isas follows: a favourable mutation arose in mtDNA ofone of the species and rose in frequency as a result ofselection. A short time later, hybridization introducedthis variant to the other species. The favourablevariant then continued to grow in frequency withinboth species, and hybridization continued to transfervariants of this favourable mtDNA between thespecies. Eventually, all other variants of mtDNA van-ished from both populations. Plötner et al. (2008) sug-gested that a variant of mtDNA that arose in onespecies of water frog has spread to another species
because it is selectively advantageous to both speciesin the more northerly parts of their ranges. Parallelshifts in climate or other environmental variablesmay be quite common for sister species; during suchshifts, the mitochondria in one of the species maybecome better adapted to the new conditions and,assisted by hybridization, sweep to fixation in bothspecies.
These findings highlight the challenges inherentin the use of molecular variation to reconstruct bio-geographic history and identify evolutionarily sig-nificant units. Because of both shared ancestralpolymorphism and introgressive hybridization, twogroups that have experienced much independentevolution can be similar in most of their genomewhile still differing in those parts that are underdivergent selection. These differences can be main-tained even when two groups hybridize extensively,given strong enough selection for alternative allelesin the two groups (Barton & Hewitt, 1985, 1989;Wu, 2001). Hybridization is being increasingly rec-ognized for its potentially creative role in evolutionbecause differential introgression can lead to novelgene combinations (Arnold, 1997; Mallet, 2005;Price, 2008). In the case of yellowhammers and pinebuntings, mtDNA appears to have introgressedbetween two phenotypically distinct forms thatdiffer in parts of their nuclear genomes. Thus,mtDNA, as well as many parts of the nucleargenome, would provide a misleading picture of thehistory of the species complex.
Our findings should be considered in light ofthe traditional emphasis on the use of mtDNA intaxonomy at the species and subspecies level. Forexample, Zink (2004) argued that phenotypically-defined subspecies should not be considered evolu-tionarily significant units if they do not correspond todistinct mitochondrial clades. Such reasoning, whenapplied to our study group, would lead to the mis-taken conclusion that yellowhammers and pine bun-tings are a single genetically undifferentiated group.Plumage patterns (Panov et al., 2003, 2007), song(Rubtsov, 2007), AFLP, and CHD1Z lead to a differentconclusion. Introgression is just one of the manyreasons that patterns of relationships in mtDNA maynot accurately represent relationships in nuclearDNA (Irwin, 2002; Ballard & Whitlock, 2004; Chan& Levin, 2005; Edwards et al., 2005; Jennings &Edwards, 2005; Shaffer & Thomson, 2007). We predictthat distinct phenotypic groupings will increasinglybe supported by multilocus nuclear-DNA surveysbased on AFLP (Bensch, Åkesson & Irwin, 2002),single nucleotide polymorphisms (Shaffer & Thomson,2007), or multiple gene sequences (Jennings &Edwards, 2005), even when mtDNA does not differbetween groups.
434 D. E. IRWIN ET AL.
© 2009 The Linnean Society of London, Biological Journal of the Linnean Society, 2009, 98, 422–438

ACKNOWLEDGEMENTS
We are grateful to Trevor Price for assisting with thedevelopment of this project, as well as much helpfuldiscussion. We thank Mikhail Markovetz for collect-ing blood samples from the Baltic Sea region, andAndrei Lissovskii (Zoological Museum of Moscow Uni-versity) and Sergei Drovetskii (University of Alaska)for assistance with field sampling and advice regard-ing molecular analysis. We are grateful to the follow-ing individuals and the museums they represent forproviding tissue samples for this work: Sharon Birks(Burke Museum, University of Washington), RobertZink (Bell Museum, University of Minnesota), DavidWillard (Field Museum of Natural History, Chicago),Per Alström (Swedish Museum of Natural History,Stockholm), and Jon Fjeldså (Zoological Museum,University of Copenhagen). Sincere thanks areextended to David Toews, Alan Brelsford, and JasonWeir (University of the British Columbia, Vancouver)for technical support and advice regarding themolecular analysis, and to Alan Brelsford, CarolIrwin, Jessica Irwin, Johan Lindell, and anonymousreferees for comments on the manuscript. For finan-cial support we thank the US Civilian Research andDevelopment Foundation (grant RUB1-2630-MO-04), the Natural Sciences and Engineering ResearchCouncil of Canada, the Canadian Foundation forInnovation, and the British Columbia KnowledgeDevelopment Fund.
REFERENCES
Adams JM, Faure H, eds. 1997. Review and atlas of palae-ovegetation: preliminary land ecosystem maps of the worldsince the Last Glacial Maximum. Oak Ridge, TN: Oak RidgeNational Laboratory. Accessed online 7 August 2008. Avail-able at http://www.esd.ornl.gov/projects/qen/adams1.html
Alström P, Olsson U, Lei F, Wang H-t, Gao W, SundbergP. 2007. Phylogeny and classification of the Old WorldEmberizini (Aves, Passeriformes). Molecular Phylogeneticsand Evolution 47: 960–973.
Arnold ML. 1997. Natural hybridization and evolution.Oxford: Oxford University Press.
Avise JC. 2004. Molecular markers, natural history and evo-lution. Sunderland, MA: Sinauer Associates.
Ballard JWO, Whitlock MC. 2004. The incomplete naturalhistory of mitochondria. Molecular Ecology 13: 729–744.
Barton NH, Hewitt GM. 1985. Analysis of hybrid zones.Annual Review of Ecology and Systematics 16: 113–148.
Barton NH, Hewitt GM. 1989. Adaptation, speciation andhybrid zones. Nature 341: 497–503.
Bazin E, Glémin S, Galtier N. 2006. Population size doesnot influence mitochondrial genetic diversity in animals.Science 312: 570–572.
Bensch S, Åkesson M. 2005. Ten years of AFLP in ecology
and evolution: why so few animals? Molecular Ecology 14:2899–2914.
Bensch S, Åkesson S, Irwin DE. 2002. The use of AFLP tofind an informative SNP: genetic differences across a migra-tory divide in willow warblers. Molecular Ecology 11: 2359–2366.
Byers C, Curson J, Olsson U. 1995. Sparrows and buntings:a guide to the sparrows and buntings of North America andthe world. New York, NY: Houghton Mifflin.
Chan KMA, Levin SA. 2005. Leaky prezygotic isolation andporous genomes: rapid introgression of maternally inheritedDNA. Evolution 59: 720–729.
Clement M, Posada D, Crandall K. 2000. TCS: a computerprogram to estimate gene genealogies. Molecular Ecology9: 1657–1660.
Cramp S, Perrins CM, eds. 1994. The birds of the westernPalearctic, Vol. 9. Oxford: Oxford University Press.
Deffontaine V, Libois R, Kotlik P, Sommer R, Nieberd-ing C, Paradis E, Searle JB, Michaux JR. 2005. Beyondthe Mediterranean peninsulas: evidence of central Euro-pean glacial refugia for a temperate forest mammal species,the bank vole (Clethrionomys glareolus). Molecular Ecology14: 1727–1739.
Dowling DK, Friburg U, Lindell J. 2008. Evolutionaryimplications of non-neutral mitochondrial genetic variation.Trends in Ecology and Evolution 23: 546–554.
Drovetski SV, Zink RM, Fadeev IV, Nesterov EV, KoblikEA, Red’kin YA, Rohwer S. 2004. Mitochondrial phylog-eny of Locustella and related genera. Journal of AvianBiology 35: 105–110.
Edwards SV, Kingan SB, Calkins JD, Balakrishnan CN,Jennings WB, Swanson WJ, Sorensen MD. 2005. Spe-ciation in birds: genes, geography, and sexual selection.Proceedings of the National Academy of Sciences of theUnited States of America 102: 6550–6557.
Excoffier L, Laval G, Schneider S. 2005. Arlequin ver. 3.0:an integrated software package for population genetics dataanalysis. Evolutionary Bioinformatics Online 1: 47–50.
Excoffier L, Laval G, Schneider S. 2006. Arlequin ver 3.1user manual. Available at http://cmpg.unibe.ch/software/arlequin3
Falush D, Stephens M, Pritchard JK. 2007. Inference ofpopulation structure using multilocus genotype data: domi-nant markers and null alleles. Molecular Ecology Notes 7:574–578.
Frenzel B. 1968. The Pleistocene vegetation of northernEurasia. Science 161: 637–649.
Fridolfsson A-K, Ellegren H. 1999. A simple and universalmethod for molecular sexing of non-ratite birds. Journal ofAvian Biology 30: 116–121.
Fu Y-X. 1997. Statistical tests of neutrality of mutationsagainst population growth, hitchhiking and backgroundselection. Genetics 147: 915–925.
Funk DJ, Omland KE. 2003. Species-level paraphylyand polyphyly: frequency, causes, and consequences,with insights from animal mitochondrial DNA. AnnualReview of Ecology, Evolution, and Systematics 34: 397–423.
MITOCHONDRIAL INTROGRESSION IN EMBERIZA 435
© 2009 The Linnean Society of London, Biological Journal of the Linnean Society, 2009, 98, 422–438

Good JM, Demboski JR, Nagorsen DW, Sullivan J. 2003.Phylogeography and introgressive hybridization: chipmunks(genus Tamias) in the northern Rocky Mountains. Evolution57: 1900–1916.
Good JM, Hird S, Reid N, Demboski JR, Steppan SJ,Martin-Nims TR, Sullivan J. 2008. Ancient hybridizationand mitochondrial capture between two species of chip-munks. Molecular Ecology 17: 1313–1327.
Grant WS, Spies IB, Canino MF. 2006. Biogeographic evi-dence for selection on mitochondrial DNA in North Pacificwalleye pollock Theragra chalcogramma. Journal of Hered-ity 97: 571–580.
Haffer J. 1989. Parapatrische Vogelarten der paläarktischenRegion. Journal für Ornithologie 130: 475–512.
Hall TA. 1999. BioEdit: a user-friendly biological sequencealignment editor and analysis program for Windows 95/98/NT. Nucleic Acids Symposium Series 41: 95–98.
Helbig AJ, Seibold I, Kocum A, Liebers D, Irwin J,Bergmanis U, Meyburg BU, Scheller W, Stubbe M,Bensch S. 2005. Genetic differentiation and hybridizationbetween greater and lesser spotted eagles (Accipitriformes:Aquila clanga, A. pomarina). Journal of Ornithology 146:226–234.
Hey J. 2007. Using the IMa program. Distributed bythe author. Available at http://lifesci.rutgers.edu/~heylab/heylabsoftware.htm
Hey J, Nielsen R. 2007. Integration with the Felsensteinequation for improved Markov chain Monte Carlo methodsin population genetics. Proceedings of the National Academyof Sciences of the United States of America 104: 2785–2790.
Irwin DE. 2002. Phylogeographic breaks without geographicbarriers to gene flow. Evolution 56: 2383–2394.
Irwin DE, Bensch S, Irwin JH, Price TD. 2005. Speciationby distance in a ring species. Science 307: 414–416.
Irwin DE, Bensch S, Price TD. 2001. Speciation in a ring.Nature 409: 333–337.
Irwin DE, Irwin JH. 2005. Siberian migratory divides: therole of seasonal migration in speciation. In: Greenberg R,Marra PP, eds. Birds of two worlds: the ecology and evolu-tion of migratory birds. Baltimore, MD: Johns HopkinsUniversity Press, 27–40.
Jennings WB, Edwards SV. 2005. Speciational history ofAustralian grass finches (Poephila) inferred from thirtygene trees. Evolution 59: 2033–2047.
Kondo B, Peters JL, Rosensteel BB, Omland KE. 2008.Coalescent analyses of multiple loci support a new route tospeciation in birds. Evolution 62: 1182–1190.
LI-COR Biosciences. 2003. Applications manual: model4300 DNA analyzer. Lincoln, NE: LI-COR Biosciences.
Lovette IJ. 2004. Mitochondrial dating and mixed-supportfor the ‘2% rule’ in birds. Auk 121: 1–6.
Lynch M, Milligan B. 1994. Analysis of population geneticstructure with RAPD markers. Molecular Ecology 3: 91–99.
Mallet J. 2005. Hybridization as an invasion of the genome.Trends in Ecology and Evolution 20: 229–237.
Melo-Ferreira J, Boursot P, Suchentrunk F, Ferrand N,Alves PC. 2005. Invasion from the cold past: extensiveintrogression of mountain hare (Lepus timidus) mitochon-
drial DNA into three other hare species in northern Iberia.Molecular Ecology 14: 2459–2464.
Nazarenko AA. 1990. [Avifaunal interchange between southand north Asia at the eastern periphery of the continent: thelast glacial-interglacial cycle.]. Zhurnal Obshchei Biologii51: 89–106 (in Russian).
Newton I. 2003. The speciation and biogeography of birds.London: Academic Press.
Nielsen R, Wakeley J. 2001. Distinguishing migration fromisolation. A Markov chain Monte Carlo approach. Genetics158: 885–896.
Panov EN 1989. [Hybridization and ethological isolation inbirds.] Moscow: Nauka (in Russian).
Panov EN, Rubtsov AS, Monzikov DG. 2003. Hybridiza-tion between yellowhammer and pine bunting in Russia.Dutch Birding 25: 17–31.
Panov EN, Rubtsov AS, Mordkovich MV. 2007. [New dataon interrelationships of two bunting species (Emberizacitrinella, E. leucocephala) interbreeding in zone of theirranges overlap.]. Zoologicheskii Zhurnal 86: 1362–1378(in Russian).
Parchman TL, Benkman CW, Britch SC. 2006. Patterns ofgenetic variation in the adaptive radiation of New Worldcrossbills (Aves: Loxia). Molecular Ecology 15: 1873–1887.
Plötner J, Uzzell T, Beerli P, Spolsky C, Ohst T, Litvin-chuk SN, Guex G-D, Reyer H-U, Hotz H. 2008. Wide-spread unidirectional transfer of mitochondrial DNA: a casein western Palaearctic water frogs. Journal of EvolutionaryBiology 21: 668–681.
Price T. 2008. Speciation in birds. Greenwood Village, CO:Roberts and Company.
Pritchard JK, Stephens M, Donnelly P. 2000. Inferenceof population structure using multilocus genotype data.Genetics 155: 945–959.
Qvarnström A, Bailey RI. 2009. Speciation through evolu-tion of sex-linked genes. Heredity 102: 4–15.
R Development Core Team. 2006. R: a language and envi-ronment for statistical computing. Vienna: R Foundation forStatistical Computing. Available at http://www.R-project.org
Ravkin YS. 1973. [The birds of north-eastern Altai.] Novosi-birsk, Russia: Nauka (in Russian).
Rogacheva H. 1992. The birds of central Siberia. Husum,Germany: Husum Druck- und Verlagsgesellschaft.
Rohwer S, Bermingham E, Wood C. 2001. Plumage andmitochondrial DNA haplotype variation across a movinghybrid zone. Evolution 55: 405–422.
Rubinoff D, Holland BS. 2005. Between two extremes:mitochondrial DNA is neither the panacea nor the nemesisof phylogenetic and taxonomic inference. Systematic Biology54: 952–961.
Rubtsov AS. 2007. [Variation in songs of yellowhammer andpine bunting (Emberiza citrinella, E. leucocephala) as anevidence for the population structure dynamics and evolu-tionary history of species.] Zoologicheskiı. Zhurnal 86: 863–876 (in Russian).
Sæther B-E, Lande R, Engen S, Weimerskirch H,Lillegård M, Altwegg R, Becker PH, Bregnballe T,
436 D. E. IRWIN ET AL.
© 2009 The Linnean Society of London, Biological Journal of the Linnean Society, 2009, 98, 422–438
Brommer JE, McCleery RH, Merilä J, Nyholm E,Rendell W, Robertson RR, Tryjanowski P, Visser ME.2005. Generation time and temporal scaling of bird popu-lation dynamics. Nature 436: 99–102.
Scheet P, Stephens M. 2006. A fast and flexible statisticalmodel for large-scale population genotype data: applicationsto inferring missing genotypes and haplotypic phase. Ameri-can Journal Human Genetics 78: 629–644.
Schmidt HA, Strimmer K, Vingron M, von Haeseler A.2002. TREE-PUZZLE: maximum likelihood phylogeneticanalysis using quartets and parallel computing. Bioinfor-matics 18: 502–504.
Seutin G, White BN, Boag PT. 1991. Preservation of avianblood and tissue samples for DNA analyses. CanadianJournal of Zoology 69: 82–90.
Shaffer HB, Thomson RC. 2007. Delimiting species inrecent radiations. Systematic Biology 56: 896–906.
Slatkin M. 1996. A correction to the exact test based on theEwens sampling distribution. Genetical Research 68: 259–260.
Sorenson MD, Quinn TW. 1998. Numts: a challenge foravian systematics and population biology. Auk 115: 214–221.
Svensson EI, Kristoffersen L, Oskarsson K, Bensch S.2004. Molecular population divergence and sexual selectionon morphology in the banded demoiselle (Calopteryx splen-dens). Heredity 93: 423–433.
Tajima F. 1989. Statistical method for testing the neutralmutation hypothesis by DNA polymorphism. Genetics 123:585–595.
Takahata N, Slatkin M. 1984. Mitochondrial gene flow.Proceedings of the National Academy of Sciences of theUnited States of America 81: 1764–1767.
Toews DPL, Irwin DE. 2008. Cryptic speciation in a Hol-arctic passerine revealed by genetic and bioacoustic analy-ses. Molecular Ecology 17: 2691–2705.
Vekemans X. 2002. AFLP-SURV, Version 1.0. Distributed bythe author. Belgium: Laboratoire de Génétique et EcologieVégétale, Université Libre de Bruxelles.
Vos P, Hogers R, Bleeker M, Reijans M, van de Lee T,Hornes M, Frijters A, Pot J, Peleman J, Kuiper M,Zabeau M. 1995. AFLP: A new technique for DNA finger-printing. Nucleic Acids Research 23: 4405–4414.
Weckstein JD, Zink RM, Blackwell-Rago RC, Nelson DA.2001. Anomalous variation in mitochondrial genomesof White-crowned (Zonotrichia leucophrys) and Golden-crowned (Z. atricapilla) Sparrows: pseudogenes, hybridiza-tion, or incomplete lineage sorting? Auk 118: 231–236.
Weir JT. 2006. Divergent patterns of species accumulation inlowland and highland neotropical birds. Evolution 60: 842–855.
Weir JT, Schluter D. 2007. The latitudinal gradient inrecent speciation and extinction rates in birds andmammals. Science 315: 1928–1933.
Weir JT, Schluter D. 2008. Calibrating the avian molecularclock. Molecular Ecology 17: 2321–2328.
Whitlock MC. 2008. Evolutionary inference from QST.Molecular Ecology 17: 1885–1896.
Won YJ, Hey J. 2005. Divergence population genetics ofchimpanzees. Molecular Biology and Evolution 22: 297–307.
Wu C-I. 2001. The genic view of the process of speciation.Journal of Evolutionary Biology 14: 851–865.
Zhivotovsky LA. 1999. Estimating population structure indiploids with multilocus dominant DNA markers. MolecularEcology 8: 907–913.
Zink RM. 2004. The role of subspecies in obscuring avianbiological diversity and misleading conservation policy. Pro-ceedings of the Royal Society of London Series B, BiologicalSciences 271: 561–564.
Zink RM, Barrowclough GF. 2008. Mitochondrial DNAunder siege in avian phylogeography. Molecular Ecology 17:2107–2121.
SUPPORTING INFORMATION
Additional Supporting Information may be found in the online version of this article:
Figure S1. Output of demographic modelling based on mitochondrial ND2 haplotypes and the isolation withmigration model as implemented in IMa. Shown are posterior probability distributions of (a) time of populationsplitting, (b) mean time of migration events, (c) post-split migration rates, and (d) ancestral population size ofthe common ancestor of yellowhammers and pine buntings. The runs included two with migration rate set tozero (solid and dotted black lines) and two that allowed migration after splitting (solid and dotted grey lines).In (b) and (c), migration from yellowhammers to pine buntings (going forward in time) is represented by lightgrey, and the reverse is represented by dark grey. Peaks of the probability distributions as well as 95%confidence intervals (CIs) were similar between runs for both t [peak and 95% CIs: no migration, run 1: 0.33(0.21–0.50); run 2: 0.33 (0.21–0.50); with migration, run 1: 0.32 (0.21–0.48); run 2: 0.33 (0.21–0.52)] and qA [nomigration, run 1: 7.4 (3.3–19.9); run 2: 8.0 (3.3–20.5); with migration, run 1: 8.0 (3.3–20.5); run 2: 8.0 (3.9–20.5)].Assuming a mtDNA mutation rate of 1% per million years and a generation time of 1.7 years (see Material andMethods), these estimates convert to a splitting time of approximately 32 000 years ago (95% CI = 20 000–48 000 years ago) and an ancestral effective population size of 110 000 (47 000–290 000). Migration events (b)had a mean time that was approximately halfway between the original split and the present, suggesting that
MITOCHONDRIAL INTROGRESSION IN EMBERIZA 437
© 2009 The Linnean Society of London, Biological Journal of the Linnean Society, 2009, 98, 422–438
migration events were spread throughout the period of time subsequent to the split. The migration rate (c) couldnot be estimated confidently – values of migration rates ranging from m = 0 to 100 had similar probability.Figure S2. Probabilities of population assignment, based on analysis of 20 informative amplified fragmentlength polymorphism (AFLP) markers (AFLP dataset 2) by STRUCTURE 2.2. Phenotypic categories arearranged along the horizontal axis (Fig. 6), and vertical axis represents the probability of assignment to the pinebunting cluster. STRUCTURE was run with an admixture model, a burn-in time of 10 000 steps and a runlength of 10 000 steps. Because the markers were specifically chosen to best distinguish between allopatricyellowhammers and allopatric pine buntings, we expected STRUCTURE to reveal that the optimal number ofgenetic groups (k) was 2. To check, we ran STRUCTURE at a range of k values (1–7), and compared thelikelihood of the data among the values of k. The highest likelihood was for k = 2 (log likelihoods for k = 2: -1068;k = 1: -1138; k = 3–7: -1074 to -2950). Ten separate runs of STRUCTURE at k = 2 produced almost identicalresults; hence, only the results from the first run are shown.Table S1. Origin of samples used in the molecular analysis of yellowhammers, pine buntings, their hybrids, andrelated species.
Please note: Wiley-Blackwell are not responsible for the content or functionality of any supporting materialssupplied by the authors. Any queries (other than missing material) should be directed to the correspondingauthor for the article.
438 D. E. IRWIN ET AL.
© 2009 The Linnean Society of London, Biological Journal of the Linnean Society, 2009, 98, 422–438