mixed convection blowoff limits as a function of oxygen
TRANSCRIPT
47th International Conference on Environmental Systems ICES-2017-370 16-20 July 2017, Charleston, South Carolina
Mixed convection blowoff limits as a function of oxygen
concentration and upward forced stretch rate for burning
pmma rods of various sizes
Jeremy W. Marcum1
Purdue University, West Lafayette, IN 47907-2040
Paul V. Ferkul2
USRA, Cleveland, OH 44135
and
Sandra L. Olson3
NASA Glenn Research Center, Cleveland, OH 44135
Normal gravity flame blowoff limits in an axisymmetric pmma rod geometry in upward
axial stagnation flow are compared with microgravity Burning and Suppression of Solids – II
(BASS-II) results recently obtained aboard the International Space Station. This testing
utilized the same BASS-II concurrent rod geometry, but with the addition of normal gravity
buoyant flow. Cast polymethylmethacrylate (pmma) rods of diameters ranging from 0.635
cm to 3.81 cm were burned at oxygen concentrations ranging from 14 to 18% by volume. The
forced flow velocity where blowoff occurred was determined for each rod size and oxygen
concentration. These blowoff limits compare favorably with the BASS-II results when the
buoyant stretch is included and the flow is corrected by considering the blockage factor of the
fuel. From these results, the normal gravity blowoff boundary for this axisymmetric rod
geometry is determined to be linear, with oxygen concentration directly proportional to flow
speed. We describe a new normal gravity ‘upward flame spread test’ method which
extrapolates the linear blowoff boundary to the zero stretch limit to resolve microgravity
flammability limits—something current methods cannot do. This new test method can
improve spacecraft fire safety for future exploration missions by providing a tractable way to
obtain good estimates of material flammability in low gravity.
Nomenclature
a stretch rate (s-1)
A area (cm2)
B blockage factor, Eq. 3, Table 1
g gravity (cm/s2)
K constant, Eq. 5
r radius (cm)
U velocity (cm/s)
1 Graduate Student, Aerospace Engineering, Purdue University, West Lafayette, IN. 2 Spacecraft Fire Safety Scientist, USRA, NASA Glenn Research Center, Cleveland, OH. 3 Spacecraft Fire Safety Scientist, NASA Glenn Research Center, Cleveland, OH.
Greek
α thermal diffusivity (cm2/s)
δ gas phase length scale (cm)
Subscripts
accel accelerated
b buoyant
o base size
r rod
tube tube
International Conference on Environmental Systems
2
I. Introduction
IFFUSION flames in stagnation flow have long been studied due to their ease of control, amenability to
diagnostic measurement and modeling, and reproducibility of results. Early work [1] on flammability limits has
demonstrated that a hemispherical stagnation flow geometry is a reliable method to obtain the flammability limits of
various fuels as a function of upward flowing oxidizer gas. Many heavier hydrocarbons were found to have similar
limiting oxygen concentrations (13%-14%) and flame temperatures (1450-1500°C). Spalding [2] used the spherical
stagnation geometry to help define his Transfer Number versus critical stretch rate U/2r for extinction. Tsuji and
coworkers utilized the 2D stagnation geometry for many years to quantify both diffusion flames and premixed flame
structure and extinction limits [3, 4].
Linan [5] utilized the stagnation geometry to develop his large activation energy asymptotic analysis for steady
flame structure and derivation of a critical Damkohler number for extinction. Sohrab et al. [6] expanded Linan’s
asymptotic work on extinction limits to include gas-phase radiant loss. Krishnamurthy [7] experimentally studied
pmma rod tip blowoff at various oxygen and pressure ambient atmospheres and applied the critical Damkohler number
for extinction [5].
T’ien and coworkers [8-9] have developed detailed numerical models of stagnation flames over solid surfaces,
including surface radiation, and subsequently gas phase radiation as well [10, 11]. The models were used to outline a
complete flammability boundary in terms of oxygen and forced stretch rate. Some experiments with pmma rods [12]
outlined a similar flammability boundary.
Recent testing completed on the International Space Station investigated the oxygen-flow flammability boundary
for three different cast PMMA rod sizes [13]. This paper describes normal gravity forced flow blowoff tests conducted
to complement these flight results.
II. Experiment Description
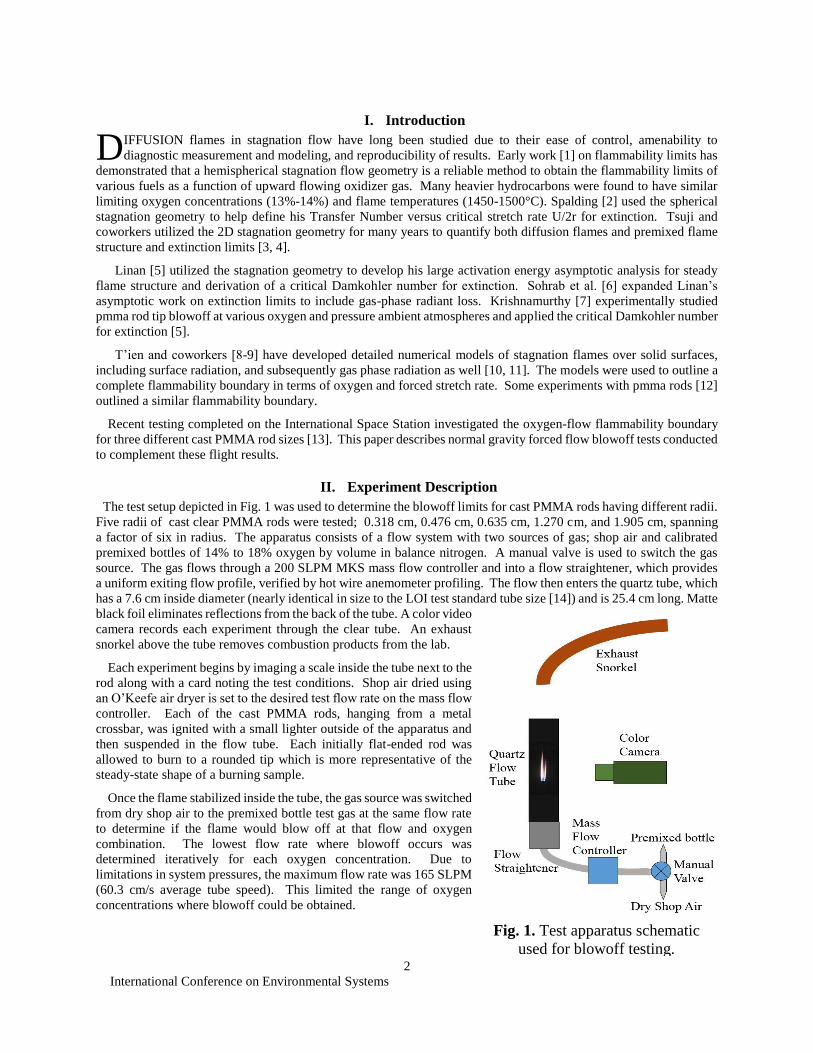
The test setup depicted in Fig. 1 was used to determine the blowoff limits for cast PMMA rods having different radii.
Five radii of cast clear PMMA rods were tested; 0.318 cm, 0.476 cm, 0.635 cm, 1.270 cm, and 1.905 cm, spanning
a factor of six in radius. The apparatus consists of a flow system with two sources of gas; shop air and calibrated
premixed bottles of 14% to 18% oxygen by volume in balance nitrogen. A manual valve is used to switch the gas
source. The gas flows through a 200 SLPM MKS mass flow controller and into a flow straightener, which provides
a uniform exiting flow profile, verified by hot wire anemometer profiling. The flow then enters the quartz tube, which
has a 7.6 cm inside diameter (nearly identical in size to the LOI test standard tube size [14]) and is 25.4 cm long. Matte
black foil eliminates reflections from the back of the tube. A color video
camera records each experiment through the clear tube. An exhaust
snorkel above the tube removes combustion products from the lab.
Each experiment begins by imaging a scale inside the tube next to the
rod along with a card noting the test conditions. Shop air dried using
an O’Keefe air dryer is set to the desired test flow rate on the mass flow
controller. Each of the cast PMMA rods, hanging from a metal
crossbar, was ignited with a small lighter outside of the apparatus and
then suspended in the flow tube. Each initially flat-ended rod was
allowed to burn to a rounded tip which is more representative of the
steady-state shape of a burning sample.
Once the flame stabilized inside the tube, the gas source was switched
from dry shop air to the premixed bottle test gas at the same flow rate
to determine if the flame would blow off at that flow and oxygen
combination. The lowest flow rate where blowoff occurs was
determined iteratively for each oxygen concentration. Due to
limitations in system pressures, the maximum flow rate was 165 SLPM
(60.3 cm/s average tube speed). This limited the range of oxygen
concentrations where blowoff could be obtained.
D
Fig. 1. Test apparatus schematic
used for blowoff testing.

International Conference on Environmental Systems
3
III. Results
Over 280 experiments were conducted to determine the blowoff limits for each oxygen concentration and rod
radius, and the bracketing flow conditions were repeated at least once. From the test images, some general trends
are noted. Flame blowoff always occurs at the stagnation region. The triggering event appears to be the
development of a flame hole [15] at the stagnation region of sufficient size to destabilize the flame base. Small
flame holes might disappear or be “healed,” but a subsequent larger hole can destabilize the flame and lead to
blowoff.
This is shown in Fig. 2. In the top sequence of images (at 120 f/s), a small hole forms at the stagnation region, and
moves up the side of the flame. The stagnation region heals, but the hole persists for a number of frames as it is
convected up the side of the flame. A sooty region forms around the hole. It may be that a vapor jet from a bubble
rupture from the surface is the triggering event. The vapor jet increases the local strain rate, causing local flame
extinction. The excess fuel from the jet exits the flame sheet and creates a locally fuel rich region outside the hole
which then reacts, causing the sooty region.
In the bottom sequence of images (at 80 f/s) from later in the same test and under the same test conditions, a small
hole again forms but quickly grows to the scale of
the 0.476 cm rod diameter. The stagnation region
destabilizes. Due to the destabilization, the flame
quickly blows downstream. The sequence ends as
the flame develops a bright blue flame base that
anchors briefly to the sides of the cylinder. The
downstream section of the flame becomes sooty,
which seems to correspond with the formation of the
anchor ring (flame base of the side-stabilized
flame). This ring is interpreted as the outer lip of
the triple flame at the flame leading edge.
The positions of the left and right sides of the
flame hole during the lower blowoff sequence are
tracked in Fig. 3 with time. The flame is initially
stabilized less than 1 mm below the rod. Once the
hole forms (set to be time zero), the flame quickly
moves downstream. The right side of the flame
anchors at -0.4 cm and the left side at -0.6 cm, and the anchor ring starts to move back upstream. The anchor ring
then settles at approximately -0.35 mm for over half a second. The anchor ring then begins to oscillate up and down
with increasing amplitude until the side-stabilized flame blows off completely. The side stabilized flame at oxygen
concentrations less than the downward Limiting Oxygen Index (LOI) is not expected to be stable.
Fig. 3. Flame hole edge positions during blowoff
Fig. 2. Sequence of 16% O2 by volume flame images showing top: a small stagnation hole that heals and
bottom: a hole that causes blowoff.

International Conference on Environmental Systems
4
O2 % by
vol.
0.318 0.476 0.635 1.270 1.905
Radius r, cm
Fig. 4. Flame images just before blowoff for each oxygen concentration
and rod radius.
18%
17%
16%
15%

International Conference on Environmental Systems
5
Figure 4 shows the flames just as blowoff begins at each limiting flow condition. Note that at 18% oxygen, blowoff
limits are found at only three radii due to flow rate limitations. Most of the flames at blowoff are primarily blue, but
more sooting is observed for the smallest rod radii and higher oxygen concentrations. The larger the radius, the larger
the flame hole needs to be to destabilize the flame, which is consistent with [15] for flame holes in the presence of a
heat sink.
Figure 5 presents the blowoff boundaries found for
each rod radius in terms of oxygen concentration versus
forced flow velocity. Each boundary is approximately
linear with flow, with the exception of the 14% oxygen
data, where all the data collapses at forced flow velocities
less than 5 cm/s. This result is anomalous and explained
as follows. At a sufficiently low forced flow rate,
entrainment of air into the quartz tube from the top might
be mixing with the supplied gas, increasing the ambient
oxygen concentration so that the rod remains flammable.
To investigate this behavior, tests were repeated in the
larger ZGRF wind tunnel rig [16] at the same normal
gravity conditions of 14% O2 and 2 cm/s flow. The wind
tunnel rig provides a 20 cm diameter flow system with
much less chance of entraining air from the top. Unlike
in the 1g setup in the lab, the rod blew off in repeated
tests at 14% oxygen in the larger wind tunnel as shown
in Fig. 6. A test was then repeated at 15% O2 in the
ZGRF wind tunnel to determine whether there was still
an entrainment effect in the quartz tube data at the higher
flow speeds. However, this flame did not blow off.
Given these results, the 14% O2 data are discarded from further
analysis.
Figure 7 plots the blowoff forced stretch rate as a function of rod
radius r for each oxygen concentration. The forced stretch rate is
defined as a=3/2 U/r, where U is the average flow speed entering the
tube and r is the rod radius. The data at each oxygen concentration
is fitted with a power law having a square root exponent, which is
attributed to the flame stretch at the flame standoff distance rather
than the rod surface. The flame standoff distance is estimated using
the gas phase thermal length scale, defined as
δ = (α/a)1/2 Eq.(1)
where α is the gas phase thermal diffusivity and a is the stretch rate
defined above. This length scale δ is thus proportional to r1/2 for a
given velocity U. In the inset, the coefficient C for each power law
fit is plotted versus oxygen, revealing that the forced stretch rate at
blowoff varies linearly with oxygen in addition to varying as the
square root of the rod radius. These relationships guided the
subsequent correlation of the data.
To collapse the data at different radii into a single blowoff
boundary, the flame curvature needs to be accounted for, so for a
given flow speed we introduce the normalized thermal length ratio
δ/δo = (r /ro)1/2 discussed above where ro is the smallest rod radius =
0.318 cm. In addition, the flow acceleration in the quartz tube due
to the presence of the rod becomes significant for the larger rod
sizes, as noted by [4]. To account for this flow acceleration, a
blockage factor was defined as B=Atube/(Atube-Ar) as follows:
Fig. 5. Blowoff boundaries for each rod radius as a
function of oxygen concentration and forced flow
velocity.
Fig.6 Non-symmetric flame in quartz
tube at 14% oxygen, left, does not
blowoff due to ambient flow
entrainment back into the tube. Flame
does blow off in larger wind tunnel,
right, at 14% oxygen and 2 cm/s forced
flow. Note: camera systems are not the
same, although images are
approximately to scale.

International Conference on Environmental Systems
6
𝑈𝑡𝑢𝑏𝑒 𝐴𝑡𝑢𝑏𝑒 = 𝑈𝑎𝑐𝑐𝑒𝑙 (𝐴𝑡𝑢𝑏𝑒 − 𝐴𝑟) Eq. (2)
𝑈𝑎𝑐𝑐𝑒𝑙 =𝑈𝑡𝑢𝑏𝑒 𝐴𝑡𝑢𝑏𝑒
(𝐴𝑡𝑢𝑏𝑒−𝐴𝑟)= 𝐵𝑈𝑡𝑢𝑏𝑒 Eq. (3)
Where Utube = U in the stretch rate definition, and
Atube and Ar are the cross-sectional areas of the
tube and rod, respectively. Table 1 shows the B
values for each r.
Using these corrections, an adjusted forced
stretch rate ao is defined as
𝑎𝑜 = [3
2
𝑈
𝑟] ∗ [
𝐴𝑡𝑢𝑏𝑒
(𝐴𝑡𝑢𝑏𝑒−𝐴𝑟)] ∗ [
𝑟
𝑟𝑜]
12⁄
(4)
The blowoff data from
Fig. 5 and Fig. 7 is replotted
using the adjusted forced
stretch rate as the x-axis in
Fig. 8. The data collapses
into a single blowoff
boundary for all the normal
gravity data. The BASS-II
flammability boundary [13]
is also plotted in Fig. 8.
There is a clear offset
between the normal gravity
data and the microgravity
data. An empirical linear
superposition of the
buoyant stretch rate of
ab=80 s-1 is used to align the
data with the BASS-II
boundary (atotal = ao + ab).
For the smallest rod size,
this is an effective forced
flow of 17 cm/s, in good
agreement with normal
gravity buoyant flow
velocities (~ 20 cm/s) [17].
The linear fit to the shifted
data is given by the blue-
shaded band. This blowoff region is inherently wide due to the stochastic nature [18] of the blowoff limit.
Fig. 7. Forced stretch rate at blowoff plotted against
rod radius at each oxygen concentration. The inset
shows the constant of each power law curve fit, which
varies linearly with oxygen.
r, cm Ar, cm2
Atube, cm2
B
0.318 0.318 45.604 1.007
0.476 0.712 45.604 1.016
0.635 1.267 45.604 1.029
1.270 5.067 45.604 1.125
1.905 11.401 45.604 1.333
Table 1: Blockage factor B for each rod radii
Fig. 8. Blowoff boundary correlation that accounts for the flow acceleration due
to rod blockage in the quartz tube, and normalizes all the radii to the smallest
radius ro using the gas phase length scale δ. To account for buoyant stretch, a
shift of 80 s-1 aligns the normal gravity data with BASS-II data [13]
International Conference on Environmental Systems
7
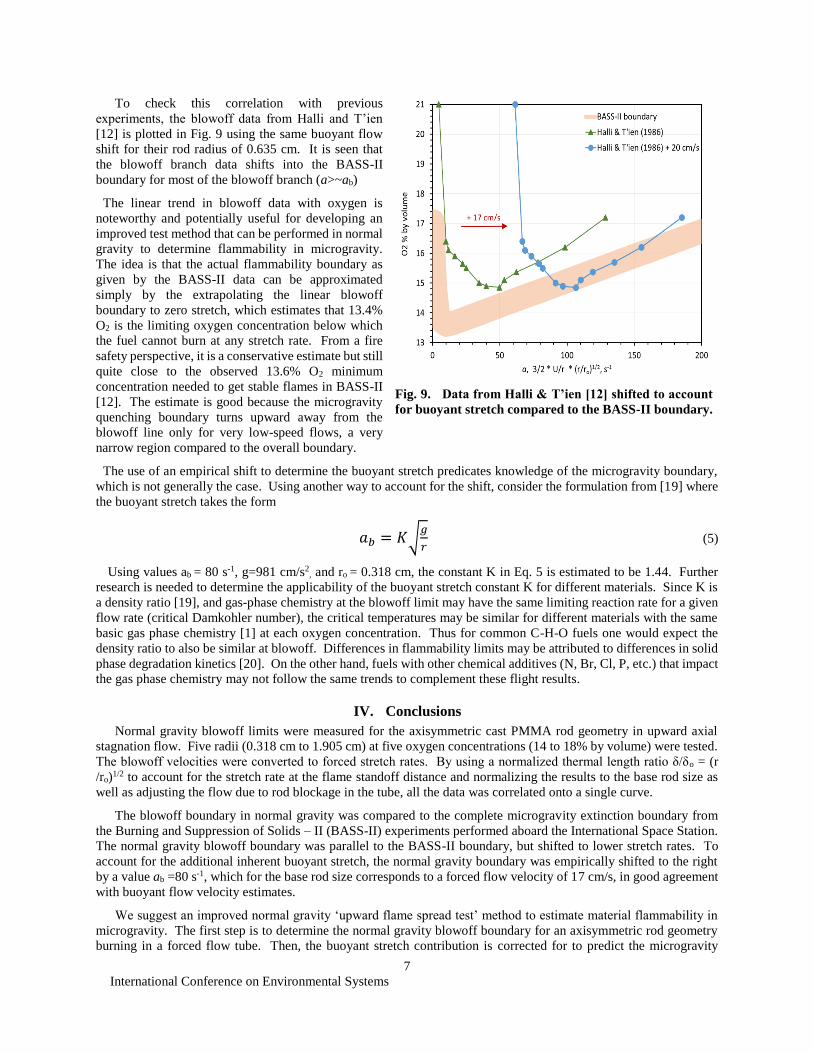
To check this correlation with previous
experiments, the blowoff data from Halli and T’ien
[12] is plotted in Fig. 9 using the same buoyant flow
shift for their rod radius of 0.635 cm. It is seen that
the blowoff branch data shifts into the BASS-II
boundary for most of the blowoff branch (a>~ab)
The linear trend in blowoff data with oxygen is
noteworthy and potentially useful for developing an
improved test method that can be performed in normal
gravity to determine flammability in microgravity.
The idea is that the actual flammability boundary as
given by the BASS-II data can be approximated
simply by the extrapolating the linear blowoff
boundary to zero stretch, which estimates that 13.4%
O2 is the limiting oxygen concentration below which
the fuel cannot burn at any stretch rate. From a fire
safety perspective, it is a conservative estimate but still
quite close to the observed 13.6% O2 minimum
concentration needed to get stable flames in BASS-II
[12]. The estimate is good because the microgravity
quenching boundary turns upward away from the
blowoff line only for very low-speed flows, a very
narrow region compared to the overall boundary.
The use of an empirical shift to determine the buoyant stretch predicates knowledge of the microgravity boundary,
which is not generally the case. Using another way to account for the shift, consider the formulation from [19] where
the buoyant stretch takes the form
𝑎𝑏 = 𝐾√𝑔
𝑟 (5)
Using values ab = 80 s-1, g=981 cm/s2, and ro = 0.318 cm, the constant K in Eq. 5 is estimated to be 1.44. Further
research is needed to determine the applicability of the buoyant stretch constant K for different materials. Since K is
a density ratio [19], and gas-phase chemistry at the blowoff limit may have the same limiting reaction rate for a given
flow rate (critical Damkohler number), the critical temperatures may be similar for different materials with the same
basic gas phase chemistry [1] at each oxygen concentration. Thus for common C-H-O fuels one would expect the
density ratio to also be similar at blowoff. Differences in flammability limits may be attributed to differences in solid
phase degradation kinetics [20]. On the other hand, fuels with other chemical additives (N, Br, Cl, P, etc.) that impact
the gas phase chemistry may not follow the same trends to complement these flight results.
IV. Conclusions
Normal gravity blowoff limits were measured for the axisymmetric cast PMMA rod geometry in upward axial
stagnation flow. Five radii (0.318 cm to 1.905 cm) at five oxygen concentrations (14 to 18% by volume) were tested.
The blowoff velocities were converted to forced stretch rates. By using a normalized thermal length ratio δ/δo = (r
/ro)1/2 to account for the stretch rate at the flame standoff distance and normalizing the results to the base rod size as
well as adjusting the flow due to rod blockage in the tube, all the data was correlated onto a single curve.
The blowoff boundary in normal gravity was compared to the complete microgravity extinction boundary from
the Burning and Suppression of Solids – II (BASS-II) experiments performed aboard the International Space Station.
The normal gravity blowoff boundary was parallel to the BASS-II boundary, but shifted to lower stretch rates. To
account for the additional inherent buoyant stretch, the normal gravity boundary was empirically shifted to the right
by a value ab =80 s-1, which for the base rod size corresponds to a forced flow velocity of 17 cm/s, in good agreement
with buoyant flow velocity estimates.
We suggest an improved normal gravity ‘upward flame spread test’ method to estimate material flammability in
microgravity. The first step is to determine the normal gravity blowoff boundary for an axisymmetric rod geometry
burning in a forced flow tube. Then, the buoyant stretch contribution is corrected for to predict the microgravity
Fig. 9. Data from Halli & T’ien [12] shifted to account
for buoyant stretch compared to the BASS-II boundary.
International Conference on Environmental Systems
8
blowoff boundary. Further research is needed to determine the applicability of the buoyant stretch constant K for
different materials. If proven for various C-H-O materials, this linear boundary, extrapolated to zero stretch, could
provide a conservative estimate of flammability limits in microgravity. The technique may work for a wide range of
materials as long as the gas-phase chemistry is similar. This test method may improve spacecraft fire safety for future
exploration missions.
Acknowledgments
The ISS Research Project Office funded this work. The authors want to acknowledge the personnel from the NASA
Glenn Zero Gravity Research Facility, led by Professional Engineer Eric Neumann, for their assistance in preparation
of the rod samples, design and fabrication of the flow straightener and flow system, and support of supplemental wind
tunnel normal gravity testing at 14% oxygen. The authors would also like to thank Jay Owens for his help in setting
up the camera control system for normal gravity testing.
References
[1] Simmons, R.F. and Wolfhard, H.G., 1957. Some limiting oxygen concentrations for diffusion flames in air diluted with
nitrogen. Combustion and Flame, 1(2), pp.155-161. http://dx.doi.org/10.1016/0010-2180(57)90042-1
[2] Spalding, D.B., 1953, December. The combustion of liquid fuels. In Symposium (international) on combustion (Vol. 4, No. 1,
pp. 847-864). Elsevier.
[3] Tsuji, H., 1982. Counterflow diffusion flames. Progress in energy and combustion science, 8(2), pp.93-119.
http://dx.doi.org/10.1016/0360-1285(82)90015-6
[4] Tsuji, H. and Yamaoka, I., 1967, December. The counterflow diffusion flame in the forward stagnation region of a porous
cylinder. In Symposium (International) on Combustion (Vol. 11, No. 1, pp. 979-984). Elsevier.
http://dx.doi.org/10.1016/s0082-0784(67)80224-8
[5] Linan, A., 1974. The asymptotic structure of counterflow diffusion flames for large activation energies. Acta Astronautica, 1(7-
8), pp.1007-1039. http://dx.doi.org/10.1016/0094-5765(74)90066-6
[6] Sohrab, S.H., Linan, A. and Williams, F.A., 1982. Asymptotic theory of diffusion-flame extinction with radiant loss from the
flame zone. Combustion Science and Technology, 27(3-4), pp.143-154. http://dx.doi.org/10.1080/00102208208946983
[7] Krishnamurthy, L., 1975. Diffusion-flame extinction in the stagnation-point boundary layer of PMMA in O2/N2 mixtures.
Combustion science and technology, 10(1-2), pp.21-25. http://dx.doi.org/10.1080/00102207508946654
[8] T’ien, J.S., 1986. Diffusion flame extinction at small stretch rates: the mechanism of radiative loss. Combustion and Flame,
65(1), pp.31-34. http://dx.doi.org/10.1016/0010-2180(86)90069-6
[9] T'ien, J.S. and Foutch, D.W., 1987. Extinction of a stagnation-point diffusion flame at reduced gravity. AIAA journal, 25(7),
pp.972-976.
[10] Rhatigan, J.L., Bedir, H. and James, S., 1998. Gas-phase radiative effects on the burning and extinction of a solid fuel.
Combustion and Flame, 112(1), pp.231-241. doi:10.1016/S0010-2180(97)81771-3
[11] T’ien, J.S., 2008. Some Partial Scaling Considerations in Microgravity Combustion Problems. Progress in Scale Modeling,
pp.281-292. http://dx.doi.org/10.1007/978-1-4020-8682-3
[12] Halli, Y., T’ien, J.S., NBS-GCR-86-507 (1986).
[13] Olson, S.L. and Ferkul, P.V., Microgravity Flammability Boundary for PMMA Rods In Axial Stagnation Flow: Results
of the ISS BASS-II Experiments, 9th U. S. National Combustion Meeting, The Combustion Institute, May 17-20, 2015,
Cincinnati, Ohio, submitted to Combustion and Flame.
[14] ASTM, D., 2010. 2863-10, Standard Test Method for Measuring the Minimum Oxygen Concentration to Support
Candlelike Combustion of Plastics (oxygen index). ASTM Int, West Conshohocken, PA.
[15] Nayagam, V., Balasubramaniam, R. and Ronney, P.D., 1999. Diffusion flame-holes. Combustion theory and modelling,
3(4), pp.727-742. http://dx.doi.org/10.1088/1364-7830/3/4/307
[16] Olson, S.L. and Miller, F.J., 2009. Experimental comparison of opposed and concurrent flame spread in a forced convective
microgravity environment. Proceedings of the Combustion Institute, 32(2), pp.2445-2452.
http://dx.doi.org/10.1016/j.proci.2008.05.081
[17] Hirano, T., Noreikis, S.E. and Waterman, T.E., 1974. Measured velocity and temperature profiles near flames spreading
over a thin combustible solid. Combustion and Flame, 23(1), pp.83-96. doi:10.1016/S0010-2180(74)80029-5
[18] T'ien, J.S., 1973. The Effects of Perturbations on the Flammability Limits. Combustion Science and Technology, 7(4),
pp.185-188. http://dx.doi.org/10.1080/00102207308952357
[19] Olson, S.L. and T’ien, J.S., 2000. Buoyant low-stretch diffusion flames beneath cylindrical PMMA samples. Combustion
and Flame, 121(3), pp.439-452. http://dx.doi.org/10.1016/S0010-2180(99)00161-3
[20] Walters, R.N. and Lyon, R.E., 2003. Molar group contributions to polymer flammability. Journal of Applied Polymer
Science, 87(3), pp.548-563. http://dx.doi.org/10.1002/app.11466