mixing-performance evaluation of a multiple dilution
TRANSCRIPT

Article
Mixing-Performance Evaluation of a Multiple Dilution Microfluidic Chip for a Human Serum Dilution Process Therdthai Thienthong1, Ekachai Juntasaro1,*, Witsaroot Sripumkhai2, Nongluck Houngkamhang3, Mayuree Chanasakulniyom4, Numfon Khemthongcharoen5, Pattaraluck Pattamang2, Nithi Atthi2, Chamras Promptmas5, Panapat Uawithya6, and Wutthinan Jeamsaksiri2
1 Mechanical Engineering Simulation and Design Group, The Sirindhorn International Thai-German Graduate School of Engineering (TGGS), King Mongkut’s University of Technology North Bangkok, Bangkok 10800, Thailand 2 Thai Microelectronics Center, National Electronics and Computer Technology Center, National Science and Technology Development Agency, Chachoengsao 24000, Thailand 3 College of Materials Innovation and Technology, King Mongkut’s Institute of Technology Ladkrabang, Bangkok 10520, Thailand 4 Department of Clinical Chemistry, Faculty of Medical Technology, Mahidol University, Nakhon Pathom 73170, Thailand 5 Department of Biomedical Engineering, Faculty of Engineering, Mahidol University, Nakhon Pathom 73170, Thailand 6 Department of Physiology, Faculty of Medicine, Siriraj Hospital, Mahidol University, Bangkok 10700, Thailand *E-mail: [email protected] (Corresponding author)
Abstract. This paper is aimed to propose a numerically designed multiple dilution microfluidic chip that can simultaneously deliver several serum dilutions in parallel. The passive mixing scheme is selected for dilution and achieved by the serpentine mixing channel in which Dean vortices are induced to increase the contact area and time for better diffusion. The mixing performance at the exit of this dilution chip is numerically evaluated using five commonly-used mixing indices with the goal that the homogeneity of the mixture over the exit cross-sectional area of the mixing channel must be greater than 93.319% to fulfill the six-sigma quality control. Keywords: Microfluidics, dilution, mixing flow, mixing index, human serum.
ENGINEERING JOURNAL Volume 25 Issue 9 Received 12 March 2021 Accepted 15 September 2021 Published 30 September 2021 Online at https://engj.org/ DOI:10.4186/ej.2021.25.9.67

DOI:10.4186/ej.2021.25.9.67
68 ENGINEERING JOURNAL Volume 25 Issue 9, ISSN 0125-8281 (https://engj.org/)
1. Introduction Human serum dilution is part of the medical
diagnostics. The human blood is composed of red blood cells, white blood cells, plasma, and platelets. The serum is the plasma without fibrinogen [1]. Both serum and plasma are the Newtonian fluids [2] which are generally soluble in water. The serum consists of proteins, electrolytes, antibodies, antigens, hormones, and exogenous substances where the albumin (also called the serum albumin) is the major protein. In a dilution process, the serum is usually diluted by the phosphate buffered saline (PBS) which is a water-based salt solution consisting of sodium chloride, phosphate buffer, and potassium chloride. The PBS buffer is commonly used to dilute biological substances because it is nontoxic and isotonic. In practice, the serum is diluted in a microwell plate (typically, the 96-well plate) at multiple concentrations. This conventional technique is time consuming and requires a skilled operator and a precise tool in order to obtain accurate dilution samples when the serum is diluted at very low volume concentration. These issues can be overcome by using a microfluidic chip to improve the accuracy of the volume concentration and also to reduce the processing time. Microfluidic devices increasingly play an important role in modern medical diagnostic testing processes. One of the key functions of the microfluidic chip is a mixing function [3] which is the process of mixing a fluid sample with a buffer in a micromixer. This process is also known as a dilution process. In general, microfluidic mixing schemes can be categorized into two types: active and passive. There were two classical reviews on micromixers reported in 2005 [4, 5]. Recent advances in micromixers were reviewed in 2015 for mixing enhancement methods [6] and in 2016 exclusively for passive micromixers [7]. The active mixing scheme is the process that has the external energy/force involved to promote mixing, for instance, acoustics [8, 9], electrokinetics [10, 11, 12, 13, 14, 15, 16], thermal actuator [17], and magnetohydrodynamics [18]. The passive mixing scheme employs the geometry-specific channel to induce the chaotic advection (due to the lack of turbulence at very low Reynolds number) [19] in order to increase the contact area and contact time between the fluids to enhance mixing. Various designs of geometry-specific channels for passive mixing were proposed: the intersecting channels [20, 21, 22, 23], the convergent-divergent channels [24, 25, 26], the 3D-structure channels [27, 28, 29, 30, 31], the channels with embedded barriers [32, 33, 34, 35, 36, 37, 38], the channels with staggered herringbone structures [39], the twisted channels [40], and the Tesla-structure channels [41, 42]. Depending on applications and operations, either active or passive mixing scheme can be applied to micromixers of microfluidic systems in order to obtain the homogeneous mixture. The passive mixing scheme is chosen in this work to make the microfluidic chip user-friendly without accessories. When the microfluidic chip is operated, a small amount of fluid is manipulated inside the system and the Reynolds number
( Re ) of the fluid flow in the microfluidic chip is very
small (in the present work, 30Re ). The Reynolds number is defined as the ratio of the inertial force to the viscous force. This ratio can be written as
h hVD VDInertial forceRe
Viscous force
= = = (1)
where is the density of fluid [kg/m3], V is the cross-
section-averaged flow velocity [m/s], hD is the hydraulic
diameter of the channel [m], µ is the dynamic viscosity of
fluid [Pa-s] and is the kinematic viscosity of fluid
( / = ) [m2/s]. At very low Reynolds number
(compared to 2300CRe = , a critical Reynolds number
that indicates an upper limit of the laminar flow regime), the flow behavior is dominated by the viscous force and hence the flow is highly ordered and smooth. Thus, the fluid flow in the microfluidic chip is entirely laminar or in other words the turbulent flow does not exist. This laminar flow regime results in the difficulty of mixing the fluid sample with the buffer in the microfluidic chip. The mixing performance of microfluidics depends on the diffusion between two fluids. In the published literature,
there were four mixing indices ( MI ) commonly used to
measure the mixing performance: 1MI [43, 44], 2MI [45,
44], 3MI [46, 47, 44], and 4MI [48]. 5MI is another
interesting mixing index that was also used [49], which was originally proposed as the area-weighted uniformity index [50]. These mixing indices are defined as follows:
1MI :
2
1
1
1( )
N
i
i
MIN
=
= = − (2)
1
N
i
i
N
==
(3)
where i is the local volume concentration at the thi cell,
is the averaged of volume concentration over the
cross-sectional area which is formulated as Eq. (3), and N is the number of cells over the same cross-sectional area.
The 1MI is also known as the standard deviation (σ) in
statistics. The 1MI reflects the level of mixing. When the
1MI is equal to zero, it means the completely mixed state.
However, when the 1MI is higher than zero, it is at the
not-well-mixed state. This 1MI cannot be compared with
other mixing indices because this mixing index does not range from 0 to 1.

DOI:10.4186/ej.2021.25.9.67
ENGINEERING JOURNAL Volume 25 Issue 9, ISSN 0125-8281 (https://engj.org/) 69
2MI :
2
1
2
1( )
1 1
N
i
iNMI
=
−
= − = −
(4)
This 2MI is the absolute mixing index which is
dimensionless and ranges from 0 (unmixed) to 1 (completely mixed).
3MI :
2
1
3
0 2
0,
1
1( )
1 11
( )
N
i
i
N
i
i
NMI
N
=
=
−
= − = −
−
(5)
where 0 is the standard deviation at the unmixed state
and 0,i is the local volume concentration at the thi cell
at the unmixed state. This 3MI can be called the relative
standard deviation between completely mixed and unmixed states which is scaled from 0 (unmixed) to 1 (completely mixed).
4MI :
14
00, 0,
1
1 1
N
i i
i
N
i i
i
AdA
MIdA A
=
=
− −= − = −
− −
∣ ∣∣ ∣
∣ ∣ ∣ ∣
(6)
where iA is the cross-sectional area of the thi cell and
0,iA is the cross-sectional area of the thi cell at the
unmixed state. This 4MI is scaled from 0 (unmixed) to 1
(completely mixed).
5MI :
15
1
1
2
N
i a i
i
N
a i
i
A
MI
A
=
=
−
= −
∣ ∣
∣ ∣
(7)
where a is the area-weighted average of volume
concentration at the cross-sectional area which is defined as
1
1
N
i i
ia N
i
i
A
A
=
=
=
(8)
This 5MI is also known as the area-weighted
uniformity index [50] which has the same scaling range as
2MI , 3MI and 4MI (0:unmixed to 1:completely mixed).
As far as the literature survey and review is concerned with
the best knowledge of the authors, 5MI has never been
used in the evaluation of mixing performance of micromixers. Therefore, this paper is aimed to propose
5MI as a proper mixing index to evaluate the mixing
performance of micromixers. The mixing index indicates how well the mixture is
homogeneous. Since there are five different definitions being used to define the mixing index, the multiple dilution microfluidic chip designed in this work will be
numerically tested against these four mixing indices ( 2MI ,
3MI , 4MI and 5MI ) in order to evaluate its mixing
performance at the exit of the chip. The challenge of designing the passive micromixer is to find an effective mechanism to increase the contact area and contact time between the fluids in the microchannel. In passive micromixers, the fluid transport can be achieved by two mechanisms: (1) the advective mechanism where the bulk movement of two fluid streams is driven by the externally applied force such as pressure-driven flow, and (2) the diffusive mechanism which is driven by entropy [51] so that the fluid molecules move randomly with this mechanism. Diffusion is considered as the statistical mechanism due to the fact that molecules move from a region of higher concentration to a region of lower concentration stochastically. From the literature survey, it is found that there are two different approaches to study the diffusion: (i) mixing of the same fluid with different concentrations and (ii) mixing of the different fluids with different viscosities, densities and concentrations. For the first approach, many researchers studied mixing of the same fluid with different concentrations in the straight microchannel, for example, for numerical and experimental study [52] and for analytical study [53]. Basically, the diffusion mechanism was investigated by mixing two fluid streams of different concentrations in the mixing channel. However, both fluid streams had the same density and viscosity because the same base fluid was employed, except that one fluid stream contained a very small amount of an extra chemical whereas the other fluid stream contained either no extra chemical or a different extra chemical in order to make their solution concentrations different. For the second approach, very few researchers investigated the diffusion phenomena between two different fluids with different viscosities, densities and concentrations, for instance, to quantitatively estimate an inter-diffusion coefficient [54] and to numerically study the mixing performance of micromixers [55]. In the current research work, the study will focus on two different fluids (serum and buffer) with different viscosities, densities and concentrations.
To enhance the contact area and contact time between the fluids for better diffusion, the curved channel can be used to induce a pair of counter-rotating secondary flows

DOI:10.4186/ej.2021.25.9.67
70 ENGINEERING JOURNAL Volume 25 Issue 9, ISSN 0125-8281 (https://engj.org/)
which are known as the Dean vortices. This can help improve the diffusive mixing [56]. The Dean vortices are generated by the centripetal force at the bend. The rates of heat and mass transfer are increased when the Dean vortices are encountered. In Fig. 1, the Dean vortices appear in the curved channel. The first mathematical study of the Dean vortices was presented by W. R. Dean in 1927 and 1928 [57, 58, 59]. Dean also proposed the dimensionless number to indicate the intensity and shape of the Dean vortices. This number is known as Dean
Number ( Dn ) which can be defined as
/
ReDn
R a= (9)
where R is the mean radius of curvature [m] and a is the
width of the curved channel [m], which is illustrated in Fig. 1. Bara and co-workers conducted the experiment to visualize the Dean vortices in the curved square channel [60, 61]. They also measured the axial velocity profile in the curved square channel by using Laser Doppler Velocimetry (LDV). One pair, or even two pairs, of two counter-rotating vortices were revealed as shown in Fig. 2. In 2013, Norouzi and Biglari presented the analytical solution of the incompressible flow in the curved channel with the rectangular cross section [62]. This analytical solution can mathematically describe the Dean vortices. Recently, the Dean vortices were used to mix the serum with the buffer in the multiple dilution microfluidic chip [49].
In order to maintain the generation of the Dean
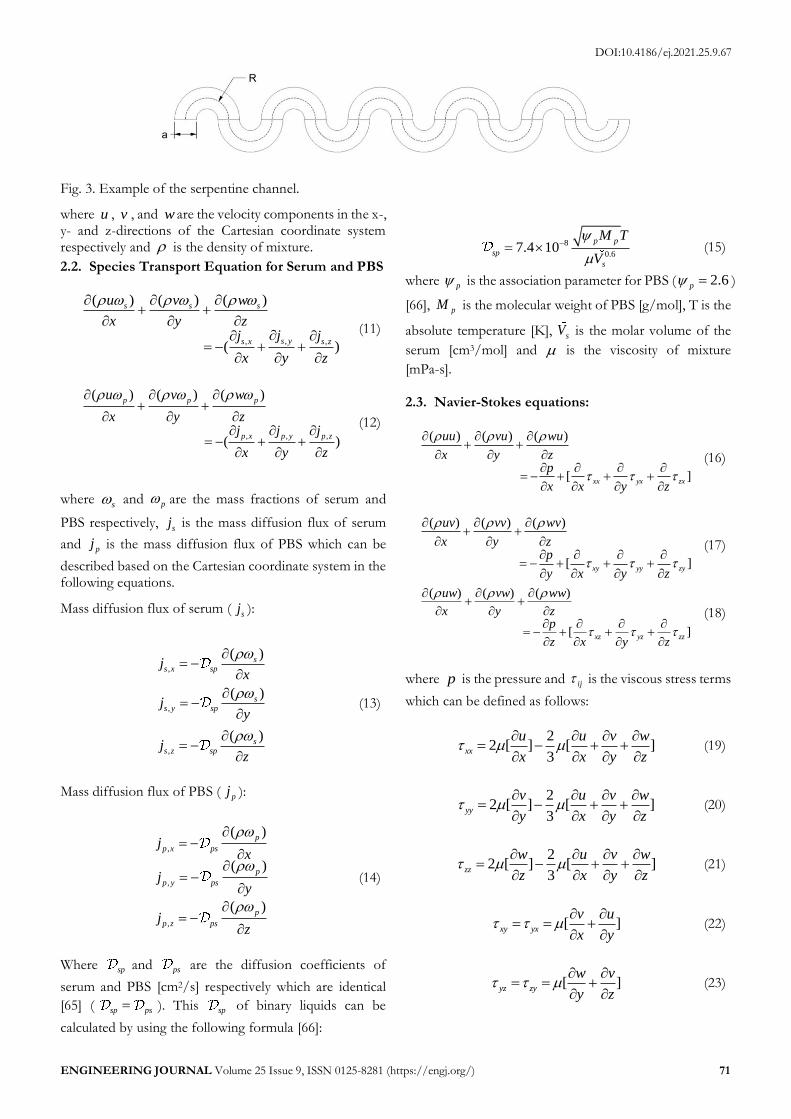
vortices, the curved length of the flow passage must be continuous. There are many types of curved channels such as spiral and serpentine channels. In this paper, the serpentine channel will be considered. The serpentine curve is a series of semi-circles made alternating. An example of the serpentine channel with 10 semi-circles is shown in Fig. 3. The advantages of the serpentine channel are that the Dean number is constant and its layout can be designed to be compact in terms of the area-effective concern which is suitable for micro-scale devices. Its design is aimed to simultaneously deliver multiple serum dilutions in parallel from 1:2 to 1:32 which are the volume
concentration ratios of the serum to the PBS buffer. The CFD simulation will be used here as a measuring tool to numerically quantify the mixing indices of four different
definitions ( 2MI - 4MI ) in order to verify the mixing
performance at the exit of the current design of the multiple dilution microfluidic chip where the homogeneity of the mixture between the serum and the PBS buffer must not be less than 93.319% (Sigma Level 3) across the cross section at the channel exit, according to the six sigma quality control [63, 64].
2. Governing Equations
In this paper, the process of mixing the serum with
the PBS buffer produces a binary liquid mixture which can be considered as the multi-component fluid flow. In order to simulate and study this fluid flow, three governing equations are required: continuity, species transport and Navier-Stokes equations. The governing equations are simplified based on the following assumptions: (1) serum, PBS and mixture are the Newtonian fluids, (2) the fluid flow is steady, incompressible and laminar, (3) there is no chemical reaction between serum and PBS, (4) the diffusivity between serum and PBS is identical due to the binary mixture process [65]. Thus, three governing equations can be written as follows: 2.1. Continuity Equation
( ) ( ) ( )
0u v w
x y z
+ + =
(10)
Fig. 1. Dean vortices in a curved channel.
Fig. 2. Flow visualization (left) and numerical streamlines (right) of Dean vortices over a curved channel cross-section where the outer wall is on the right-hand side (referred to Bara, 1992 [61]).
DOI:10.4186/ej.2021.25.9.67
ENGINEERING JOURNAL Volume 25 Issue 9, ISSN 0125-8281 (https://engj.org/) 71
where u , v , and w are the velocity components in the x-, y- and z-directions of the Cartesian coordinate system respectively and is the density of mixture.
2.2. Species Transport Equation for Serum and PBS
,, ,
( ) ( ) ( )
( )
s s s
s ys x s z
u v w
x y zjj j
x y z
+ +
= − + +
(11)
, , ,
( ) ( ) ( )
( )
p p p
p x p y p z
u v w
x y zj j j
x y z
+ +
= − + +
(12)
where s and p are the mass fractions of serum and
PBS respectively, sj is the mass diffusion flux of serum
and pj is the mass diffusion flux of PBS which can be
described based on the Cartesian coordinate system in the following equations.
Mass diffusion flux of serum (sj ):
,
,
,
( )
( )
( )
ss x sp
ss y sp
ss z sp
jx
jy
jz
= −
= −
= −
(13)
Mass diffusion flux of PBS ( pj ):
,
,
,
( )
( )
( )
p
p x ps
p
p y ps
p
p z ps
jx
jy
jz
= −
= −
= −
(14)
Where sp and ps are the diffusion coefficients of
serum and PBS [cm2/s] respectively which are identical
[65] ( sp ps= ). This sp of binary liquids can be
calculated by using the following formula [66]:
8
0.67.4 10
p p
sp
s
M T
V
−= (15)
where p is the association parameter for PBS ( 2.6p = )
[66], pM is the molecular weight of PBS [g/mol], T is the
absolute temperature [K], sV is the molar volume of the
serum [cm3/mol] and is the viscosity of mixture
[mPa-s].
2.3. Navier-Stokes equations:
( ) ( ) ( )
[ ]xx yx zx
uu vu wu
x y zp
x x y z
+ +
= − + + +
(16)
( ) ( ) ( )
[ ]xy yy zy
uv vv wv
x y zp
y x y z
+ +
= − + + +
(17)
( ) ( ) ( )
[ ]xz yz zz
uw vw ww
x y zp
z x y z
+ +
= − + + +
(18)
where p is the pressure and ij is the viscous stress terms
which can be defined as follows:
2
2 [ ] [ ]3
xx
u u v w
x x y z
= − + +
(19)
2
2 [ ] [ ]3
yy
v u v w
y x y z
= − + +
(20)
2
2 [ ] [ ]3
zz
w u v w
z x y z
= − + +
(21)
[ ]xy yx
v u
x y
= = +
(22)
[ ]yz zy
w v
y z
= = +
(23)
Fig. 3. Example of the serpentine channel.

DOI:10.4186/ej.2021.25.9.67
72 ENGINEERING JOURNAL Volume 25 Issue 9, ISSN 0125-8281 (https://engj.org/)
[ ]zx xz
u w
z x
= = +
(24)
2.4. Density and Viscosity of Mixture
In addition to the governing equations, the total mass
of the binary liquid mixture is equal to unity ( 1s p + = ).
Based on the binary liquid mixture, the density and viscosity can be calculated by using the following equations [50]: Density of the binary liquid mixture ( ):
1 s p
ps s p p s
s p
= =+
+
(25)
where s and p are the densities of serum and PBS
respectively. Viscosity of the binary liquid mixture ( ):
s s p p = + (26)
where s and p are the viscosities of serum and PBS
respectively.
3. Simulation Setup and Validation The finite-volume-based simulation of the flow and
mixing behavior in the dilution microfluidic chip has been performed by using the commercial CFD software called ANSYS FLUENT 18.2 [50]. In this work, the validation of the simulation setup is also conducted. The first validation case is a single fluid flow in the square-cross-section straight duct and the second validation case is a single fluid flow in the square-cross-section curved duct. Geometry and dimension, mesh information, numerical methods, schemes and algorithms, convergence criteria, mechanical properties of the working fluid, Reynolds number, Dean number and flow conditions will be given in this section. 3.1. Square-cross-section Straight Duct
To begin with, the first case is to simulate the single
fluid flow in the square-cross-section straight duct with one inlet and one outlet. The duct has the width and height of 100 [µm] and the duct length is 1000 [µm] long. The mesh-independent solution is the main purpose of this case study. In this case, the structured meshes of 8×8, 16×16, 32×32 and 64×64 elements are generated along the width and height of the duct. The meshes have the aspect ratio of 1, the skewness of 0 and the orthogonal quality of 1, which are in principle perfect. This mesh setup results in the total number of elements for each case: 8×8 (5,120 elements), 16×16 (40,960 elements), 32×32
(327,680 elements) and 64×64 (2,625,536 elements). The SIMPLEC (Semi-Implicit Method for Pressure Linked Equations-Consistent) algorithm is used for pressure-velocity coupling scheme. The spatial discretizations of gradient, pressure and momentum are least squares cell based, second order and second order upwind, respectively. All four mesh cases are simulated until residuals are lower than 1.0e-12 and level off. The mechanical properties of water as a working fluid are 1000 [kg/m3] for the density and 0.001 [Pas] for the dynamic viscosity. The typical volume flow rate of microfluidics is used, i.e. Q = 1 [µL/min] corresponding to Reynolds
number ( Re ) of 0.16667. This can be converted to the
constant mass flow rate of 16.667e9 [kg/s] for the inlet boundary condition. The outlet is set as the constant pressure boundary condition at 0 [Pa]. Then, the computed axial velocity profiles across the vertical symmetry plane at the outlet are compared with the exact solution [67] as shown in Fig. 4. The root-mean-square error in percentage of the axial velocity of each case is also calculated: 8×8 (6.14%), 16×16 (1.73%) 32×32 (0.46%) and 64×64 (0.15%). It can be concluded that the 32×32 and 64×64 mesh configurations with the current numerical methods, schemes and algorithms can provide the results in excellent agreement with the exact solution with the difference lower than 0.5%.
3.2. Square-cross-section Curved Duct
The single fluid flow in the square-cross-section curved duct with one inlet and one outlet is used as the second validation case. This second case is selected to validate the simulation setup in order to capture the effect of Dean vortices on the fluid flow behavior. The flow domain geometry of the simulation is created following Bara’s study [60, 61], as shown in Fig. 5. The 1000-mm entrance straight duct is attached to the inlet of the curved duct whose square cross section is 12.7mm wide and high
with a 270◦ axial arc length. The mean radius ( R ) of the curved duct is equal to 191.77 [mm] which is calculated
from the curvature ratio (cR ) of 15.1 ( cR R a= ) defined
in Eq. (9)). The same flow condition as Bara’s study [60,
61] is defined by using Dn equal to 125 (corresponding
Fig. 4. Axial velocity profiles across the vertical symmetry plane of the duct outlet.

DOI:10.4186/ej.2021.25.9.67
ENGINEERING JOURNAL Volume 25 Issue 9, ISSN 0125-8281 (https://engj.org/) 73
to Re = 485.734). The structured meshes of 16×16, 32×32 and 64×64 elements are generated along the width and height of the duct cross section, which result in the averaged aspect ratio of 1, the averaged skewness of 0 and the averaged orthogonal quality of 1. The number of elements per case is 614400, 4716544, 36765696 elements, respectively. The numerical methods, schemes and algorithms, as well as the working fluid mechanical properties, are the same as those used in the first validation case. The constant mass flow rate of 0.006148361 [kg/s] is applied at the inlet which is calculated from the duct
width of 12.7-mm, cR of 15.1 and Dn of 125. The outlet
is set as the constant pressure boundary condition at 0 [Pa]. The solutions of three meshes are converged with the residuals lower than 1.0e-10. The computed axial velocity profiles across the width and height of the curved duct at θ = 220° are compared with the experimental results [60, 61] and also the analytical solution [62], as shown in Fig. 6. The 32×32 and 64×64 mesh configurations provide almost the same results. It is again found that the simulation results are in good agreement with the experimental data and the analytical solution. 3.3. Dilution Microfluidic Chip
In order to increase the diffusion area between serum
and PBS, the dilution chip has been designed to have three inlets with one outlet. The serpentine geometry is selected to design the mixing channel of the dilution chip. There are two major parameters to create a serpentine curved channel: the width a of the rectangular cross-section and
the mean radius R , as shown in Fig. 3. The serpentine
mixing channel is designed based on the curvature ratio
(cR ) equal to 1 in order to gain the curve continuation and
compactness with an optimized Dean number. The serpentine mixing channel of this study is an alternating connected semicircle curved channel with many folds. This results in the dilution chip with the 70-mm width and 25-mm height as shown in Fig. 7. The delivery channel inlets are indicated as Inlet 1: PBS, Inlet 2: serum and Inlet 3: PBS. The serum is fed into the middle delivery channel inlet while the PBS buffer is fed into the left and right side delivery channel inlets in order to maximize the contact
area between serum and PBS for better diffusion. The intersection angle between the PBS inlet (1) and the serum inlet (2) is 45 degrees and so is the intersection angle between the PBS inlet (3) and the serum inlet (2).
Fig. 6. Axial velocity profiles (a) along the width and (b) along the height of the curved duct at θ = 220°.
Fig. 5. Curved duct geometry.

DOI:10.4186/ej.2021.25.9.67
74 ENGINEERING JOURNAL Volume 25 Issue 9, ISSN 0125-8281 (https://engj.org/)
3.3.1. Geometry and dimension
With the limitations of casting Silicon-master fabrication, all channels on the same chip essentially have the same depth of 40 µm. The three inlets of each channel have the same square cross-section width of 40 µm. The lengths of serum and PBS inlets are determined by using
(having) the same pressure drop ( p [Pa]) which is
formulated as follows [67]:
3
5 51,3,5,...
112
192 tanh( / 2 )1
i
Lp Q
ba a i b a
b i
=
= −
(27)
where µ is the dynamic viscosity of fluid [Pa-s], Q is the volume flow rate [m3/s], L is the length of the channel [m],
a is the width of the rectangular channel cross-section [m]
and b is the height of the rectangular channel cross
section [m]. When the rectangular cross-section of the channel is the same, the ratio of the pressure drop of PBS to serum inlets can be calculated by using the following equation:
p p p p
s s s s
p Q L
p Q L
=
(28)
where pp and sp are the pressure drop over PBS and
serum inlets, µs and µp are the viscosities of serum and
PBS, sQ and pQ are the volume flow rates of serum and
PBS, and sL and pL are the lengths of serum and PBS
inlets. When the pressure drops are the same, i.e.
/ 1p sp p = , this yields
p ps
p s s
QL
L Q
= (29)
The lengths of all delivery channel inlets are calculated
based on Eq. (29) which are summarized in Table 1. The different lengths of all delivery channel inlets are obviously shown in Fig. 8. The lengths of serum and PBS inlets are determined by using the same pressure drop in order to ensure that the mass flow rates of both serum and PBS can be delivered to the inlet of the serpentine mixing channel according to the designed amount, and hence the volume concentration ratios needed. The cross-section of
the serpentine mixing channel is 120 µm wide with cR
equal to 1 and its length is 40084 µm.
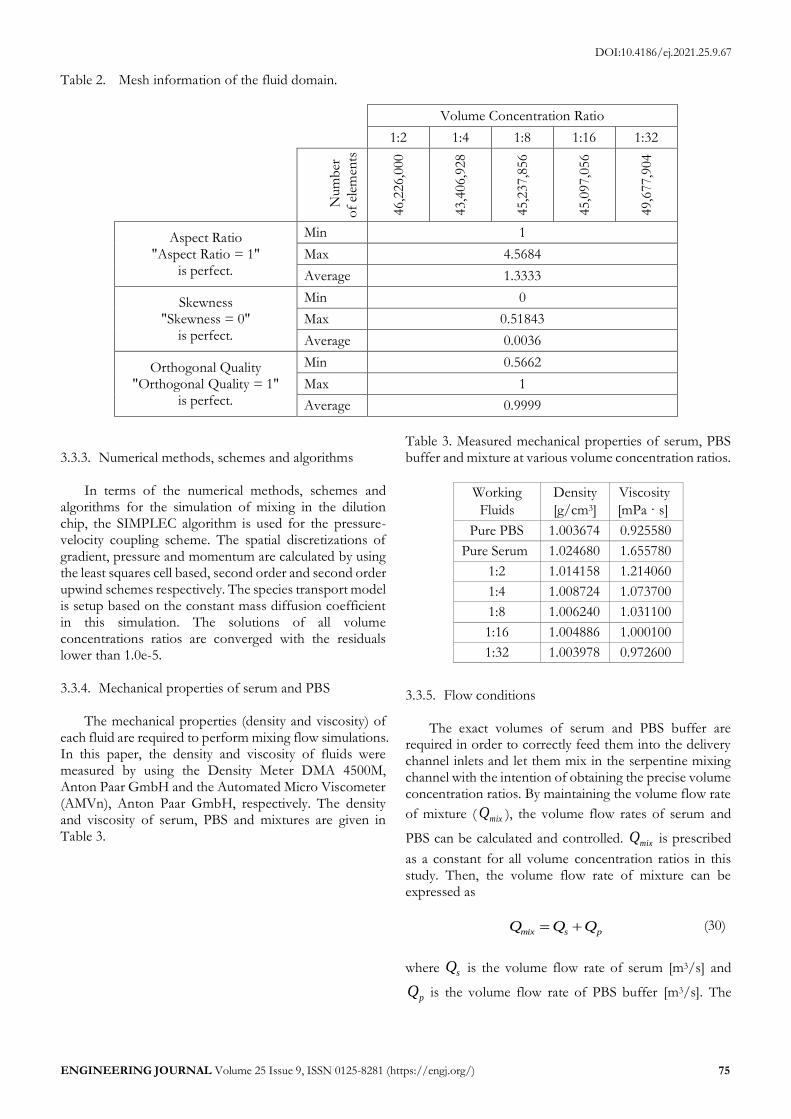
3.3.2. Mesh information
Simulations of the three-dimensional dilution
channels are set up in ANSYS FLUENT release 18.2 for solving the steady laminar incompressible flow of Newtonian fluids. The fluid domains of all volume concentration ratios with three inlets and one outlet are shown in Fig. 8. Since the fluid domain in symmetrical with respect to the symmetry plane which is located in between two counter-rotating vortices, referred to Fig. 1, only the upper part of the fluid domain is considered for simulation. The fluid domain is meshed with hexahedral and prism elements by using the sweep mesh method in ANSYS meshing tool. There are typically 16 elements along the depth of the channel and 32 elements along the width of each inlet. The number of elements is maintained consistently which results in having 96 elements along the width of the serpentine mixing channel throughout downstream to the outlet. Overall, the mesh quality can be considered as a good mesh as shown in Table 2 because it is the structured mesh, except at the connecting zone between the inlets and the serpentine mixing channel where there are some unstructured mesh patterns.
Fig. 7. Layout of 5 individual dilution channels on a chip: (a) chip drawing and (b) chip prototype.
Fig. 8. Fluid domain of volume concentration ratios: (a) 1:2, (b) 1:4, (c) 1:8, (d) 1:16 and (e) 1:32.
Table 1. Lengths of five individual delivery channel inlets on a chip.
Volume
Concentration
Ratio
PBS
[µm]
Serum
[µm]
1:2 8000 2235
1:4 4000 3353
1:8 4000 7825
1:16 2500 10481
1:32 2500 21661
DOI:10.4186/ej.2021.25.9.67
ENGINEERING JOURNAL Volume 25 Issue 9, ISSN 0125-8281 (https://engj.org/) 75
3.3.3. Numerical methods, schemes and algorithms
In terms of the numerical methods, schemes and
algorithms for the simulation of mixing in the dilution chip, the SIMPLEC algorithm is used for the pressure-velocity coupling scheme. The spatial discretizations of gradient, pressure and momentum are calculated by using the least squares cell based, second order and second order upwind schemes respectively. The species transport model is setup based on the constant mass diffusion coefficient in this simulation. The solutions of all volume concentrations ratios are converged with the residuals lower than 1.0e-5.
3.3.4. Mechanical properties of serum and PBS
The mechanical properties (density and viscosity) of
each fluid are required to perform mixing flow simulations. In this paper, the density and viscosity of fluids were measured by using the Density Meter DMA 4500M, Anton Paar GmbH and the Automated Micro Viscometer (AMVn), Anton Paar GmbH, respectively. The density and viscosity of serum, PBS and mixtures are given in Table 3.
3.3.5. Flow conditions
The exact volumes of serum and PBS buffer are
required in order to correctly feed them into the delivery channel inlets and let them mix in the serpentine mixing channel with the intention of obtaining the precise volume concentration ratios. By maintaining the volume flow rate
of mixture ( mixQ ), the volume flow rates of serum and
PBS can be calculated and controlled. mixQ is prescribed
as a constant for all volume concentration ratios in this study. Then, the volume flow rate of mixture can be expressed as
mix s pQ Q Q= + (30)
where sQ is the volume flow rate of serum [m3/s] and
pQ is the volume flow rate of PBS buffer [m3/s]. The
Table 3. Measured mechanical properties of serum, PBS buffer and mixture at various volume concentration ratios.
Working
Fluids
Density
[g/cm3]
Viscosity
[mPa · s]
Pure PBS 1.003674 0.925580
Pure Serum 1.024680 1.655780
1:2 1.014158 1.214060
1:4 1.008724 1.073700
1:8 1.006240 1.031100
1:16 1.004886 1.000100
1:32 1.003978 0.972600
Table 2. Mesh information of the fluid domain.
Volume Concentration Ratio
1:2 1:4 1:8 1:16 1:32
Num
ber
of
elem
ents
46,2
26,0
00
43,4
06,9
28
45,2
37,8
56
45,0
97,0
56
49,6
77,9
04
Aspect Ratio "Aspect Ratio = 1"
is perfect.
Min 1
Max 4.5684
Average 1.3333
Skewness "Skewness = 0"
is perfect.
Min 0
Max 0.51843
Average 0.0036
Orthogonal Quality "Orthogonal Quality = 1"
is perfect.
Min 0.5662
Max 1
Average 0.9999
DOI:10.4186/ej.2021.25.9.67
76 ENGINEERING JOURNAL Volume 25 Issue 9, ISSN 0125-8281 (https://engj.org/)
relation between the volume concentration of serum ( s )
and that of PBS buffer (p ) is given as
1s p + = (31)
Then, multiplying Eq. (31) by mixQ gives
s mix p mix mixQ Q Q + = (32)
Matching Eq. (32) with Eq. (30) yields
s s mix
p p mix
Q Q
Q Q
=
= (33)
For example, given s = 1/32 and the constant mixQ =
128 [µL/min]. Hence, sQ = (1/32) × 128 = 4 [µL/min]
and pQ = (31/32) × 128 = 124 [µL/min]. In this study,
the serum and PBS volume flow rates of various volume concentration ratios are calculated based on Eq. (33) as summarized in Table 4. The Reynolds numbers of pure serum and pure PBS (inlets) are calculated using the measured data from Table 3 based on Eq. (1). The Reynolds numbers of the mixtures (outlets) are also calculated based on the measured data of serum and PBS in Table 3 by using the following formulation:
1
2
s s p p
mix
mix
Re ReRe
+= (34)
where Res, Rep and Remix are the Reynolds numbers of pure serum, pure PBS and mixture, µmix is the dynamic viscosity of the mixture. Additionally, all volume concentration ratios are designed at the same mixture volume flow rate of 128 [µL/min]. Therefore, the constant mass flow rates at three inlets and the constant pressure at outlet (Pressure = 0 [Pa]) are specified as the boundary conditions. The diffusion coefficients are independently obtained for each volume concentration ratio based on Eq. (15) as shown in Table 4. These diffusion coefficients remain constant along the flow path. In this study, the
association parameter for PBS ( p ) is specified as 2.6 [66],
the molecular weight of PBS ( pM ) is 411.029 [g/mol]
obtained from the National Center for Biotechnology Information [68]. According to the temperature of the testing and measuring conditions, T is equal to298.15[K].
The molar volume of the serum sV is equal to 64836.827
[cm3/mol] which is calculated from the molecular weight
of serum (sM = 66437 [g/mol], referred to the molecular
weight of the majority protein in the serum [69]) divided by its density (as shown in Table 3). The viscosities of
mixtures (mix ) are shown in Table 3. The simulation
results of this dilution microfluidic chip at five volume concentration ratios will be validated against the
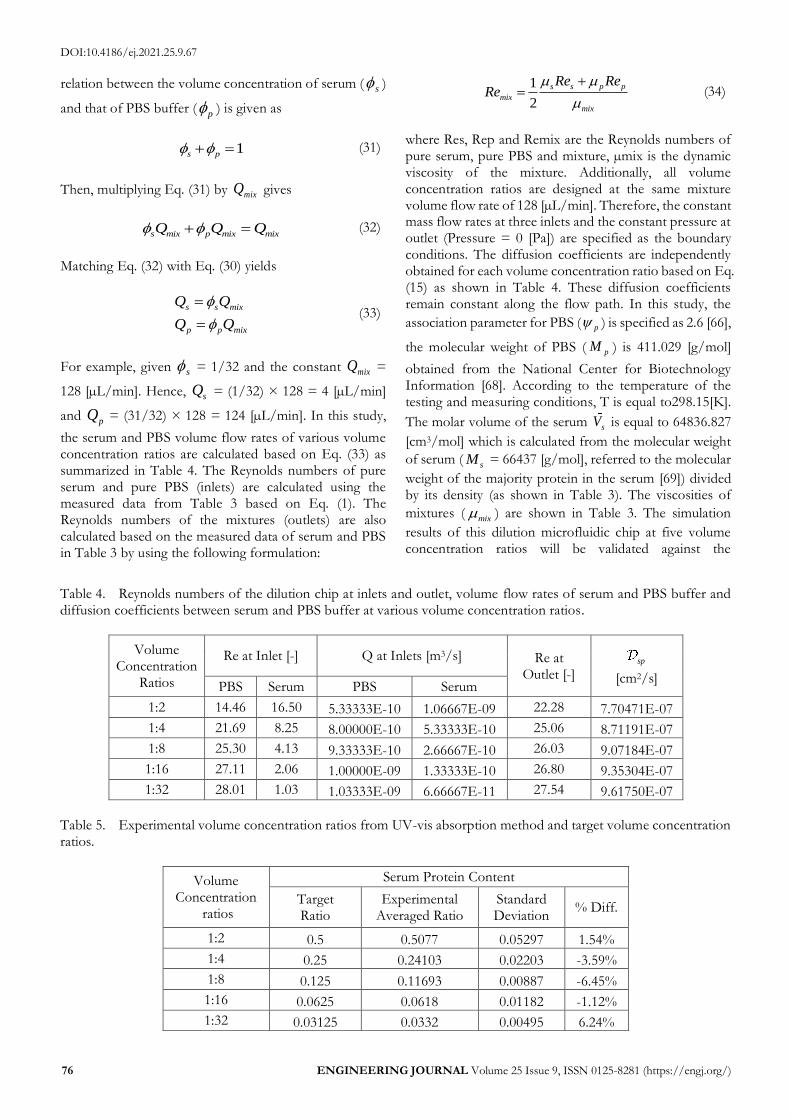
Table 4. Reynolds numbers of the dilution chip at inlets and outlet, volume flow rates of serum and PBS buffer and diffusion coefficients between serum and PBS buffer at various volume concentration ratios.
Volume Concentration
Ratios
Re at Inlet [-] Q at Inlets [m3/s] Re at Outlet [-]
sp
[cm2/s] PBS Serum PBS Serum
1:2 14.46 16.50 5.33333E-10 1.06667E-09 22.28 7.70471E-07
1:4 21.69 8.25 8.00000E-10 5.33333E-10 25.06 8.71191E-07
1:8 25.30 4.13 9.33333E-10 2.66667E-10 26.03 9.07184E-07
1:16 27.11 2.06 1.00000E-09 1.33333E-10 26.80 9.35304E-07
1:32 28.01 1.03 1.03333E-09 6.66667E-11 27.54 9.61750E-07
Table 5. Experimental volume concentration ratios from UV-vis absorption method and target volume concentration ratios.
Volume Concentration
ratios
Serum Protein Content
Target Ratio
Experimental Averaged Ratio
Standard Deviation
% Diff.
1:2 0.5 0.5077 0.05297 1.54%
1:4 0.25 0.24103 0.02203 -3.59%
1:8 0.125 0.11693 0.00887 -6.45%
1:16 0.0625 0.0618 0.01182 -1.12%
1:32 0.03125 0.0332 0.00495 6.24%
DOI:10.4186/ej.2021.25.9.67
ENGINEERING JOURNAL Volume 25 Issue 9, ISSN 0125-8281 (https://engj.org/) 77
experimental data and flow visualization in the next section.
4. Experimental Setup and Validation
The experiment is conducted to validate the microfluidic chip design and the operating conditions. The PDMS microfluidic chip is manufactured by casting process. For validation, the first method is the UV-vis absorption which is used to validate the volume concentration of the proposed volume flow rates and the second method is the confocal laser scanning microscopy (CLSM) which is used to visualize the flow pattern in the microfluidic chip in order to validate the flow pattern obtained from the simulation. 4.1. Fabrication of Microfluidic Chips
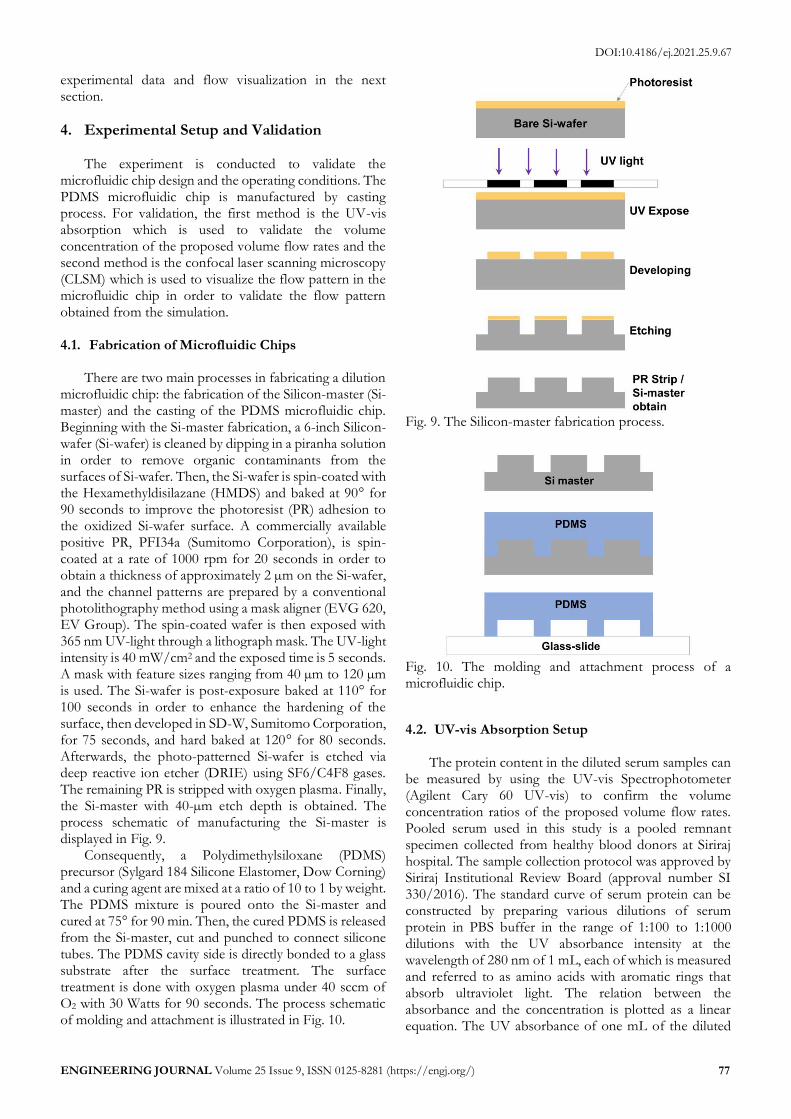
There are two main processes in fabricating a dilution microfluidic chip: the fabrication of the Silicon-master (Si-master) and the casting of the PDMS microfluidic chip. Beginning with the Si-master fabrication, a 6-inch Silicon-wafer (Si-wafer) is cleaned by dipping in a piranha solution in order to remove organic contaminants from the surfaces of Si-wafer. Then, the Si-wafer is spin-coated with the Hexamethyldisilazane (HMDS) and baked at 90° for 90 seconds to improve the photoresist (PR) adhesion to the oxidized Si-wafer surface. A commercially available positive PR, PFI34a (Sumitomo Corporation), is spin-coated at a rate of 1000 rpm for 20 seconds in order to obtain a thickness of approximately 2 µm on the Si-wafer, and the channel patterns are prepared by a conventional photolithography method using a mask aligner (EVG 620, EV Group). The spin-coated wafer is then exposed with 365 nm UV-light through a lithograph mask. The UV-light intensity is 40 mW/cm2 and the exposed time is 5 seconds. A mask with feature sizes ranging from 40 µm to 120 µm is used. The Si-wafer is post-exposure baked at 110° for 100 seconds in order to enhance the hardening of the surface, then developed in SD-W, Sumitomo Corporation, for 75 seconds, and hard baked at 120° for 80 seconds. Afterwards, the photo-patterned Si-wafer is etched via deep reactive ion etcher (DRIE) using SF6/C4F8 gases. The remaining PR is stripped with oxygen plasma. Finally, the Si-master with 40-µm etch depth is obtained. The process schematic of manufacturing the Si-master is displayed in Fig. 9.
Consequently, a Polydimethylsiloxane (PDMS) precursor (Sylgard 184 Silicone Elastomer, Dow Corning) and a curing agent are mixed at a ratio of 10 to 1 by weight. The PDMS mixture is poured onto the Si-master and cured at 75° for 90 min. Then, the cured PDMS is released from the Si-master, cut and punched to connect silicone tubes. The PDMS cavity side is directly bonded to a glass substrate after the surface treatment. The surface treatment is done with oxygen plasma under 40 sccm of O2 with 30 Watts for 90 seconds. The process schematic of molding and attachment is illustrated in Fig. 10.
4.2. UV-vis Absorption Setup
The protein content in the diluted serum samples can
be measured by using the UV-vis Spectrophotometer (Agilent Cary 60 UV-vis) to confirm the volume concentration ratios of the proposed volume flow rates. Pooled serum used in this study is a pooled remnant specimen collected from healthy blood donors at Siriraj hospital. The sample collection protocol was approved by Siriraj Institutional Review Board (approval number SI 330/2016). The standard curve of serum protein can be constructed by preparing various dilutions of serum protein in PBS buffer in the range of 1:100 to 1:1000 dilutions with the UV absorbance intensity at the wavelength of 280 nm of 1 mL, each of which is measured and referred to as amino acids with aromatic rings that absorb ultraviolet light. The relation between the absorbance and the concentration is plotted as a linear equation. The UV absorbance of one mL of the diluted
Fig. 9. The Silicon-master fabrication process.
Fig. 10. The molding and attachment process of a microfluidic chip.

DOI:10.4186/ej.2021.25.9.67
78 ENGINEERING JOURNAL Volume 25 Issue 9, ISSN 0125-8281 (https://engj.org/)
serum sample from the dilution chip is measured and the amount of protein absorption is calculated using the linear equation obtained. For this purpose, the protein content in the diluted serum sample is determined. The volume flow rates that are set up according to the Reynolds number in Table 4 and the feeding location in Fig. 7 are used for validation. The measured volume concentration ratios from the UV-vis absorption method are shown in Table 5 based on the three repetitions of the measurement. Based on the tested data, the variation between the target and measured volume concentration ratios is in the acceptable tolerance.
4.3. Confocal Laser Scanning Microscopy (CLSM)
Setup
An Olympus UPLSAPO 10X2 objective (10x magnification), together with an Olympus FV 1000 sw confocal laser scanning microscope (CLSM), is used to visualize the mixing flow pattern in the dilution microfluidic chip. The fluorescein isothiocyanate (FITC; excitation/emission maxima = 490/525 nm) with the concentration of 0.0025 mM is added into serum in order to facilitate the visualization of fluid flow pattern in the dilution microfluidic chip. The fluorescent serum and PBS buffer (pH7.4) are introduced into the dilution microfluidic chip (as shown in Fig. 7) via the serum inlet (2) and the PBS buffer inlets (1 and 3), respectively. The fluorescent serum diffuses continuously into the PBS buffer along the serpentine dilution channel. The data acquisition and signal processing are controlled by the supplied Olympus software. Micrographs of fluid flow pattern are analyzed using ImageJ version 1.51w (March 2018). In this study, there is only one scanning zone per serpentine dilution channel immediately after the inlet junction to scan the fluid flow pattern as shown in Fig. 11.
There are three scanning results obtained from the
CLSM: the bright field (BF) result, the FITC scanning result and the merged result between the BF and FITC images. An example of BF, FITC and merged images is shown in Fig. 12. The merged images of CLSM scanning
Fig. 11. Scanning zones of CLSM for five volume concentration ratios.
Fig. 12. Example of CLSM scanning results: (a) BF image, (b) FITC image and (c) merged image.
Fig. 13. Serum flow patterns: (left) CLSM results and (right) simulation results.
DOI:10.4186/ej.2021.25.9.67
ENGINEERING JOURNAL Volume 25 Issue 9, ISSN 0125-8281 (https://engj.org/) 79
results are compared with the simulation results in Fig. 13 in which the simulated serum flow patterns are visualized by blue color. Based on the comparison, both simulated and scanned serum flow patterns are in good agreement for all volume concentration ratios. Therefore, based on the validation results with the UV-vis absorption and CLSM methods, the proposed volume flow rates and simulation setup can be used to mimic the mixing flow inside the dilution microfluidic chip.
5. Evaluation of Mixing Performance
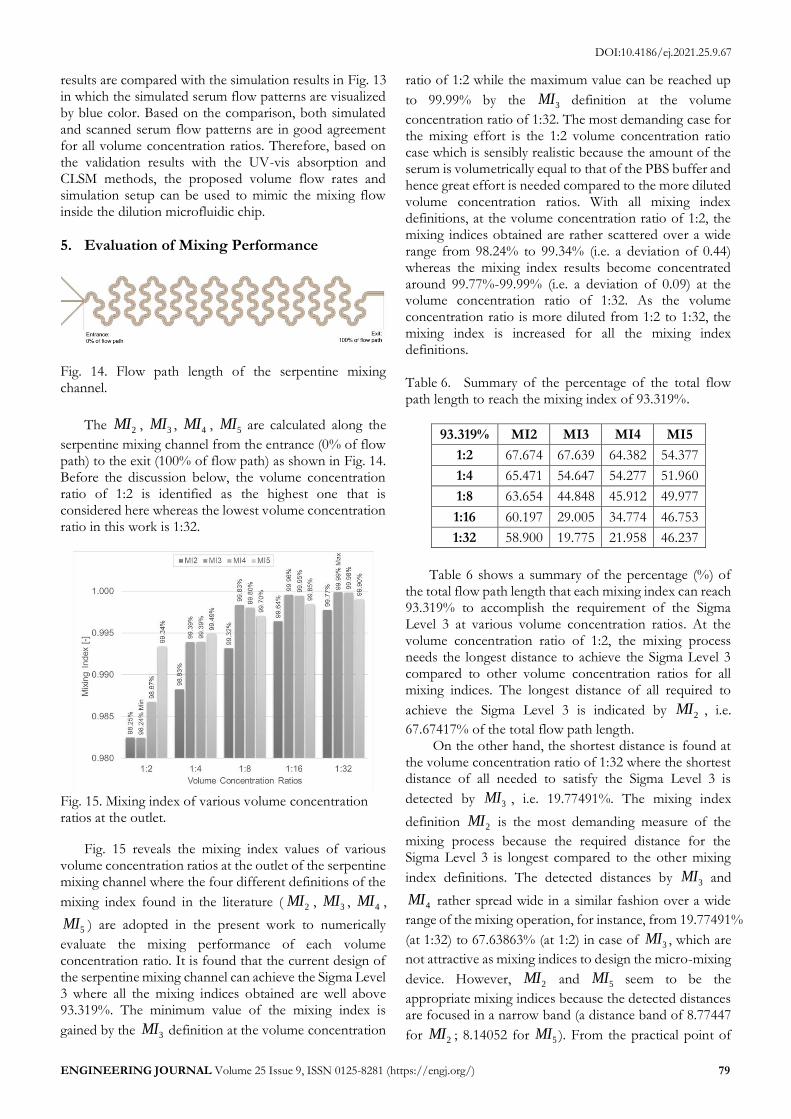
The 2MI , 3MI , 4MI , 5MI are calculated along the
serpentine mixing channel from the entrance (0% of flow path) to the exit (100% of flow path) as shown in Fig. 14. Before the discussion below, the volume concentration ratio of 1:2 is identified as the highest one that is considered here whereas the lowest volume concentration ratio in this work is 1:32.
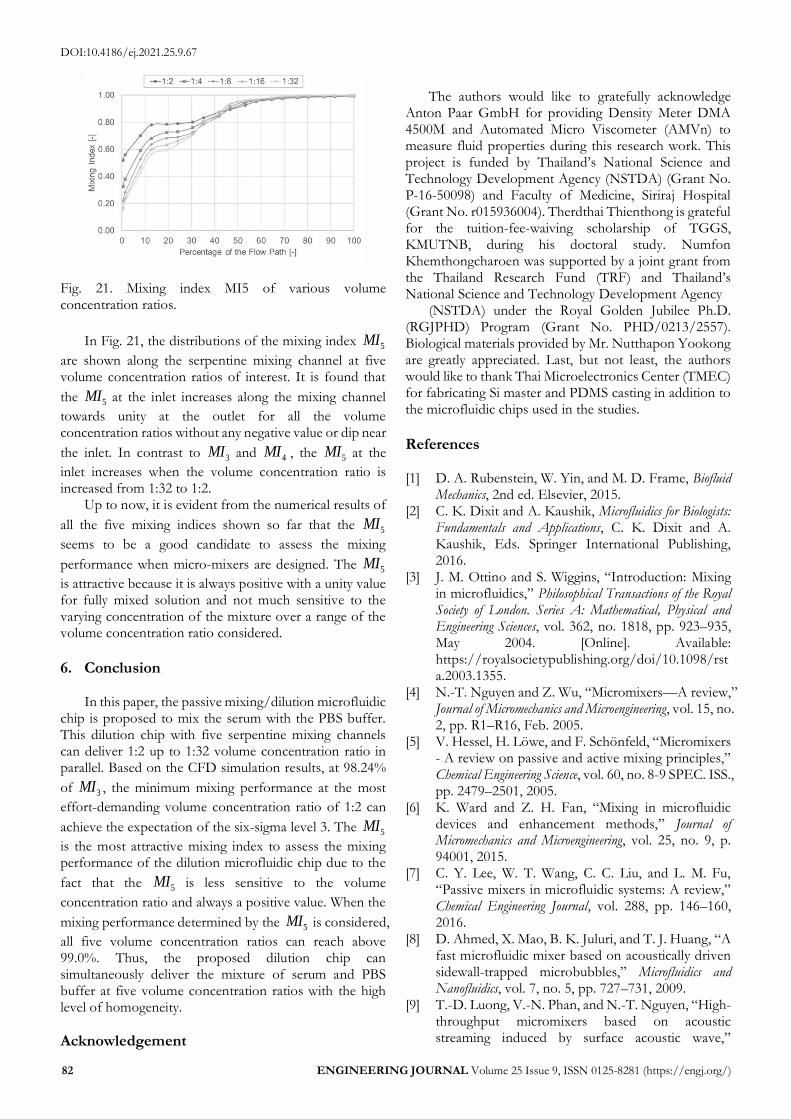
Fig. 15 reveals the mixing index values of various
volume concentration ratios at the outlet of the serpentine mixing channel where the four different definitions of the
mixing index found in the literature ( 2MI , 3MI , 4MI ,
5MI ) are adopted in the present work to numerically
evaluate the mixing performance of each volume concentration ratio. It is found that the current design of the serpentine mixing channel can achieve the Sigma Level 3 where all the mixing indices obtained are well above 93.319%. The minimum value of the mixing index is
gained by the 3MI definition at the volume concentration
ratio of 1:2 while the maximum value can be reached up
to 99.99% by the 3MI definition at the volume
concentration ratio of 1:32. The most demanding case for the mixing effort is the 1:2 volume concentration ratio case which is sensibly realistic because the amount of the serum is volumetrically equal to that of the PBS buffer and hence great effort is needed compared to the more diluted volume concentration ratios. With all mixing index definitions, at the volume concentration ratio of 1:2, the mixing indices obtained are rather scattered over a wide range from 98.24% to 99.34% (i.e. a deviation of 0.44) whereas the mixing index results become concentrated around 99.77%-99.99% (i.e. a deviation of 0.09) at the volume concentration ratio of 1:32. As the volume concentration ratio is more diluted from 1:2 to 1:32, the mixing index is increased for all the mixing index definitions.
Table 6 shows a summary of the percentage (%) of
the total flow path length that each mixing index can reach 93.319% to accomplish the requirement of the Sigma Level 3 at various volume concentration ratios. At the volume concentration ratio of 1:2, the mixing process needs the longest distance to achieve the Sigma Level 3 compared to other volume concentration ratios for all mixing indices. The longest distance of all required to
achieve the Sigma Level 3 is indicated by 2MI , i.e.
67.67417% of the total flow path length. On the other hand, the shortest distance is found at
the volume concentration ratio of 1:32 where the shortest distance of all needed to satisfy the Sigma Level 3 is
detected by 3MI , i.e. 19.77491%. The mixing index
definition 2MI is the most demanding measure of the
mixing process because the required distance for the Sigma Level 3 is longest compared to the other mixing
index definitions. The detected distances by 3MI and
4MI rather spread wide in a similar fashion over a wide
range of the mixing operation, for instance, from 19.77491%
(at 1:32) to 67.63863% (at 1:2) in case of 3MI , which are
not attractive as mixing indices to design the micro-mixing
device. However, 2MI and 5MI seem to be the
appropriate mixing indices because the detected distances are focused in a narrow band (a distance band of 8.77447
for 2MI ; 8.14052 for 5MI ). From the practical point of
Fig. 14. Flow path length of the serpentine mixing channel.
Fig. 15. Mixing index of various volume concentration ratios at the outlet.
Table 6. Summary of the percentage of the total flow path length to reach the mixing index of 93.319%.
93.319% MI2 MI3 MI4 MI5
1:2 67.674 67.639 64.382 54.377
1:4 65.471 54.647 54.277 51.960
1:8 63.654 44.848 45.912 49.977
1:16 60.197 29.005 34.774 46.753
1:32 58.900 19.775 21.958 46.237

DOI:10.4186/ej.2021.25.9.67
80 ENGINEERING JOURNAL Volume 25 Issue 9, ISSN 0125-8281 (https://engj.org/)
view, if the regulation for processing a homogeneous
mixture is strict, 2MI becomes obviously a better choice.
Fig. 16(a) – 16(e) demonstrate the distributions of the five
mixing indices ( 1MI , 2MI , 3MI , 4MI and 5MI ) along
the serpentine mixing channel at the five different concentration ratios of 1:2, 1:4, 1:8, 1:16 and 1:32
respectively. In general, the variation trends of the 2MI ,
3MI , 4MI and 5MI are quite similar, that is, their values
at the inlet keep increasing with the distance along the mixing channel towards unity at the outlet. The
distributions of 2MI and 5MI along the mixing channel
are somewhat stationary, or in other words, do not alter much over a wide range of volume concentration ratios,
where the distributions of 2MI and 5MI can be seen as a
lower bound and an upper bound respectively. The
distributions of 3MI and 4MI along the mixing channel
are almost the same where their inlet values vary drastically from almost zero at the volume concentration ratio of 1:2 to above 0.7 at the volume concentration ratio of 1:32.
Unlike 2MI , 3MI , 4MI and 5MI , the 1MI varies from
the maximum value at the inlet to zero at the outlet.
In Fig. 17, the mixing index 1MI is plotted along the
serpentine mixing channel at the five different volume concentration ratios (1:2, 1:4, 1:8, 1:16 and 1:32). It is
found that the 1MI at the inlet monotonically decreases
along the mixing channel towards zero at the outlet for all the volume concentration ratios. At the inlet, the maximum value systematically decreases with decreasing volume concentration ratio. It implies that the more diluted the volume concentration ratio, the shorter the mixing distance is required.
Fig. 16. Mixing index distribution along the serpentine mixing channel at various volume concentration ratios: (a) 1:2, (b) 1:4, (c) 1:8, (d) 1:16 and (e) 1:32.

DOI:10.4186/ej.2021.25.9.67
ENGINEERING JOURNAL Volume 25 Issue 9, ISSN 0125-8281 (https://engj.org/) 81
The variations of the mixing index 2MI along the
mixing serpentine channel are shown in Fig. 18 at various
volume concentration ratios. It can be seen that the 2MI
at the inlet increases along the mixing channel towards unity at the outlet for all the volume concentration ratios. The inlet value is lowest at the volume concentration ratio of 1:32 and increases with increasing volume
concentration ratio. However, the 2MI provides the
negative values around the entrance length as highlighted by the shaded zone. If the mixing index is meant to be
defined from zero to unity, the 2MI would be disqualified
as a candidate to evaluate the mixing performance of micro-mixers.
In Fig. 19 and 20, the mixing indices 3MI and 4MI ,
respectively, at several volume concentration ratios vary in a similar manner where their values at the inlet increase along the mixing channel towards unity at the outlet for all the volume concentration ratios. It is interesting to note that their values near the inlet (less than 15% of the flow path) are almost identical in case of the volume concentration ratios of 1:2 and 1:4 while with the volume concentration ratios of 1:8, 1:16 and 1:32, their inlet values increase respectively. Nevertheless, it is noteworthy here that their values around the inlet experience a small dip at some volume concentration ratios, for example, 1:4, 1:8,
1:16 in case of 3MI and 1:4, 1:8, 1:16, 1:32 in case of 4MI .
Fig. 17. Mixing index MI1 of various volume concentration ratios.
Fig. 18. Mixing index MI2 of various volume concentration ratios.
Fig. 19. Mixing index MI3 of various volume concentration ratios.
Fig. 20. Mixing index MI4 of various volume concentration ratios.
DOI:10.4186/ej.2021.25.9.67
82 ENGINEERING JOURNAL Volume 25 Issue 9, ISSN 0125-8281 (https://engj.org/)
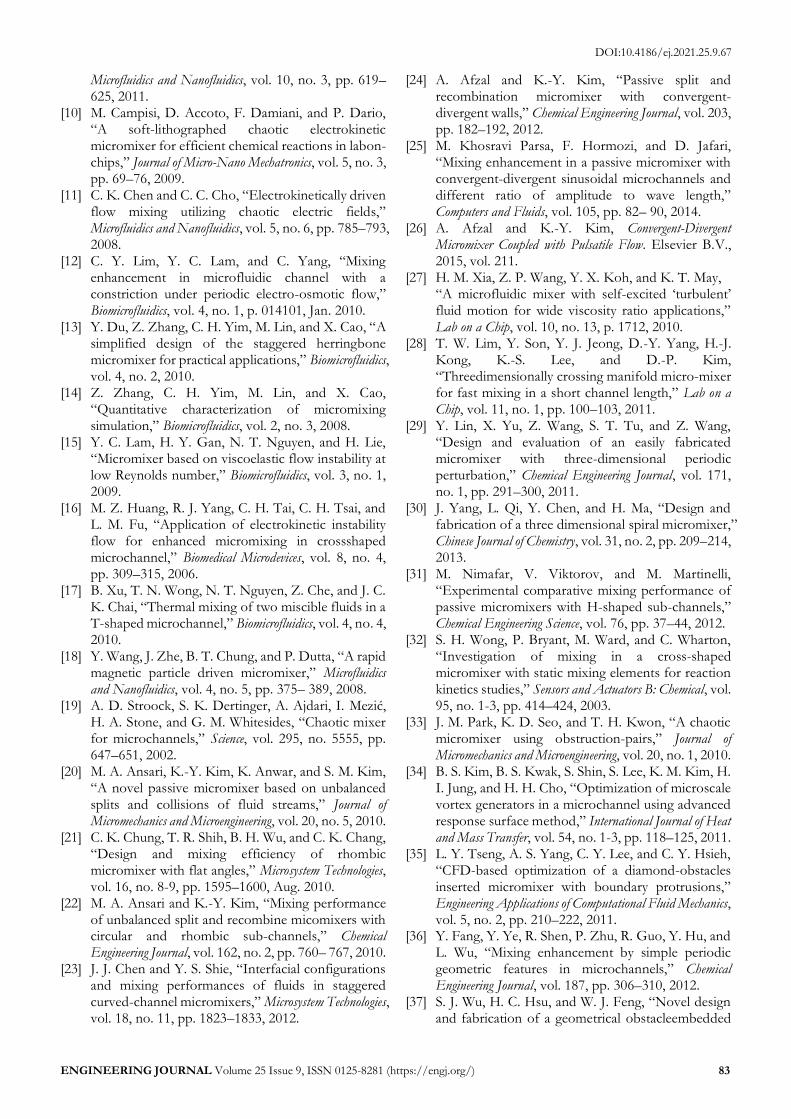
In Fig. 21, the distributions of the mixing index 5MI
are shown along the serpentine mixing channel at five volume concentration ratios of interest. It is found that
the 5MI at the inlet increases along the mixing channel
towards unity at the outlet for all the volume concentration ratios without any negative value or dip near
the inlet. In contrast to 3MI and 4MI , the 5MI at the
inlet increases when the volume concentration ratio is increased from 1:32 to 1:2.
Up to now, it is evident from the numerical results of
all the five mixing indices shown so far that the 5MI
seems to be a good candidate to assess the mixing
performance when micro-mixers are designed. The 5MI
is attractive because it is always positive with a unity value for fully mixed solution and not much sensitive to the varying concentration of the mixture over a range of the volume concentration ratio considered.
6. Conclusion
In this paper, the passive mixing/dilution microfluidic
chip is proposed to mix the serum with the PBS buffer. This dilution chip with five serpentine mixing channels can deliver 1:2 up to 1:32 volume concentration ratio in parallel. Based on the CFD simulation results, at 98.24%
of 3MI , the minimum mixing performance at the most
effort-demanding volume concentration ratio of 1:2 can
achieve the expectation of the six-sigma level 3. The 5MI
is the most attractive mixing index to assess the mixing performance of the dilution microfluidic chip due to the
fact that the 5MI is less sensitive to the volume
concentration ratio and always a positive value. When the
mixing performance determined by the 5MI is considered,
all five volume concentration ratios can reach above 99.0%. Thus, the proposed dilution chip can simultaneously deliver the mixture of serum and PBS buffer at five volume concentration ratios with the high level of homogeneity.
Acknowledgement
The authors would like to gratefully acknowledge
Anton Paar GmbH for providing Density Meter DMA 4500M and Automated Micro Viscometer (AMVn) to measure fluid properties during this research work. This project is funded by Thailand’s National Science and Technology Development Agency (NSTDA) (Grant No. P-16-50098) and Faculty of Medicine, Siriraj Hospital (Grant No. r015936004). Therdthai Thienthong is grateful for the tuition-fee-waiving scholarship of TGGS, KMUTNB, during his doctoral study. Numfon Khemthongcharoen was supported by a joint grant from the Thailand Research Fund (TRF) and Thailand’s National Science and Technology Development Agency
(NSTDA) under the Royal Golden Jubilee Ph.D. (RGJPHD) Program (Grant No. PHD/0213/2557). Biological materials provided by Mr. Nutthapon Yookong are greatly appreciated. Last, but not least, the authors would like to thank Thai Microelectronics Center (TMEC) for fabricating Si master and PDMS casting in addition to the microfluidic chips used in the studies.
References
[1] D. A. Rubenstein, W. Yin, and M. D. Frame, Biofluid
Mechanics, 2nd ed. Elsevier, 2015. [2] C. K. Dixit and A. Kaushik, Microfluidics for Biologists:
Fundamentals and Applications, C. K. Dixit and A. Kaushik, Eds. Springer International Publishing, 2016.
[3] J. M. Ottino and S. Wiggins, “Introduction: Mixing in microfluidics,” Philosophical Transactions of the Royal Society of London. Series A: Mathematical, Physical and Engineering Sciences, vol. 362, no. 1818, pp. 923–935, May 2004. [Online]. Available: https://royalsocietypublishing.org/doi/10.1098/rsta.2003.1355.
[4] N.-T. Nguyen and Z. Wu, “Micromixers—A review,” Journal of Micromechanics and Microengineering, vol. 15, no. 2, pp. R1–R16, Feb. 2005.
[5] V. Hessel, H. Löwe, and F. Schönfeld, “Micromixers - A review on passive and active mixing principles,” Chemical Engineering Science, vol. 60, no. 8-9 SPEC. ISS., pp. 2479–2501, 2005.
[6] K. Ward and Z. H. Fan, “Mixing in microfluidic devices and enhancement methods,” Journal of Micromechanics and Microengineering, vol. 25, no. 9, p. 94001, 2015.
[7] C. Y. Lee, W. T. Wang, C. C. Liu, and L. M. Fu, “Passive mixers in microfluidic systems: A review,” Chemical Engineering Journal, vol. 288, pp. 146–160, 2016.
[8] D. Ahmed, X. Mao, B. K. Juluri, and T. J. Huang, “A fast microfluidic mixer based on acoustically driven sidewall-trapped microbubbles,” Microfluidics and Nanofluidics, vol. 7, no. 5, pp. 727–731, 2009.
[9] T.-D. Luong, V.-N. Phan, and N.-T. Nguyen, “High-throughput micromixers based on acoustic streaming induced by surface acoustic wave,”
Fig. 21. Mixing index MI5 of various volume concentration ratios.
DOI:10.4186/ej.2021.25.9.67
ENGINEERING JOURNAL Volume 25 Issue 9, ISSN 0125-8281 (https://engj.org/) 83
Microfluidics and Nanofluidics, vol. 10, no. 3, pp. 619–625, 2011.
[10] M. Campisi, D. Accoto, F. Damiani, and P. Dario, “A soft-lithographed chaotic electrokinetic micromixer for efficient chemical reactions in labon-chips,” Journal of Micro-Nano Mechatronics, vol. 5, no. 3, pp. 69–76, 2009.
[11] C. K. Chen and C. C. Cho, “Electrokinetically driven flow mixing utilizing chaotic electric fields,” Microfluidics and Nanofluidics, vol. 5, no. 6, pp. 785–793, 2008.
[12] C. Y. Lim, Y. C. Lam, and C. Yang, “Mixing enhancement in microfluidic channel with a constriction under periodic electro-osmotic flow,” Biomicrofluidics, vol. 4, no. 1, p. 014101, Jan. 2010.
[13] Y. Du, Z. Zhang, C. H. Yim, M. Lin, and X. Cao, “A simplified design of the staggered herringbone micromixer for practical applications,” Biomicrofluidics, vol. 4, no. 2, 2010.
[14] Z. Zhang, C. H. Yim, M. Lin, and X. Cao, “Quantitative characterization of micromixing simulation,” Biomicrofluidics, vol. 2, no. 3, 2008.
[15] Y. C. Lam, H. Y. Gan, N. T. Nguyen, and H. Lie, “Micromixer based on viscoelastic flow instability at low Reynolds number,” Biomicrofluidics, vol. 3, no. 1, 2009.
[16] M. Z. Huang, R. J. Yang, C. H. Tai, C. H. Tsai, and L. M. Fu, “Application of electrokinetic instability flow for enhanced micromixing in crossshaped microchannel,” Biomedical Microdevices, vol. 8, no. 4, pp. 309–315, 2006.
[17] B. Xu, T. N. Wong, N. T. Nguyen, Z. Che, and J. C. K. Chai, “Thermal mixing of two miscible fluids in a T-shaped microchannel,” Biomicrofluidics, vol. 4, no. 4, 2010.
[18] Y. Wang, J. Zhe, B. T. Chung, and P. Dutta, “A rapid magnetic particle driven micromixer,” Microfluidics and Nanofluidics, vol. 4, no. 5, pp. 375– 389, 2008.
[19] A. D. Stroock, S. K. Dertinger, A. Ajdari, I. Mezić, H. A. Stone, and G. M. Whitesides, “Chaotic mixer for microchannels,” Science, vol. 295, no. 5555, pp. 647–651, 2002.
[20] M. A. Ansari, K.-Y. Kim, K. Anwar, and S. M. Kim, “A novel passive micromixer based on unbalanced splits and collisions of fluid streams,” Journal of Micromechanics and Microengineering, vol. 20, no. 5, 2010.
[21] C. K. Chung, T. R. Shih, B. H. Wu, and C. K. Chang, “Design and mixing efficiency of rhombic micromixer with flat angles,” Microsystem Technologies, vol. 16, no. 8-9, pp. 1595–1600, Aug. 2010.
[22] M. A. Ansari and K.-Y. Kim, “Mixing performance of unbalanced split and recombine micomixers with circular and rhombic sub-channels,” Chemical Engineering Journal, vol. 162, no. 2, pp. 760– 767, 2010.
[23] J. J. Chen and Y. S. Shie, “Interfacial configurations and mixing performances of fluids in staggered curved-channel micromixers,” Microsystem Technologies, vol. 18, no. 11, pp. 1823–1833, 2012.
[24] A. Afzal and K.-Y. Kim, “Passive split and recombination micromixer with convergent-divergent walls,” Chemical Engineering Journal, vol. 203, pp. 182–192, 2012.
[25] M. Khosravi Parsa, F. Hormozi, and D. Jafari, “Mixing enhancement in a passive micromixer with convergent-divergent sinusoidal microchannels and different ratio of amplitude to wave length,” Computers and Fluids, vol. 105, pp. 82– 90, 2014.
[26] A. Afzal and K.-Y. Kim, Convergent-Divergent Micromixer Coupled with Pulsatile Flow. Elsevier B.V., 2015, vol. 211.
[27] H. M. Xia, Z. P. Wang, Y. X. Koh, and K. T. May, “A microfluidic mixer with self-excited ‘turbulent’ fluid motion for wide viscosity ratio applications,” Lab on a Chip, vol. 10, no. 13, p. 1712, 2010.
[28] T. W. Lim, Y. Son, Y. J. Jeong, D.-Y. Yang, H.-J. Kong, K.-S. Lee, and D.-P. Kim, “Threedimensionally crossing manifold micro-mixer for fast mixing in a short channel length,” Lab on a Chip, vol. 11, no. 1, pp. 100–103, 2011.
[29] Y. Lin, X. Yu, Z. Wang, S. T. Tu, and Z. Wang, “Design and evaluation of an easily fabricated micromixer with three-dimensional periodic perturbation,” Chemical Engineering Journal, vol. 171, no. 1, pp. 291–300, 2011.
[30] J. Yang, L. Qi, Y. Chen, and H. Ma, “Design and fabrication of a three dimensional spiral micromixer,” Chinese Journal of Chemistry, vol. 31, no. 2, pp. 209–214, 2013.
[31] M. Nimafar, V. Viktorov, and M. Martinelli, “Experimental comparative mixing performance of passive micromixers with H-shaped sub-channels,” Chemical Engineering Science, vol. 76, pp. 37–44, 2012.
[32] S. H. Wong, P. Bryant, M. Ward, and C. Wharton, “Investigation of mixing in a cross-shaped micromixer with static mixing elements for reaction kinetics studies,” Sensors and Actuators B: Chemical, vol. 95, no. 1-3, pp. 414–424, 2003.
[33] J. M. Park, K. D. Seo, and T. H. Kwon, “A chaotic micromixer using obstruction-pairs,” Journal of Micromechanics and Microengineering, vol. 20, no. 1, 2010.
[34] B. S. Kim, B. S. Kwak, S. Shin, S. Lee, K. M. Kim, H. I. Jung, and H. H. Cho, “Optimization of microscale vortex generators in a microchannel using advanced response surface method,” International Journal of Heat and Mass Transfer, vol. 54, no. 1-3, pp. 118–125, 2011.
[35] L. Y. Tseng, A. S. Yang, C. Y. Lee, and C. Y. Hsieh, “CFD-based optimization of a diamond-obstacles inserted micromixer with boundary protrusions,” Engineering Applications of Computational Fluid Mechanics, vol. 5, no. 2, pp. 210–222, 2011.
[36] Y. Fang, Y. Ye, R. Shen, P. Zhu, R. Guo, Y. Hu, and L. Wu, “Mixing enhancement by simple periodic geometric features in microchannels,” Chemical Engineering Journal, vol. 187, pp. 306–310, 2012.
[37] S. J. Wu, H. C. Hsu, and W. J. Feng, “Novel design and fabrication of a geometrical obstacleembedded

DOI:10.4186/ej.2021.25.9.67
84 ENGINEERING JOURNAL Volume 25 Issue 9, ISSN 0125-8281 (https://engj.org/)
micromixer with notched wall,” Japanese Journal of Applied Physics, vol. 53, no. 9, 2014.
[38] H. Le The, H. Le Thanh, T. Dong, B. Q. Ta, Tran-Minh, and F. Karlsen, “An effective pas-sive micromixer with shifted trapezoidal blades using wide Reynolds number range,” Chemical Engineering Research and Design, vol. 93, pp. 1–11, 2015.
[39] C. A. Cortes-Quiroz, A. Azarbadegan, M. Zangeneh, and A. Goto, “Analysis and multi-criteria design optimization of geometric characteristics of grooved micromixer,” Chemical Engineering Journal, vol. 160, no. 3, pp. 852–864, 2010.
[40] Y. Zhang, Y. Hu, and H. Wu, “Design and simulation of passive micromixers based on capillary,” Microfluidics and Nanofluidics, vol. 13, no. 5, pp. 809–818, 2012.
[41] S. Hossain, M. A. Ansari, A. Husain, and K.-Y. Kim, “Analysis and optimization of a micromixer with a modified Tesla structure,” Chemical Engineering Journal, vol. 158, no. 2, pp. 305–314, 2010.
[42] A. S. Yang, F. C. Chuang, C. K. Chen, M. H. Lee, S. W. Chen, T. L. Su, and Y. C. Yang, “A highperformance micromixer using three-dimensional Tesla structures for bio-applications,” Chemical Engineering Journal, vol. 263, pp. 444–451, 2015.
[43] R. Liu, M. Stremler, K. Sharp, M. Olsen, J. Santiago, R. Adrian, H. Aref, and D. Beebe, “Passive mixing in a three-dimensional serpentine microchannel,” Journal of Microelectromechanical Systems, vol. 9, no. 2, pp. 190–197, Jun. 2000.
[44] A. Hashmi and J. Xu, “On the Quantification of Mixing in Microfluidics,” Journal of Laboratory Automation, vol. 19, no. 5, pp. 488–491, Oct. 2014.
[45] H. C. Tekin, V. Sivagnanam, A. T. Ciftlik, A. Sayah, C. Vandevyver, and M. A. M. Gijs, “Chaotic mixing using source–sink microfluidic flows in a PDMS chip,” Microfluidics and Nanofluidics, vol. 10, no. 4, pp. 749–759, Apr. 2011.
[46] S. Wang, X. Huang, and C. Yang, “Mixing enhancement for high viscous fluids in a microfluidic chamber,” Lab on a Chip, vol. 11, no. 12, p. 2081, 2011.
[47] H. V. Phan, M. B. Coşkun, M. Şeşen, G. Pandraud, A. Neild, and T. Alan, “Vibrating membrane with discontinuities for rapid and efficient microfluidic mixing,” Lab on a Chip, vol. 15, no. 21, pp. 4206– 4216, 2015.
[48] M. Du, Z. Ma, X. Ye, and Z. Zhou, “On-chip fast mixing by a rotary peristaltic micropump with a single structural layer,” Science China Technological Sciences, vol. 56, no. 4, pp. 1047–1054, 2013.
[49] T. Thienthong, E. Juntasaro, W. Sripumkhai, N. Houngkamhang, M. Chanasakulniyom, N. Khemthongcharoen, M. Yasawong, C. Hruanun, A. Poyai, C. Promptmas, P. Uawithya, and W. Jeamsaksiri, “Design and validation of a multiple dilution microfluidic chip for a human serum preparation,” in The 7th Thai Society of Mechanical
Engineers – International Conference on Mechanical Engineering, Dec. 2016.
[50] ANSYS, ANSYS Fluent Theory Guide Release 18.2. ANSYS, Inc., 2017.
[51] J. Castillo-Leo’n and W. E. Svendsen, Lab On-A-Chip Devices and Micro-Total Analysis Systems, J. Castillo-León and W. E. Svendsen, Eds. Springer International Publishing, 2015.
[52] J. M. Chen, T. L. Horng, and W. Y. Tan, “Analysis andmeasurementsofmixinginpressure-drivenmicrochannel flow,” Microfluidics and Nanofluidics, vol. 2, no. 6, pp. 455–469, 2006.
[53] H. Song, Y. Wang, and K. Pant, “Cross-stream diffusion under pressure-driven flow in microchannels with arbitrary aspect ratios: A phase diagram study using a three-dimensional analytical model,” Microfluidics and Nanofluidics, vol. 12, no. 1-4, pp. 265–277, 2012.
[54] J. Dambrine, B. Géraud, and J. B. Salmon, “Interdiffusion of liquids of different viscosities in a microchannel,” New Journal of Physics, vol. 11, 2009.
[55] M. A. Ansari and K.-Y. Kim, “A numerical study of mixing in a microchannel with circular mixing chambers,” AIChE Journal, vol. 55, no. 9, pp. 2217–2225, Sep. 2009.
[56] D. Di Carlo, “Inertial microfluidics,” Lab on a Chip, vol. 9, no. 21, pp. 3038–3046, 2009.
[57] W. Dean, “XVI. Note on the motion of fluid in a curved pipe,” The London, Edinburgh, and Dublin Philosophical Magazine and Journal of Science, vol. 4, no. 20, pp. 208–223, Jul. 1927.
[58] W. R. Dean, “Fluid Motion in a Curved Channel,” Proceedings of the Royal Society A: Mathematical, Physical and Engineering Sciences, vol. 121, no. 787, pp. 402–420, 1928.
[59] W. Dean, “LXXII. The stream-line motion of fluid in a curved pipe (Second paper),” The London, Edinburgh, and Dublin Philosophical Magazine and Journal of Science, vol. 5, no. 30, pp. 673–695, Apr. 1928.
[60] B. Bara, “Experimental investigation of developing and fully developed flow in a curved duct of square cross section,” Ph.D. dissertation, University of Alberta, 1991.
[61] B. Bara, K. Nandakumar, and J. H. Masliyah, “An experimental and numerical study of the Dean problem: flow development towards twodimensional multiple solutions,” Journal of Fluid Mechanics, vol. 244, pp. 339–376, 1992.
[62] M. Norouzi and N. Biglari, “An analytical solution for Dean flow in curved ducts with rectangular cross section,” Physics of Fluids, vol. 25, no. 5, p. 053602, 2013.
[63] C. Gygi, B. Williams, and S. R. Covey, Six Sigma for Dummies, 2nd ed. John Wiley & Sons, Inc, 2012.
[64] B. S. El-Haik, Axiomatic Quality. Hoboken, NJ, USA: John Wiley & Sons, Inc., Mar. 2005.
[65] R. B. Bird, E. N. Lightfoot, and W. E. Stewart, Transport Phenomena, 2nd ed. John Wiley & Sons, 2002.
DOI:10.4186/ej.2021.25.9.67
ENGINEERING JOURNAL Volume 25 Issue 9, ISSN 0125-8281 (https://engj.org/) 85
[66] C. R. Wilke and P. Chang, “Correlation of Diffusion Coefficients in Dilute Solutions,” AIChE Journal, vol. 1, no. 2, pp. 264–270, 1955.
[67] F. M. White, Viscous Fluid Flow, 3rd ed. McGraw-Hill Education, 2006.
[68] National Center for Biotechnology Information, “Phosphate-Buffered Saline Information,” 2008.
[Online]. Available: https://pubchem.ncbi.nlm. nih.gov/compound/24978514
[69] Sigma-Aldrich, “Human Albumin,” 1996. [Online]. Available: https://www.sigmaaldrich.com/ life-science/metabolomics/enzyme-explorer/ enzyme-reagents/human-albumin.html
Therdthai Thienthong received B.Eng. degree in mechanical engineering from Kasetsart University, Thailand, in 2003. He received M.Sc. in mechanical engineering simulation and design from The Sirindhorn International Thai-German Graduate School of Engineering (TGGS), King Mongkut’s University of Technology North Bangkok (KMUTNB), Thailand, in 2013. He has been a Doctoral candidate in mechanical engineering of The Sirindhorn International Thai-German Graduate School of Engineering (TGGS), King Mongkut’s University of Technology North Bangkok (KMUTNB), Thailand, since 2015. He receives the tuition-fee-waiving scholarship of TGGS, KMUTNB, during his doctoral study. His research interests focus on computational fluid dynamics (CFD) and microfluidics.
Ekachai Juntasaro received B.Eng. degree in mechanical engineering from King Mongkut’s Institute of Technology Ladkrabang (KMITL), Thailand in 1989, and pursued both M.Sc. and Ph.D. degrees in mechanical engineering at Imperial College London, U.K. in 1992 and 1997 respectively with the Royal Thai Government Scholarship. In 1997, he started working as Lecturer at School of Mechanical Engineering, Institute of Engineering, Suranaree University of Technology (SUT), Nakhon Ratchasima, Thailand where he became Assistant Professor and Associate Professor in 2001 and 2006 respectively. Since 2008, he has worked as Associate Professor in Mechanical Engineering Simulation and Design (MESD) Group at The Sirindhorn International Thai-German
Graduate School of Technology (TGGS), King Mongkut’s University of Technology North Bangkok (KMUTNB), Thailand. His research interests are unstructured finite volume method for computational fluid dynamics (CFD), transition and turbulence modelling with/without analytical wall function (AWF), microfluidics and turbomachinery flow in power plants.
Witsaroot Sripumkhai received M.S. degree in science and nanotechnology from College of Nanotechnology, KMITL, Thailand. He is currently a Senior Assistant Researcher in Surface and Microfluidic Device Innovation Research Team at Thai Microelectronics Center (TMEC), NECTEC, NSTDA. His research interests are microfabrication process for microfluidic applications and superhydrophobic surface for antifouling application.
Nongluck Houngkamhang received her Bachelor’s degree with 2nd Class Honor in chemistry from Naresuan University, Thailand, in 2006. In 2007, she won the Royal Golden Jubilee Ph.D. Program scholarship granted by Thailand Research Fund to pursue her graduate study at Mahidol University, Thailand, and received her Ph.D. in materials science and engineering in 2012. In 2012, she started working as Research Associate at Mahidol University, Thailand. Since 2014, she has worked as Lecturer at College of Nanotechnology, King Mongkut’s Institute of Technology Ladkrabang (KMITL), Thailand, and became Assistant Professor in 2018. She was awarded as the 8th HOPE Meeting Fellow (Japan) in 2016. Her research interests are biosensors, surface plasmon
resonance, protein/DNA chips, surface chemistry, and medical diagnostic devices and kits.

DOI:10.4186/ej.2021.25.9.67
86 ENGINEERING JOURNAL Volume 25 Issue 9, ISSN 0125-8281 (https://engj.org/)
Mayuree Chanasakulniyom received B.Sc. degree (Honor) in Medical Technology from Chiang Mai University, Chiang Mai, Thailand, in 2005, and M.Sc. degree in Molecular Biology and Genetic Engineering from Mahidol University, Nakhon Pathom, Thailand, in 2008. She also received Ph.D. degree in Biomedical Engineering from University of Glasgow, Glasgow, Scotland, in 2014. She is currently a Lecturer at Department of Clinical Chemistry, Faculty of Medical Technology, Mahidol University, Nakhon Pathom, Thailand. Her research interests are the medical diagnosis using lab-on-a-chip and microfluidics and the development of quality control material for quality assurance in medical diagnosis.
Numfon Khemthongcharoen received her Bachelor’s and Master’s degrees in medical technology from Mahidol University, Bangkok, Thailand. She has worked as a Research Assistant at National Electronics and Computer Technology Center (NECTEC), Thailand, since 2010. In 2015, she won the Royal Golden Jubilee Ph.D. Program scholarship granted by the Thailand Research Fund. She is a Ph.D. candidate in Department of Biomedical Engineering, Faculty of Engineering Mahidol University. Her research interests are biosensors, bio-optics, microfluidic system, and optical devices for medical diagnosis.
Pattaraluck Pattamang received M.S. degree in science and nanotechnology from College of Nanotechnology, KMITL, Thailand. She is currently an Assistant Researcher in Surface and Microfluidic Device Innovation Research Team at Thai Microelectronics Center (TMEC), NECTEC, NSTDA. Her research interests are Microfluidic device and Lab on a disk.
Nithi Atthi received his Bachelor’s degree in Materials Engineering and Master’s degree in Engineering Management from Kasetsart University (KU) in 2004 and 2008. In 2013, he won the MEXT Monbukagakusho scholarship granted by Japanese Government to pursue his graduate study at Tokyo Institute of Technology and received his Master’s degree and Ph.D. in Electronics and Applied Physics. He was awarded as the Green Talent Fellow (Germany) in 2018, the 10th HOPE Meeting Fellow (Japan) in 2018, and the Young Leaders of the 16th STS forum (Japan) in 2019. He has authored and co-authored of more than 30 technical journal publications, gave a talk on his research in more than 110 academic conferences, and filed 25 domestic and international patents. In 2018, he was appointed as a Research Team Leader of Surface and Microfluidic Device
Innovation Research Team at Thai Microelectronics Center (TMEC), Thailand. His research focuses on Si-based semiconductor process technology, micro/nano patterning, high-k/metal gate stacks, microfluidic devices, and superamphiphobic and anti-fouling surface by surface texturing and modification for various applications.
Chamras Promptmas received B.Sc. degree (Honor) in Medical Technology from Mahidol University, Bangkok, Thailand, in 1976, and M.Sc. Degree in Biochemistry from Chulalongkorn University, Bangkok, Thailand, in 1980. He received Diploma in Biotechnology from University of Kent at Canterbury, U.K., in 1988, and Ph.D. degree in Biochemistry from Mahidol University in 1994. He had worked on biosensor at Mahidol University for over 15 years and collaborated the research with the Fraunhofer Institute for Biosensor Research, Muenster, Germany, the Fraunhofer Institute for Biomedical Engineering, Potdam-Golm, Germany, and Department of Analytical Biochemistry, Institute of Biochemistry and Biology, University of Potsdam, Germany. Recently, he
has joined Department of Biomedical Engineering, Mahidol University, as Director of Biosensors and Micro Total Analysis System Laboratory. He has expanded his work to Ion Sensitive Field Effect Transistor (ISFET) and microfluidic systems.

DOI:10.4186/ej.2021.25.9.67
ENGINEERING JOURNAL Volume 25 Issue 9, ISSN 0125-8281 (https://engj.org/) 87
Panapat Uawithya received Bachelor of Science degree in Medical Science (Second Class Honors) and then Ph.D. degree in Molecular Biology and Genetic Engineering from Mahidol University, Bangkok, Thailand, in 1996 and 2001 respectively. He also received MD degree (Siriraj Hospital) from Mahidol University, Bangkok, Thailand, in 2004. He had been trained as postdoctoral research fellow at National Institutes of Health, Bethesda, MD, USA from 2006 to 2009. He has joined Department of Physiology, Faculty of Medicine, Siriraj Hospital, Mahidol University, since 2005 where he became Assistant Professor and Associate Professor in 2011 and 2019 respectively. His research interests are water channel functions and regulations in human, and biomarkers for
detection of demyelinating diseases.
Wutthinan Jeamsaksiri received his M.Eng. and Ph.D. from department of electrical and electronic engineering, Imperial College London, U.K., in 1996 and 2003 respectively. He then worked as a process integration engineer on a European project at IMEC, Leuven, Belgium, from 2000 to 2004. The project he carried out was on Integration of Microwave Performance Advanced CMOS Technology. From 2005, he has been working at Thai Microelectronics Center (TMEC) under the National Electronics and Computer Technology Center (NECTEC). In 2018, he took the position as a research group director of TMEC. His work interest includes Si based sensors, MEMS, microfluidic devices, and surface texturing and modification for various applications.