mizoram economic survey 2014 15 - welcome to ... 15-16/mizoram economic survey...mizoram economic...
TRANSCRIPT
If you are willing and obedient, you shall eat the good of the land
Isaiah 1:19 (KJ)
MIZORAM
ECONOMIC SURVEY
2014 – 15
Government of Mizoram Planning & Programme Implementation Department
(Research & Development Branch)

C O N T E N T S
A. OVERVIEW, ISSUES AND PRIORITIES ........................................... i
B. ACRONYMS......................................................................................... vii
I. OVERVIEW OF INDIAN ECONOMY ......................................................... 1
II. OVERVIEW OF MIZORAM ECONOMY .................................................... 3
III. STATE FINANCE ................................................................................... 8
IV. STATE PLAN ....................................................................................... 16
V. EMPLOYMENT & LABOUR WELFARE .................................................. 22
VI. PRICE AND PUBLIC DISTRIBUTION .................................................... 27
VII. POPULATION ...................................................................................... 30
VIII. AGRICULTURE AND ALLIED ............................................................... 32 AGRICULTURE ..................................................................................................................... 32 MINOR IRRIGATION ............................................................................................................ 42 HORTICULTURE ................................................................................................................... 45 LIVESTOCK & VETERINARY ............................................................................................. 53 FISHERIES .............................................................................................................................. 57 FOREST ................................................................................................................................... 61 SOIL & WATER CONSERVATION ..................................................................................... 66 TRADE & COMMERCE ........................................................................................................ 69
IX. INFRASTRUCTURE ............................................................................. 72 POWER & ELECTRICITY ..................................................................................................... 72 ROADS .................................................................................................................................... 77 ROAD TRANSPORT .............................................................................................................. 85
POSTAL SERVICE ................................................................................. 88 TELECOMMUNICATION ..................................................................................................... 89
X. FINANCIAL AND BANKING INSTITUTION ............................................. 90
XI. INDUSTRIES ....................................................................................... 92 INDUSTRY ............................................................................................................................. 92 SERICULTURE ...................................................................................................................... 99 TOURISM ............................................................................................................................. 102
XII. SOCIAL AND SERVICE SECTOR ........................................................ 104 SCHOOL EDUCATION ....................................................................................................... 104 HEALTH & FAMILY WELFARE ....................................................................................... 110 HOSPITAL & MEDICAL EDUCATION ............................................................................. 117 WATER SUPPLY AND SANITATION ............................................................................... 124 SOCIAL WELFARE ............................................................................................................. 126 COOPERATION ................................................................................................................... 132 SPORTS & YOUTH SERVICES .......................................................................................... 139
XIII. RURAL AND URBAN DEVELOPMENT ................................................. 143 RURAL DEVELOPMENT ................................................................................................... 143 URBAN DEVELOPMENT & POVERTY ALLEVIATION ................................................ 151
XIV. NEW LAND USE POLICY (NLUP) ........................................................... 166
XV. LIST OF ANNEXURES ....................................................................... 172
…….

i
Economic Survey Mizoram 2014-15
A. OVERVIEW, ISSUES AND PRIORITIES
Growth
The State economy is poised to
growth at an impressive rate of 8.46 %
during 2014-15 with base year 2004-05,
which is significantly higher than projected
national growth at 7.4% during 2014-15
with base year 2011-12.
On January 30, the Central
Statistics Office released a new GDP series
that entailed shifting the base year from
2004-05 to 2011-12. New estimates for
GDP have been provided for the years
2011-12 to 2014-15 at national level and
State data with 2011-12 is not available.
The State economic growth estimates is
expected to be even higher with revised
base year.
Provisional per capita income
during 2012-2013 is Rs. 63413.00 as
against previous year‘s estimate of
Rs.53624. Per capita income at the
national level is Rs. 71593.00 against the
previous year‘s estimate of Rs. 64316.00.
The growth performance of the
State economy has been quite
commendable as the economy has to go
through challenging times amidst partial
policy paralysis at the Centre due to Lok
Sabha election and subsequent change in
Government that has been severely
hindering funds flow from the Centre to the
State. Moreover, the State Government has
also been initiating slew of economic
reform measures including Government‘s
efforts to remain steadfast in the pursuit of
fiscal consolidation, downsizing of
Government, other economy measures.
Evidently, continued hard work and
sound economic management including
consistent efforts and persistent pro-growth
initiatives of the stable Government in the
State has yielded such an impressive
growth outcomes.
Sectoral Performance
Services or Tertiary Sector
dominates the economy in terms of
contribution to the Gross State Domestic
Product (GSDP) at 57.68% of the total
GSDP (2013-14). Services Sector has been
growth drivers of the economy for the past
years with contribution to the GSDP
hovering between 57% to 63%.
The Primary Sector comprising
agriculture & allied activities contributed
16.26% (2013-2014) to the GSDP. With
livelihood of about 60% of the population
depending on agriculture and allied
actitivities, faster growth in agriculture is
both a necessary and sufficient condition
for stronger, sustainable and inclusive
growth in the State.
The Industry Sector contributed
26.05% of GSDP during 2013-2014. The
main driving force of the sector is
Construction Sector with a contribution of
21.91% to the GSDP in 2013-2014.
Inflation
The Annual inflation rate
(Provisional as of December 2014) on point
to point basis (December 2014 over
December 2013) in Mizoram is 3.82 %
against the all India inflation rate of 5.00
%, significantly lower than the all India
average.
As compared to corresponding
period last year, the all India annual
inflation rate significantly decreases from
the previous year‘s level at 9.87 %. In the
case of Mizoram, the decline in inflation
rate is even higher from the previous year‘s
rate of 11.67 %. Moderation in the rate of
inflation from double digit to about 4% rate
is expected to bring about a more stable
economy for inclusive growth in the State.

ii
Economic Survey Mizoram 2014-15
Demographic Dividend
Another reason for optimism in the
State economy is demographic dividend –
the dependency ratio in the State, as
measured by the share of the young and the
elderly as a fraction of the population. As
per Union Economic Survey 2014-15, share
of 60 and above age group in the Mizoram
population as per 2011 census is only
6.25%. This means that share of 0-59 age
group in the total population is as high as
93.75% in the State.
This implies high productive age
groups in the State. More working age
people will mean more workers, especially
in the productive age groups, more
incomes, more savings, more capital per
worker, and more growth. Also, what is
evident in the State is that the transition
period has been accompanied by greater
female participation in the labour force.
However, we would need to create
significant number of productive jobs in the
economy to properly reap the benefit of
demographic dividend in the State.
Fiscal Condition
The State Government continues to
largely depend on devolution from the
Central Government, as such the State‘s
fiscal health depends on the terms of
devolution of resources from the Central
Government as recommended by the
successive Finance Commission from time
to time. At the same time, the revenue and
expenditure policy of the State Government
also have substantial impact on the fiscal
position of the State government, especially
the expenditure policy.
It is estimated that the Gross Fiscal
Deficit during 2014-15 would be Rs.586.67
crore which is 5.98 per cent of the GSDP
projected for the year, with public debt
estimated at about 57.64 % (BE 2014-15).
The State Government is expected
to have the much needed policy and fiscal
space in the coming years by way of
enhanced State shares of taxes in the
Fourteenth Finance Commission (FFC)
Award. FFC has also enlarged the scope of
development programme by sharing the
onus between Centre and States, and re-
designing many of the centrally sponsored
schemes. Moreover, the Central
Government had set in motion the
institutional changes necessary for
implementing co-operative federalism by
way of replacing Planning Commission
with National Institute for Transforming
India (NITI).
NLUP
The State Government is continuing
efforts for achieving the objective of
inclusive growth through flagship
programme, the New Land Use Policy
(NLUP), in a strategically planned manner.
The programme continues to create
sustainable and profitable livelihood and
also positively impacting environmental
sustainability, poverty reduction, gender
balance and improving rural economy.
As per the midterm assessment,
NLUP has contributed to the state‘s
economy with the annual food grain
production having been increased by 19.07
percent along with the continuously
declining areas under Jhum cultivation by
more than 10.36 percent per year (Project
Progress Report: 2012) supplemented by a
remarkable expansion in the infrastructure
undertaken according to the project‘s
convergence plan with CSS. Commendable
success has been achieved and some of the
success stories are highlighted below:
Agriculture: Under the NLUP, area
under Wet Rice Cultivation has been
extended by 4040 Ha or 33% by March
2014. Rice production has increased by
27.43%. Moreover, due to switching over
of alternative livelihood activities, Jhum
iii
Economic Survey Mizoram 2014-15
area has been reduced significantly. Area
under Oil Palm cultivation has gone up by
2750 Ha or 15.60%. Farm mechanization
has been taken up due to convergence of
RKVY & MMA with NLUP resulting in
busting up of rice production and
productivity in Mizoram, and 625 Kms of
agriculture link road has been constructed.
Animal Husbandry & Veterinary:
Milk production has gone up by 22% in 4
years time. Three milk processing units
have been set up and one existing milk
processing unit at Thuampui, Aizawl was
upgraded to increase production capacity
by 25%. Production of animal feed has
gone up by 150% compared to 2010-11.
Production of egg has gone up by 11.31
lakh number or 3.2%. Meat production has
gone up by 25.66%.
Fisheries: About 1644.5 hectare of
water has been benefiting 3289 jhumia
families. Productivity has gone up from
about 1500 Kg per hectare to 2500 Kg per
hectare, leading to increase of fish
production in the state by 17%. Income of
the fish farmers have increased by 75% to
150% per annum. Per capita consumption
of fish has gone up contributing to
improvement in nutrition intake.
Soil & Water Conservation: There
was no functional rubber nursery in
Mizoram till 2009-10. Under NLUP six
numbers of Rubber seedling nurseries were
created with annual production capacity of
2.5 lakh rubber seedlings and saplings.
During the first two years of
implementation of NLUP production of
Rubber seedlings/saplings was nil.
Production of planting materials in 2013-14
and 2014-15 is 24.30% and 77.92% of the
demand respectively. Self-sufficiency is
expected in 2015-16. Under Broom
cultivation value of broom stick production
has gone up from Rs. 37 lakhs in 2009-10
to Rs. 14.26 crore by 2013-14. Increase in
the income of broom grass farmers have
gone up by 75% as compared to pre-
commencement of NLUP.
Sericulture: Production of
mulberry-based silkworm trade was taken
up under Sericulture Department. 2208
families have been covered. In 2009-10,
production of seed was below 5% of the
demand. Self-sufficiency in seed
production has been achieve by 2013-14
i.e. 8 lakh dfls per year. Demand for about
3000 silkworm-rearers has also been met.
Cocoon production has gone up by 40%.
Urban Development & Poverty
Alleviation: 10 trades including automobile
repairing, beauty parlour, desktop
publishing, electronic repair, Video &
Photography, etc. are implemented under
UD & PA. 3108 beneficiaries have been
covered so far. As per assessment of the
department, 28% beneficiaries have
increased their income 2 to 3 times. 67% of
beneficiaries have depended fully on their
income for their livelihood. Most of the
beneficiaries who earn their livelihood as
casual labour are promoted to self-
supported family.
Issues and Priorities
The defining challenge in Mizoram
today is that of generating productive
employment and inclusive growth.
As regards employment,
Government contributes much of the
formal sector in the State. However,
considering the already oversized public
sector in the State, there would not be any
future scope for creating more jobs in
public sector. Creating an environment
conducive for private sector investment in
the State may be one of the top priorities of
the Government. Stable Government in the
State coupled with demographic dividend
supported by favourable human
development condition in the economy
could appropriately provide impetus.

iv
Economic Survey Mizoram 2014-15
Nearly three-quarters of families
depend on agriculture and allied incomes.
Agriculture and allied sector activities are
heavily concentrated in rural areas, and
majority of the poor in Mizoram are found
in rural areas. Moreover, our food security
depends on producing foodgrains, as well
as increasing its production of fruits,
vegetable and milk to meet the demands of
raising middle income population. To do
so, a productive, competitive, diversified
and sustainable agricultural sector will need
to be emerged at an accelerated pace.
Therefore, faster growth in agriculture and
allied sector is both a necessary and
sufficient condition for stronger and
inclusive growth for poverty alleviation in
the State. In this regard, the State flagship
programme New Land Use Policy (NLUP)
which is aiming at reducing poverty
through socially inclusive strategy for
enhancing productivity of agriculture and
allied sector has seen to have been
achieving commendable success even now
and it is further expected to have larger
favorable impact for stronger and inclusive
growth of the economy in the medium to
longer period.
Public finances need to be put on a
sustainable path. The State needs a sharp
fiscal correction. The State Government
may take advantage of expected fiscal
space to be provided by Fourteenth Finance
Commission Award from 2015-16 financial
year onward and undertake bold
expenditure reforms comprising of three
elements: (i) significantly reducing subsidy
spending and shifting the subsidy
programme to income support or providing
incentives for productive activitites; (ii)
improving quality of expenditure with a
change in the focus of government
spending towards provision of critical
public infrastructure or creating public
value for inclusive growth; and (iii)
instituting accountability system through a
focus on outcomes or impact on the
economy.
The demographic dividend in
Mizoram could be properly exploited
through appropriate skills development
mission and initiatives in the State.
Government Skills Mission needs to be
streamlined and should be undertaken by
Departments in a coordinated manner. The
Government may also take advantage of the
newly launched National Skills
Qualification Framework to revamp
education and training in the State. In this
regard, appropriate policy or action plan for
the State Government may be formulated
keeping in view the National Skills
Qualification Framework.
The growth agenda of the State
Government has been tethered towards
addressing the above challenges and
priorities.
A new ‗planning‘ and ‗monitoring‘
process ―Approach to Developing
Growth Strategies for Mizoram‖
developed by Mizoram State Planning
Board under the Chairmanship of Hon‘ble
Chief Minister, has been discussed and
approved by Council of Ministers in their
meeting on 18th
February 2015.
The new approach will attempt to
develop ‗Comprehensive Growth Strategies
for Mizoram‘ with a process that will be
anchored in a robust analytical framework
based on gap analysis or growth diagnostic,
developed in accordance with levels of
ambition that would guide the reform
agenda and pro-growth policy for each
Departments, and based on enhanced
collaboration among Departments in the
State Government. Comprehensive Growth
Strategies will spell out concrete Action
Plans for key Departments with an aim to
address major drawbacks in the State
Economy that is hindering the growth and
development process.

v
Economic Survey Mizoram 2014-15
Sectoral Surveillance: To facilitate
growth diagnostic process, Sectoral
Surveillance mechanism has been instituted
under the Chairmanship of Vice Chairman,
Mizoram State Planning Board. The main
aim of Sectoral Surveillance is to monitor
sectoral performances in the economy to
identify gaps that are hindering economic
growth, and to review performance of each
sectors and Departments vis-à-vis their
contribution to growth in the State
Economy. The Sectoral Surveillance will
render advice to align Departments policy
and activities towards effective
implementation of pro-Growth Strategies
and formulate Action Plans, and address
coordination issues among various
Departments.
Monitoring and Surveillance: The
Government has also strengthened
Monitoring and Surveillance mechanism
with participation of all implementing
Departments. High Level Monitoring and
Surveillance Committee has been
constituted to conduct quarterly review and
monitoring of implementation progress of
all Development projects, schemes and
programmes: (i) High Level Monitoring
and Surveillance Committee I under the
Chairmanship of Hon‘ble Chief Minister /
Alternate Chair Hon‘ble Minister
(planning) for projects, schemes and
prorames costing Rs 50 crore and above;
(ii) High Level Monitoring and
Surveillance Committee II under the
Chairmanship of the Chief Secretary for
projects, schemes and programmes below
Rs 50 crore. Monitoring and Surveillance
Committee to undertake monthly review
and monitor implementation progress under
the Chairmanship of Planning Secretary
with experts members drawing from
various Departments.
Approach to Developing
Comprehensive Growth Strategies for
Mizoram also includes broad guidelines for
development projects, preparation and
selection to ensure quality, size, and impact
on economy, better outcomes and
sustainability of projects.
Moreover, another important
component of ―Approach to Developing
Comprehensive Growth Stategies for
Mizoram‖ will bring about ‗data
revolution‘ in the State with an aim to
ensure production of reliable data and
accurate statistics to help Government track
progress, to make sure that policy decisions
are informed and evidence based, and also
to strengthen accountability. In this regard,
the Government (Economics and Statistics
Department) is currently working on to
develop data submission, data quality and
data dissemination standards for the State.
Restructuring of Planning
Department: To support the new ‗planning‘
and ‗monitoring‘ process adopted by the
State Government, Research and
Development Branch of the Planning and
Programme Implementation Department
has been appropriately reconstructed into
four divisions: (i) Research and Analysis
Division (the Division will provide
secretarial assistance to Sectoral
Surveillance); (ii) Project Monitoring
Division (the Division will provide
secretarial assistance to High Level
Monitoring and Surveillance Committee I
and II as well as Monitoring and
Surveillance Committee); and (iv)
Establishment and Coordination Division.

vi
Economic Survey Mizoram 2014-15
…….
Major Recommendation of Fourteenth Finance Commission (FFC)
FFC radically enhanced the share of the states in the central divisible pool from the current 32 percent (Thirteenth Finance Commission/ TFC) to 42 percent. FFC has applied a new horizontal formula for determining states’ share with changes both in the variables included/excluded as well as the weights assigned to them: (i) Population – 1971 with weight 17.5%; (ii) Population – 2011 with weight 10%; (iii) Fiscal Capacity / Income Distance with weight 50%; (iv) Area with weights 15%; Forest Cover with weight 7.5%. Mizoram inter-se share of taxes increased from 0.269% in TFC to 0.460% in FFC. Accordingly, Mizoram share in services tax also increased to 0.464% in FFC from 0.273% in TFC. Professional tax ceiling raised to Rs 12000 per annum from the exisiting Rs 2500. Grants for Urban Local Bodies only (excluding other local bodies) and State Disaster Response Fund provided. Grants in Aid for Revenue Deficit for Mizoram estimated at Rs 12183 crore during the award period (2015-2020). All states stand to gain from FFC transfer in absolute terms. Union Economic Survey estimated that the biggest gainers in absolute terms are Uttar Pradesh, West Bengal and Madhya Pradesh among General Category States while for Special Category States it is Jammu & Kashmir, Himachal Pradesh and Assam. However, in terms of per capita transfer the major gainers in General Category States are Kerala, Chhattishgarh and Madhya Pradesh while it is Arunachal Pradesh, Mizoram and Sikkim for Special Category States.
Centrally Sponsored Schemes (CSS) The Union Budget 2015-16 delinked 8 CSS from support of the Centre, 31 schemes will now be fully sponsored by Union Government and 24 will be run with changed sharing pattern. Delinked Schemes: (i) NEGAP; (ii) BRGF; (iii) Modernisation of Police Forces; (iv) RGPSA; (v) Export Infrastructure; (vi) 6000 model schools; (vii) National Mission on Food processing; and (viii) Tourist Infrastructure Fully Sponsored: (1) MGNREGA; (2) MSDP; (3) Scholarship schemes (SC,ST, OBC); (4) Pre-Matric Scho for children of unclean occupation; (5) Machinery for PCRA and PAA; (6) Programme for Person with Disabilities; (7) Education for Minorities; (8) Umbrella Schemes for education of ST children; (9) IGMSY; (10) ICPS; (11) RGSEAG-SABLA; (12) National Nutrition Mission; (13) Schems for Protection and Development of Women; (14) Proviso I to article 275 (1); (15) Tribal Sub-Plan; (16) SSA (education cess); (17) Mid Day Meal; (18) NEC; (19) Bodoland Council; (20) NSAP; (21) NLCPR; (22) Unorganised Worker Scheme; (23) Teacher Training and Adult Education; (24) NADP; (25) MPLADS; (26) PMGSY; (27) Road and Bridges from Central Road Fund; (28) Project Tiger; (29) Project Elephant; (30) EAP (loan); (31) EAP (grant) Changed Sharing: (1) Cattle Development; (2) MIDH; (3) RKVY; (4) NLM; (5) NMSA; (6) DVA; (7) Veterinary Services and Animal Health; (8) National Rural Drinking Water Programme; (9) Swatch Bharat Abhiyan; (10) NAP; (11) NPCA; (12) AIDS and STD Control; (13) NHM; (14) NULM; (15) RMSA; (16) RUSA; (17) Infrastructure Facilities for Judiciary; (18) NLRMP; (19) NRLM; (20) Rural Housing for All; (21) ICDS; (22) RGKA; (23)PMKSY; (24) Impact assessment studies of AIBFMP.

vii
Economic Survey Mizoram 2014-15
B. ACRONYMS
AAY = Antyodaya Anna Yojana
ACA = Additional Central Assistance
ADA = Aizawl Development Authority
ADB = Asian Development Bank AIBP = Accelerated Irrigation Benefit Programme
AMC = Aizawl Municipal Council APDRP = Accelerated Power Development and Reform Programme APEDA = Agricultural and Processed Food Products and Export Development Authority
ASHA = Accredited Social Health Activists
ASPA = Advanced Special Plan Assistance AT& C = Average, Technical & Commercial Loss
ATI = Administrative Training Institute ATMA = Agriculture Technology Management Agency AYUSH= Ayurveda, Yoga, Naturopathy, Unani, Siddha and Homoepathy BADP = Border Area Development Programme BAFFACOS = Bamboo Flowering and Famine Combat Scheme
BOB= Bank of Baroda
BPL = Below Poverty Line
BPO=Branch Post Office
BRGF = Backward Region Grand Fund
BRO = Border Roads Organisation
BSUP = Basic Service to the Urban Poor
CAT= Computer Aided Teaching
CCA= Culturable Command Area CDCU = Chhimtuipui District Cooperative Union
CPU = Central Processing Unit
CRSP= Central Rural Sanitation Programme
CSO = Central Statistics Organisation CSS= Centrally Sponsored Scheme CWSN=Children with Special Needs
CTE = College of Teacher Education
DDA = Delhi Development Authority
DONER = Development of North East Region
DOTs= Directly Observed Treatment strategy DVOR = Doppler Very High Frequency Omni Directional Range
EAP = Externally Aided Project
EPI = Expanded Programme of Immunization
EBB = Educationally Backward Block
EPIP = Export Promotion Industrial Park ERCM = Education Reforms Commission, Mizoram.
EWS= Economically Weaker Section
FC = Fully Covered
FFDA = Fish Farmer Development Agency
FSI = Forest Survey of India
GBS= Gross Budgetary Support
GER=Gross Enrolment Ratio
GCA= Gross Command Area
GER = Gross Enrolment Ratio
GSDP = Gross State Domestic Product
HFO= Heavy Furnace Oil
HiWEL= Hole-in-the-Wall Education Limited
HiWEL= Hle-in-the-Wall Education Limited HMNEH= Horiculture Mission for North East & Himalayan Region
HPO= Head Post Office
HPTW= Hand Pumped Tube Well ICT = Information and Communication Technology
ICMR= Indian Council of Medical Research IDSP= Integrated Disease Surveillance Project
ICDS= Integrated Child Development Services
ICPS= Integrated Child Protection Scheme IEC= Information, Education and Communication IGNOAP= Indira Gandhi National Old Age Pension
IHL = Individual Household Latrines IHSDP = Integrated Housing and Slum Development Programme
IIPA = Indian Institute of Public Administration
ILS= Instrumental Landing System
IPC= Irrigation Potential Created
IREP = Integrated Rural Electric Programme
IUD = Intra - Uterine Devices IWDP = Integrated Wasteland Development Programme IWMP= Integrated Watershed Management Programme
JFM = Joint Forest Management JNNURM = Jawaharlal Nehru National Urban Renewal Mission
KGBV = Kashturba Gandhi Balika Vidhyalaya
LDCU = Lunglei District Cooperative Union
LIG = Low Income Group
lpcd = litres per capita per day MAHCO = Mizoram Apex Handloom & Handicraft Co-operative Society Ltd. MAHFED = Mizoram State Agriculture/Horticulture & Marketing
viii
Economic Survey Mizoram 2014-15
Cooperative Federation
MASCOS= Mizoram Apex Sericulture Cooperative Society Ltd.
MDM = Mid-Day Meal
MCS= Model Cluster Schools
MDM = Mid-Day Meal
MFF= Multi-tranche Financing Failities
MHTC = Mizoram Hindi Training College MIZOFED = Mizoram State Co-Operative Marketing & Consumers Federation Ltd.
MCAB = Mizoram Cooperative Apex Bank Ltd.
MKWH =Million Kilo Watt Hour MNRE = Ministry of New and Renewable Energy
MPL = Mizoram Polytechnic, Lunglei MGNREGS = Mahatma Gandhi National Rural Employment Guarantee Scheme
MSCU = Mizoram State Co-operative Union
MSHCS=Mizoram State Health Care Scheme
MDG= Mukhya Dak Ghar
MU = Million Unit MUCO Bank= Mizoram Urban Cooperative Development Bank Ltd. MULCO = Mizoram Multi-commodity Producers Co-operative Union Ltd.
MW = Mega Watt
MZU = Mizoram University NABARD = National Bank for Agriculture and Rural Development
NC = Non-Covered
NCC= National Cadet Corps
NCSE = Non Conventional Source of Energy
NEC = North Eastern Council NEDFi = North Eastern Financial Development Corporation NEEPCO = North Eastern Electric Power Corporation
NeGAP = National E-Governance Action Plan NERUDP = North East Region Urban Development Project NERCCDIP= North Eastern Region Capital Cities Development Investment Programme
NHPC = National Hydro Power Corporation NIELIT = National Institute for Electronics and Information Technology NLCPR = Non Lapsable Central Pool of Resources NLEP = National Leprosy Eradication Programme NPAG = Nutrition Programme for Adolescent Girls NPCBB= National Project on Cattle And Buffalo Breeding
NPEGEL = National Programme for Education of Girls at Elementary Level NRDWP = National Rural Drinking Water Programme NREGS = National Rural Employment Guaranteed Scheme
NRHM = National Rural Health Mission
NSDP = Net State Domestic Product
NSS = National Services Schemes NSSO = National Sample Survey Organisation NVBDCP= National Vector Borne Diseases Control Programme
PAC = Potential Area Connectivity
PACS = Primary Agricultural Credit Societies
PC = Partially Covered PIGFED = Mizoram Pig Producer Co-operative Federation Ltd. PMGSY = Pradhan Mantri Gram Sadak Yojana
PPP = Public Private Partnership
PRS = Public Reservation System PYKKA= Panchayat Yuva Krida Aur Khel Abhiyan
RBD = Registration of Birth and Death
RCH= Reproductive and Child Health
RE = Revised Estimates
REC = Rural Electrification Corporation RGGVY = Rajiv Gandhi Grameen Vidyutikaran Yojana
RGSY= Rashtriya Gram Swaraj Yojana RMIS = Rationalisation of Minor Irrigation Stastistics RMSA= Rashtriya Madhyamik Shiksha Abhiyan RNTCP= Revised National TB Control Programme
RKVY= Rashtriya Krishi Vikas Yojana
RSBY = Rashtriya Swasthya Bima Yojana
RSVY = Rashtriya Sam Vikas Yojana
RWHS=Rural Water Harvesting Schemes
SAL = Structural Adjustment Loan SARDP-NE = Special Accelerated Road Development Programme for North East
SCA = Special Central Assistance
SGRY = Sampoorna Gramin Rozgar Yojana SGSY = Swarnajayanti Gram Swarozgar Yojana SJSRY= Swarna Jayanti Shahri Rozgar Yojana SIPMIU = State Investment Programme Management and Implementation Unit
SIRD = State Institute of Rural Development

ix
Economic Survey Mizoram 2014-15
SIDBI= Small Industrial Development Bank of India SLMC & IAC = State Level Monitoring Cell & Internal Audit Cell
SMS = State Matching Share
SPA = Special Plan Assistance
SPO = Sub-Post Office
SSA = Sarva Shiksha Abhiyan STEP-UP= Skill Training for Promotion amoung Urban Poor
TPR = Teacher-Pupil Ratio
TSC = Total Sanitation Campaign TSECL = Tripura State Electricity Corporation Ltd.
TSP = Tribal Sub Plan UCDN= Urban Community Development Network UIDSSMT = Urban Infrastructure Development Scheme for Small and Medium Town
UIG = Urban Infrastructure and Governance
ULBs = Urban Local Bodies
UPS = Upper Primary School/Uninterruptible Power Supply
USEP= Urban Self-Employment Programme UWEP= Urban Wage Employment Programme
UWSP = Urban Women Self-help Programme
VAT = Value Added Tax VHSC = Village Health & Sanitation Committee WAPCOS = Water and Power Consultancy Services Ltd. WDPSCA = Watershed Development Programme in Shifting Cultivation Areas WOMENFD = Mizoram Women Cooperative Federation
WPA = Women Polytechnic Aizawl
WSS = Water Supply Scheme
YHAI = Youth Hostel Association of India
ZEDA = Zoram Energy Development Agency ZOFISHFED = Mizoram Cooperative Fish Farming Marketing & Processing Federation
….
Economic Survey Mizoram 2014-15 ~ 1 ~ An Overview of Indian Economy
Economic Survey Mizoram 2014-15
I. OVERVIEW OF INDIAN ECONOMY
Indian economy has emerged
strongly as global growth driver as
compared with economic performance
across different countries for the year
2014-15 amidst the mood of pessimism
and uncertainties that engulf a number of
advanced and emerging economies.
Brighter prospects in India owe
mainly to the fact that the economy stands
largely relieved of the vulnerabilities
associated with an economic slowdown,
persistent inflation, elevated fiscal deficit,
slackening domestic demand, external
account imbalances, and oscillating value
of the rupee in 2011-12 and 2012-13.
From the macroeconomic perspective, the
worst is clearly behind us.
The latest indicators, emerging
from the recently revised estimates of
national income brought out by the Central
Statistics Office, point to the fact that the
revival of growth had started in 2013-14
and attained further vigor in 2014-15.
Even international institutions like the IMF
and the World Bank have presented an
optimistic growth outlook for India for the
year 2015 and beyond. The possible
headwinds to such promising prospects,
however, emanate from factors like
inadequate support from the global
economy saddled with subdued demand
conditions, particularly in Europe and
Japan, recent slowdown in China, and, on
the domestic front, from possible
spillovers of below normal agricultural
growth and challenges relating to the
massive requirements of skill creation and
infrastructural upgradation.
The Ministry of Statistics &
Programme Implementation has released
the new series of national accounts,
revising the base year from 2004-05 to
2011-12. The base year of national
accounts was last revised in January 2010.
Gross Domestic Product
GDP for the base year 2011-12 is
estimated as Rs. 88.3 lakh crore. Nominal
GDP or GDP at current prices for the year
2012-13 is estimated as Rs. 99.9 lakh crore
while that for the year 2013-14 is
estimated as Rs. 113.5 lakh crore,
exhibiting a growth of 13.1 percent and
13.6 percent during the years 2012-13 and
2013-14 respectively. GDP at current
prices in the year 2014-15 is likely to
attain a level of Rs.126.54 lakh crore,
showing a growth rate of 11.5 per cent
over the year 2013-14 of Rs.113.45 lakh
crore (First revised estimate with the
growth rate of 13.6 percent).
Real GDP or GDP at constant
(2011-12) prices stands at Rs.92.8 lakh
crore and Rs.99.2 lakh crore, respectively
for the years 2012-13 and 2013-14,
showing growth of 5.1 percent during
2012-13, and 6.9 percent during 2013-14.
Real GDP or Gross Domestic Product
(GDP) at constant (2011-12) prices in the
year 2014-15 is likely to attain a level of
Rs.106.57 lakh crore, as against the First
Revised Estimate of GDP for the year
2013-14 of Rs.99.21 lakh crore, released
on 30th
January 2015. The growth in GDP
during 2014-15 is estimated at 7.4 per cent
as compared to the growth rate of 6.9 per
cent in 2013-14.
Gross Value Added (GVA) at Basic Prices
Real GVA, i.e., GVA at basic
constant prices (2011-12) is anticipated to
increase from Rs. 91.70 lakh crore in
2013-14 to Rs.98.58 lakh crore in 2014-15.
Anticipated growth of real GVA at basic
prices in 2014-15 is 7.5 percent against
growth of 6.6 percent in 2013-14.
The sectors which registered
growth rate of over 7.0 percent are,
Economic Survey Mizoram 2014-15 ~ 2 ~ An Overview of Indian Economy
Economic Survey Mizoram 2014-15
'financial, real estate and professional
services', ‗trade, hotels, transport,
communication and services related to
broadcasting‘, 'public administration,
defence and other services‘, and
‗electricity, gas, water supply & other
utility services. The growth in the
‗agriculture, forestry and fishing‘, ‗mining
and quarrying‘, ‗construction‘ and
‗manufacturing‘ is estimated to be 1.1 per
cent, 2.3 per cent, 4.5 per cent and 6.8
percent respectively.
Agriculture
The ‗agriculture, forestry and
fishing‘ sector is likely to show a growth
of 1.1 per cent in its GVA during 2014-15,
as against the previous year‘s growth rate
of 3.7 per cent. According to the
information furnished by the Department
of Agriculture and Cooperation (DAC),
which has been used in compiling the
estimate of GDP from agriculture in 2014-
15, production of foodgrains is expected to
decline by 2.9 per cent as compared to
increase of 3.0 per cent in the previous
agriculture year. Production of pulses and
oilseeds is also expected to decline by 3.4
and 9.6 per cent respectively as compared
to increase of 5.0 and 6.3 per cent in the
previous agriculture year. However,
among the horticultural crops, production
of fruits and vegetables is expected to
increase by 1.1 per cent during the year
2014-15 as compared to increase of 3.5
percent in previous agriculture year.
Industry
The estimated growth in the
‗manufacturing‘ ‗mining and quarrying‘,
‗electricity, gas and water supply‘, and
‗construction‘ is estimated to be 6.8 per
cent, 2.3 per cent, 9.6 percent and 4.5 per
cent, respectively, during 2014-15 as
compared to growth of 5.3 percent, 5.4 per
cent, 4.8 per cent and 2.5 per cent,
respectively, in 2013-14.
Services
The estimated growth in GVA for
the trade, hotels, transport and
communication and services related to
broadcasting services during 2014-15 is
placed at 8.4 per cent as against growth of
11.1 percent in the previous year. This is
mainly on account of decline of 5.7 per
cent in the sales of commercial vehicles
and reduced rate of increase in sales tax
collection at 13.9 percent during April-
December 2014 as compared to 19 percent
in 2013-14. The sector, 'financial, real
estate and professional services', is
expected to show a growth rate of 13.7 per
cent during 2014-15 as compared to
growth rate of 7.9 per cent in 2013-14.
There was 11.5 per cent growth in
aggregate deposits and 10.5 per cent
growth in bank credit as on December
2014 as compared to 15.9 percent and 14.5
percent respectively as on December 2013.
Also, private corporate sector registered
growth of 32 percent in the real estate and
professional services during April – Dec,
2014-15.
Per Capita Income
The per capita income in real terms
(at 2011-12 prices) during 2014-15 is
likely to attain a level of `74,193 as
compared to `69,959 for the year 2013-14.
The growth rate in per capita income is
estimated at 6.1 per cent during 2014-15,
as against the previous year's estimate of
5.4 per cent.
The per capita net national income
at current prices during 2014-15 is
estimated to be `88,533 showing a rise of
10.1 per cent as compared to `80,388
during 2013-14 with the growth rate of
12.3 percent. …….

Economic Survey Mizoram 2014-15 ~ 3 ~ State Economy
Economic Survey Mizoram 2014-15
II. OVERVIEW OF MIZORAM ECONOMY
Economic Growth
The Gross State Domestic Product
(GSDP) of Mizoram has been
continuously growing over the years with
impressive rate. Gross State Domestic
Product (GSDP) at factor cost at constant
(2004-2005) prices is expected to attain an
amount of Rs. 560779/- lakhs in 2013-
2014 against the provisional estimates of
Rs. 520289/- lakhs for the year 2012-2013
showing a growth of about 8% over the
previous year. The GSDP at constant
(2004-2005) prices has clocked 9%
average annual growth rate during the
financial years 2004-2005 to 2013-2014.
GSDP at Factor Cost by Economic Activity : Mizoram
(At constant 2004-2005 prices) : Rs in Lakhs
Sl.
No INDUSTRY 2010-2011 2011-2012
2012-2013
(Provisional
Estimates)
2013-2014
(Projected
Estimates)
1 2 3 4 5 6
1 Agriculture, Forestry
& Fishing 104474 101221 101257 101332
2 Mining & Quarrying 1287 1694 1133 758
3 Manufacturing 5381 7170 8242 9741
4 Electricity, Gas &
Water Supply 15632 14585 16564 18812
5 Construction 59567 60342 59618 58903
6
Trade, Hotels,
Transport &
Communication 56556 54847 58874 63253
7
Financing, Insurance,
Real Estate &
Business Service 77222 85029 91018 97598
8 Community, Social &
Personal Services 177813 160318 183583 210382
GSDP at Factor Cost 497932 485206 520289 560779
0
100000
200000
300000
400000
500000
600000
2007-2008 2008-2009 2009-2010 2010-2011 2011-2012 2012-2013 2013-2014
333621
378137424896
497932 485206 520289560779
GSDP AT CONSTANT PRICE
Economic Survey Mizoram 2014-15 ~ 4 ~ State Economy
Economic Survey Mizoram 2014-15
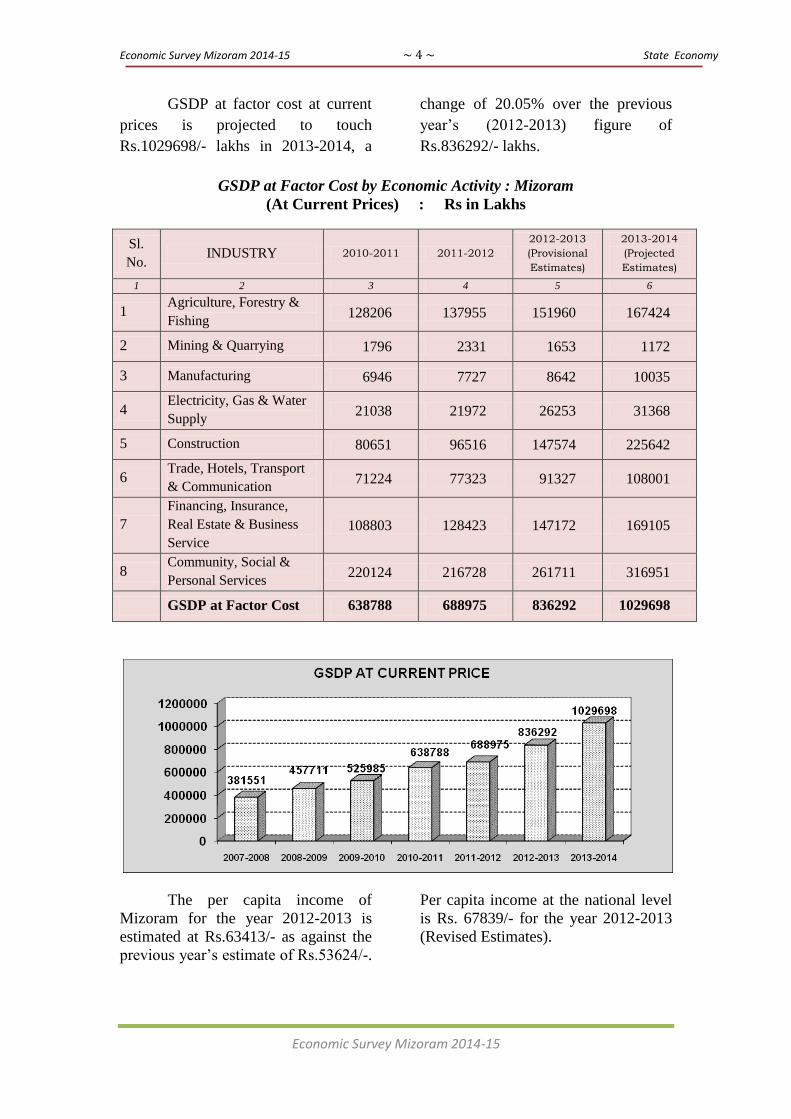
GSDP at factor cost at current
prices is projected to touch
Rs.1029698/- lakhs in 2013-2014, a
change of 20.05% over the previous
year‘s (2012-2013) figure of
Rs.836292/- lakhs.
GSDP at Factor Cost by Economic Activity : Mizoram
(At Current Prices) : Rs in Lakhs
Sl.
No. INDUSTRY 2010-2011 2011-2012
2012-2013
(Provisional
Estimates)
2013-2014
(Projected
Estimates)
1 2 3 4 5 6
1 Agriculture, Forestry &
Fishing 128206 137955 151960 167424
2 Mining & Quarrying 1796 2331 1653 1172
3 Manufacturing 6946 7727 8642 10035
4 Electricity, Gas & Water
Supply 21038 21972 26253 31368
5 Construction 80651 96516 147574 225642
6 Trade, Hotels, Transport
& Communication 71224 77323 91327 108001
7
Financing, Insurance,
Real Estate & Business
Service
108803 128423 147172 169105
8 Community, Social &
Personal Services 220124 216728 261711 316951
GSDP at Factor Cost 638788 688975 836292 1029698
The per capita income of
Mizoram for the year 2012-2013 is
estimated at Rs.63413/- as against the
previous year‘s estimate of Rs.53624/-.
Per capita income at the national level
is Rs. 67839/- for the year 2012-2013
(Revised Estimates).

Economic Survey Mizoram 2014-15 ~ 5 ~ State Economy
Economic Survey Mizoram 2014-15
Per Capita Income
Year Per Capita Income
(in Rs.)
2008-2009 38582
2009-2010 42715
2010-2011 50956
2011-2012 53624
2012-2013(P) 63413
2013-2014(Pr) 76120
P= Provisional Estimate, Pr= Projected Estimate
Sectoral Performance of the Economy:
The following table illustrates
performance of the different sectors in the
economy of Mizoram. The remarkable
contribution of the tertiary or service
sector constituting a share of about 58% of
the total GDP clearly indicates that this
sector drives the economy of Mizoram.
The industry sector contributed 26% while
the agriculture & allied sector contributed
16% to the GSDP.
Sectoral Share to GSDP (2013-2014) Projected Figure
Sl.No Sector Percentage
share to GSDP
1 Agriculture (Animal & Crop Husbandry) 12.01
2 Forestry 3.59
3 Fishing 0.66
4 Mining & Quarrying 0.11
5 Manufacturing (regd. & unregd.) 0.97
6 Construction 21.91
7 Electricity, Gas & Water Supply 3.05
8 Transport, Storage & Communication 2.43
9 Trade, Hotel & Restaurant 8.06
10 Banking & Insurance 1.88
11 Real Estate & Business Services 14.55
12 Public Administration 19.06
13 Other Services 11.72
32488 38582 42715 5095653624 63413
7612035825 40775 46249
54021 64316 71593 80388
0
100000
200000
2007-2008 2008-2009 2009-2010 2010-2011 2011-2012 2012-2013 2013-2014
Per capita income Mizoram All India

Economic Survey Mizoram 2014-15 ~ 6 ~ State Economy
Economic Survey Mizoram 2014-15
Agriculture & Allied Sector:
The Primary Sector comprising
agriculture & allied activities contributed
16.26% (2013-2014) to the GSDP. With
more than half of our population deriving
the greater part of their income from
agriculture, faster growth in agriculture is
necessary to provide boost to their income.
Rising incomes in agriculture will also be
an impetus to non-agricultural income in
rural areas thus helping redress the rural-
urban imbalance. Recently horticulture and
floriculture has gained momentum and
shown marked improvement in their
production.
Industry Sector:
The Industry Sector which
comprises of (i) Mining & Quarrying, (ii)
Manufacturing, (iii) Construction and
(iv) Electricity, Gas and Water Supply
contributed Rs. 268217/- lakhs during
2013-2014. Its percentage share to GSDP
being 26.05%. The main determinant of
this sector being Construction Sector
again. It alone contributed 21.91% to the
GSDP in 2013-2014.
Service Sector (Tertiary Sector):
The Service Sector comprising (i)
Transport, Storage & Communication, (ii)
Trade, Hotels & Restaurants, (iii) Banking
& Insurance, (iv) Real Estate, Business
Services etc, (v) Public Administration and
(vi) Other Services continues to have the
highest contribution to the GSDP, its share
has been hovering between 57% to 63%
during the past 5 years.
16.26%
26.05%
57.69%
Sectoral Share in GSDP
Agri. & Allied Industry Service

Economic Survey Mizoram 2014-15 ~ 7 ~ State Economy
Economic Survey Mizoram 2014-15
Sectoral Contribution to GSDP (Base Year 2004-2005)
Year
Agriculture & Allied
Sector Industry Sector Service Sector
Current
Price
Constant
(2004-05)
Price
Current
Price
Constant
(2004-05)
Price
Current
Price
Constant
(2004-05)
Price
2004 -2005 63025 63025 44529 44529 160643 160643
2005 -2006 64787 64053 59783 57197 172545 165692
2006 -2007 68565 64227 64208 57826 196225 178534
2007- 2008 80109 73258 76345 65327 225097 195036
2008-2009 94065 82198 95201 76289 268445 219650
2009-2010 107836 89737 102729 78817 315420 256342
2010-2011 128206 104474 110431 81867 400151 311591
2011-2012 137955 101221 128546 83791 422474 300194
2012-2013(P) 151960 101257 184122 85557 500210 333475
2013-2014(Pr) 167424 101332 268217 88213 594057 371233
Sectoral Share in Percentage (Base year 2004-2005)
Year
Agriculture & Allied
Sector Industry Sector Service Sector
Current
Price
Constant
(2004-05)
Price
Current
Price
Constant
(2004-05)
Price
Current
Price
Constant
(2004-05)
Price
2004 -2005 23.50 23.50 16.60 16.60 59.90 59.90
2005 -2006 21.81 22.32 20.12 19.94 58.07 57.74
2006 -2007 20.84 21.37 19.52 19.24 59.64 59.39
2007 -2008 21.00 21.96 20.01 19.58 58.99 58.46
2008-2009 20.55 21.74 20.80 20.17 58.65 58.09
2009-2010 20.50 21.12 19.53 18.55 59.97 60.33
2010-2011 20.07 20.98 17.29 16.44 62.64 62.58
2011-2012 20.02 20.86 18.66 17.27 61.32 61.87
2012-2013(P) 18.17 19.46 22.02 16.44 59.81 64.09
2013-2014(Pr) 16.26 18.07 26.05 15.73 57.69 66.20
…..

Economic Survey Mizoram 2014-15 ~ 8 ~ State Finance
Economic Survey Mizoram 2014-15
III. STATE FINANCE
I. Fiscal Position
The State Government is virtually
depending on the Central Government, as
such the State‘s fiscal health depends
largely on the terms of devolution of
resources from the Central Government as
recommended by the successive Finance
Commission from time to time. At the
same time, the revenue and expenditure
policy of the State Government also have
substantial impact on the fiscal position of
the State government, especially the
expenditure policy.
Government of Mizoram devises its
fiscal policy and guiding principle in line
with the Thirteenth Finance Commission‘s
recommendation as well as Planning
Commission‘s instructions. The Twelfth
Finance Commission recommended the
enactment of the Fiscal Responsibility and
Budget Management Act (FRBM Act) for
the Union and the State Governments as a
part of an effort to reform and to
consolidate the respective financial
conditions laid down by it in the Twelfth
Finance Commission. The Thirteenth
Finance Commission reinforces this
recommendation by offering incentives on
compliance. Even Mizoram Government
has also been implementing and updating
its own FRBM Act so as to achieve and
align with the Thirteenth Finance
Commission‘s recommendation for the
State. The Thirteenth Finance Commission
recommended that Govt. of Mizoram will
have to maintain Revenue Surplus from the
fiscal 2011-12, gradually reduce its fiscal
deficit to 5.2 per cent in 2012-13, 4.1 per
cent in 2013-14 and ultimately to 3 per cent
of its GSDP by 2014-15 and limit
outstanding liabilities at 82.9 per cent of
GSDP in 2012-13, 79.2 per cent in 2013-14
and eventually at 74.8 per cent of
corresponding GSDP by 2014-15.
As per the FRBM Act, the fiscal
deficit has to be brought down to 3 per cent
of GSDP by 2014-15. The fiscal correction
path that was drawn up by the Government
of Mizoram in 2006-07 and revised and
redrawn annually indicates that the
Government could not follow its own
correction path due to various reasons. The
fiscal deficit, which has been measured as a
percentage of the GSDP series adopted by
the FC-XIII, stood at 15.96 per cent in
2010-11, the same stood at 6.84 per cent in
2011-12, at 7.21 per cent in 2012-13 and at
8.43 per cent in 2013-14.As per Budget
Estimates of 2014-15, the fiscal deficit
would be 5.98 per cent of the GSDP, which
is higher than the target fixed by the
Thirteenth Finance Commission. The
reasons for not conforming with the
projected fiscal correction paths may
include the under estimation of the NPRD
grant by the Thirteenth Finance
Commission, expenditure on account of
food subsidies and selling the same at a
subsidized rate to the general public, high
cost of power purchase and and many other
items of revenue expenditure.
Bulging Non Plan Revenue
Expenditure is a major challenge of the
State Government. Main reasons for
increase in NPRE are implementation of
Sixth Pay Commission Recommendation of
salary and pensions coupled with high cost
of Power purchase, interest payment, mass
subsidization of foodgrains, big policy
decisions involving huge expenditures and
ever increasing cost of administration.
Since 2014-15 is the terminal year
of the Thirteenth Finance Commission
period, various devolutions coming from
the Central Government would be tapering
off and hence the fiscal position would be
uncomfortable. However, it is expected that
the Fourteenth Finance Commission
recommendations would be in favour of the
State Governments thereby bridging
various gaps left behind by the Thirteenth
Finance Commission.

Economic Survey Mizoram 2014-15 ~ 9 ~ State Finance
Economic Survey Mizoram 2014-15
Major Fiscal Aggregates of the
Government of Mizoram for the last few
years is shown below.
Major Fiscal Aggregates
(Figures in crore of rupees)
Sl
No Items
2010-11 2011-12 2012-13 2013-14 2014-15
(Actuals) (Actuals) (Actuals) (Pre
Actuals) (BE)
1 2 3 4 5 6 7
1 Total Revenue Receipts 2855.37 3824.90 4536.74 4764.85 5879.47
(a) State's Own Tax Revenue 130.44 179.07 223.15 229.78 270.39
(b) State's Own Non-Tax Revenue 146.72 168.03 212.80 194.26 278.48
(c) Share in Central Taxes & Duties 451.66 827.38 785.96 858.08 1030.85
(d) Grants-in-aid from Centre 2126.55 2650.42 3314.83 3482.73 4299.75
(i) Plan Grants 1401.58 1853.18 2257.67 2341.12 3185.24
(ii) Non-Plan Grants 724.97 797.24 1057.16 1141.61 1114.51
2 Non-Plan Expenditure 2165.20 2446.96 2848.43 3234.49 3630.80
3 Plan Expenditure 1705.74 1850.64 2268.03 2281.89 3140.00
4 Total Expenditure 3870.94 4297.60 5116.46 5516.38 6770.80
5 Revenue Expenditure 3256.24 3697.33 4508.91 4916.98 5764.41
6 Capital Expenditure 614.70 600.27 607.55 599.40 714.28
7 Loans and Advance Expenditure (29.87) (33.52) (30.25) (30.71) (27.45)
8 Transfer to Contingency Fund - -
9 Revenue Surplus/Deficit -400.87 127.57 27.83 -152.13 115.06
10 Gross Fiscal Deficit (GFD) -1019.48 -478.42 -580.49 -749.13 -586.67
11 Percentage of GFD to GSDP 15.96 6.84 7.21 8.43 5.98
12 GSDP 6387.88 6991.40 8053.00 8886.00 9805.00
For calculation of GFD as a
percentage to GSDP, the latest approved
series of GSDP estimates based on the
recommendation of the Ministry of Finance,
GOI are used. All other data are being taken
from the Finance Account and hence some
figures would be different from Economic
Survey 2013-14.
II. Review of Fiscal Position for 2013-
14
Even though the Finance Accounts
2013-14 has not officially been published,
the pre-actual figures taken for analyzing the
fiscal position of Mizoram during the
financial year 2013-14 are expected to be
more or less in conformity with the Finance
Account 2013-14. As can be seen from the
Table above, the fiscal deficit as a
percentage of GSDP was 8.43 which is way
above the 4.1 per cent norm set by the
Thirteen Finance Commission for the year
2013-14. This overshoot may be attributable
to the inevitable budgetary borrowing
resorted to by the State Government due to
various reasons cited in paragraph 3 and 4
above. However, an improvement can be
seen on the receipt side. The State Own Tax
Revenue (SOTR) in 2013-14 stood at Rs.
229.78 crore whereas the collection under
the same Head during 2012-13 was Rs.
223.15 crore. At the same time, devolution
of Central Taxes & Duties also increased
from Rs. 785.96 crore in 2012-13 to Rs.
858.08 crore in 2013-14. The State Own
Non-Tax Revenue (SONTR), however,
declined to Rs. 194.26 crore from the
Economic Survey Mizoram 2014-15 ~ 10 ~ State Finance
Economic Survey Mizoram 2014-15
previous year collection of Rs. 212.80 crore.
The total Revenue Receipt during 2013-14
was Rs.4767.85 crore.
On the Expenditure side, the Non-
Plan Revenue expenditure was Rs. 3234.49
crore whereas the Plan Revenue Expenditure
was Rs. 2281.89 crore. In other words, the
total Revenue Expenditure was Rs. 4916.98
crore whereas the Capital Expenditure was
Rs. 599.40 crore only, which signified that
huge amount of Capital Receipt was being
utilized for Revenue Expenditure. The total
Revenue Expenditure was being more than
the Total Revenue Receipt by Rs. (-)149.13
crore. It means that the State Government
was running on a revenue deficit. In spite of
improvement in the revenue fronts, the state
economy was unable to contain the surging
fiscal deficit. Ever increasing requirements
of administrative expenses and development
initiatives necessitate the State Government
to resort to borrowings thereby committing
more liabilities. Hence in order to cope with
the surging Non Plan Revenue Expenditure
the State Government needs to adopt severe
austerity measures coupled with overhauling
of the Tax and Non Tax administration to
earn more revenues. At the same time, the
main resources of the State Government
being devolution of Grants and resources
from the Central Government, the State
Government cannot but rely heavily on the
Central Government.
III. Fiscal Position for 2014-15:
Revenue Account
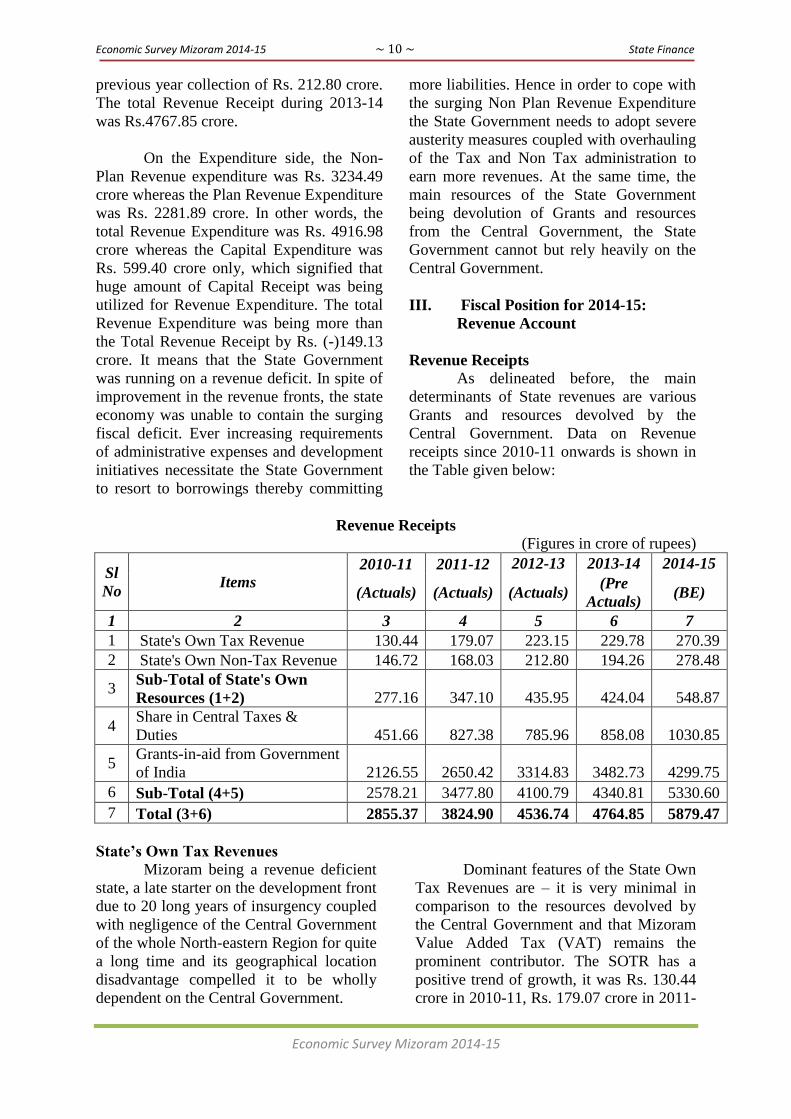
Revenue Receipts
As delineated before, the main
determinants of State revenues are various
Grants and resources devolved by the
Central Government. Data on Revenue
receipts since 2010-11 onwards is shown in
the Table given below:
Revenue Receipts
(Figures in crore of rupees)
Sl
No Items
2010-11 2011-12 2012-13 2013-14 2014-15
(Actuals) (Actuals) (Actuals) (Pre
Actuals) (BE)
1 2 3 4 5 6 7
1 State's Own Tax Revenue 130.44 179.07 223.15 229.78 270.39
2 State's Own Non-Tax Revenue 146.72 168.03 212.80 194.26 278.48
3 Sub-Total of State's Own
Resources (1+2) 277.16 347.10 435.95 424.04 548.87
4 Share in Central Taxes &
Duties 451.66 827.38 785.96 858.08 1030.85
5 Grants-in-aid from Government
of India 2126.55 2650.42 3314.83 3482.73 4299.75
6 Sub-Total (4+5) 2578.21 3477.80 4100.79 4340.81 5330.60
7 Total (3+6) 2855.37 3824.90 4536.74 4764.85 5879.47
State‟s Own Tax Revenues
Mizoram being a revenue deficient
state, a late starter on the development front
due to 20 long years of insurgency coupled
with negligence of the Central Government
of the whole North-eastern Region for quite
a long time and its geographical location
disadvantage compelled it to be wholly
dependent on the Central Government.
Dominant features of the State Own
Tax Revenues are – it is very minimal in
comparison to the resources devolved by
the Central Government and that Mizoram
Value Added Tax (VAT) remains the
prominent contributor. The SOTR has a
positive trend of growth, it was Rs. 130.44
crore in 2010-11, Rs. 179.07 crore in 2011-
Economic Survey Mizoram 2014-15 ~ 11 ~ State Finance
Economic Survey Mizoram 2014-15
12, Rs. 223.15 crore in 2012-13 and
Rs.229.78 crore. It is expected that
collection during 2014-15 would be
maintained more or less at the same size as
was realized in 2013-14 even though the
Budget Estimate was Rs. 270.39 crore.
A scrutiny of the available data
shows that SOTR collection has grown at
about 37.35 % during the period 2010-11
and 2011-12. The growth rate decreased to
24.62 % during 2011-12 to 2012-13 and it
finally deteriorated to only 2.97 % during
2012-12 to 2013-14. It means that the
buoyancy of the SOTR is approaching its
saturation point. The introduction of VAT
has had an enormous effect on buoyancy of
the tax revenue. However, as was
elucidated above, it would be difficult to
sustain this growth with the passage of time
and gradually it is tending to reach a
plateau.
The State government needs to tap
more tax revenues by way of increasing the
tax bases as well as by revising the existing
tax rates without causing undue burden to
the general public.
States Own Non-Tax Revenues
Sources of State Own Non Tax
Revenues (SONTR) are mainly accrual of
interest on account of investment of cash
balance of the State in the Reserve Bank of
India, Contributions and Recoveries
towards Pension & Other Retirement
Benefits, Collection of User Charges on
Water Supply, Electricity Bill, tariff on
Government‘s Guest House, etc.
There has been a certain degree of
uncertainty in the collection of State‘s Own
Non-Tax Revenues (SONTR) unlike that of
the Tax Revenue. Existing user charges
need revision so as to realize more revenue;
however, such upward revision may not be
possible to be enforced without inciting
complaints from various stakeholders.
Being a small State in terms of
population and areas, collection of User
charges on various governments‘ services
are always marginal and used to fall below
expectation and estimation. It would be in
the best interest of the State Government if
at least the cost of Operation &
Maintenance can be realized from the
services provided to the general public.
Another important thing is that the
efficiency of collecting various government
revenues can be improved upon by
plugging loopholes which can be done by
way of outsourcing the collection and by
introducing on-line payment. The State
government is actively pursuing such
measures, especially regarding on-line
payment, which is convenient as well as
cost-effective.
Table above shows the trend of
SONTR collection during 2010-10 to 2014-
15(BE). As can be seen from the available
data, the SONTR has increased from
Rs.146.72 crore in 2010-11 to Rs. 168.03
crore in 2011-12, which further increased
to Rs.212.80 crore in 2012-13 and finally
declined to Rs. 194.26. Hence the trend
growth rate was erratic showing that
various Departments needed to put more
efforts in SONTR.
State‟s Share in Central Taxes
As per the recommendation of the
Thirteenth Finance Commission, the share
of States in the net proceeds of Union taxes
was fixed at 32 per cent. Out of this, the
share of Mizoram in inter-se distribution of
the State‘s share amongst the States is
0.269 per cent. Depending upon buoyancy
of the Central taxes, actual receipt of the
State in Central Taxes may be more or less
than the projection of the Commission.
Again, economic boom and recession as
well as the fiscal policy of the Central
Government play a vital role in
determination of the actual volume of
devolution.
The total devolution during 2014-15
was estimated at Rs. 1030.85 crore against
the release of Rs. 858.08 in 2013-14.
Tables above has depicted the actual

Economic Survey Mizoram 2014-15 ~ 12 ~ State Finance
Economic Survey Mizoram 2014-15
devolution during the four year period of
2010-11 to 2013-14 and the Budget
Estimates for 2014-15.
Grants-in-Aid from the Centre
Various Grants-in-Aids from the
Central Government is the biggest source
of revenue for the State Government.
Budget Estimates for Grants-in-aid from
Central Government for the year 2014-15 is
Rs.4299.75 crore.
Revenue Expenditure
The surging expenditure on revenue
account has been a serious issue of concern
in the State finance. This has resulted in
deterioration of resources for capital
investments. Thanks to the previous fiscal
reforms measures and the increase in
devolution of resources from the Centre,
the State attained a revenue surplus since
2003-04 till 2009-10. The State
Government, however, could not maintain
this trend in 2010-11 by committing a
revenue deficit of Rs.400.87 crore. There
was a revenue surplus of Rs.127.57 crore in
2011-12 and of Rs. 27.83 crore in 2012-13.
Again, there was a revenue deficit to the
tune of Rs. 152.13 crore in 2013-14. The
Budget estimate of Revenue surplus for the
year 2014-15 is Rs. 115.06 crore. The trend
in revenue expenditure for a 5 year period
is shown in Table below. It shows that
during 2010-11 and 2013-14, expenditures
on revenue accounts were more than
revenue receipts.
Revenue Expenditure
(Figures in crore of rupees)
Sl
No Items
2010-11 2011-12 2012-13 2013-14 2014-15
(Actuals) (Actuals
) (Actuals)
(Pre
Actuals) (BE)
1 2 3 4 5 6 7
1 Non-Plan Revenue Expenditure 2055.20 2381.23 2748.84 3120.13 3338.64
2 Plan Revenue Expenditure 1201.04 1316.10 1760.07 1796.85 2425.77
3 Total Revenue Expenditure
(1+2) 3256.24 3697.33 4508.91 4916.98 5764.41
4 Revenue Expenditure as a
percentage of Revenue Receipts 114.04 96.66 99.39 103.19 98.04
CAPITAL ACCOUNT
Capital Receipts
The capital receipts in the State‘s
finance are mainly in the form of receipts
on (a) recoveries of loans and advances and
(b) Public debt borrowings from various
sources. The receipts on account of loans
and advances are accruals on account of
recoveries of various advances made by the
Government and fall under the category
non-debt capital receipts. Receipts on
account of public debt are mainly in the
form of long term and short term borrowing
instruments of the State Government from
the Government of India, Reserve Bank of
India and various Central Financial
Institutions. With a view to continuously
keep the borrowings of the State
Governments within prudential norms, the
Government of India, Ministry of Finance
has been putting restrictions on the level of
budgetary borrowings of the States in
conformity with the recommendations of
the Thirteen Finance Commission.
The overall Capital Receipts for the
year 2014-15 is estimated to be Rs.517.12
crore. The Non-debt capital receipts on
account of Recoveries of loans and
advances against the past investment are
estimated at Rs. 40 crore during 2014-15.
Capital Receipt on account of Public debt
comprising of Internal Debt and Loans &
advances from the Central Government is
estimated at Rs.477.12 crore during 2013-
14; out of this Rs. 456.07 crore will be the
contribution of Internal debt and Rs. 21.05
Economic Survey Mizoram 2014-15 ~ 13 ~ State Finance
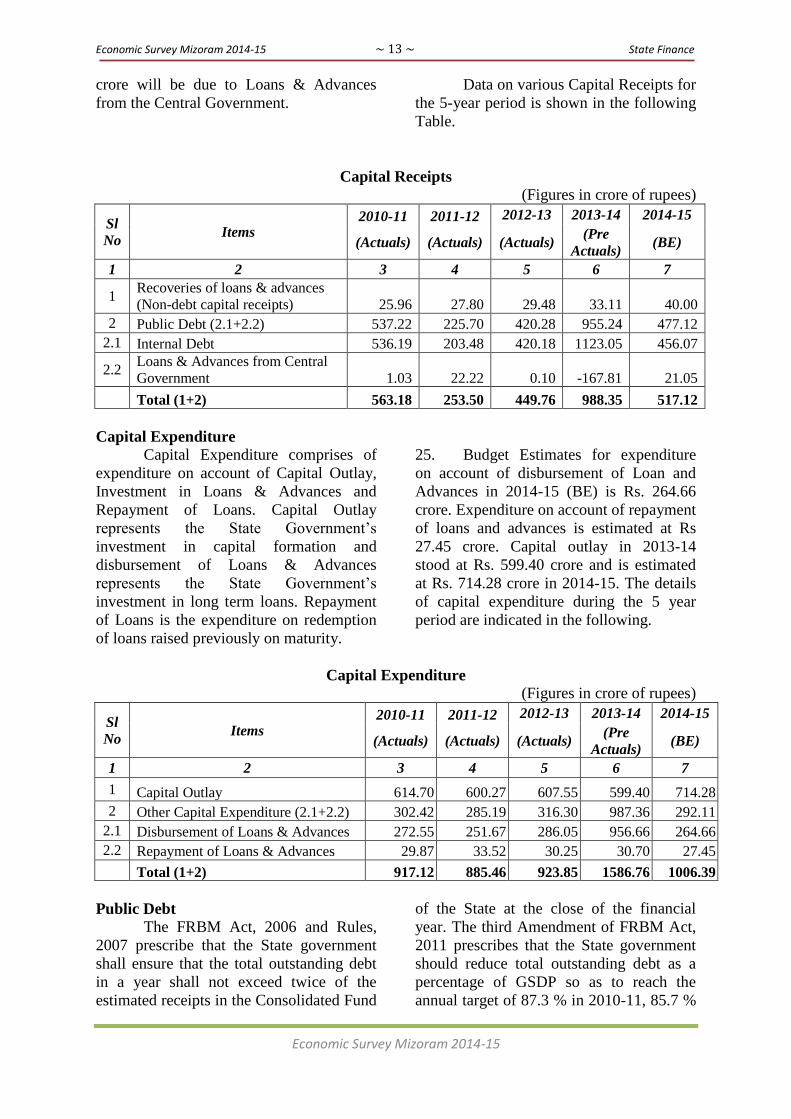
Economic Survey Mizoram 2014-15
crore will be due to Loans & Advances
from the Central Government.
Data on various Capital Receipts for
the 5-year period is shown in the following
Table.
Capital Receipts
(Figures in crore of rupees)
Sl
No Items
2010-11 2011-12 2012-13 2013-14 2014-15
(Actuals) (Actuals) (Actuals) (Pre
Actuals) (BE)
1 2 3 4 5 6 7
1 Recoveries of loans & advances
(Non-debt capital receipts) 25.96 27.80 29.48 33.11 40.00
2 Public Debt (2.1+2.2) 537.22 225.70 420.28 955.24 477.12
2.1 Internal Debt 536.19 203.48 420.18 1123.05 456.07
2.2 Loans & Advances from Central
Government 1.03 22.22 0.10 -167.81 21.05
Total (1+2) 563.18 253.50 449.76 988.35 517.12
Capital Expenditure
Capital Expenditure comprises of
expenditure on account of Capital Outlay,
Investment in Loans & Advances and
Repayment of Loans. Capital Outlay
represents the State Government‘s
investment in capital formation and
disbursement of Loans & Advances
represents the State Government‘s
investment in long term loans. Repayment
of Loans is the expenditure on redemption
of loans raised previously on maturity.
25. Budget Estimates for expenditure
on account of disbursement of Loan and
Advances in 2014-15 (BE) is Rs. 264.66
crore. Expenditure on account of repayment
of loans and advances is estimated at Rs
27.45 crore. Capital outlay in 2013-14
stood at Rs. 599.40 crore and is estimated
at Rs. 714.28 crore in 2014-15. The details
of capital expenditure during the 5 year
period are indicated in the following.
Capital Expenditure
(Figures in crore of rupees)
Sl
No Items
2010-11 2011-12 2012-13 2013-14 2014-15
(Actuals) (Actuals) (Actuals) (Pre
Actuals) (BE)
1 2 3 4 5 6 7
1 Capital Outlay 614.70 600.27 607.55 599.40 714.28
2 Other Capital Expenditure (2.1+2.2) 302.42 285.19 316.30 987.36 292.11
2.1 Disbursement of Loans & Advances 272.55 251.67 286.05 956.66 264.66
2.2 Repayment of Loans & Advances 29.87 33.52 30.25 30.70 27.45
Total (1+2) 917.12 885.46 923.85 1586.76 1006.39
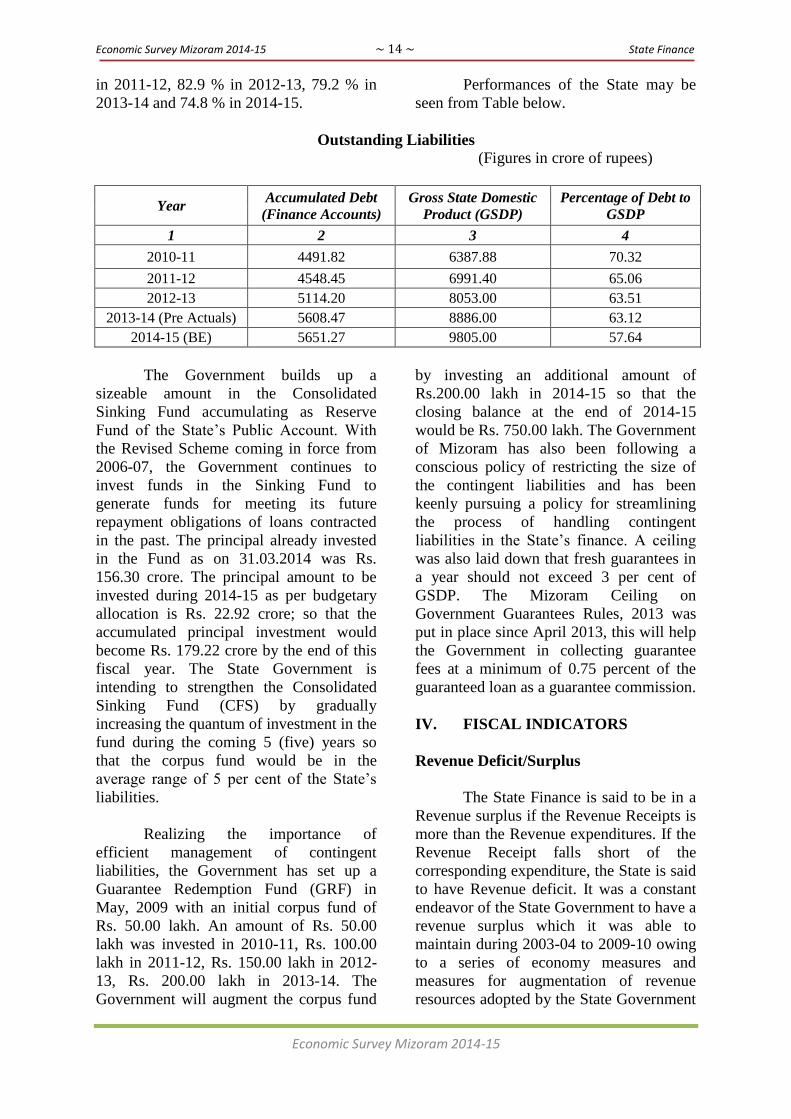
Public Debt
The FRBM Act, 2006 and Rules,
2007 prescribe that the State government
shall ensure that the total outstanding debt
in a year shall not exceed twice of the
estimated receipts in the Consolidated Fund
of the State at the close of the financial
year. The third Amendment of FRBM Act,
2011 prescribes that the State government
should reduce total outstanding debt as a
percentage of GSDP so as to reach the
annual target of 87.3 % in 2010-11, 85.7 %
Economic Survey Mizoram 2014-15 ~ 14 ~ State Finance
Economic Survey Mizoram 2014-15
in 2011-12, 82.9 % in 2012-13, 79.2 % in
2013-14 and 74.8 % in 2014-15.
Performances of the State may be
seen from Table below.
Outstanding Liabilities
(Figures in crore of rupees)
Year Accumulated Debt
(Finance Accounts)
Gross State Domestic
Product (GSDP)
Percentage of Debt to
GSDP
1 2 3 4
2010-11 4491.82 6387.88 70.32
2011-12 4548.45 6991.40 65.06
2012-13 5114.20 8053.00 63.51
2013-14 (Pre Actuals) 5608.47 8886.00 63.12
2014-15 (BE) 5651.27 9805.00 57.64
The Government builds up a
sizeable amount in the Consolidated
Sinking Fund accumulating as Reserve
Fund of the State‘s Public Account. With
the Revised Scheme coming in force from
2006-07, the Government continues to
invest funds in the Sinking Fund to
generate funds for meeting its future
repayment obligations of loans contracted
in the past. The principal already invested
in the Fund as on 31.03.2014 was Rs.
156.30 crore. The principal amount to be
invested during 2014-15 as per budgetary
allocation is Rs. 22.92 crore; so that the
accumulated principal investment would
become Rs. 179.22 crore by the end of this
fiscal year. The State Government is
intending to strengthen the Consolidated
Sinking Fund (CFS) by gradually
increasing the quantum of investment in the
fund during the coming 5 (five) years so
that the corpus fund would be in the
average range of 5 per cent of the State‘s
liabilities.
Realizing the importance of
efficient management of contingent
liabilities, the Government has set up a
Guarantee Redemption Fund (GRF) in
May, 2009 with an initial corpus fund of
Rs. 50.00 lakh. An amount of Rs. 50.00
lakh was invested in 2010-11, Rs. 100.00
lakh in 2011-12, Rs. 150.00 lakh in 2012-
13, Rs. 200.00 lakh in 2013-14. The
Government will augment the corpus fund
by investing an additional amount of
Rs.200.00 lakh in 2014-15 so that the
closing balance at the end of 2014-15
would be Rs. 750.00 lakh. The Government
of Mizoram has also been following a
conscious policy of restricting the size of
the contingent liabilities and has been
keenly pursuing a policy for streamlining
the process of handling contingent
liabilities in the State‘s finance. A ceiling
was also laid down that fresh guarantees in
a year should not exceed 3 per cent of
GSDP. The Mizoram Ceiling on
Government Guarantees Rules, 2013 was
put in place since April 2013, this will help
the Government in collecting guarantee
fees at a minimum of 0.75 percent of the
guaranteed loan as a guarantee commission.
IV. FISCAL INDICATORS
Revenue Deficit/Surplus
The State Finance is said to be in a
Revenue surplus if the Revenue Receipts is
more than the Revenue expenditures. If the
Revenue Receipt falls short of the
corresponding expenditure, the State is said
to have Revenue deficit. It was a constant
endeavor of the State Government to have a
revenue surplus which it was able to
maintain during 2003-04 to 2009-10 owing
to a series of economy measures and
measures for augmentation of revenue
resources adopted by the State Government

Economic Survey Mizoram 2014-15 ~ 15 ~ State Finance
Economic Survey Mizoram 2014-15
coupled with subvention from the Central
Government. An amount of Rs. 115.06
crore is tentatively being estimated to be
the Revenue Surplus during 2014-15.
Fiscal Deficit
Fiscal deficit indicates the total
borrowing requirements of the Government
from all sources. From the view point of
the economy, fiscal deficit is the most
significant, since it shows the gap between
Government receipts and Government
expenditure. It reflects the true extent of
borrowing by the Government in a fiscal
year.
The State government enacted
FRBM Act, 2006 and put in place FRBM
Rules, 2007 and subsequent Amendments
in 2009, 2010 and 2011 wherein fiscal
correction path and targets prescribed by
FC-XIII have been incorporated.
Recommendation of the Thirteen
Finance Commission for fiscal correction
path (fiscal deficit as a percentage to
GSDP) for the State is 6.4 per cent, 5.2 per
cent, 4.1 per cent and 3.0 per cent of the
corresponding GSDP in 2011-12, 2012-13,
2013-14 and 2014-15 respectively.
It is estimated that the Gross Fiscal
Deficit during 2014-15 would be Rs.586.67
crore which is 5.98 per cent of the GSDP
projected for the year.
.....
Economic Survey Mizoram 2014-15 ~ 16 ~ State Plan
Economic Survey Mizoram 2014-15
IV. STATE PLAN
Mizoram was one of the districts of
Assam till 1972. During that period, very
small amount was spent for the
development of Mizoram and the outlays
for the first three Five Year Plans were as
given below: (Rs in lakh) –
1st Five Year Plan (1952-56) - 63.02
2nd
Five Year Plan (1956-61) - 210.83
3rd
Five Year Plan (1961-66) - 411.42
During the first three years of the
Fourth Five Year Plan (1962-72), the
following were the Plan expenditure in
Mizoram:
1969 – 1970 - Rs. 101.61 lakh
1970 – 1971 - Rs. 176.42 lakh
1971 – 1972 - Rs. 205.18 lakh
Mizoram attained the status of U.T.
in January, 1972 and Plan devolution for
Mizoram has also been improved. Planning
Commission approved an outlay of
Rs.275.00 lakh for the Annual Plan 1972-
73. This outlay was enhanced to Rs. 437.00
lakh in the later part of the year. Out of this
provision, only Rs.355.23 lakh was actually
spent.
During 1973-74, Rs. 600.00 lakh
was allocated for Mizoram out of which
only Rs.573.73 lakh was actually spent.
During the Fifth Five Year Plan
(1974-79) Rs. 46.59 crore was allotted for
Mizoram against the total Plan size of Rs.
39,300.24 crore for the country as a whole.
In the Sixth Five Year Plan,
Rs.128.47 crore was the outlay for
Mizoram whereas the total Plan size was
Rs.71,000.00 crore, but the 6th
Plan was not
completed as there was change of
government at the centre.
Before the commencement of the
new 6th
Five Year Plan (1980-85), there
were two Rolling Annual Plans for 1978-79
and 1979-80. During these two years, the
outlays for Mizoram annual Plans were
Rs.16.64 crore and Rs. 17.72 crore and the
actual expenditure were Rs. 14.62 and
Rs.16.11 crore respectively.
During the 6th
Five year Plan (1980-
85), Rs. 130.00 crore was originally
allotted for Mizoram. The actual
expenditure during the Plan period
amounted to Rs. 150.09 crore.
The original outlay for the 7th
Five
Year Plan (1985-90) in respect of Mizoram
was Rs. 260.00 crore. However, the actual
release of Plan fund during the period by
way of Annual Plan was Rs. 364.50 crore,
out of which the actual expenditure was
Rs.363.56 crore.
Prior to the launching of Eight Five
Year Plan in 1992-93 there were two
Annual Plans for 1990-91 and 1991-92, for
which the actual expenditure were
Rs.125.35 crore and Rs. 152.28 crore
respectively against the outlays of
Rs.125.00 crore and Rs. 152.00 crore.
The original approved outlay for the
8th
Five Year Plan was Rs. 763.00 crore.
However, the total approved outlays for the
five annual plans during the period was
Rs.1064.60 crore against which the total
expenditure was Rs. 1064.45 crore.
The original approved outlay for the
9th
Five Year Plan (1997-2002) was
Rs.1618.51 crore. However, the total
approved outlays for the five successive
Annual Plans during the period was
Rs.1794.26 crore and the total actual
expenditure was Rs. 1719.96 crore.
While the original agreed outlay for
the 10th
Five Year Plan (2002-2007) was
Rs.2300.01 crore, total of successive
Annual Plan approved outlays was
Rs.2969.52 crore and total of the successive
Revised Annual Plan outlays was

Economic Survey Mizoram 2014-15 ~ 17 ~ State Plan
Economic Survey Mizoram 2014-15
Rs.3154.99 crore. The total actual
expenditure during the 10th
Five Year Plan
was Rs. 2941.48 crore which was 127.88%
of the original agreed total outlay of Rs.
2300.01 crore for the 10th
Five Year Plan.
The original approved outlay for the
11th
Five Year Plan (2007-2012) was
Rs.5534.00 crore. However, the actual
allocated amount was Rs. 6300.00 crore.
During the 12th
Five Year Plan (2012-
2017), an outlay of Rs. 12,160.00 crore is
approved. For the first annual plan (2012-
13) the approved outlay was Rs. 2300.00
crore and the revised outlay was Rs.
2361.62 crore. During the second annual
plan (2013-14), Rs. 2500.00 crores was
approved and the proposed revised outlay is
Rs. 2539.78 crores
Annual Plan 2014-15
The Annual Plan 2014-15 was fixed
at Rs. 3140.00 crore with an increase of
25.60% over the previous year‘s size of Rs.
2500.00 crore. The significant increase
could be attributing mainly due to
substantial increase in Central Assistance
on account of inclusion of a number of
Centrally Sponsored Schemes as a means to
finance state‘s Annual Plan which were
hitherto placed outside of the State Plan
resources.
The Plan size for 2014-15 of
Rs.3140.00 crore includes Rs. 520.00 crore
as Special Plan Assistance (SPA),
Rs.200.00 crore as Special Central
Assistance (SCA), Rs. 1087.96 crore CSS
(flagship) and Rs.412.60 crore CSS (other
schemes).
Allocation of Central Assistance to Mizoram State Plan 2014-15
Sl.
No.
Items Amount
(Rs. in crore)
1. Block Grant
i) Normal Central Assistance 896.58
ii) Special Plan Assistance
i) NLUP 317.32
ii) State‘s priority projects 202.68
iii) Special Central Assistance (untied) 200.00
iv) NEC 122.64
v) NLCPR 98.77
vi) EAP 189.50
vii) Grant under Proviso to Article 275 (1) 11.70
viii) CRF (Roads & Bridges) 12.68
2. CSS (Flagship 16 schemes) 1087.96
3. CSS (Other schemes - 37 schemes) 412.60
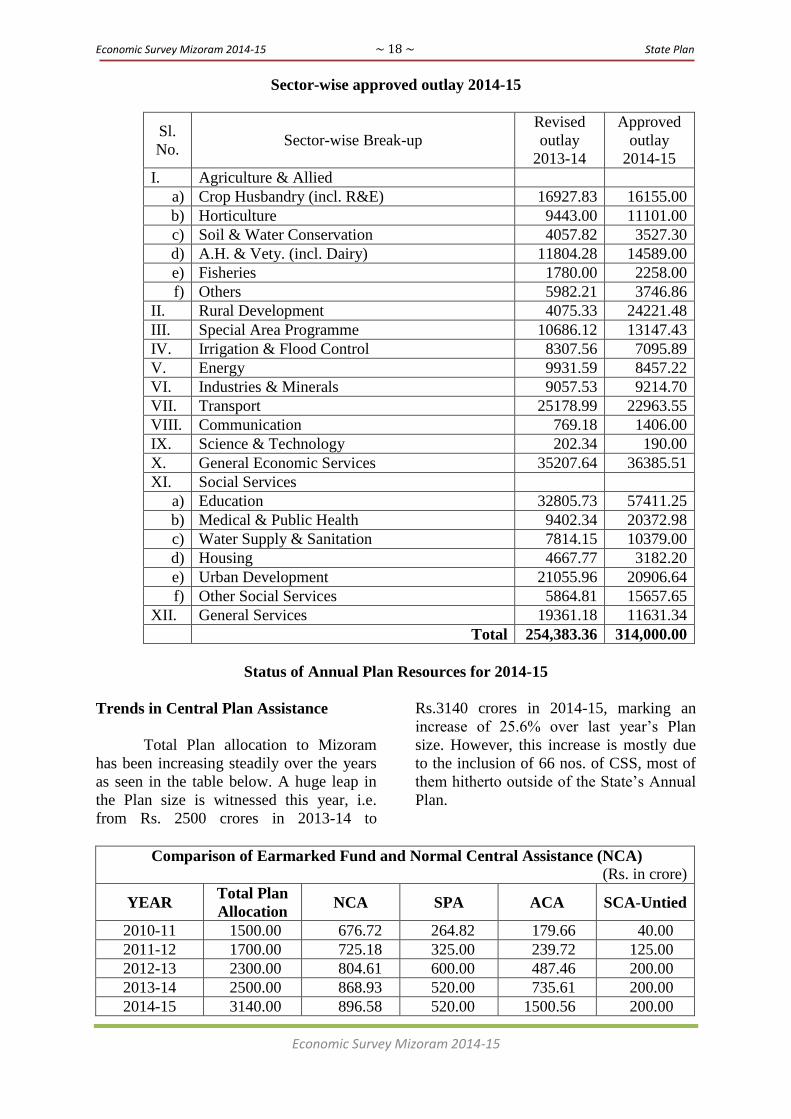
Economic Survey Mizoram 2014-15 ~ 18 ~ State Plan
Economic Survey Mizoram 2014-15
Sector-wise approved outlay 2014-15
Sl.
No. Sector-wise Break-up
Revised
outlay
2013-14
Approved
outlay
2014-15
I. Agriculture & Allied
a) Crop Husbandry (incl. R&E) 16927.83 16155.00
b) Horticulture 9443.00 11101.00
c) Soil & Water Conservation 4057.82 3527.30
d) A.H. & Vety. (incl. Dairy) 11804.28 14589.00
e) Fisheries 1780.00 2258.00
f) Others 5982.21 3746.86
II. Rural Development 4075.33 24221.48
III. Special Area Programme 10686.12 13147.43
IV. Irrigation & Flood Control 8307.56 7095.89
V. Energy 9931.59 8457.22
VI. Industries & Minerals 9057.53 9214.70
VII. Transport 25178.99 22963.55
VIII. Communication 769.18 1406.00
IX. Science & Technology 202.34 190.00
X. General Economic Services 35207.64 36385.51
XI. Social Services
a) Education 32805.73 57411.25
b) Medical & Public Health 9402.34 20372.98
c) Water Supply & Sanitation 7814.15 10379.00
d) Housing 4667.77 3182.20
e) Urban Development 21055.96 20906.64
f) Other Social Services 5864.81 15657.65
XII. General Services 19361.18 11631.34
Total 254,383.36 314,000.00
Status of Annual Plan Resources for 2014-15
Trends in Central Plan Assistance
Total Plan allocation to Mizoram
has been increasing steadily over the years
as seen in the table below. A huge leap in
the Plan size is witnessed this year, i.e.
from Rs. 2500 crores in 2013-14 to
Rs.3140 crores in 2014-15, marking an
increase of 25.6% over last year‘s Plan
size. However, this increase is mostly due
to the inclusion of 66 nos. of CSS, most of
them hitherto outside of the State‘s Annual
Plan.
Comparison of Earmarked Fund and Normal Central Assistance (NCA)
(Rs. in crore)
YEAR Total Plan
Allocation NCA SPA ACA SCA-Untied
2010-11 1500.00 676.72 264.82 179.66 40.00
2011-12 1700.00 725.18 325.00 239.72 125.00
2012-13 2300.00 804.61 600.00 487.46 200.00
2013-14 2500.00 868.93 520.00 735.61 200.00
2014-15 3140.00 896.58 520.00 1500.56 200.00
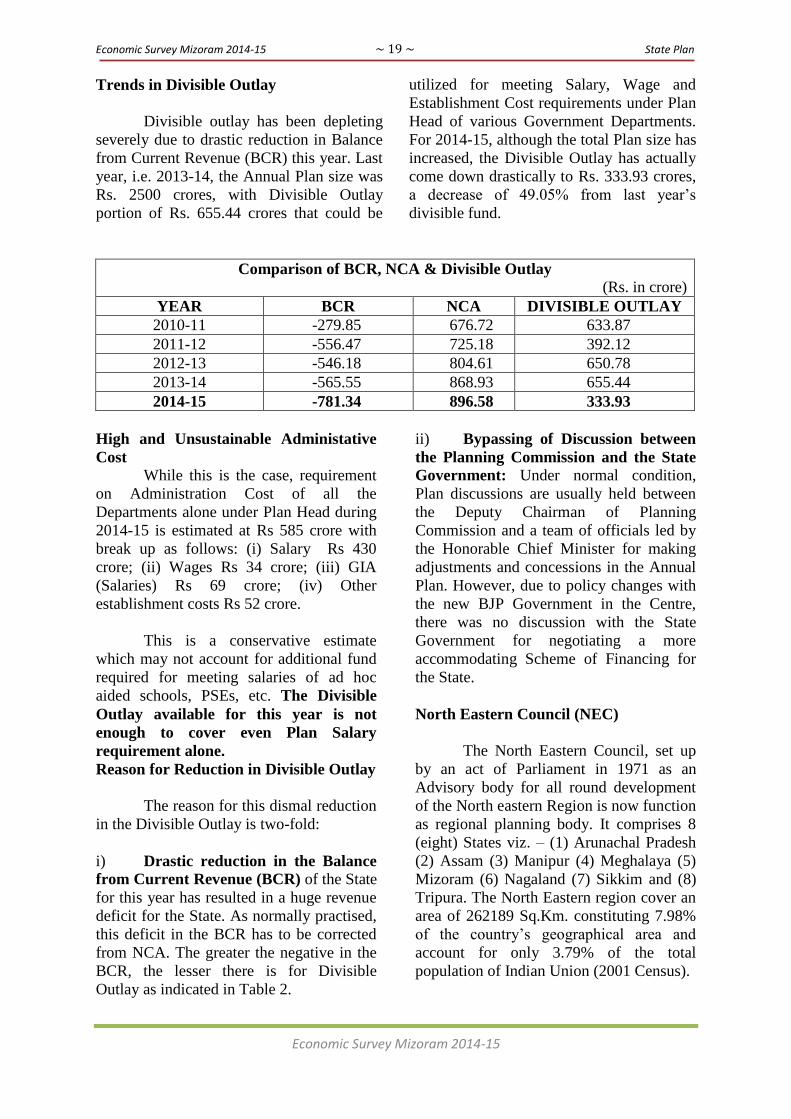
Economic Survey Mizoram 2014-15 ~ 19 ~ State Plan
Economic Survey Mizoram 2014-15
Trends in Divisible Outlay
Divisible outlay has been depleting
severely due to drastic reduction in Balance
from Current Revenue (BCR) this year. Last
year, i.e. 2013-14, the Annual Plan size was
Rs. 2500 crores, with Divisible Outlay
portion of Rs. 655.44 crores that could be
utilized for meeting Salary, Wage and
Establishment Cost requirements under Plan
Head of various Government Departments.
For 2014-15, although the total Plan size has
increased, the Divisible Outlay has actually
come down drastically to Rs. 333.93 crores,
a decrease of 49.05% from last year‘s
divisible fund.
Comparison of BCR, NCA & Divisible Outlay
(Rs. in crore)
YEAR BCR NCA DIVISIBLE OUTLAY
2010-11 -279.85 676.72 633.87
2011-12 -556.47 725.18 392.12
2012-13 -546.18 804.61 650.78
2013-14 -565.55 868.93 655.44
2014-15 -781.34 896.58 333.93
High and Unsustainable Administative
Cost
While this is the case, requirement
on Administration Cost of all the
Departments alone under Plan Head during
2014-15 is estimated at Rs 585 crore with
break up as follows: (i) Salary Rs 430
crore; (ii) Wages Rs 34 crore; (iii) GIA
(Salaries) Rs 69 crore; (iv) Other
establishment costs Rs 52 crore.
This is a conservative estimate
which may not account for additional fund
required for meeting salaries of ad hoc
aided schools, PSEs, etc. The Divisible
Outlay available for this year is not
enough to cover even Plan Salary
requirement alone.
Reason for Reduction in Divisible Outlay
The reason for this dismal reduction
in the Divisible Outlay is two-fold:
i) Drastic reduction in the Balance
from Current Revenue (BCR) of the State
for this year has resulted in a huge revenue
deficit for the State. As normally practised,
this deficit in the BCR has to be corrected
from NCA. The greater the negative in the
BCR, the lesser there is for Divisible
Outlay as indicated in Table 2.
ii) Bypassing of Discussion between
the Planning Commission and the State
Government: Under normal condition,
Plan discussions are usually held between
the Deputy Chairman of Planning
Commission and a team of officials led by
the Honorable Chief Minister for making
adjustments and concessions in the Annual
Plan. However, due to policy changes with
the new BJP Government in the Centre,
there was no discussion with the State
Government for negotiating a more
accommodating Scheme of Financing for
the State.
North Eastern Council (NEC)
The North Eastern Council, set up
by an act of Parliament in 1971 as an
Advisory body for all round development
of the North eastern Region is now function
as regional planning body. It comprises 8
(eight) States viz. – (1) Arunachal Pradesh
(2) Assam (3) Manipur (4) Meghalaya (5)
Mizoram (6) Nagaland (7) Sikkim and (8)
Tripura. The North Eastern region cover an
area of 262189 Sq.Km. constituting 7.98%
of the country‘s geographical area and
account for only 3.79% of the total
population of Indian Union (2001 Census).

Economic Survey Mizoram 2014-15 ~ 20 ~ State Plan
Economic Survey Mizoram 2014-15
The Council plays an important role
for Socio-economic Development of the
North Eastern States for various sectors.
The major investments had been in
transport an communication followed by
the water and power sector. Investments
include construction of roads, upgradation/
improvement of airports, survey and
investigation of hydroelectric power
projects.
At present, there are 60 nos. of on-
going projects across various sectors with
total cost Rs. 810.21 crores. NEC had
released Rs. 16.70 crores for these projects
during 2014-15 (upto 3rd
quarter) and
Rs.448.11 crores since inception of these
projects. Mizoram Government submitted
48 no's of new projects as 'State Priority'
for funding during 2014-15. However, due
to meager fund available with the NEC,
they are not able to take up these priority
projects during 2014-15.
Status of fund release to Mizoram by NEC during 2008-14 (Rs. in lakh):
Sl.
No. Name of Scheme 2008-09 2009-10 2010-11 2011-12 2012-13 2013-14
1 2 3 4 5 6 7 8
I. Agriculture & Allied
Sector 88.20 141.50 - 316.33 682.85 255.76
II. Irrigation, Flood
Control & WSM - 35.00 417.00 280.68 713.82 140.96
III. Industries & Tourism
Sector 53.60 59.70 66.35 110.53 357.31 351.84
IV. Power Development 783.00 450.00 717.69 355.00 1,081.12 820.00
V. Transport &
Communication 3,300.00 1,997.82 2,930.20 4,542.88 6,069.88 2527.00
VI. Science & Technology
Sector 180.00 75.00 165.19 223.20 325.77 258.00
VII. Medical & Health
Services 116.57 30.00 130.00 355.00 406.53 680.00
VIII. Human Resources
Development 49.85 154.11 313.70 580.50 665.94 772.35
IX. Information & Public
Relations - - 4.25 2.50 145.00 -
Grand Total 4,571.22 2,943.13 4,744.38 6,766.62 10,448.22 5,196.49
Non-Lapsable Central Pool Resources
(NLCPR)
The Non-Lapsable Central Pool of
Resources (NLCPR) was created during
1998-99 out of the unspent balance of 10%
GBS of concerned Central Ministries.
Funds under NLCPR are administered by
the Ministry of Development of North
Eastern Region (DoNER).
Till date, there are 78 nos. of
completed NLCPR projects with total
expenditure of Rs. 53227.96 lakhs.
Presently, there are 61 nos. of
ongoing projects with total approved cost
of Rs.49056.89 lakhs. These projects which
are infrastructure in nature covers Agri. &
Allied, Education, Health, Roads, Power,
Water Supply and other Miscellaneous
Sectors. In addition to the above, there are
also 61 nos. of projects with estimated cost
of Rs. 52891.00 lakhs under consideration
for funding under NLCPR.

Economic Survey Mizoram 2013-14 ~ 21 ~ State Plan
Economic Survey Mizoram 2014-15
Year-wise release of funds under NLCPR:
(Rs. in lakh)
1998 – 1999 - 900.00
1999 – 2000 - 5,615.00
2000 – 2001 - 2,671.00
2001 – 2002 - 6,986.00
2002 – 2003 - 8,343.00
2003 – 2004 - 9,953.60
2004 – 2005 - 4,236.96
2005 – 2006 - 4,104.19
2006 – 2007 - 5,646.43
2007 – 2008 - 2,982.37
2008 – 2009 - 1,494.52
2009 – 2010 - 1,991.42
2010 – 2011 - 7,372.61
2011 – 2012 - 3,656.16
2012 – 2013 - 8,168.12
2013 – 2014 - 7,488.61
Total - 83991.98
…….

Economic Survey Mizoram 2014-15 ~ 22 ~ Employment & Labour Welfare
Economic Survey Mizoram 2014-15
V. EMPLOYMENT & LABOUR WELFARE
As per Census 2011, out of the total
population of 10,97,206 in the State,
44.36% i.e. 4,86,705 were workers and the
rest 6,10,501 were non-workers. The
proportion of workers has gone down from
52.57% in 2001 census to 44.36% in 2011
census. It also reveals that proportion of
workers was higher in the rural areas
(51.86%) than in the urban areas which
constituted about 48.14% of all the
workers. Also, female working population
constitutes about 40.25% of total workers
and the share of male working population
was about 59.74%. As per Census 2011,
55.76 per cent of the total workers are
engaged in agricultural activities.
Percentage (%) to Total Main Workers
DISTRICT
Cultivators Agricultural
Labourer
Workers in
Household
Industries
Other Workers
2001
Census
2011
Census
2001
Census
2011
Census
2001
Census
2011
Census
2001
Census
2011
Census
Mamit 77.52 79.23 3.29 7.06 0.80 0.72 18.39 21.71
Kolasib 61.51 60.59 3.83 19.94 1.12 1.97 33.52 40.99
Aizawl 31.40 25.93 2.50 7.55 1.47 2.22 64.60 79.64
Champhai 70.18 72.18 6.37 10.96 1.12 1.85 22.31 28.64
Serchhip 72.77 73.07 2.32 4.30 2.64 3.10 22.26 28.10
Lunglei 65.23 73.27 1.52 17.19 0.58 1.31 32.65 34.47
Lawngtlai 71.52 76.65 3.08 8.28 0.99 1.61 24.40 33.12
Saiha 67.66 60.62 1.28 6.51 0.79 2.13 30.25 63.18
Labour Administration
A country or state can prosper only
if proper care, security, safety and
protection is given to its workforce.
Various Labour Acts such as Minimum
Wages Act, 1945, Trade Union Act, 1926,
Inter-State Migrant Workmen Act, 1979,
Contract Labour Act, 1970, Building &
Other Construction Workers‘ Act, 1996 etc.
have been implemented.
The Mizoram Shops &
Establishments Act, 2010 and the Mizoram
Child Labour (Prohibition & Regulation)
Rules, 2010 have been approved by the
meeting of the Council of Ministers in
February, 2010.

Economic Survey Mizoram 2014-15 ~ 23 ~ Employment & Labour Welfare
Economic Survey Mizoram 2014-15
Public Sector Employment
As per Census of Government
Employees, 2014, the number of employees
working under the state government was
59,612 out of which 43,951 were regular
employees and 7,494 were Muster Roll and
463 were work-charged.
GROUP WISE NUMBER OF STATE GOVERNMENT EMPLOYEES
as on 31.3.2014
Sl.
No. Group Male Female Total
1 A 2,793 1,180 3,973
2 B 'G' 980 191 1,171
3 B 'NG' 7,482 5,527 13,009
4 C 14,403 3,392 17,795
5 D 6,037 1,966 8,003
SUB-TOTAL 31,695 12,256 43,951
OTHERS
6 Contract 755 671 1,426
7 Work Charge 365 98 463
8 Muster Roll 5,536 1,958 7,494
9 Officiating 11 4 15
10 Co-Terminus 3,030 3,233 6,263
SUB-TOTAL 9,697 5,964 15,661
GRAND TOTAL 41,392 18,220 59,612
Implementation of Minimum Wages Act, 1948:
State Advisory Board representing workers, employees and
independent persons was constituted under the Minimum Wages Act, 1948
and Mizoram Rules, 1992. Minimum daily rates of wages on the State‘s
sphere of employment was fixed in October, 2013 on the basis of the
advice of the Advisory Board as follows:-
Unskilled - Rs. 220/-
Semi – Skilled - Rs. 250/-
Skilled – II - Rs. 310/-
Skilled – I - Rs. 380/-
Implementation of Contract Labour Act, 1970 and
Inter-State Migrant Workmen Act, 1970 and the Mizoram Rules, 2005.
No. of Licenses Issued under No. of Labours covered by Licenses
Contract Labour 99 4074
Inter-State Migrant Workmen 100 7496

Economic Survey Mizoram 2014-15 ~ 24 ~ Employment & Labour Welfare
Economic Survey Mizoram 2014-15
The growth and trend of Employment under Government of Mizoram over the years
is highlighted as follows.
GROWTH AND TREND OF EMPLOYMENT UNDER
GOVERNMENT OF MIZORAM
Sl.
No. Year
Total No. of
Employees &
Workers
Growth
Rate
Index of
Employment
(Base Year
1981 = 100)
1 1981 18,831 - 100
2 1983 20,594 0.09 109
3 1985 27,104 0.20 144
4 1987 29,644 0.16 157
5 1994 40,420 0.21 215
6 1996 42,609 0.18 226
7 1998 46,674 0.16 248
8 2000 49,892 0.15 265
9 2002 50,721 0.13 269
10 2008 56,239 0.13 299
11 2009 53,653 0.11 285
12 2012 55,465 0.10 295
13 2014 59,612 0.10 317
Vocational Training (ITI)
The State Government currently
runs ITI at Aizawl, Lunglei and Saiha
under National Vocational Training
Programme with the following objectives: -
(a) To ensure steady flow of skilled
workers in different trades to meet
the man-power need of the state and
of the nation;
(b) To reduce unemployment among
educated youth by providing
employable training.
Status of the three Government ITI‟s
during 2013 – 2014
Name of
Institution
No. of Trainees
enrolled
I.T.I., Aizawl
I.T.I., Lunglei
I.T.I., Saiha
173
73
59
Employment Service
While reducing un-employment
continued to be the major thrust of
developmental planning, growing un-
employment problem still remains an
alarming feature of the state. Job-seekers
have been increasing over the years and
there is a persistent problem of un-
employment especially among the educated
youths.
Number of educated job-seekers
registered in the live register of Aizawl,
Champhai, Lunglei and Saiha as on
30.09.2014 are as follows:
DISTRICT EMPLOYMENT
REGISTRATION
AIZAWL 21,085
LUNGLEI 4,337
SAIHA 7,638
CHAMPHAI 4,884
TOTAL 37,944
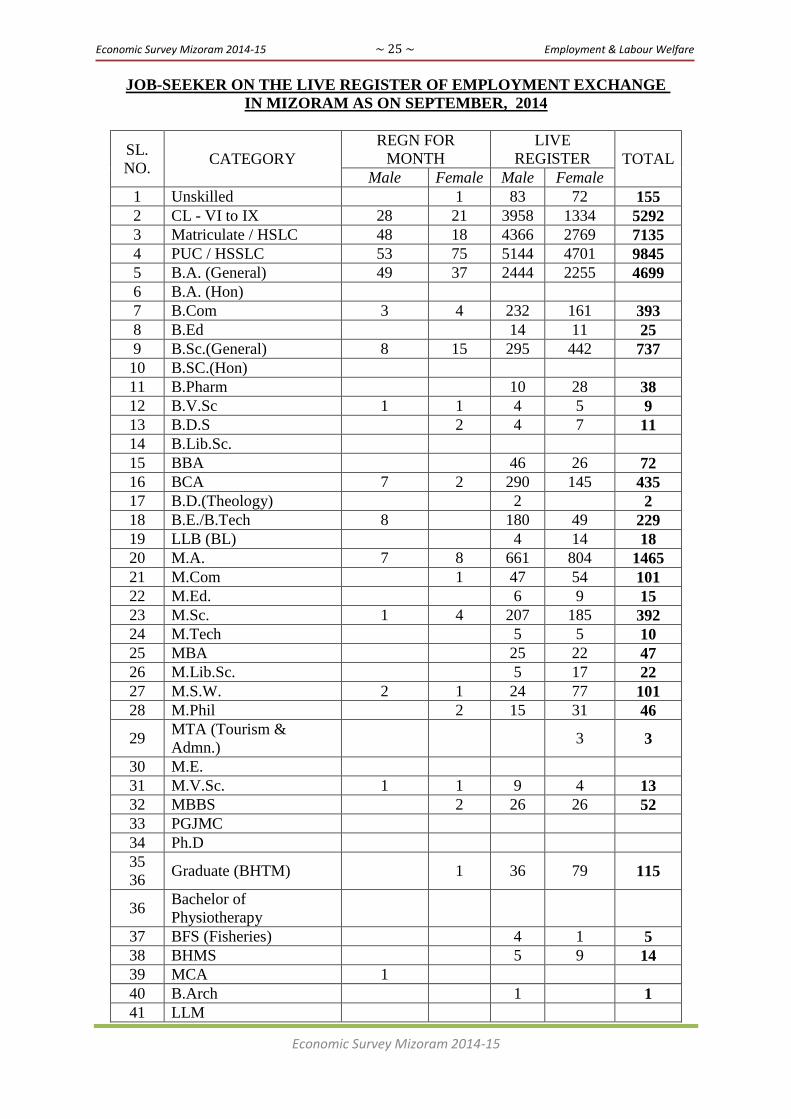
Economic Survey Mizoram 2014-15 ~ 25 ~ Employment & Labour Welfare
Economic Survey Mizoram 2014-15
JOB-SEEKER ON THE LIVE REGISTER OF EMPLOYMENT EXCHANGE
IN MIZORAM AS ON SEPTEMBER, 2014
SL.
NO. CATEGORY
REGN FOR
MONTH
LIVE
REGISTER TOTAL
Male Female Male Female
1 Unskilled 1 83 72 155
2 CL - VI to IX 28 21 3958 1334 5292
3 Matriculate / HSLC 48 18 4366 2769 7135
4 PUC / HSSLC 53 75 5144 4701 9845
5 B.A. (General) 49 37 2444 2255 4699
6 B.A. (Hon)
7 B.Com 3 4 232 161 393
8 B.Ed 14 11 25
9 B.Sc.(General) 8 15 295 442 737
10 B.SC.(Hon)
11 B.Pharm 10 28 38
12 B.V.Sc 1 1 4 5 9
13 B.D.S 2 4 7 11
14 B.Lib.Sc.
15 BBA 46 26 72
16 BCA 7 2 290 145 435
17 B.D.(Theology) 2 2
18 B.E./B.Tech 8 180 49 229
19 LLB (BL) 4 14 18
20 M.A. 7 8 661 804 1465
21 M.Com 1 47 54 101
22 M.Ed. 6 9 15
23 M.Sc. 1 4 207 185 392
24 M.Tech 5 5 10
25 MBA 25 22 47
26 M.Lib.Sc. 5 17 22
27 M.S.W. 2 1 24 77 101
28 M.Phil 2 15 31 46
29 MTA (Tourism &
Admn.) 3 3
30 M.E.
31 M.V.Sc. 1 1 9 4 13
32 MBBS 2 26 26 52
33 PGJMC
34 Ph.D
35
36 Graduate (BHTM) 1 36 79 115
36 Bachelor of
Physiotherapy
37 BFS (Fisheries) 4 1 5
38 BHMS 5 9 14
39 MCA 1
40 B.Arch 1 1
41 LLM

Economic Survey Mizoram 2014-15 ~ 26 ~ Employment & Labour Welfare
Economic Survey Mizoram 2014-15
42 MCM
43 BSW 1 4 4 8
44 MF.Sc. (Fisheries)
45 Doctor of Medicine
(MD) 1 2 3
46 Master of Surgery (MS) 1 1
47 B.Th 2 4 6
48 M.Pharm 2 2
49 Driver 129 129
50 Conductor
51 Hindi a) Matric 136 435 571
52 Hindi b) PU 32 106 138
53 Hindi c) BA 1 3 78 304 382
Hindi d) MA
55 Hindi e) B.Ed
56 Hindi f) M.Ed 2 1 3
57 Technical Trade (EXTT) 52 54 1732 2701 4433
58 Physically Handicapped 2 271 118 389
59 Non-Mizo 1 268 114 382
Grand Total 272 254 20808 17136 37944
……

Economic Survey Mizoram 2014-15 ~ 27 ~ Price & Public Distribution
Economic Survey Mizoram 2014-15
VI. PRICE AND PUBLIC DISTRIBUTION
Retail Price
Retail Price indicates price which
the ultimate consumer pays when buying
commodities from a retailer. Movement of
retail prices of various commodities
purchased by the people shows a more or
less upward trend thereby causing a higher
cost of living. The average retail price of
some selected commodities of the past few
years are as below.
Retail Price of Selected Commodities
(Price in Rupees)
Sl.
No. Commodities Unit
2006 -
07
2007 -
08
2008 -
09
2009 -
10
2010 -
11
2011 -
12
2012 -
13
2013 -
14
1 2 3 4 5 6 7 8 9 10 11
1 Rice
(Common) Kg 16.54 20.30 20.88 24.67 24.00 26.00 27.00 32.00
2 Atta Kg 15.56 17.25 17.38 18.12 24.00 24.00 28.00 29.00
3 Masur Dal Kg 42.75 56.00 73.75 76.28 69.00 71.00 78.00 89.00
4 Matar Chana Kg 22.81 30.63 31.88 31.09 33.00 38.00 46.00 49.00
5 Mustard Oil Lit 61.06 78.12 85.00 78.87 82.00 87.00 121.00 121.00
6 Pork Kg 102.50 122.00 145.00 150.42 162.10 185.00 229.00 250.00
7 Beef Kg 112.50 123.75 146.25 159.58 180.00 204.00 258.00 275.00
8 Fish (Romas) Kg 112.50 114.28 131.25 142.94 149.00 144.00 198.00 204.00
9 Milk (Fresh) Lit 28.87 27.62 30.63 32.73 37.00 43.00 50.00 53.00
10 Ginger Kg 12.50 12.12 21.88 21.25 30.00 28.00 49.00 74.00
11 Potato Kg 12.69 12.50 14.50 22.42 18.00 21.00 31.00 44.00
12 Sugar Kg 25.00 23.63 27.25 34.43 43.00 41.00 51.00 48.00
13 LPG (Home
Delivery) Cylinder 306.63 305.63 325.00 320.44 361.00 425.00 437.00 438.00
Retail Price Index
Retail Price Index is calculated
from a basket of 61 commodities with base
year 1999-2000 = 100. The Retail price
Index as on December 2014 is calculated at
338 against the Index of 317 on December
2013 showing a percentage increase of 6.62
over one year.
Retail Price Index
(Base Year : 1999-2000 = 100)
Sl.
No. Year
Retail Price
Index % Variation
1 2007 162 -
2 2008 177 9.26
3 2009 204 15.25
4 2010 210 2.94
5 2011 234 11.43
6 2012 274 17.09
7 2013 317 15.69
8 2014 338 6.62

Economic Survey Mizoram 2014-15 ~ 28 ~ Price & Public Distribution
Economic Survey Mizoram 2014-15
Wholesale Price
The wholesale price is generally
taken as the rate at which a relatively large
transaction of purchase is affected. The
following table represents the price
behaviour and trend of wholesale price in
respect of some selected items from 1999-
2000 to the current year. The item-wise
wholesale price indices with 1999-2000 as
base year is also reflected.
Average Wholesale Price and Price Indices of selected Food Commodities in Mizoram
(Base Year: 1999-2000=100)
Sl.
No. Commodities Unit
1999-
2000
2007 -
08
2008 -
09
2009 -
10
2010 -
11
2011 -
12
2012 -
13
2013 -
14
WPI
Dec.
2014
1 2 3 4 5 6 7 8 9 10 11 12
1 Rice (Local) Qtls. 1355 1825 1800 2125 3050 3000 3786 4286 316
2 Atta Qtls. 965 1280 1380 1340 1490 1962 2587 2584 268
3 Masur Dal
(Small) Qtls. 2800 5256 6837 7090 6517 6900 7366 7591 271
4 Sugar Qtls. 1860 2139 2456 3053 3671 4312 4700 4263 229
5 Salt 70
kgs. 240 339 350 395 543 498 662 759 316
6 Ginger Qtls. 500 950 1687 1771 2376 2063 3080 5663 1133
7 Pork Qtls. 8000 12250 14000 14333 16200 19000 22400 25000 313
8 Beef Qtls. 9000 13500 13800 14833 18000 21000 25800 27500 306
9 Chicken
(Broiler) Qtls. 8000 10000 14500 14500 16800 20500 18100 20100 251
10 Fish Qtls. 7000 10000 10000 11000 15800 24600 28800 29900 427
11 Potato Qtls. 700 900 1126 1979 1326 2018 2572 2508 358
12 Onion Qtls. 1000 1200 2175 2393 3526 2488 6486 3112 311
13 Banana Qtls. 600 900 1100 1078 804 1556 2275 3925 654
Average Index for all Commodities 387
Consumer Price Index and Inflation
The Consumer Price Indices (CPI)
are presently compiled and released at
national level. The CPI reflects the
fluctuations in retail prices of items
consumed by the specific segment of the
population. CPI for urban and rural areas
would reflect the true picture of the price
behaviour of various goods and services
consumed by the entire urban and rural
population in the country.
CPI for urban and rural areas was
released from 2011 by Central Statistical
Organisation (CSO) with 2010=100 as base
year. National Sample Survey (NSS) 61st
round (2004-05) consumption expenditure
data are used for derivation of State/UT
specific weighting diagrams. However, the
base year for CPI is bound to be revised to
2012=100 based on NSS 68th
round.
Inflation is an increase in the price
of a basket of goods and services that is
representative of segment of population as
a whole. Price Index is one of the methods
commonly used for measuring inflation.
Inflation Rate is a percentage change in
price index at specific point of time/period
over reference time/period.

Economic Survey Mizoram 2014-15 ~ 29 ~ Price & Public Distribution
Economic Survey Mizoram 2014-15
Consumer Price Index (Base: 2010 = 100) and Inflation Rate
(as on December)
Sl.
No. Year
CPI (All India) Inflation
Rate (%)
(All
India)
CPI (Mizoram) Inflation
Rate (%)
(Mizoram) Rural Urban Com-
bined Rural Urban
Com-
bined
1 2 3 4 5 6 7 8 9 10
1 2011 114.5 112.3 113.6 - 111.0 115.2 113.3 -
2 2012 126.8 124.0 125.6 10.56 124.2 124.2 124.2 9.62
3 2013 140.1 135.3 138.0 9.87 141.2 136.5 138.7 11.67
4 2014
(Prov.) 146.7 142.5 144.9 5.00 146.8 141.5 144.0 3.82
Prov. =Provisional
As on December, 2014, the Annual
inflation rate (Prov.) on point to point basis
(December 2014 over December 2013) in
Mizoram is 3.82% against the All India
inflation rate of 5%. The All India annual
inflation rate significantly decreases
compared to the same month of the
previous year, i.e., 9.87%. Corresponding
to this rate, the inflation rate of Mizoram
also decreases compared to the previous
year‘s rate of 11.67 %.
…..

Economic Survey Mizoram 2014-15 ~ 30 ~ Population
Economic Survey Mizoram 2014-15
VII. POPULATION
As per Population Census 2011, the
population of Mizoram stood at 10,97,206
which accounts for only 0.09% of India‘s
total population of 1,21,01,93,422. The
decadal growth rate during 2001-2011 was
23.48% which is the third highest among
the 7 (seven) north eastern states while the
country‘s decadal growth rate was 17.64%.
As per Population census 2011
(provisional figures), the density of
population of Mizoram is 52 persons per
sq.km. while it is 382 persons per sq.km. in
India. At the district level, Aizawl district
has the highest density in population at 112
persons per sq.km., Mamit district with 29
persons per sq.km. is the least populated.
The final results of Population
Census 2011 shows an improvement in the
sex ratio of the state i.e. the sex ratio
recorded is 976 as compared to 935 in 2001
census. The national figure for the same is
943 as per 2011 census figure. Among the
8 (eight) districts, Aizawl recorded the
highest sex ratio at 1009 while Mamit
district recorded the lowest at 927 though
showing a marked improvement compared
to 2001 census figure of 896 females per
1000 males.
As per the census 2011 results, the
literacy rate of the state is 91.33% which is
the 3rd
highest in the country. Among the 8
(eight) districts, Serchhip district recorded
the highest literacy rate of 97.91% while
Lawngtlai district recorded the lowest at
65.88%. The male and female literacy
rates for the state are 93.35% and 86.72%
respectively showing a slight increase in
the male-female literacy gap i.e. 6.63% in
2011 while it was 3.97% in 2001.
0
200000
400000
600000
800000
1000000
1200000
1901 1911 1921 1931 1941 1951 1961 1971 1981 1991 2001 2011
82
43
4
91
20
4
98
40
6
12
44
04
15
27
36
19
62
02
26
60
63
33
23
90
49
37
57 68
97
56 88
85
73 1
09
72
06GROWTH OF POPULATION IN MIZORAM
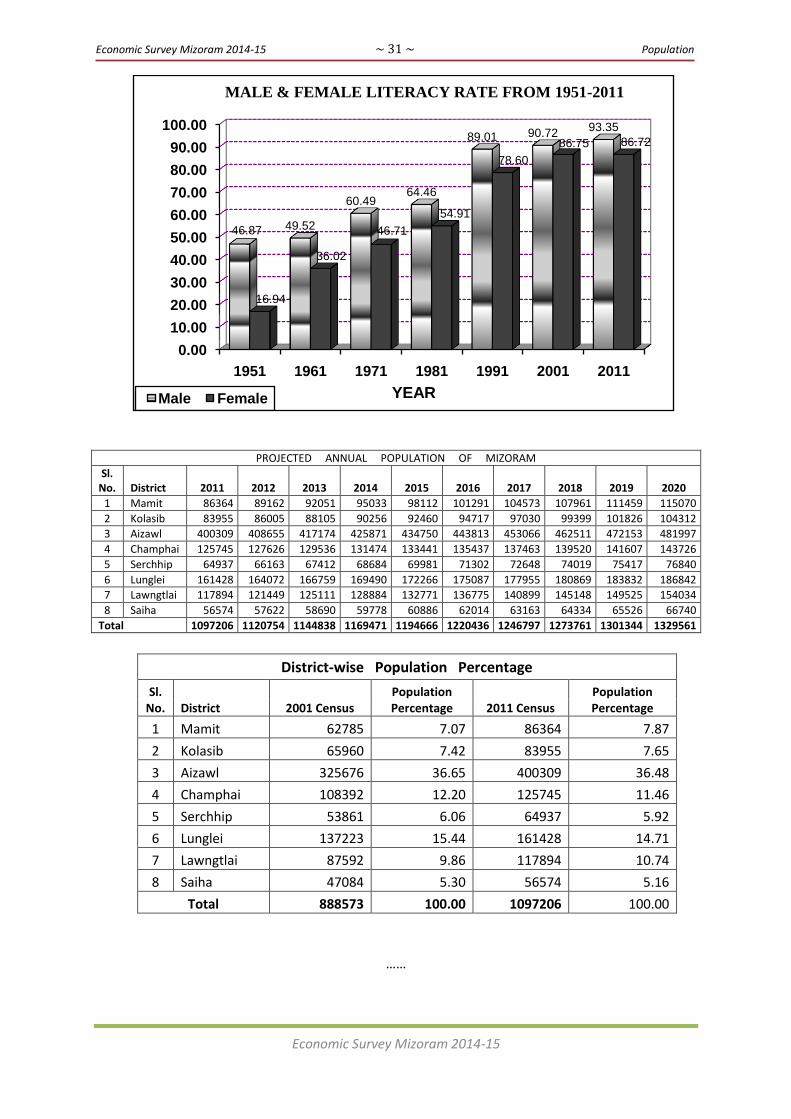
Economic Survey Mizoram 2014-15 ~ 31 ~ Population
Economic Survey Mizoram 2014-15
PROJECTED ANNUAL POPULATION OF MIZORAM
Sl. No. District 2011 2012 2013 2014 2015 2016 2017 2018 2019 2020
1 Mamit 86364 89162 92051 95033 98112 101291 104573 107961 111459 115070
2 Kolasib 83955 86005 88105 90256 92460 94717 97030 99399 101826 104312
3 Aizawl 400309 408655 417174 425871 434750 443813 453066 462511 472153 481997
4 Champhai 125745 127626 129536 131474 133441 135437 137463 139520 141607 143726
5 Serchhip 64937 66163 67412 68684 69981 71302 72648 74019 75417 76840
6 Lunglei 161428 164072 166759 169490 172266 175087 177955 180869 183832 186842
7 Lawngtlai 117894 121449 125111 128884 132771 136775 140899 145148 149525 154034
8 Saiha 56574 57622 58690 59778 60886 62014 63163 64334 65526 66740
Total 1097206 1120754 1144838 1169471 1194666 1220436 1246797 1273761 1301344 1329561
District-wise Population Percentage
Sl. No. District 2001 Census
Population Percentage 2011 Census
Population Percentage
1 Mamit 62785 7.07 86364 7.87
2 Kolasib 65960 7.42 83955 7.65
3 Aizawl 325676 36.65 400309 36.48
4 Champhai 108392 12.20 125745 11.46
5 Serchhip 53861 6.06 64937 5.92
6 Lunglei 137223 15.44 161428 14.71
7 Lawngtlai 87592 9.86 117894 10.74
8 Saiha 47084 5.30 56574 5.16
Total 888573 100.00 1097206 100.00
……
0.00
10.00
20.00
30.00
40.00
50.00
60.00
70.00
80.00
90.00
100.00
1951 1961 1971 1981 1991 2001 2011
46.87 49.52
60.4964.46
89.01 90.7293.35
16.94
36.02
46.71
54.91
78.60
86.75 86.72
YEAR
MALE & FEMALE LITERACY RATE FROM 1951-2011
Male Female

Economic Survey Mizoram 2014-15 ~ 32 ~ Agriculture & Allied- Crop Husbandry
Economic Survey Mizoram 2014-15
VIII. AGRICULTURE AND ALLIED
AGRICULTURE
I. Sectoral Overview:
Paddy continues to remain the
principal food crop and the staple food of
the Mizoram people. Whereas the
minimum Rice requirements of the state per
year is estimated to be about 1,80,000 MT,
the present Rice production is only 58,994
MT per year which could meet only 32% of
its rice requirement. The remaining 68%
has to be imported from outside the State.
Increasing Rice production and
diversification of agriculture farming would
therefore enhance rural livelihood and
reduce poverty in villages and is an
imperative for our food security of the
state.
Agriculture Department has 8
Agriculture Districts, 11 Agriculture Sub
divisions and 56 Agriculture Circles across
the State. Agriculture Department has three
major objectives: (i) To attain self
sufficiency in Food grain; (ii) To attain self
reliance in edible oil production; and (iii)
Prevention of further land degradation and
restoration of productive potential of the
degraded jhum land leading to settled
cultivation practices.
Due to hilly terrain, the available
WRC areas of the state are very limited and
scattered. The studies using Remote
Sensing and Geographical Information
System (GIS) techniques confirmed that
there are 74,644 hectares of area having a
slope of 0-25% for potential WRC area.
The net cultivated area (WRC areas) is only
15,620 hectares and the remaining areas of
59,024 hectares needs to be developed to
make the land suited for crop production to
meet the growing food requirement of the
State.
District-wise availability of WRC Potential & Utilization Status 2013-14 (Area in Ha.)
Sl
No
Name of
District
WRC Potential
Area (in Ha.)
Area under
Cultivation
% utilization
of WRC
Potential
Area need to be
developed
1 Aizawl 4,140 740 17.87 3,400
2 Lunglei 12,797 845 6.60 11,952
3 Saiha 4,284 518 12.09 3,766
4 Champhai 8,697 4384 50.41 4,313
5 Kolasib 9,429 4233 44.89 5,196
6 Serchhip 3,710 2054 55.36 1,656
7 Lawngtlai 11,405 1958 17.17 9,447
8 Mamit 20,182 888 4.40 19,294
Grand Total 74,644 15,620 20.93 59,024
Under infrastructure development,
the expansion of Rice Area was the priority
sector during the 12th
Plan Period. The
marginal increase in WRC Area has been
recorded from 12,700 hectare at the
beginning of 12th
Plan to 15,620 hectares
during 2013-14 which accounts for 23 %
increase. The productivity of Rice under
WRC also increased significantly from 2.00
MT/hectare at the beginning of 12th
Five
Year Plan to 2.10 MT/hectare during 2013-
14.
Under Oil Seed Sector, Oil Palm
cultivation has been taken up at different
districts and an area of 20,377 hectares has
been covered out of total potential area of
Economic Survey Mizoram 2014-15 ~ 33 ~ Agriculture & Allied- Crop Husbandry
Economic Survey Mizoram 2014-15
1,01,000 hectares which accounts for 20.17
% achievement of the target.
Under Farm Mechanisation
programme, 40 nos. of Custom Hiring
Centers @ Rs.9.50 lakh per No are to be
established. Power Tiller subsidy @ Rs.
75,000/- per Power Tiller, Mini Power
Tiller subsidy @ Rs. 50,000/- per No,
Tractor mounted Rotavator, Sugarcane
Crusher, Power Weeder, Water Pumpsets
and Gur Boiling Pans were also arranged to
the farmers.
The area under jhum cultivation has
decreased from 44,947 hectare at the
beginning of 11th
Plan to 22,633 hectares
during 2013-2014 which account for about
50% reduction. The significant reduction in
Jhum area is mainly due to the
implementation of Oil Palm Development
Programme, Sugarcane Cultivation
Programme RKVY, NLUP and Rainfed
Area Development.
II. Department‟s contribution in the
Economy
Majority of the population, more
than 60% of the total population, in
Mizoram depends on the agricultural sector
as it is the biggest source of livelihood
source for rural areas. Various kinds of
crops grown in Mizoram are rice, maize,
pulses, and Oilseeds. The cultivation in the
state is done using Jhumming, WRC and
terraced cultivation methods. Various kinds
of fruits and vegetables such as pineapple,
orange, mangoes, lemons, carrot, lady‘s
finger, cabbage, and pea are also grown in
Mizoram. The agricultural sector
contributes a little more than 14 % to
GSDP.
III. Activities of the Departrment in
the current Fiscal year
1. Rashtriya Krishi Vikas Yojana
(RKVY):
Increased in the total State Plan
fund expenditure towards Agriculture and
Allied sector has made Mizoram eligible to
avail RKVY scheme which is attributed by
the implementation of New Land Use
Policy during 2009-10. In Mizoram,
RKVY scheme has been implemented since
2010-11. Since then, various progressess
and improvement have been made towards
Agriculture, Horticulture, Fisheries, Animal
Husbandry, Dairying, and Sericulture.
During 2014-15, the total fund allocation to
Mizoram under RKVY is Rs. 11392.00
lakh under Production Growth +
Infrastructure & Asset + Flexi fund. A sum
of Rs. 5696.00 lakh is released as 1st
installment and release of 2nd
installment of
Fund is still awaited.
RKVY is being implemented by the
following Departments/Agencies in the
State:
1. Agriculture Department (Crop
Husbandry)
2. Agriculture Department (Research
& Education)
3. Horticulture Department
4. Animal Husbandry & Veterinary
Department
5. Fisheries Department
6. Soil & Water Conservation
Department
7. Sericulture
8. MIFCO
9. Lai Autonomous District Council
10. Mara Autonomous District Council
11. Chakma Autonomous District
Council

Economic Survey Mizoram 2014-15 ~ 34 ~ Agriculture & Allied- Crop Husbandry
Economic Survey Mizoram 2014-15
Abstract of Financial Project Proposal under Normal RKVY (Production Growth &
Infrastructure & Assets, Flexi Fund and Special Schemes) during 2014-15
(Rupees in crore)
Sl.
No
Name of Department Production
Growth
Infrastructure
& Assets
Flexi
Fund
Special
Schemes
Total
1. Agriculture (CH) 16.24 7.84 5.92 - 30.00
2. Agriculture (R&E) 1.50 4.00 1.25 - 6.75
3. AH & Vety 5.00 5.00 1.25 5.00 16.25
4. Horticulture 6.00 5.00 1.25 2.00 14.25
5. Sericulture 6.00 4.92 1.00 - 11.92
6. Fisheries 3.00 4.88 1.25 3.50 12.63
7. MIFCO 1.31 - - - 1.31
8. Soil & Water Conservation - 7.11 1.00 - 8.11
9 Autonomous Dist. Councils:
a) LADC 2.18 3.00 - - 5.18
b) MADC 2.23 2.00 - - 4.23
c) CADC 1.79 1.50 - - 3.29
Grand Total : 45.25 45.25 12.92 10.50 113.92
2. National Food Security Mission
(NFSM):
In Mizoram, NFSM has been
implemented since 2012-13 covering only
Rice crop for two consecutive years (i.e
2012-13 & 2013-14). Since 2014-15, with
the modification of the Guideline, NFSM
scheme now covers Rice, Pulses and
Coarse Cereals.
Objectives of NFSM:
Increasing production of rice, wheat,
pulses and coarse cereals through area
expansion and productivity
enhancement in a sustainable manner
in the identified districts of the
country;
Restoring soil fertility and
productivity at the individual farm
level; and
Enhancing farm level economy (i.e.
farm profits) to restore confidence
amongst the farmers.
Implementation of NFSM in Mizoram:
There is a tremendous improvement
in Crop production especially in Rice due
to the implementation of NFSM since
2012-13. Dissemination of improved
technology through cluster demonstration,
imparting knowledge on crop cultivation
technology among farmers through
cropping system based training and supply
of critical inputs like improved
seeds/hybrid seeds, micronutrients and
plant protection chemicals are the main
contributing factors for crop production
improvement in the State. During 2014-15,
the following districts are covered under
NFSM:
District NFSM District
NFSM-Rice NFSM-Pulses NFSM-Coarse Cereals
Aizawl -
Lunglei
Saiha -
Champhai
Kolasib
Serchhip
Lawngtlai
Mamit

Economic Survey Mizoram 2014-15 ~ 35 ~ Agriculture & Allied- Crop Husbandry
Economic Survey Mizoram 2014-15
During 2014-15, Rs. 707.70 lakh is
allocated to Mizoram for implementation of
NFSM.
3. National Mission for Sustainable
Agriculture (NMSA)
a. Introduction
Sustaining agricultural productivity
depends on quality and availability of
natural resources like soil and water.
Agricultural growth can be sustained by
promoting conservation and sustainable use
of these scarce natural resources through
appropriate location specific measures.
Indian agriculture remains predominantly
rainfed covering about 60% of the
country‘s net sown area and accounts for
40% of the total food production. Thus,
conservation of natural resources in
conjunction with development of rainfed
agriculture holds the key to meet
burgeoning demands for foodgrain in the
country. Towards this end, National
Mission for Sustainable Agriculture
(NMSA) has been formulated for
enhancing agricultural productivity
especially in rainfed areas focusing on
integrated farming, water use efficiency,
soil health management and synergizing
resource conservation.
NMSA derives its mandate from
Sustainable Agriculture Mission which is
one of the eight Missions outlined under
National Action Plan on Climate Change
(NAPCC). The strategies and programme
of actions (POA) outlined in the Mission
Document, that was accorded ‗in principle‘
approval by Prime Minister‘s Council on
Climate Change (PMCCC) on
23.09.2010,aim at promoting sustainable
agriculture through a series of adaptation
measures focusing on ten key dimensions
encompassing Indian agriculture namely;
‗Improved crop seeds, livestock and fish
cultures‘, ‗Water Use Efficiency‘, ‗Pest
Management‘, ‗Improved Farm Practices‘,
‗Nutrient Management‘, ‗Agricultural
insurance‘, ‗Credit support‘, ‗Markets‘,
‗Access to Information‘ and ‗Livelihood
diversification‘. During XII Five Year Plan,
these measures are being embedded and
mainstream ongoing/proposed Missions/
Progammes/Schemes of Dept. of
Agriculture &Cooperation (DAC) through
a process of restructuring and convergence.
NMSA architecture has been designed by
converging, consolidating and subsuming
all ongoing as well as newly proposed
activities/programmes related to sustainable
agriculture with a special emphasis on soil
& water conservation, water use efficiency,
soil health management and rainfed area
development. The focus of NMSA will be
to infuse the judicious utilization of
resources of commons through community
based approach.
NMSA will cater to key dimensions
of ‗Water use efficiency‘, ‗Nutrient
Management‘ and ‗Livelihood
diversification‘ through adoption of
sustainable development pathway by
progressively shifting to environmental
friendly technologies, adoption of energy
efficient equipments, conservation of
natural resources, integrated farming, etc.
Besides, NMSA aims at promoting location
specific improved agronomic practices
through soil health management, enhanced
water use efficiency, judicious use of
chemicals, crop diversification, progressive
adoption of crop-livestock farming systems
and integrated approaches like crop-
sericulture, agro-forestry, fish farming, etc.
b. Objectives
NMSA has the following
objectives:
To make agriculture more
productive, sustainable,
remunerative and climate resilient
by promoting location specific
Integrated/Composite Farming
Systems;
To conserve natural resources
through appropriate soil and
moisture conservation measures;
To adopt comprehensive soil health
management practices based on soil
fertility maps, soil test based
Economic Survey Mizoram 2014-15 ~ 36 ~ Agriculture & Allied- Crop Husbandry
Economic Survey Mizoram 2014-15
application of macro & micro
nutrients, judicious use of fertilizers
etc.;
To optimize utilization of water
resources through efficient water
management to expand coverage for
achieving ‘more crop per drop’;
To develop capacity of farmers &
stakeholders, in conjunction with
other on-going Missions e.g.
National Mission on Agriculture
Extension & Technology, National
Food Security Mission, National
Initiative for Climate Resilient
Agriculture (NICRA) etc., in the
domain of climate change
adaptation and mitigation measures;
To pilot models in select blocks for
improving productivity of rainfed
farming by mainstreaming rainfed
technologies refined through
NICRA and by leveraging resources
from other schemes/Missions like
Mahatma Gandhi National Rural
Employment Guarantee Scheme
(MGNREGS), Integrated
Watershed Management
Programme (IWMP), RKVY etc.;
and
To establish an effective inter and
intra Departmental/Ministerial co-
ordination for accomplishing key
deliverables of National Mission for
Sustainable Agriculture under the
aegis of NAPCC.
c. Mission Interventions:
NMSA has following four (4) major
programme components or activities:
Rainfed Area Development
(RAD)
On Farm Water Management
(OFWM)
Soil Health Management (SHM)
Climate Change and Sustainable
Agriculture: Monitoring,
Modeling and Networking
(CCSAMMN)
4. NLUP:
The overall economic impact on the
Agriculture Sector as a result of the
Implementation of New Land Use Policy
(NLUP) can be briefly summarized as
below: -
1) Expansion of rice cultivation
areas:
As per the report of MIRSAC,
Science & Technology, Planning
Department, Government of Mizoram,
Aizawl, 2008, the total available potential
area for WRC is 74,644 hectare. During the
year 2010-2011 (initial stage of NLUP
implementation), the total area under Rice
cultivation (WRC) is 12130 hectare which
covers only 16.25% of the total Rice
cultivation potential areas.
During the year 2013-2014, the total
Rice cultivation area (WRC) is recorded as
16170 hectare which accounts for about
33% increase and similarly the utilization
of WRC potential area also increase to
21.67% as compared to 16.25 % during
2010-2011.
The contribution of NLUP in the
field of expansion of Rice cultivation area
is a notable achievement. Under 1st phase
of NLUP, there are 3345 nos. of WRC
families and the total rice cultivation areas
before the implementation of NLUP is
1516.92 hectare. During the year 2013-
2014, (4 years after the implementation of
NLUP) the total rice cultivation areas of the
NLUP WRC families is recorded as
3357.58 hectare i,e, the increase in rice
cultivation area as compared to the year
2010-2011 is 1840.66 hectare.
Therefore, it may be stated that the
contribution of NLUP in terms of
expansion of Rice cultivation areas is about
1840.66 hectare out of the total rice
cultivation areas of 16170 hectare during
2013-2014 (whole of Mizoram) which
accounts for about 11.38% increase in Rice
cultivation areas.
2) Increase in Rice Production:
Economic Survey Mizoram 2014-15 ~ 37 ~ Agriculture & Allied- Crop Husbandry
Economic Survey Mizoram 2014-15
At the initial stage of the
implementation of NLUP (2010-2011), the
total rice production in Mizoram was 47201
metric tones which increased to 58994
metric tones in 2013-14. The increase in
rice production is therefore 11793 metric
tones which accounts for about 24.98%
increase.
Under the 1st phase of NLUP, there
are 5295 nos. of beneficiaries (both WRC-I
and WRC-II) whose production of rice is
recorded as 3858.47 metric tones. After 4
years of implementation of NLUP (2013-
14), it is observed that the total rice
production of 5295 beneficiaries increased
to 5317.10 metric tones which shows that
the increase in rice production by NLUP
beneficiaries is 1458.63 metric tones which
accounts for about 27.43% increase.
It may therefore be concluded that
out of the total rice production in Mizoram
i.e., 58994 metric tones (2013-2014),
NLUP beneficiaries contributed 5317.10
metric tones of rice and the total percentage
of the contribution of NLUP towards the
total rice production in Mizoram state may
be recorded as 9% increase from the 1st
phase of implementation alone.
3) Decrease in Jhum Areas:
One of the primary objectives of
NLUP is to provide sustainable income to
farming families by weaning away the
destructive and unprofitable shifting
cultivation practices. The total Jhum area
and the total number of Jhumia families in
Mizoram during 2010-11 are 28562 hectare
and 68433 nos. respectively.
As a result of the implementation of
NLUP, the total Jhum area as recorded
during 2013-2014 is 22633 hectare which
shows that the decrease in Jhum area for
the last 4 (four) years is 5929 hectare which
accunts for about 20.75 % decrease in Jhum
areas.
Similarly, the total number of
Jhumia families also decreased from 68433
nos. during 2010-2011 to that of 58751 nos.
during 2012-2013 which accounts for about
14% decrease during the last 4(four) years.
4) Expansion in Oil Palm cultivation
areas:
Out of the total geographical area of
Mizoram i.e, 21, 08,700 hectare, the total
potential area for Oilpalm cultivation is
recorded as 1, 01,000 hectare (as
recommended by Chadha Committee and
Rathinam Committee). During the year
2010-2011, the total Oil palm cultivation
area in Mizoram was only 1878 hectare
which constitutes only about 1.8% of the
total Oil palm potential areas.
During the year 2013-2014, the total
area covered under Oil palm in Mizoram is
17588 hectare. Under NLUP, the total
number of Oil palm beneficiaries till date is
2290 nos. and the total area covered under
Oil palm is recorded as 2750 hectare.
It may be concluded that out of the
total area covered under Oil palm in
Mizoram i.e, 17588 hectare, the
contribution of Oil palm beneficiaries is
about 2750 hectare which accounts for
about 15.60% since the inception of NLUP.
5) Improvement in Farm
Mechanization Programme:
Due to convergence of RKVY &
MMA with NLUP, a large number of Farm
Machineries like Power Tillers, Mini Power
Tillers were distributed at subsidized rates
which increase the availability of man
power thus boosting up rice production and
productivity.
6) Construction of Potential Area
Connectivity:
Due to the convergence of NLUP
with RKVY Scheme, at present the total
length of Potential Area Connectivity
(PAC) already constructed is 625 km. This
will also greatly result in increase in the
production of rice and other crops in one
way or the other.

Economic Survey Mizoram 2014-15 ~ 38 ~ Agriculture & Allied- Crop Husbandry
Economic Survey Mizoram 2014-15
5. National Mission on Oil Seed and
Oil Palm (NMOOP):
During 2014-15, Mizoram has been
included under Mini Mission-II & III.
However, due to certain technical
problems, only MM-II is implemented by
the State through Agriculture Department
(CH).
Funding Pattern and Fund Flow: Cost of the interventions proposed
under the Mission will be in the ratio of
75:25 between the Central and the State
Government.
As per the guidelines of Ministry of
Finance, 10% of the Plan budget of
NMOOP would be earmarked as flexi-fund
to meet the following objective:
Annual Action Plan of MM-II (Oil Palm)
under NMOOP for 2014-15.
The Annual Action Plan for 2014-
15 under NMOP has been finalized and
submitted to the Ministry of Agriculture for
consideration and approval. Details are as
given below:
i) Area proposed for Oil Palm
Cultivation for next three years
from 2014-15 to 2016-17 (in Ha.)
Sl. No. Year Area (in Ha.)
1. 2014-15 5700
2. 2015-16 5400
3. 2016-17 4600
ii) Nos./Name of Disricts to be
covered:
Aizawl
Lunglei
Mamit
Kolasib
Serchhip
Lawngtlai
Saiha
New Schemes Introduced w.e.f. 2014-15:
National Mission on Agriculture
Extension and Technology:
The Government of India has
approved National Mission on Agriculture
Extension and Technology on 3rd
March,
2014 for implementation during 12th
Plan.
The following are some of the salient
features of the Mission.
Agricultural Technology, including
the adoption/promotion of critical inputs,
and improved agronomic practices were
being disseminated under 17 different
schemes of the Department of Agriculture
& Cooperation during the 11th Plan. The
Modified Extension Reforms Scheme was
introduced in 2010 with the objective of
strengthening the extension machinery and
utilizing it for synergizing the interventions
under these schemes under the umbrella of
Agriculture Technology Management
Agency (ATMA). NMAET has been
envisaged as the next step towards this
objective through the amalgamation of
these schemes. National Mission on
Agricultural Extension and Technology
(NMAET) consists of 4 Sub Missions:
(i) Sub Mission on Agricultural
Extension (SMAE).
(ii) Sub-Mission on Seed and Planting
Material (SMSP).
(iii) Sub Mission on Agricultural
Mechanization (SMAM).
(iv) Sub Mission on Plant Protection
and Plant Quarantine (SMPP).
While four separate Sub-Missions
are included in NMAET for administrative
convenience, on the ground these are
Executive Summary of inextricably linked
to each other. The common threads running
across all 4 Sub-Missions are Extension &
Technology. Seeds, pesticides and
machinery are three important agricultural
inputs whose technological and economic
significance needs to be disseminated to all
the farmers through efficacious extension
machinery. However, besides the core
component of ensuring easy availability of
these key inputs (i.e. Seeds, Pesticides and
Machinery) at reasonable prices, there will
be a subject specific capacity building
element built in the latter three Sub-

Economic Survey Mizoram 2014-15 ~ 39 ~ Agriculture & Allied- Crop Husbandry
Economic Survey Mizoram 2014-15
Missions as well. Agricultural extension
and technology have to go hand in hand
and that is the genesis of the National
Mission on Agricultural Extension and
Technology.
The aim of the Mission is to
restructure & strengthen agricultural
extension to enable delivery of appropriate
technology and improved agronomic
practices to the farmers. This is envisaged
to be achieved by a judicious mix of
extensive physical outreach & interactive
methods of information dissemination, use
of ICT, popularisation of modern and
appropriate technologies, capacity building
and institution strengthening to promote
mechanisation, availability of quality seeds,
plant protection etc. and encourage the
aggregation of farmers into Interest
Groups (FIGs) to form Farmer Producer
Organizations (FPOs).
SMAE: Sub-Mission on
Agricultural Extension will focus on
awareness creation and enhanced use of
appropriate technologies in agriculture &
allied sectors. Gains made in the past will
be consolidated and strengthened through
increased penetration of extension
functionaries. Personnel trained under
Agri-Clinics and Agri-Business Centres
Scheme (ACABC) and Diploma in
Agriculture Extension Services for Input
Dealers (DAESI) will also provide
extension services to the farmers. Use of
interactive and innovative methods of
information dissemination like pico
projectors, low cost films, handheld
devices, mobile based services, Kisan Call
Centres (KCCs) etc. will be used and
convergence brought among extension
efforts under different programmes and
schemes at village level through the
institution of ATMA (Agriculture
Technology Management Agency) and
Block Technology Teams (BTTs).
SMSP: Adoption of quality seeds is
the most cost effective means for
increasing agricultural production and
productivity. The interventions included in
the Sub-Mission will cover the entire
gamut of seed chain from nucleus seed to
supply to farmers for sowing and also to
the major stakeholders in the seed chain
and also provide for support for
infrastructure to create an enabling
environment for development of the Sector.
SMSP also envisages strengthening of
Protection of Plant Varieties and Farmers‘
Rights Authority (PPV&FRA) in order to
put in place an effective system for
protection of plant varieties, rights of
farmers and plant breeders and to
encourage development of new varieties of
plants.
SMAM: There is a strong co-
relation between farm power availability
and agricultural productivity. Therefore,
Sub-Mission on Agricultural
Mechanization will focus on farm
mechanization. The Sub-Mission will
mainly cater to the needs of the small and
marginal farmers through institutional
arrangements such as custom hiring,
mechanization of selected villages, subsidy
for procurement of machines &
equipments, etc.
SMPP: Sub-Mission on Plant
Protection included in NMAET envisages
increase in agricultural production by
keeping the crop disease free using
scientific and environment friendly
techniques through promotion of Integrated
Pest Management. Strengthening and
Modernization of Pest Management
Approach aims at this vital aspect of Plant
Protection and also covers regulatory
requirements of pesticides. The component
on Strengthening & Modernization of Plant
Quarantine facilities in India is regulatory
in nature with the aim of preventing
introduction and spread of exotic pests that
are harmful to crops by
regulating/restricting import of plant/plant
products. Monitoring pesticide residues in
food commodities and environmental
samples is also included in this Sub-
Economic Survey Mizoram 2014-15 ~ 40 ~ Agriculture & Allied- Crop Husbandry
Economic Survey Mizoram 2014-15
Mission. The component on National
Institute of Plant Health Management
(NIPHM) will promote environmentally
sustainable Plant Health Management
practices in diverse and changing agro-
climatic conditions, pesticide management,
and Bio-security through capacity building
programmes. Farmers‘ skill trainings and
field extension as contained in all 4 Sub
Missions of NMAET (Viz. SMSP, SMAE,
SMAM and SMPP) will be converged with
similar farmer-related activities going on
through ATMA. Five-tiered modes of
extension carried out in broadcast or
interactive electronic modes will also cut
across extension activities in all the four
Sub Missions. Mutually synergetic linkages
will be established among various activities
instead of unilaterally mandating that all
such farmer-centric activities will be
carried out through ATMA.
IV. Outcome of the Department‟s
activities so far and Expected
Outcome:
During 2013-2014, the area under
paddy cultivation was 38,803 hectares. It
occupies only 27.13 % of the total cropped
area and about 17.87 % of the area is under
oilseeds and pulses including Sesamum,
Soyabean, Mustard, Oilpalm. The
remaining 55.00% are under horticultural
crops including vegetables, spices,
plantation and other miscellaneous crops.
The practice of Jhuming is still
prevalent among many farmers in the state
and in spite of the efforts given by the State
government to bring more areas under
settled cultivation through many
interventions, as is evident from the Rice
production pattern during 2013-14, more
than 50 % of the total Rice production is
contributed from Jhum areas. As such, it is
proposed to incentivize the farmers through
Improved cultivation of Rice on Hill
slopes/Improved Jhum cultivation wherein
subsidy assistance on critical inputs like
improved seed, fertilizers, PP chemicals,
Herbicides etc. will be provided which will
result in higher production and
productivity.
The area under jhum cultivation has
declined from 24,706 hectare during 2012-
13 to 22,633 hectares during 2013-2014
which account for about 8.40% reduction.
The reduction in jhum cultivation area is
mainly due to the implementation of New
Land Use Programme (NLUP), RKVY, Oil
Palm Development Programme and
Sugarcane Cultivation Programme.
The marginal increase in WRC
Area has been recorded from 14,330
hectare during 2012-13 to 15,620 hectare
during 2013-14 which accounts for 9 per
cent increase.
The productivity of Rice under
WRC has been raised to 2.00 MT/ hectare
from the level of 2.10 MT/hectare during
2013-14. Increase in productivity per
hectare may be attributed due to adoption
of SRI and increase in availability of Farm
Power through the heavy subsidy of Power
Tillers and Tractors.
To attain self sufficiency in Food
grain, it is targeted to produce at least 60 %
of the Rice requirement of the state by
adopting improved production
technologies, farm mechanization etc.
Narrowing the gap between demand
and supply of food grain, expansion of Rice
area through On-Farm development works
in plain area and Terraces on Hill slopes
will be prioritized for increasing in Net area
cultivation.
It is proposed to develop additional
10,000 hectares of area for Rice cultivation
in plain area under RKVY schemes etc.
Additional 10,000 hectares will also
be created for Rice cultivation on the hill
side slopes under NLUP and RKVY
schemes etc which will result in further
reduction of jhum area.
About 15,620 hectares of existing
WRC area will be improved and renovated
to facilitate Farm Mechanization, assured
irrigation, seed replacement rate, higher
consumption of fertilizers, increase in
cropping intensity which will result in
higher production and productivity.
Expected Outcome:
Economic Survey Mizoram 2014-15 ~ 41 ~ Agriculture & Allied- Crop Husbandry
Economic Survey Mizoram 2014-15
1. At the end of the 12th
Five year Plan
22,000 ha. of WRC will be available for
rice cultivation.
2. The jhum area is expected to decline
from 25,826 hectare to 12,900 hectare
at the end of 12th
Plan which will
account for 50% further reduction.
3. The area under SRI will be increased
from 2000 ha to 10,000 ha with
expected increase in productivity from
2.10MT to 3.00MT/ha.
4. The area under improved package of
practices will be increased from 3000
ha. to 10,000 ha. with expected increase
in productivity of 2.5MT/ha.
5. The availability of farm power will be
increased from 0.85 to 1.5KW per ha.
6. The area under rabi/summer crops such
as rice, oilseeds and pulses will be
increased from 2,726 hectare in the 11th
Plan to 5,000 hectare at the end of 12th
Plan. This increase in area is attributed
to creation of irrigation potential
through water harvesting, check dam
etc.
7. Estimated production of Rice at the end
of 12th
Plan is 80,000 MT per year
which could meet 40 % of the state
Rice requirement.
8. At the end of the 12th
Five Year Plan
additional area of 25,000 ha will be
under Oil Palm cultivation
9. Estimated production of FFB of Oil
Palm at the end of 12th
Plan is 1,35,000
MT with a value of about Rs.100
crores.
V. Policy Constraints required to be
addressed:
Low consumption of fertilizers: The
current fertilizer consumption of the state is
62.00 kg/ha. which is far below the
National average of 112.30 kg/ha.
Low seed replacement rate: To get a
bumper harvest, new and improved variety
need to be introduced. Till date, the seed
replacement rate on self pollinated crops
like Rice is only 30 %, 40% in cross-
pollinated crops (Maize) whereas the
desired rate of seed replacement to get
higher production is 33% in self-pollinated
crops (Rice etc), 50% in cross-pollinated
crops (Maize) and 100% in hybrid seeds.
Low availability of Farm Power: The
National average of Farm Power
availability is about 1.25kW/ hectare
whereas in case of the state, it is only
0.85kW/ha.
Lack of infrastructure: Due to hilly terrain
and undulating topography, most of the
potential farm areas all over the state are
not easily accessible. Unless good approach
farm roads like Potential Area Connectivity
is developed, maximum utilization of these
fertile lands for crop production cannot be
achieved.
Marginal land holding: Majority of the
land holding is small which is one of the
factors that effects Agricultural crop
production. Often, farmers engaged in
Agriculture were poorer people and unable
to develop the land to make it suited for
farming.
Poor market infrastructure: Poor market
infrastructure and lack of awareness among
the farmers in respect of market linkage
information and enforcement of APMC act
Lack of assured irrigation: Although
Mizoram receives sufficient rain water
during Monsoon, due to lack of water
harvesting structures, only few fertile areas
can be brought under cultivation during
Rabi season.
…….

Economic Survey Mizoram 2014-15 ~ 42 ~ Agriculture & Allied- Minor Irrigation
Economic Survey Mizoram 2014-15
MINOR IRRIGATION
1. Sectoral Overview:
Mizoram receives good monsoon
rains and the average monthly rainfall
during the last twenty eight years is given
in the following table:
Even with this much of annual
rainfall, irrigation is still indispensable due
to uneven seasonal distribution of rainfall
as illustrated in the following pie chart:
SEASONAL DISTRIBUTION OF
RAINFALL (1986 - 2013)
Since rainfall alone is not able to
maintain standing water required for wet
rice cultivation, irrigation is indispensable
for wet rice cultivation; therefore, it is a
fact that works on irrigation had been
started as early as when WRC was first
introduced in Champhai and North
Vanlaiphai areas during the first part of the
20th
century.
Irrigation was implemented as a
scheme from the year 1974-75 when Minor
Irrigation Scheme was included in the
Annual Plan of Agriculture Department.
Works on Minor Irrigation Scheme were
implemented by way of granting 50% of
the total cost to individuals or groups of
beneficiaries as grant-in-aid subsidy while
beneficiaries bear the remaining 50% of the
cost. This practice continued to be the
modus operandi till 1983-84 when
Government of Mizoram decided to take up
Minor Irrigation Schemes on project basis
bearing full project cost like the way it is
implemented now.
Minor Irrigation Wing was
established with one division and two sub-
divisions in the Directorate of Agriculture
in September 1984. Minor Irrigation Wing
started functioning with separate Annual
Plan and Budget from the year 1985-86;
since then there had been incremental
increase in the establishment and annual
plan outlay. By the time Minor Irrigation
Wing was separated from Agriculture
Department and upgraded into Department
Aizawl Champhai Kolasib Mamit Serchhip Lunglei Lawngtlai Saiha
Jan 11.00 10.94 9.00 9.80 5.90 6.20 10.30 11.70 9.36
Feb 27.60 20.17 36.60 14.60 20.90 15.30 18.10 24.10 22.17
Mar 99.60 71.65 101.40 86.60 81.60 61.60 47.20 46.70 74.54
Apr 191.40 127.05 215.50 236.80 116.10 110.60 116.70 103.80 152.24
May 373.70 250.39 342.10 451.00 330.10 309.40 327.60 371.40 344.46
Jun 449.50 355.50 431.10 432.20 426.30 462.50 474.30 457.10 436.06
Jul 519.60 374.88 463.70 397.20 405.60 466.00 482.80 434.40 443.02
Aug 557.60 392.01 514.70 529.10 395.00 462.60 389.70 450.10 461.35
Sep 529.50 400.53 444.90 480.30 330.10 417.80 350.70 398.10 418.99
Oct 295.50 234.03 218.40 309.60 184.80 225.60 206.80 230.30 238.13
Nov 67.30 62.24 36.70 26.00 62.80 46.70 53.00 71.40 53.27
Dec 29.30 19.98 19.90 9.20 21.60 12.20 5.80 12.20 16.27
Total 3151.60 2319.37 2834.00 2982.40 2380.80 2596.50 2483.00 2611.30 2669.87
MonthDistrict-wise average monthly rainfall (1986 - 2013)
Mizoram
Kharif (June-Oct)
74.82%
Rabi (Nov-Feb),
3.79%Summer (March-May),
21.40%

Economic Survey Mizoram 2014-15 ~ 43 ~ Agriculture & Allied- Minor Irrigation
Economic Survey Mizoram 2014-15
of Minor Irrigation in 30th
May, 2007, there
are four work divisions and nine sub-
divisions. The Department was
strengthened and re-structured into full-
fledged engineering department in October,
2008. The department is now headed by
Chief Engineer supported by two
Superintending Engineers and five
Executive Engineers in the headquarters; in
the fields, there are four working divisions
with ten sub-divisions.
Minor Irrigation Department is
implementing three schemes, namely,
Minor Irrigation Scheme, Command Area
Development & Water Management
Scheme and Anti Erosion Scheme.
Minor Irrigation Schemes:
Minor Irrigation Schemes provides
scopes for construction of project approach
roads, water harvesting structures and/or
diversion weir, irrigation channel, field
channel, field drains, farm road and land
leveling & shaping. The source of funding
is Accelerated Irrigation Benefits
Programme (AIBP) under which 90% of
the project cost is received from
Government of India as Central Assistance
and 10% as State Share.
Command Area Development & Water
Management Programme:
To enhance utilization of created
potentials, development of command areas
in completed minor irrigation projects is
taken up under Command Area
Development & Water Management
Programme. 50% Central Grant and 50%
State Share and the mode of release of fund
is two installments during a year.
Anti Erosion Schemes under Flood
Management Programme:
To control and manage erosion due
to heavy rain and long monsoon season and
check further damage to the agricultural
field, Anti-erosion scheme is taken up by
the department. The funding pattern of
Flood Management Programme under
AIBP is 70% Central Grant and 30% State
Share and the mode of release of fund is
two installments during a year.
Participation of project beneficiaries
has assumed vital role in successful
implementation of Minor Irrigation
Schemes in Mizoram. To enhance sense of
ownership and responsibilities, prospective
beneficiaries are involved right from the
stage of project formulation to post-project
management after completion of the
project. In fact, participations of project
beneficiaries promote transparency of
minor irrigation schemes.
Prospective project beneficiaries are
involved in the process of project
formulation through their active
participation in survey & investigation and
assessment of their development needs
which may be covered by minor irrigation
scheme within the prevailing norms and
guidelines. For taking up new project, due
care and consideration to identify
development needs and aspirations of the
farmers are taken by having joint field
visits and series of discussions and
interactions with the prospective project
beneficiaries before preparation and
finalization of DPR.
Water Users Associations are
formed once the project beneficiaries are
identified and they extend active
participation in supervision of works during
the stage of project implementation.
On completion of the projects,
Water Users Associations share the
responsibilities of operation & maintenance
of irrigation structures - while Water Users
Association assume the responsibilities of
operation of irrigation structures and
allotment of irrigation water, Minor
Irrigation Department execute works on
repairs and reconstruction of damaged
irrigation structures with active
participation and contribution from the
project beneficiaries in the form of labour.
A number of completed Minor Irrigation
Projects have been formally handed over to
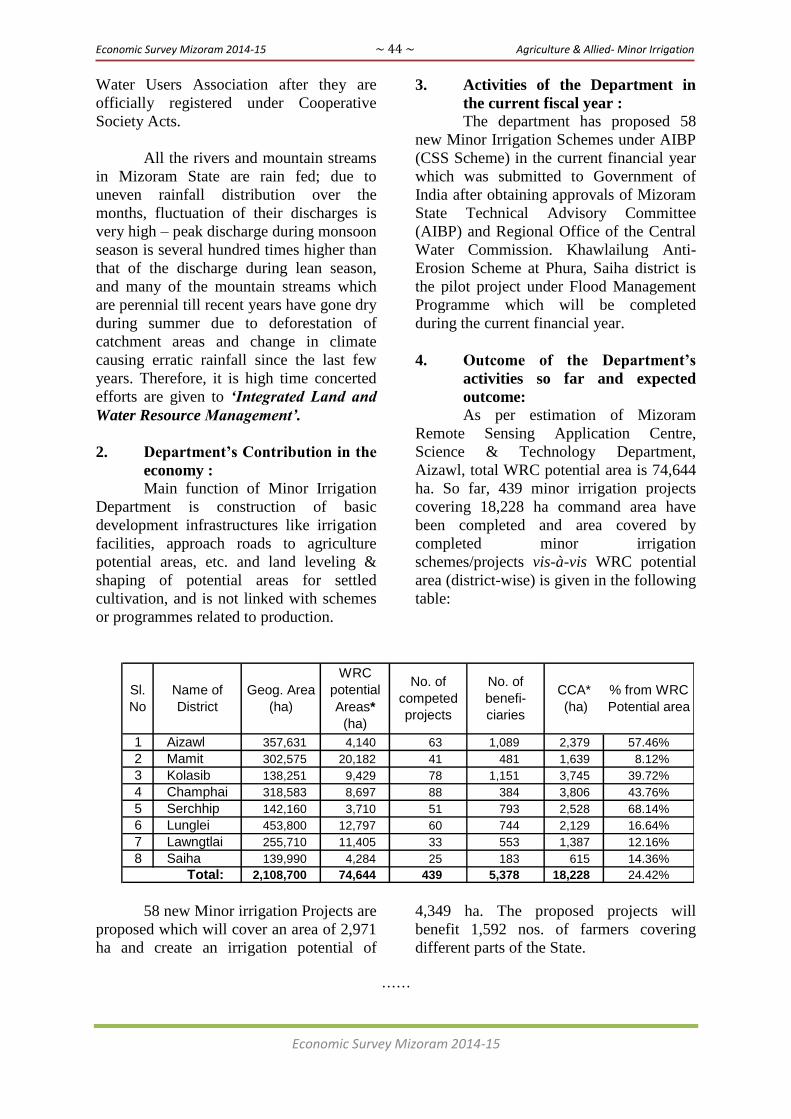
Economic Survey Mizoram 2014-15 ~ 44 ~ Agriculture & Allied- Minor Irrigation
Economic Survey Mizoram 2014-15
Water Users Association after they are
officially registered under Cooperative
Society Acts.
All the rivers and mountain streams
in Mizoram State are rain fed; due to
uneven rainfall distribution over the
months, fluctuation of their discharges is
very high – peak discharge during monsoon
season is several hundred times higher than
that of the discharge during lean season,
and many of the mountain streams which
are perennial till recent years have gone dry
during summer due to deforestation of
catchment areas and change in climate
causing erratic rainfall since the last few
years. Therefore, it is high time concerted
efforts are given to „Integrated Land and
Water Resource Management‟.
2. Department‟s Contribution in the
economy :
Main function of Minor Irrigation
Department is construction of basic
development infrastructures like irrigation
facilities, approach roads to agriculture
potential areas, etc. and land leveling &
shaping of potential areas for settled
cultivation, and is not linked with schemes
or programmes related to production.
3. Activities of the Department in
the current fiscal year :
The department has proposed 58
new Minor Irrigation Schemes under AIBP
(CSS Scheme) in the current financial year
which was submitted to Government of
India after obtaining approvals of Mizoram
State Technical Advisory Committee
(AIBP) and Regional Office of the Central
Water Commission. Khawlailung Anti-
Erosion Scheme at Phura, Saiha district is
the pilot project under Flood Management
Programme which will be completed
during the current financial year.
4. Outcome of the Department‟s
activities so far and expected
outcome:
As per estimation of Mizoram
Remote Sensing Application Centre,
Science & Technology Department,
Aizawl, total WRC potential area is 74,644
ha. So far, 439 minor irrigation projects
covering 18,228 ha command area have
been completed and area covered by
completed minor irrigation
schemes/projects vis-à-vis WRC potential
area (district-wise) is given in the following
table:
1 Aizawl 357,631 4,140 63 1,089 2,379 57.46%
2 Mamit 302,575 20,182 41 481 1,639 8.12%
3 Kolasib 138,251 9,429 78 1,151 3,745 39.72%
4 Champhai 318,583 8,697 88 384 3,806 43.76%
5 Serchhip 142,160 3,710 51 793 2,528 68.14%
6 Lunglei 453,800 12,797 60 744 2,129 16.64%
7 Lawngtlai 255,710 11,405 33 553 1,387 12.16%
8 Saiha 139,990 4,284 25 183 615 14.36%
2,108,700 74,644 439 5,378 18,228 24.42%
% from WRC
Potential area
No. of
benefi-
ciaries
No. of
competed
projects
Total:
Sl.
No
Name of
District
Geog. Area
(ha)
WRC
potential
Areas*
(ha)
CCA*
(ha)
58 new Minor irrigation Projects are
proposed which will cover an area of 2,971
ha and create an irrigation potential of
4,349 ha. The proposed projects will
benefit 1,592 nos. of farmers covering
different parts of the State.
……
Economic Survey Mizoram 2014-15 ~ 45 ~ Agriculture & Allied - Horticulture
Economic Survey Mizoram 2014-15
HORTICULTURE
I. Sectoral Overview:
Owing to the fact that more than
70% of the State population depends on
land based activities for their livelihoods,
horticulture plays a vital role and occupies
very important place in the economy of
Mizoram thus having large chunk of
contributions to the State Gross Domestic
Products. Because of its advantageous
agro-climatic condition, hilly terrain nature
of the landscape and well distributed
rainfall during monsoon season horticulture
is the only sustainable land based
activities/industries for development of the
State economy. As such, Horticulture
Department implements various
developmental schemes with the following
objectives to achieve sustainable economic
development of the State: —
a) Uplift the economy of the farming
communities through cultivation of
sustainable horticulture crops.
b) Increase area, production and
productivity of horticulture crops in
the State with latest technologies
and adopt cluster area approach and
cultivation at commercial scale for
market surplus production.
c) Settlement of Jhumia families to
permanent cultivation with
intensive farming practices.
d) To ensure availability of quality
inputs like improved planting
materials, fertilizers and manures,
plant protection materials by
improving and strengthening
delivery system.
e) Promotion of protected cultivation
along with supporting infrastructure
for quality production of high value
crops all round the year.
f) Promotion of INM through vermi-
composting, popularization of bio-
fertilizers in addition to judicious
and balanced nutrients to crops.
g) Promotion of micro-irrigation for
efficient management and delivery
of required quantities of water as
per crop needs.
h) Promotion of mechanization
conducive to hill farming by
providing equipment and
implements to reduce labour.
i) Create water harvesting structure
potential for irrigation and to
augment ground water.
j) Human resource development
through capacity building of
departmental staff and skill
development of farmers through
transfer of technology.
II. Department‟s contribution in the
economy (Role of the Sector):
Under Horticulture sector, the main
contributing factor towards GSDP is Fruit,
Vegetable, Spices, Flowers and plantation
crop production bringing out 7.95% GSDP
in 2011-2012 and 7.25% in the year 2012-
2013. Having compiled record of crop
production for the year 2013-14 as
12,93,980 Metric tonne, actual figure of
GSDP for the said year is yet uncertained.
Estimated total crop production for the
current fiscal year (up to January 2015) is
12,93,430 MT.
The Department implements 5(five)
Central Sponsored Schemes namely,
MIDH, RKVY, OFWM, NMMP and State
flagship programme NLUP. With total
financial outlay of Rs 8030.72 lakhs under
CSS, it is expected that thousands of
farmers and landless agricultural labourers
will have self employment. As far as
possible, reservation for women and
persons with disabilities is being provided
as permissible. Effort is being made under
NLUP so that more than 9000 beneficiaries
have self-employment under 1st Phase, and
14,502 families are further being covered
under 2nd
, 3rd
, and 4th
Phase to provide self-
employment and sustainable income.

Economic Survey Mizoram 2014-15 ~ 46 ~ Agriculture & Allied - Horticulture
Economic Survey Mizoram 2014-15
Capital assets like community water
tanks, Hi-tech Green House, tubular
structure green houses, shade houses,
centre of excellence, individual water tank,
Drip and Sprinkle irrigation systems are
being established under various Centrally
sponsored schemes.
The Department gives full effort not
only to achieving self-sufficiency in fruit,
vegetable, flowers, spices and plantation
crops in Mizoram but also building
commercial scale production for identified
horticulture crops with a mission to
enhancement in production, marketing and
processing of Horticulture produces for
increasing income of farmers, providing
employment and establishing brand value
in horticulture produces where the state has
competitive advantage. It plays vital role in
development of fruit, vegetable, spices,
floriculture, Mushroom, plantation crops,
Research education and training, quality
seed production/plant protection and
integrated pest and Nutrient management.
III. Activities of the Department in
the current fiscal year:
Horticulture Department
implements five important CSS and State‘s
flagship programme - NLUP for
Development of Horticulture in Mizoram
bringing out remarkable achievements in
increased production of various
Horticulture crops as follows.
MIDH (Mission for Integrated
Development of Horticulture):
Large number of farmers in the
State have been benefitted and uplifted to
earn sustainable income under this scheme.
During the current financial year (2014-15),
the approved financial outlay is Rs 52.00
crores out of which Rs 26.00 crores had
been released and the following activities
are being taken up.
Establishment of new garden of
fruit, Vegetable, Mushroom, Flower, Spice
crops and Aromatic plants, Rejuvenation/
replacement of senile plantation and
canopy management on fruit crops, creation
of water sources for irrigation of crops,
encouragement of protected cultivation of
vegetable and flowers in Green House and
Shade House, Integrated Pest and Nutrient
management, Pollination support through
Bee keeping, human resource development
by conducting training, exposure visit for
farmers, study tour to progressive states
and outside the country for Technical Staff
and field functionaries are major activities
being implemented.
RKVY (Rashtrya Krishi Vikan Yojana):
Various programmes are being
taken up under this scheme. The overall
financial target under the scheme during the
current financial year is 1425.00 lakhs only.
And out of the total project cost, 50% of the
total fund has been released by G.O.I.
1. Stream-1: Under stream 1 of
RKVY various activities like
cultivation of Mandarin Orange,
Dragon fruit, Strawberry and
Hybrid vegetable, Integrate Nutrient
Management, Integrated Pest
Management, Farmers Training,
construction of Tubular structure
Green House, individual Water
Tank and allocation of 10% flexi
fund for link road construction are
being taken up.
RKVY scheme is being
implemented in cluster approach in
six Districts excluding two Districts
viz. Lawngtlai and Saiha which
received RKVY fund separately.
2. Sub-scheme: NVIUC (National
Vegetable Initiative for Urban
Cluster)
Under this Sub-scheme, activities
like cultivation of vegetable, construction
of tubular structure of Green House,
Integrated Nutrient Management,
Integrated Pest Management, construction
of Pack House and low energy cool
chamber for various farm produces,
construction of low cost Onion storage
structure and farmers training will be taken
up with financial target of Rs.200.00 lakhs.
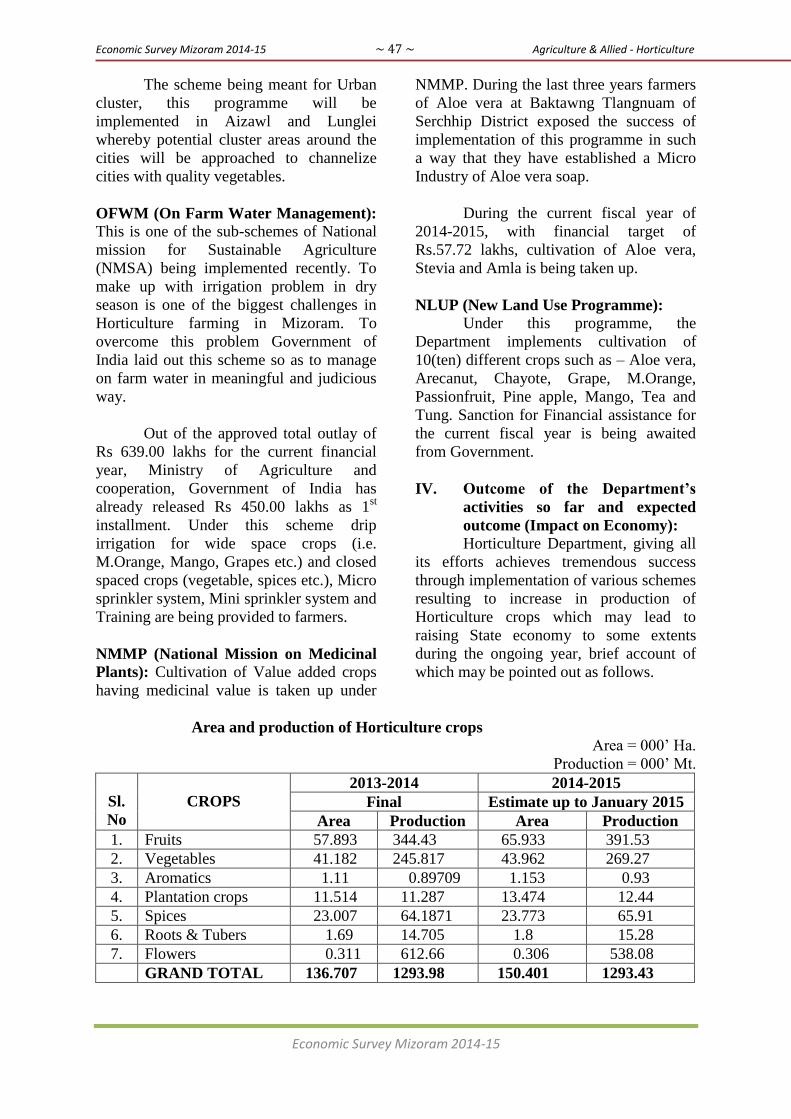
Economic Survey Mizoram 2014-15 ~ 47 ~ Agriculture & Allied - Horticulture
Economic Survey Mizoram 2014-15
The scheme being meant for Urban
cluster, this programme will be
implemented in Aizawl and Lunglei
whereby potential cluster areas around the
cities will be approached to channelize
cities with quality vegetables.
OFWM (On Farm Water Management):
This is one of the sub-schemes of National
mission for Sustainable Agriculture
(NMSA) being implemented recently. To
make up with irrigation problem in dry
season is one of the biggest challenges in
Horticulture farming in Mizoram. To
overcome this problem Government of
India laid out this scheme so as to manage
on farm water in meaningful and judicious
way.
Out of the approved total outlay of
Rs 639.00 lakhs for the current financial
year, Ministry of Agriculture and
cooperation, Government of India has
already released Rs 450.00 lakhs as 1st
installment. Under this scheme drip
irrigation for wide space crops (i.e.
M.Orange, Mango, Grapes etc.) and closed
spaced crops (vegetable, spices etc.), Micro
sprinkler system, Mini sprinkler system and
Training are being provided to farmers.
NMMP (National Mission on Medicinal
Plants): Cultivation of Value added crops
having medicinal value is taken up under
NMMP. During the last three years farmers
of Aloe vera at Baktawng Tlangnuam of
Serchhip District exposed the success of
implementation of this programme in such
a way that they have established a Micro
Industry of Aloe vera soap.
During the current fiscal year of
2014-2015, with financial target of
Rs.57.72 lakhs, cultivation of Aloe vera,
Stevia and Amla is being taken up.
NLUP (New Land Use Programme):
Under this programme, the
Department implements cultivation of
10(ten) different crops such as – Aloe vera,
Arecanut, Chayote, Grape, M.Orange,
Passionfruit, Pine apple, Mango, Tea and
Tung. Sanction for Financial assistance for
the current fiscal year is being awaited
from Government.
IV. Outcome of the Department‟s
activities so far and expected
outcome (Impact on Economy):
Horticulture Department, giving all
its efforts achieves tremendous success
through implementation of various schemes
resulting to increase in production of
Horticulture crops which may lead to
raising State economy to some extents
during the ongoing year, brief account of
which may be pointed out as follows.
Area and production of Horticulture crops
Area = 000‘ Ha.
Production = 000‘ Mt.
Sl.
No
CROPS
2013-2014 2014-2015
Final Estimate up to January 2015
Area Production Area Production
1. Fruits 57.893 344.43 65.933 391.53
2. Vegetables 41.182 245.817 43.962 269.27
3. Aromatics 1.11 0.89709 1.153 0.93
4. Plantation crops 11.514 11.287 13.474 12.44
5. Spices 23.007 64.1871 23.773 65.91
6. Roots & Tubers 1.69 14.705 1.8 15.28
7. Flowers 0.311 612.66 0.306 538.08
GRAND TOTAL 136.707 1293.98 150.401 1293.43
Economic Survey Mizoram 2014-15 ~ 48 ~ Agriculture & Allied - Horticulture
Economic Survey Mizoram 2014-15
Observation thus may be made on
Area and production of Horticulture crops
bringing out positive outcomes as follows.
1) Area of cultivation of fruit crops is
estimated to be increased to 65,933
Ha. which is more than last year
(2013-2014) area coverage by 8,040
Ha. with increased production to
3,91,530 MT. which is 47,100 MT
more than last year‘s production of
fruits.
2) Increase in production of
Vegetables to 2,69,270 MT which is
23,453 MT. more than last year
production with 43,962 Ha. area of
cultivation which is 2,780 Ha. more
than last year record.
3) Less production of other
horticulture crops (Sl. No. 3-7 of
above table) is observed owing to
incomplete season/financial year.
Production is expected to be much
higher in 2014-15 than in 2013-14
after complete harvests of Spices,
Aromatic, Plantation crops, Spices
Root and Tubers, Flowers and some
vegetables.
4) Infrastructure and assets created,
being created and earmarked to be
created in the interest of farmers
and farmers groups such as Green
House, Drip, Sprinkler system for
Irrigation, Water Tank, Geo-
membrane for water storage,
Polythene pipe, give good result in
increase in productivity and
production and more is expected in
the years to come.
5) Implementation of NLUP leads to
permanent cultivation of crops
resulting to earning sustainable
income is no doubt one of the clear
impacts of the Department
activities.
V. Policy constraints requires to be
addressed:
Presently crop production,
processing and marketing of produces are
not merged in one stream. As such,
producer farmer has to find way out to
dispose off his produces through other
agencies or the other, which is a big burden
for him/her. Therefore, may be appropriate
that Government directed towards a policy
wherein production, processing and
marketing are channelized under one
umbrella.

Economic Survey Mizoram 2014-15 ~ 49 ~ Agriculture & Allied - Horticulture
Economic Survey Mizoram 2014-15
AREA AND PRODUCTION OF HORTICULTURE CROPS
Area = 000' Ha
Production = 000'
MT
2012-2013 2013-2014 2014-2015
CROPS Final First Estimate Second Estimate Third Estimate Final First Adv. Estimate
Area Production Area Production Area Production Area Production Area Production Area Production
Fruits
Avocado 0.31 5.08 0.32 5.25 0.32 5.25 0.32 5.25 0.32 5.25 0.35 5.74
Aonla 0.21 0.9 0.275 1.21 0.275 1.21 0.275 1.21 0.275 1.21 0.3 1.32
Banna 10.54 127.53 10.84 140.92 10.84 140.92 10.84 140.92 10.84 140.92 11.16 145.08
Citrus
(i) Lime / Lemon 7.93 25.14 8 25.6 8 25.6 8 25.6 8 25.6 8.07 25.82
(ii) Mandarin Orange 8.96 24.1 13.508 40.43 13.508 40.43 13.508 40.43 13.508 40.43 18.59 55.96
(iii) Sweet Orange (Mosambi) 1.5 4.65 1.52 4.864 1.52 4.864 1.52 4.864 1.52 4.864 1.59 5.09
(iv) Others (Hatkora) 2.12 6.78 2.2 6.8 2.2 6.8 2.2 6.8 2.12 6.8 2.14 6.87
Custardapple 0.003 0.01 0.003 0.02 0.003 0.02 0.003 0.02 0.003 0.01 0.003 0.01
Grapes 2.38 20.8 2.682 23.87 2.682 23.87 2.682 23.87 2.45 23.87 2.52 24.54
Guava 0.4 2.46 0.42 2.62 0.42 2.62 0.42 2.62 0.41 2.5 0.43 2.62
Jackfruit 0.05 2.48 0.07 2.9 0.07 2.9 0.07 2.9 0.05 2.5 0.051 2.55
Kiwi 0.2 0.69 0.25 0.875 0.25 0.875 0.25 0.875 0.25 0.875 0.29 1.02
Litchi 0.4 1.7 0.4 1.73 0.4 1.73 0.4 1.73 0.4 1.73 0.50 2.17
Mango 0.75 3.47 0.78 3.68 0.78 3.68 0.78 3.68 0.78 3.68 0.99 4.67
Papaya 1 23.1 1.05 24.6 1.05 24.6 1.05 24.6 1.05 24.6 1.59 37.25
Passionatefruit 0.7 1.47 0.838 1.94 0.838 1.94 0.838 1.94 0.838 1.94 0.986 2.29
Peach 0.05 0.38 0.075 0.577 0.075 0.577 0.075 0.577 0.075 0.577 0.12 0.92
Pear 0.001 0.005 0.007 0.04
Pineapple 3 21.96 4.091 30.14 4.091 30.14 4.091 30.14 4.091 30.14 5.002 36.86

Economic Survey Mizoram 2014-15 ~ 50 ~ Agriculture & Allied - Horticulture
Economic Survey Mizoram 2014-15
2012-2013 2013-2014 2014-2015
CROPS Final First Estimate Second Estimate Third Estimate Final First Adv. Estimate
Area Production Area Production Area Production Area Production Area Production Area Production
Plum 0.12 1.10 0.145 1.348 0.145 1.348 0.145 1.348 0.145 1.348 0.173 1.61
Pomgrenate 0.01 0.02 0.01 0.03 0.01 0.03 0.01 0.03 0.01 0.02 0.013 0.03
Sapota 0.00 0.02 0.004 0.03 0.004 0.03 0.004 0.03 0.004 0.02 0.004 0.02
Strawberry 0.001 0.02 0.143 2.86
Tamarind 0.01 0.02 0.012 0.036 0.012 0.036 0.012 0.036 0.01 0.026 0.011 0.03
Other Fruits 9.04 19.89 10.4 24.96 10.4 24.96 10.4 24.96 10.4 24.96 10.9 26.16
Total Fruits 49.68 293.75 57.893 344.43 57.893 344.43 57.893 344.43 57.893 344.43 65.933 391.53
Vegetables
Beans 2.42 5.32 2.535 6.084 2.535 6.084 2.535 6.084 2.535 6.084 2.621 6.29
Bittergourd 3.90 20.40 4.045 21.84 4.045 21.84 4.045 21.84 4.045 21.84 4.902 26.47
Bottlgourd 0.07 0.38 0.074 0.407 0.074 0.407 0.074 0.407 0.074 0.407 0.078 0.43
Brinjal 2.20 15.62 2.265 16.53 2.265 16.53 2.265 16.53 2.25 16.03 2.45 17.44
Cabbage 3.02 40.08 3.23 43.28 3.23 43.28 3.23 43.28 3.23 43.28 3.64 48.78
Capsicum 0.16 2.10 0.24 2.814 0.24 2.814 0.24 2.814 0.2 2.314 0.31 3.59
Carrot 0.20 1.47 0.17 1.8 0.17 1.8 0.17 1.8 0.17 1.8 0.19 2.01
Cauliflower 0.15 1.49 0.42 1.7 0.42 1.7 0.42 1.7 0.12 1.00 0.13 1.08
Cucumber 0.40 2.06 0.3 2.19 0.3 2.19 0.3 2.19 0.3 2.09 0.35 2.44
Muskmelon 0.13 0.30 0.14 0.336 0.14 0.336 0.14 0.336 0.12 0.26 0.12 0.26
Okra/ladysfinger 3.05 20.74 3.25 22.43 3.25 22.43 3.25 22.43 3.25 22.43 3.59 24.77
Onion 0.43 3.96 0.51 4.74 0.51 4.74 0.51 4.74 0.41 3.74 1.265 11.54
Peas 0.45 2.08 0.46 2.162 0.46 2.162 0.46 2.162 0.46 2.162 0.48 2.26
Radish 0.28 0.62 0.3 0.69 0.3 0.69 0.3 0.69 0.3 0.69 0.32 0.74
Pumpkin/Sitaphal Kaddu 0.07 0.02 0.125 0.138 0.125 0.138 0.125 0.138 0.125 0.138 0.13 0.14
Tomato 0.80 7.39 0.88 8.27 0.88 8.27 0.88 8.27 0.88 8.27 1.069 10.05
Watermelon 0.35 0.10 0.37 0.407 0.37 0.407 0.37 0.407 0.30 0.88 0.32 0.94

Economic Survey Mizoram 2014-15 ~ 51 ~ Agriculture & Allied - Horticulture
Economic Survey Mizoram 2014-15
2012-2013 2013-2014 2014-2015
CROPS Final First Estimate Second Estimate Third Estimate Final First Adv. Estimate
Area Production Area Production Area Production Area Production Area Production Area Production
Other vegetables
Cowpea 2.55 5.97 2.64 6.336 2.64 6.336 2.64 6.336 2.64 6.336 2.75 6.6
Chayote 4.5 75.02 4.86 82.62 4.86 82.62 4.86 82.62 4.86 80.02 4.782 81.92
Snakegourd 0.04 0.02 0.045 0.027 0.045 0.027 0.045 0.027 0.045 0.017 0.036 0.02
Sweetgourd 0.008 0.07 0.013 0.116 0.013 0.116 0.013 0.116 0.013 0.116 0.015 0.13
Pakchoy 0.02 0.3 0.02 0.3 0.02 0.3 0.02 0.3 0.024 0.36
Knolkhol 0.38 2.74 0.4 2.92 0.4 2.92 0.4 2.92 0.4 2.92 0.42 3.07
Brocolli 0.72 5.47 0.77 5.87 0.77 5.87 0.77 5.87 0.77 5.87 0.82 6.25
Others (local Vegetables) 11.46 9.62 13.12 11.81 13.12 11.81 13.12 11.81 13.12 10.81 13.15 11.7
TOTAL 37.74 223.04 41.182 245.817 41.182 245.817 41.182 245.817 41.182 245.817 43.962 269.27
Aromatics
Citronela 0.046 0.0258 0.046 0.027 0.046 0.027 0.046 0.027 0.046 0.026 0.057 0.03
Stevia (Dried Leaver) 0.12 0.02 0.127 0.03 0.127 0.03 0.127 0.03 0.127 0.03 0.13 0.03
Aloe Vera Fresh Leaf 0.85 0.66 0.929 0.84 0.929 0.84 0.929 0.84 0.929 0.84 0.958 0.86
Sweet Flag 0.008 0.00008 0.008 0.00009 0.008 0.00009 0.008 0.00009 0.008 0.00009 0.008 0.00
TOTAL 1.02 0.70588 1.11 0.89709 1.11 0.89709 1.11 0.89709 1.11 0.89709 1.153 0.93
Plantation Crops
Arecanut 7.574 4.32 10.138 6.05 10.138 6.05 10.138 6.05 10.138 6.05 12.092 7.26
Cashewnut 0.002 0.001 0.002 0.002 0.002 0.002 0.002 0.002 0.002 0.002 0.002 0.00
Coconut 0.02 0.06 0.06 0.06 0.06 0.06 0.06 0.06 0.06 0.112 0.04 0.11
Tung 0.457 2.80 0.004 0.664 0.004 0.664 0.004 0.664 0.004 4.083 0.64 3.95
Jatropha 0.65 1.01 0.65 0.65 0.65 0.65 0.65 0.65 0.65 1.04 0.7 1.12
TOTAL 8.703 8.191 11.514 11.514 11.514 11.514 11.514 11.514 11.514 11.287 13.474 12.44
Black Pepper 0.07 0.0063 0.075 0.075 0.075 0.075 0.075 0.075 0.075 0.007 0.072 0.01
Chillies (Dried) 9.02 8.2082 9.04 9.5 9.04 9.5 9.04 9.5 9.04 9.1 9.29 9.38
Cinnamon 0.001 0.0005 0.001 0.0006 0.001 0.0006 0.001 0.0006 0.001 0.0005 0.01 0.01

Economic Survey Mizoram 2014-15 ~ 52 ~ Agriculture & Allied - Horticulture
Economic Survey Mizoram 2014-15
2012-2013 2013-2014 2014-2015
CROPS Final First Estimate Second Estimate Third Estimate Final First Adv. Estimate
Area Production Area Production Area Production Area Production Area Production Area Production
Coriander 0.03 0.0081 0.05 0.016 0.05 0.016 0.05 0.016 0.05 0.016 0.07 0.02
Ginger 7.28 28.39 7.48 29.92 7.48 29.92 7.48 29.92 7.48 29.92 7.82 31.28
Turmeric 6.05 22.99 6.25 24.7 6.25 24.7 6.25 24.7 6.25 24.7 6.37 25.16
Garlic 0.02 0.0064 0.04 0.016 0.04 0.016 0.04 0.016 0.04 0.016 0.06 0.02
Celery 0.001 0.0029 0.001 0.003 0.001 0.003 0.001 0.003 0.001 0.003 0.001 0.00
Others 0.06 0.0168 0.07 0.024 0.07 0.024 0.07 0.024 0.07 0.024 0.08 0.03
TOTAL 22.532 59.63 23.007 64.1871 23.007 64.1871 23.007 64.1871 23.007 64.1871 23.773 65.91
Roots & Tubers
Potato 0.25 3.15 0.24 3 0.24 3 0.24 3 0.24 3 0.25 3.13
Sweet Potato 0.17 1.09 0.19 1.235 0.19 1.235 0.19 1.235 0.19 1.235 0.25 1.63
Tapioca 0.13 1.89 0.15 2.27 0.15 2.27 0.15 2.27 0.13 1.9 0.13 1.90
Colocasia 0.95 6.95 1.01 7.57 1.01 7.57 1.01 7.57 1.01 7.57 1.05 7.88
Others (Telhawng) 0.09 0.56 0.1 0.63 0.1 0.63 0.1 0.63 0.1 0.63 0.12 0.76
TOTAL 1.59 13.64 1.69 14.705 1.69 14.705 1.69 14.705 1.69 14.705 1.8 15.28
Flowers
Anthurium 0.051 141.27 0.06 143 0.06 143 0.06 143 0.36 83.42 0.108 180.67
Rose 0.010 45.8 0.06 263 0.06 263 0.06 263 0.02 60.1 0.03 90.15
Orchids 0.012 0.77 0.02 0.79 0.02 0.79 0.02 0.79 0.02 0.79 0.029 1.15
Gerbera 0.023 32.20 0.025 34.4 0.025 34.4 0.025 34.4 0.023 32.4 0.025 35.22
Carnation 0.025 0.025 0.025 0.025 23.1 0.025 23.10
Nerine (Dafodil) 0.05 0.05 0.05 0.03 0.1 0.003 0.10
Others 0.067 166.83 0.071 171.47 0.071 171.47 0.071 171.47 0.071 171.47 0.086 207.70
TOTAL 0.163 386.87 0.311 612.66 0.311 612.66 0.311 612.66 0.311 612.66 0.306 538.08
GRAND TOTAL 121.434 985.826 136.707 1293.983 136.707 1293.983 136.707 1293.983 136.707 1293.98 150.401 1293.43
…..

Economic Survey Mizoram 2014-15 ~ 53 ~ Agriculture & Allied- AH & Vety
Economic Survey Mizoram 2014-15
LIVESTOCK & VETERINARY
Animal Husbandry & Veterinary
Sector plays an important role for
increasing production of animal origin food
like milk, eggs & meat as well as Socio
Economic Development of the State and
contributes substantially to the States Gross
Domestic Product. For development of this
sector, various schemes under State Plan
and Centrally funded schemes are taken up
for up-gradation of local stock, provision of
technology to farmers for improved animal
husbandry practices, provide provisions of
animal health care. The contribution of the
Department in the Gross State Domestic
Product (GSDP) in 2013 – 2014 is near
about 5% (i.e. 29 % of total contribution of
Agriculture & Allied Sectors).
Livestock and Poultry Population
Species Livestock
Census 2007
Livestock
Census 2012
Growth
Rate (%) Remarks
1 2 3 4 5
Livestock 364000 384604 5.66
Pigs constitute the largest
group followed by cattle;
69.33% and 9.95%
respectively
Poultry 1241814 1260298 1.49 Fowls account for 99.43% of
the total population
Livestock Products
1. Milk Production:
As per reports of the Integrated
Sample Survey, estimated total milk
production during 2013–14 was 15305.217
tonnes. The per capita availability of milk
per day in Mizoram is worked out to be
36.58 gms against the Indian Council of
Medical Research recommendation of 240
gms of milk per day per individual.
Estimated milk production in Mizoram (Tonnes)
Year Crossbred Indigenous Buffaloes Total
1 2 3 4 5
2009 – 2010 6868 3154 611 10633
2010 – 2011 7712 3119 596 11427
2011 – 2012 12393 1549 8 13950
2012 – 2013 12000.53 1638.65 NIL 13639
2013 – 2014 13629.752 1675.465 NIL 15305.217
2. Egg Production:
The estimated total egg production
during 2013-14 was 362.315 lakhs of
which 260.444 lakhs were Desi and
101.871 lakhs were improved variety. The
total egg production is estimated to have
increased by 9.54 percent from the previous
year. The recommendation made by
nutritional experts is 180 eggs per year for
an individual to maintain good health. Per
capita availability of eggs Mizoram during
2013-14 is worked out to be 31.61 eggs per
year.
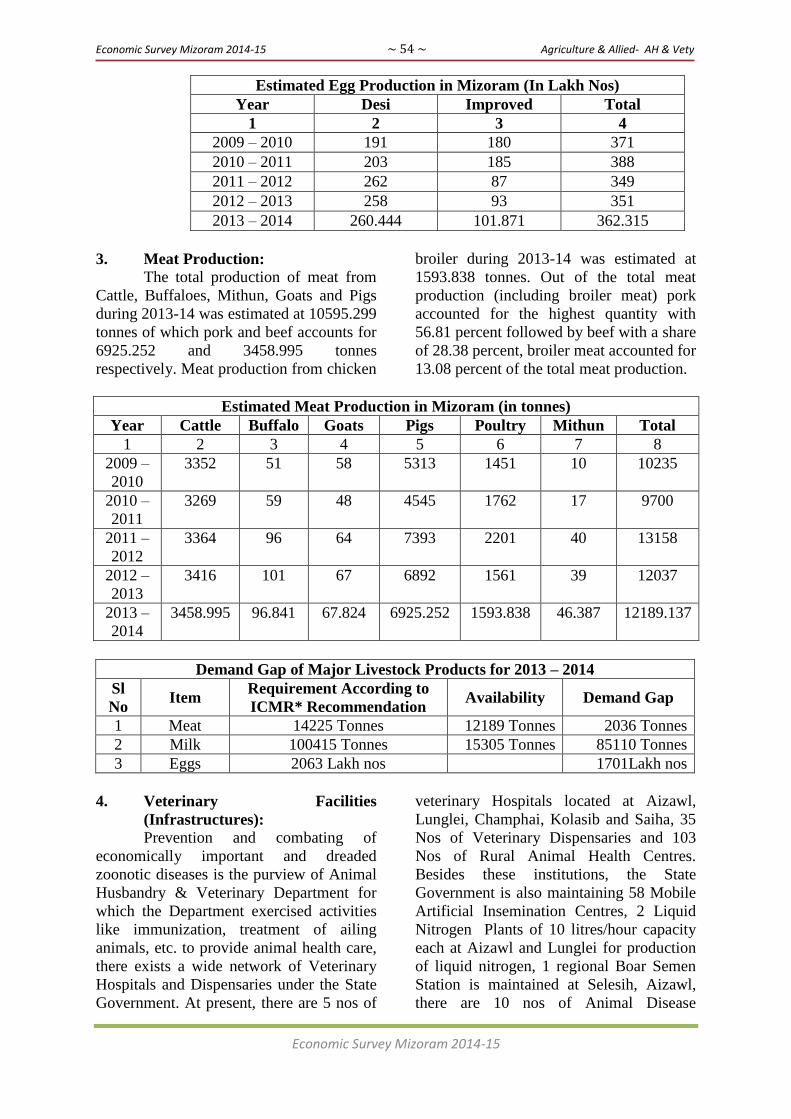
Economic Survey Mizoram 2014-15 ~ 54 ~ Agriculture & Allied- AH & Vety
Economic Survey Mizoram 2014-15
Estimated Egg Production in Mizoram (In Lakh Nos)
Year Desi Improved Total
1 2 3 4
2009 – 2010 191 180 371
2010 – 2011 203 185 388
2011 – 2012 262 87 349
2012 – 2013 258 93 351
2013 – 2014 260.444 101.871 362.315
3. Meat Production:
The total production of meat from
Cattle, Buffaloes, Mithun, Goats and Pigs
during 2013-14 was estimated at 10595.299
tonnes of which pork and beef accounts for
6925.252 and 3458.995 tonnes
respectively. Meat production from chicken
broiler during 2013-14 was estimated at
1593.838 tonnes. Out of the total meat
production (including broiler meat) pork
accounted for the highest quantity with
56.81 percent followed by beef with a share
of 28.38 percent, broiler meat accounted for
13.08 percent of the total meat production.
Estimated Meat Production in Mizoram (in tonnes)
Year Cattle Buffalo Goats Pigs Poultry Mithun Total
1 2 3 4 5 6 7 8
2009 –
2010
3352 51 58 5313 1451 10 10235
2010 –
2011
3269 59 48 4545 1762 17 9700
2011 –
2012
3364 96 64 7393 2201 40 13158
2012 –
2013
3416 101 67 6892 1561 39 12037
2013 –
2014
3458.995 96.841 67.824 6925.252 1593.838 46.387 12189.137
Demand Gap of Major Livestock Products for 2013 – 2014
Sl
No Item
Requirement According to
ICMR* Recommendation Availability Demand Gap
1 Meat 14225 Tonnes 12189 Tonnes 2036 Tonnes
2 Milk 100415 Tonnes 15305 Tonnes 85110 Tonnes
3 Eggs 2063 Lakh nos 362k 1701Lakh nos
4. Veterinary Facilities
(Infrastructures):
Prevention and combating of
economically important and dreaded
zoonotic diseases is the purview of Animal
Husbandry & Veterinary Department for
which the Department exercised activities
like immunization, treatment of ailing
animals, etc. to provide animal health care,
there exists a wide network of Veterinary
Hospitals and Dispensaries under the State
Government. At present, there are 5 nos of
veterinary Hospitals located at Aizawl,
Lunglei, Champhai, Kolasib and Saiha, 35
Nos of Veterinary Dispensaries and 103
Nos of Rural Animal Health Centres.
Besides these institutions, the State
Government is also maintaining 58 Mobile
Artificial Insemination Centres, 2 Liquid
Nitrogen Plants of 10 litres/hour capacity
each at Aizawl and Lunglei for production
of liquid nitrogen, 1 regional Boar Semen
Station is maintained at Selesih, Aizawl,
there are 10 nos of Animal Disease
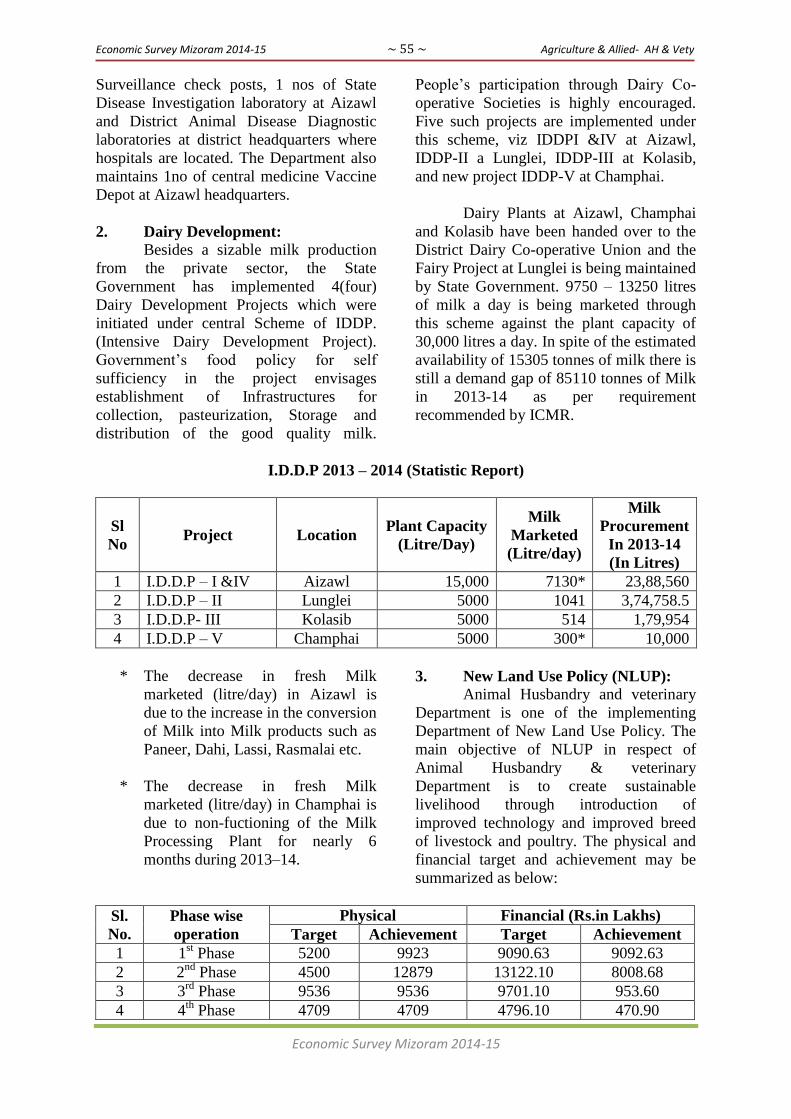
Economic Survey Mizoram 2014-15 ~ 55 ~ Agriculture & Allied- AH & Vety
Economic Survey Mizoram 2014-15
Surveillance check posts, 1 nos of State
Disease Investigation laboratory at Aizawl
and District Animal Disease Diagnostic
laboratories at district headquarters where
hospitals are located. The Department also
maintains 1no of central medicine Vaccine
Depot at Aizawl headquarters.
2. Dairy Development:
Besides a sizable milk production
from the private sector, the State
Government has implemented 4(four)
Dairy Development Projects which were
initiated under central Scheme of IDDP.
(Intensive Dairy Development Project).
Government‘s food policy for self
sufficiency in the project envisages
establishment of Infrastructures for
collection, pasteurization, Storage and
distribution of the good quality milk.
People‘s participation through Dairy Co-
operative Societies is highly encouraged.
Five such projects are implemented under
this scheme, viz IDDPI &IV at Aizawl,
IDDP-II a Lunglei, IDDP-III at Kolasib,
and new project IDDP-V at Champhai.
Dairy Plants at Aizawl, Champhai
and Kolasib have been handed over to the
District Dairy Co-operative Union and the
Fairy Project at Lunglei is being maintained
by State Government. 9750 – 13250 litres
of milk a day is being marketed through
this scheme against the plant capacity of
30,000 litres a day. In spite of the estimated
availability of 15305 tonnes of milk there is
still a demand gap of 85110 tonnes of Milk
in 2013-14 as per requirement
recommended by ICMR.
I.D.D.P 2013 – 2014 (Statistic Report)
Sl
No Project Location
Plant Capacity
(Litre/Day)
Milk
Marketed
(Litre/day)
Milk
Procurement
In 2013-14
(In Litres)
1 I.D.D.P – I &IV Aizawl 15,000 7130* 23,88,560
2 I.D.D.P – II Lunglei 5000 1041 3,74,758.5
3 I.D.D.P- III Kolasib 5000 514 1,79,954
4 I.D.D.P – V Champhai 5000 300* 10,000
* The decrease in fresh Milk
marketed (litre/day) in Aizawl is
due to the increase in the conversion
of Milk into Milk products such as
Paneer, Dahi, Lassi, Rasmalai etc.
* The decrease in fresh Milk
marketed (litre/day) in Champhai is
due to non-fuctioning of the Milk
Processing Plant for nearly 6
months during 2013–14.
3. New Land Use Policy (NLUP):
Animal Husbandry and veterinary
Department is one of the implementing
Department of New Land Use Policy. The
main objective of NLUP in respect of
Animal Husbandry & veterinary
Department is to create sustainable
livelihood through introduction of
improved technology and improved breed
of livestock and poultry. The physical and
financial target and achievement may be
summarized as below:
Sl.
No.
Phase wise
operation
Physical Financial (Rs.in Lakhs)
Target Achievement Target Achievement
1 1st Phase 5200 9923 9090.63 9092.63
2 2nd
Phase 4500 12879 13122.10 8008.68
3 3rd
Phase 9536 9536 9701.10 953.60
4 4th
Phase 4709 4709 4796.10 470.90

Economic Survey Mizoram 2014-15 ~ 56 ~ Agriculture & Allied- AH & Vety
Economic Survey Mizoram 2014-15
There are 4(four) different trades
under Animal Husbandry and Veterinary
sector such as: -
Sl.
No. Trades
No. of Beneficiaries
1st Phase 2
nd Phase 3
rd Phase 4
th Phase
1 Dairy Farming 949 374 254 134
2 Piggery Farming 5330 7006 5453 2753
3 Mithun Farming 1856 1141 603 327
4 Poultry Farming 1788 4358 3226 1495
Total 9923 12879 9536 4709
Note: NLUP 1st phase was started in
2010-2011 and completed in 2013-
2014 whereas 2nd
, 3rd
& 4th
phases
were started in 2012-2013 and are
still going on.
……
Economic Survey Mizoram 2014-15 ~ 57 ~ Agriculture & Allied- Forest
Economic Survey Mizoram 2014-15
FISHERIES
I. Sectoral Overview
Mizoram has considerable stretches
of plain area with all favourable and
conducive conditions for development of
fisheries. The state has about 24,000
hectare of potential land which could be
developed for fish farming. Due to various
constraints in the past so far only 4510
hectare of ponds and tanks are developed
for fish culture till the end of 2013-2014.
The State has further 6000 hectare
of water area in the form of rivers and
streams spread over 1100km of riverine
stretches.
In the recent past the Power and
Electricity Department has created two
hydroelectricity impoundments offering
almost 4000 hectare and the government
has entrusted the state Fisheries
Department to incorporate capture based
culture fisheries though MOU executed
between Power and Electricity Department
and Fisheries Department.
The present ministry of Mizoram
has taken up a flagship programme namely
NLUP to assist 1,20,000 jhumia families to
settle permanently in various trade to do
away with shifting cultivation of which
3000 families covering 1500 hectare has
been entrusted to the fishery sector.
The main policy of the government
for fishery sector in the state is targeted
towards gradual bridging of the gap
between requirement of table size fish and
its supply from the state own resources and
finally to reach self-sufficiency to offer
11kg per capita by the end of 12th
Five
Year Plan period, besides offering self
employment to 16,000 families. The per
capita consumption at the end of 2013-2014
is estimated to be 5.18 kg from the states
own culture and capture resources. At
present there is a shortfall of 5.82 kg per
capita, this shortfall has to be fulfilled by
the end of 12th
Five Year Plan.
The requirement of table size fish is
estimated to be about 14300 M.T by the
end of 12th
Five Year Plan period at a per
capita scale of 11kg. To achieve this target
3000 hectare of new ponds and tanks has to
be developed in the state for which there is
immense scope as only about 18.79 % of
the total potential fishery resource of 24000
hectare has so far been developed till 2013-
2014.
II. Department‟s contribution in the
economy (Role of the Sector)
Presently the Department of
Fisheries contributes about 0.7% to the
state economy in terms of sectoral
contribution to the Gross State Domestic
Product having less scope of capital
formation as the Department has the service
and upgradation approach in the rural
sector. Still the Department substancially
contributed in generating rural employment
and job creation. The department has been
able to develop 2.20 lakh mandays
employment in rural areas during 2013-
2014.
III. Activities of the Department in
the current fiscal year
The highlights of activities of the
Fisheries Department during the year 2014-
2015 are as stated below: -
A. State Plan Sector:
Targeted to produce 30 lakhs of
fingerling from government fish
seed farm to be distributed to the
farmers.
Targeted to augment production
level of the state at 6200 M.T by the
end of 2014- 2015.
Targeted to augment per capita
consumption level of atleast 5.44kg
by the end of 2014-2015 from states
own production against available
per capita of 5.18 kg at the end of
2013-2014.
Auctioned fish crop of Serlui ‗B‘ to
achieve additional production level

Economic Survey Mizoram 2014-15 ~ 58 ~ Agriculture & Allied- Forest
Economic Survey Mizoram 2014-15
of 300-400 M.T by the end of 2014-
2015.
B. Under Government of Mizoram
Flagship Programme NLUP.
Under NLUP Programme, the
Department implemented two
components viz. - Development
component; and Infrastructure
Development component
Under Development component, the
Department implemented Semi-
Intensive Aquaculture covering
3654 no. of beneficiaries under 1st,
2nd
, 3rd
, and 4th
phase NLUP
programme.
Under 1st and 2
nd phase NLUP
programme, disbursement of fund
@ Rs.1.00 lakh each (in cash and in
kind) to 2608 beneficiaries has been
completed.
Under 3rd
to 4th
phase NLUP
programme Rs.10,000/- each has
been released to the beneficiaries
covering 1076 families.
The Department has also received
funds for repairing of Nursery
ponds at Ngengpui fish seed farm
using WetComb materials.
C. Centrally Sponsored Schemes
(CSS), Fish Farmers
Development Agency (FFDA),
National Scheme for Welfare of
Fishermen (NSWF), Development
of Reservoir and Riverine
Fisheries and National Fisheries
Development Board (NFDB)
A) CSS-FFDA, NSWF AND NFDB:
Creation of 261.52 Ha. of new fish
ponds in the State to achieve
additional production of atleast 420
M.T. of table-size fish.
Renovation of 540 Ha. of existing
fish ponds to achieve additional
production of at least 270 M.T of
table-size fish.
Supply of 1st inputs (fish feed, fish
seed etc) covering 1050 Ha of
ponds and tanks.
Constructed 500 fishermen huts
(Thlam), 49 water point/ Tube-well
(Tuikhur) and 3 Community Hall
under NSWF.
B) RKVY:
Under Cage Culture more than 20
MT of Pangasius Sutchi has already
been harvested from 48 cages
constructed during 2013-2014 at
Serlui B Reservoir.
Construction of 75 Ha of new ponds
Purchase of 165.0 Mt of fish feed
for distribution to the farmers at 75
% subsidized rate.
Purchase of 125 lakh nos. of
fingerlings for distribution to the
farmers
Training and demonstration on
Modern Technology of Fish
Farming to 1250 nos. of fish
farmers.
Construction of I unit of Hatchery
Construction of Training Center-
cum-DFDO office at Kolasib.
Construction and establishment of 1
unit of Feed Mill Plant
Supply and installation of a Feed
Mill Plant at Kolasib
Purchase of raw materials for Feed
Mill Plant.
IV. Outcome of the Department
activities so far and expected
outcome (Impact on Economy)
The increase in the no. of fish
farmers, area under fish culture and
availability of fish seeds clearly
shows the impact of the activities of
the department:-
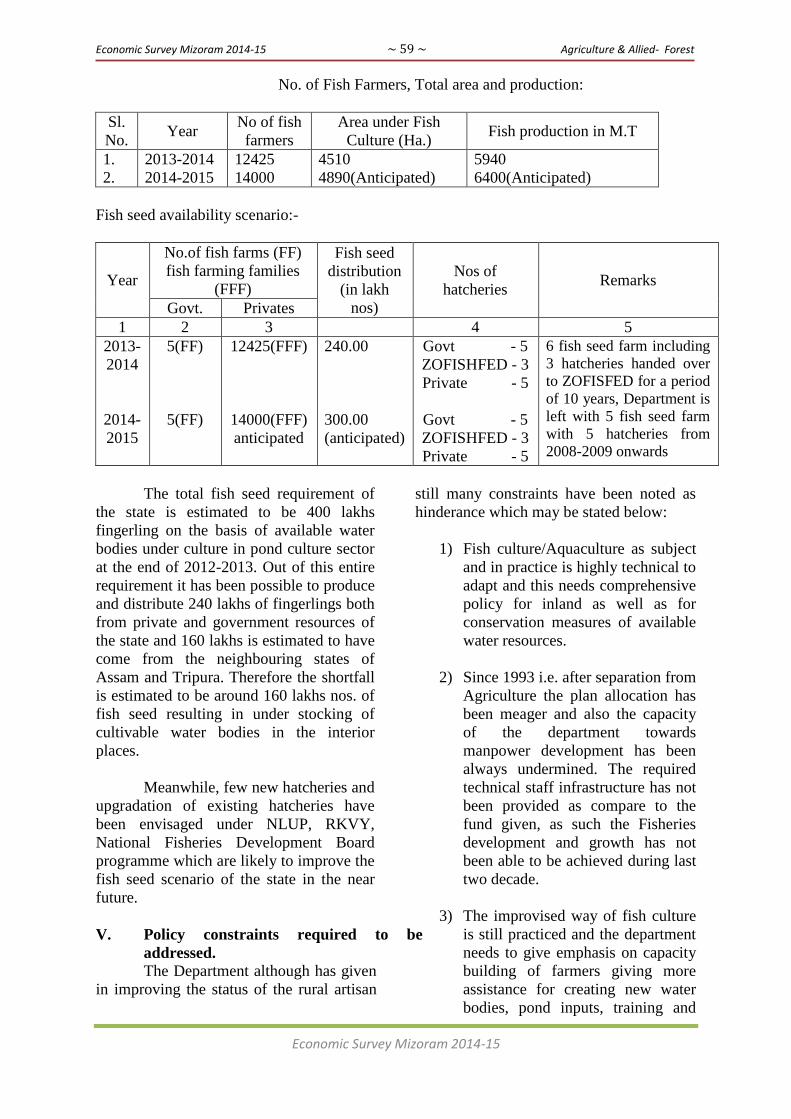
Economic Survey Mizoram 2014-15 ~ 59 ~ Agriculture & Allied- Forest
Economic Survey Mizoram 2014-15
No. of Fish Farmers, Total area and production:
Sl.
No. Year
No of fish
farmers
Area under Fish
Culture (Ha.) Fish production in M.T
1.
2.
2013-2014
2014-2015
12425
14000
4510
4890(Anticipated)
5940
6400(Anticipated)
Fish seed availability scenario:-
Year
No.of fish farms (FF)
fish farming families
(FFF)
Fish seed
distribution
(in lakh
nos)
Nos of
hatcheries Remarks
Govt. Privates
1 2 3 4 5
2013-
2014
2014-
2015
5(FF)
5(FF)
12425(FFF)
14000(FFF)
anticipated
240.00
300.00
(anticipated)
Govt - 5
ZOFISHFED - 3
Private - 5
Govt - 5
ZOFISHFED - 3
Private - 5
6 fish seed farm including
3 hatcheries handed over
to ZOFISFED for a period
of 10 years, Department is
left with 5 fish seed farm
with 5 hatcheries from
2008-2009 onwards
The total fish seed requirement of
the state is estimated to be 400 lakhs
fingerling on the basis of available water
bodies under culture in pond culture sector
at the end of 2012-2013. Out of this entire
requirement it has been possible to produce
and distribute 240 lakhs of fingerlings both
from private and government resources of
the state and 160 lakhs is estimated to have
come from the neighbouring states of
Assam and Tripura. Therefore the shortfall
is estimated to be around 160 lakhs nos. of
fish seed resulting in under stocking of
cultivable water bodies in the interior
places.
Meanwhile, few new hatcheries and
upgradation of existing hatcheries have
been envisaged under NLUP, RKVY,
National Fisheries Development Board
programme which are likely to improve the
fish seed scenario of the state in the near
future.
V. Policy constraints required to be
addressed.
The Department although has given
in improving the status of the rural artisan
still many constraints have been noted as
hinderance which may be stated below:
1) Fish culture/Aquaculture as subject
and in practice is highly technical to
adapt and this needs comprehensive
policy for inland as well as for
conservation measures of available
water resources.
2) Since 1993 i.e. after separation from
Agriculture the plan allocation has
been meager and also the capacity
of the department towards
manpower development has been
always undermined. The required
technical staff infrastructure has not
been provided as compare to the
fund given, as such the Fisheries
development and growth has not
been able to be achieved during last
two decade.
3) The improvised way of fish culture
is still practiced and the department
needs to give emphasis on capacity
building of farmers giving more
assistance for creating new water
bodies, pond inputs, training and
Economic Survey Mizoram 2014-15 ~ 60 ~ Agriculture & Allied- Forest
Economic Survey Mizoram 2014-15
transfusion of technology of fish
culture on massive scale.
4) The difficult terrain and topography
of the State requires more capital
investment in creating new water
bodies pond which is rather difficult
to afford by rural farmers.
5) The long practice of Jhums also has
prolonged affect in fish culture
adaptation in rural areas. Presently,
the scenario is being changed due to
implementation of NLUP flagship
programme. Rural farmers are
adapting fish culture as fish culture
pays more income for sustaining
their livelihood.
6) Enhancement of fish seed
production for self-sufficiency for
optimal stocking of the Culture
Fisheries Sector.
…..

Economic Survey Mizoram 2014-15 ~ 61 ~ Agriculture & Allied- Forest
Economic Survey Mizoram 2014-15
FOREST
The forest cover in the country is monitored at the interval of every two years by
Forest Survey of India Dehradun based on
interpretation of Satellite Imageries. Though the
state is rich in forests, it has very limited dense
forests. As per National Forest Policy 1988, in the
hills and in mountainous regions like Mizoram, the
aim should be to maintain two-third of the area
under forest or tree cover in order to prevent soil
erosion and land degradation and to ensure the
stability of the fragile eco-system. As against this
goal; at present notified forests (reserved/
protected forests) constitute about 38% of the
geographical area and even most of these are open,
degraded and subject to pressure of shifting
cultivation, encroachments, fire, illicit felling etc.
Area under various reserved forest in
Mizoram:
SL.NO. TYPE OF FOREST AREA (IN SQ.KM)
1 Area under very dense forest 130
2 Area under moderate dense forest 5841
3 Area under open forest 12960
Source: India State of Forest Report 2013
Forest Development Agency:
The State of Mizoram moved from
State regulation to people‘s participation
for managing its rich forest wealth by
adopting the ―Joint Forest Management‖
(JFM) through a notification issued in
1998. The introduction of JFM established
a new mutually-beneficial relationship
between the forests, the people and the
State. The basic objective of adopting the
mechanism of JFM in the state was to
encourage active involvement of the local
people in enrichment, protection and
sustainable management of the forests.
For ensuring active and constructive
participation of the local people in forest
management, 1(one) State Forest
Development Agency (SFDA), 21 Forest
Development Agencies (FDAs) and 615
Village Forest Development Committees
(VFDCs)/ Eco-Development Committees
(EDCs) have been constituted. Works
under Centrally sponsored schemes –
―National Afforestation Programme‖
(NAP) – are mainly taken up by VFDCs/
EDCs through FDAs. Suitable tree species
have been planted over an area of 60675
ha. under NAP during the period 2003-04
to 2013-2014.
Preservation of Wildlife:
The Environment & Forest
Department, Govt. of Mizoram has taken
praise worthy initiatives for preservation of
wildlife by constituting one Tiger Reserve,
two National Parks, and seven Wildlife
Sanctuaries. The network of protected areas
provide healthy habitats for many wild
animals, birds and reptiles. The area set
aside for long-term wildlife conservation is
1728.75 Sq.km which is more than 8% of
the State‘s geographical area. The details of
protected areas are as under: -
Based on ‗India State of Forest Report-
2013‘ published by Forest Survey of
India, Dehradun about 90.88% of the
State‘s total geographical area is
covered under forests. However the
forests have suffered serious depletion
and degradation due to traditional
practice of shifting cultivation,
uncontrolled fire, unregulated fellings
etc. As per the ―India State of Forest
Report-2013‖ published by Forest
Survey of India, the state has 12,897
Sq.km open forests.
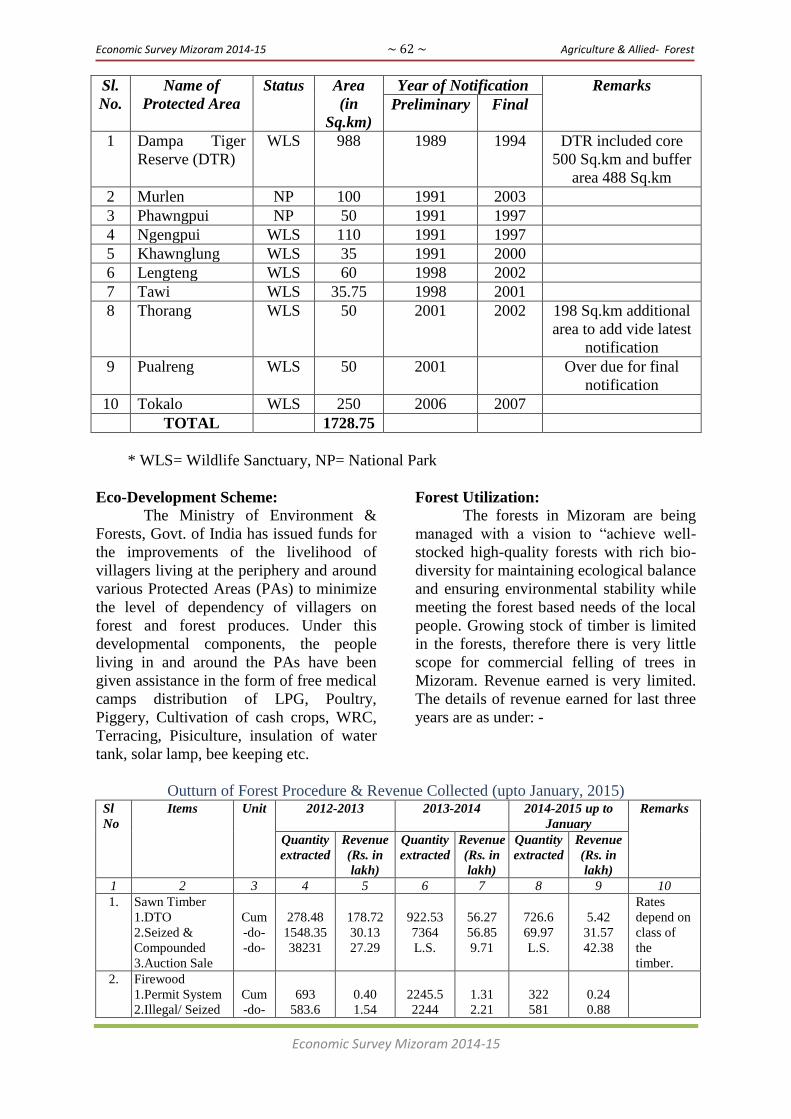
Economic Survey Mizoram 2014-15 ~ 62 ~ Agriculture & Allied- Forest
Economic Survey Mizoram 2014-15
Sl.
No.
Name of
Protected Area
Status Area
(in
Sq.km)
Year of Notification Remarks
Preliminary Final
1 Dampa Tiger
Reserve (DTR)
WLS 988 1989 1994 DTR included core
500 Sq.km and buffer
area 488 Sq.km
2 Murlen NP 100 1991 2003
3 Phawngpui NP 50 1991 1997
4 Ngengpui WLS 110 1991 1997
5 Khawnglung WLS 35 1991 2000
6 Lengteng WLS 60 1998 2002
7 Tawi WLS 35.75 1998 2001
8 Thorang WLS 50 2001 2002 198 Sq.km additional
area to add vide latest
notification
9 Pualreng WLS 50 2001 Over due for final
notification
10 Tokalo WLS 250 2006 2007
TOTAL 1728.75
* WLS= Wildlife Sanctuary, NP= National Park
Eco-Development Scheme:
The Ministry of Environment &
Forests, Govt. of India has issued funds for
the improvements of the livelihood of
villagers living at the periphery and around
various Protected Areas (PAs) to minimize
the level of dependency of villagers on
forest and forest produces. Under this
developmental components, the people
living in and around the PAs have been
given assistance in the form of free medical
camps distribution of LPG, Poultry,
Piggery, Cultivation of cash crops, WRC,
Terracing, Pisiculture, insulation of water
tank, solar lamp, bee keeping etc.
Forest Utilization:
The forests in Mizoram are being
managed with a vision to ―achieve well-
stocked high-quality forests with rich bio-
diversity for maintaining ecological balance
and ensuring environmental stability while
meeting the forest based needs of the local
people. Growing stock of timber is limited
in the forests, therefore there is very little
scope for commercial felling of trees in
Mizoram. Revenue earned is very limited.
The details of revenue earned for last three
years are as under: -
Outturn of Forest Procedure & Revenue Collected (upto January, 2015) Sl
No
Items Unit 2012-2013 2013-2014 2014-2015 up to
January
Remarks
Quantity
extracted
Revenue
(Rs. in
lakh)
Quantity
extracted
Revenue
(Rs. in
lakh)
Quantity
extracted
Revenue
(Rs. in
lakh)
1 2 3 4 5 6 7 8 9 10
1. Sawn Timber
1.DTO
2.Seized &
Compounded
3.Auction Sale
Cum
-do-
-do-
278.48
1548.35
38231
178.72
30.13
27.29
922.53
7364
L.S.
56.27
56.85
9.71
726.6
69.97
L.S.
5.42
31.57
42.38
Rates
depend on
class of
the
timber.
2. Firewood
1.Permit System
2.Illegal/ Seized
Cum
-do-
693
583.6
0.40
1.54
2245.5
2244
1.31
2.21
322
581
0.24
0.88

Economic Survey Mizoram 2014-15 ~ 63 ~ Agriculture & Allied- Forest
Economic Survey Mizoram 2014-15
3. Bamboo
1.Permit
2.Illegal
Lakh
-do-
0.59
2.25
0.70
28.42
9.29
0.99
27.95
4
21.41
0.54
8.96
3.53
Permit
system for
domestic
use. Price
depends on
size of
bamboo.
4. Broomstick
1.Permit
Qtls.
535
2.50
87
0.11
187.70
1.31
Preparation of Working Plans:
Working Plans are important
documents for ensuring scientific
management of the forests. Presently, there
is one approved working plan for Kawrthah
forest division. Working plans for Aizawl,
Kolasib, Mamit, Thenzawl, Lunglei,
N.Vanlaiphai, Tlabung forest divisions and
forest areas under Chakma Autonomous
District Council (CADC) have been
prepared and submitted to the Regional
Office, Ministry of Environment & Forests,
Govt. of India, Shillong for approval. These
working plans are under scrutiny at the
Regional Office.
Bamboo Development in Mizoram:
Mizoram has abundant natural
bamboo resources which covers around
31% (about 6446 Sq.km) of its
geographical area and as many as 35
species of bamboo have been identified in
the state of which Melocanna baccifera
(mautak) contributes about 77% of the total
bamboo coverage.
The extent of bamboo bearing area
in the forests of the State is 9,245 km2.
Density-wise details, number of culms by
soundness and equivalent green weight are
given in following tables:
Bamboo bearing area by density in recorded forest area (Area in Km)
Recorded
Forest
Area
Pure
Bamboo
Dense
Bamboo
Scattered
bamboo
Clumps
hacked
Bamboo
regeneration
No
bamboo
16,717 226 6,116 2,757 104 42 7,472
Estimated number of bamboo culms and equivalent green weight
Number of culms (in millions) Equivalent Green Weight (in 000
tonnes)
Green Dry Decayed Total Green Dry Total
1953 185 67 2205 11150 2037 13187
National Bamboo Mission:
National Bamboo Mission is a
Centrally Sponsored Scheme which
envisages increase in the areas under
Bamboo Plantation of selected species with
intensive management so that the yield
improves from the present 3 tonnes per
hectare (approx. average) to about 18 to 20
tonnes. One of the major components of the
NBM is to increase the coverage area under
bamboo plantation with economically
important bamboo species. In order to
ensure supply of quality bamboo planting
materials, it is necessary to get them
certified by a competent authority. So far
Bamboo Nursery Certification has been
completed in seven States including
Mizoram.
The Mission activities are taken up
in both Forest and Non-Forest Areas. The
schemes in Forest areas are dealt directly
by Environment & Forest Department
through Forest Development Agency
whereas Non-Forest Areas are dealt with by
the Bamboo Development Agency.
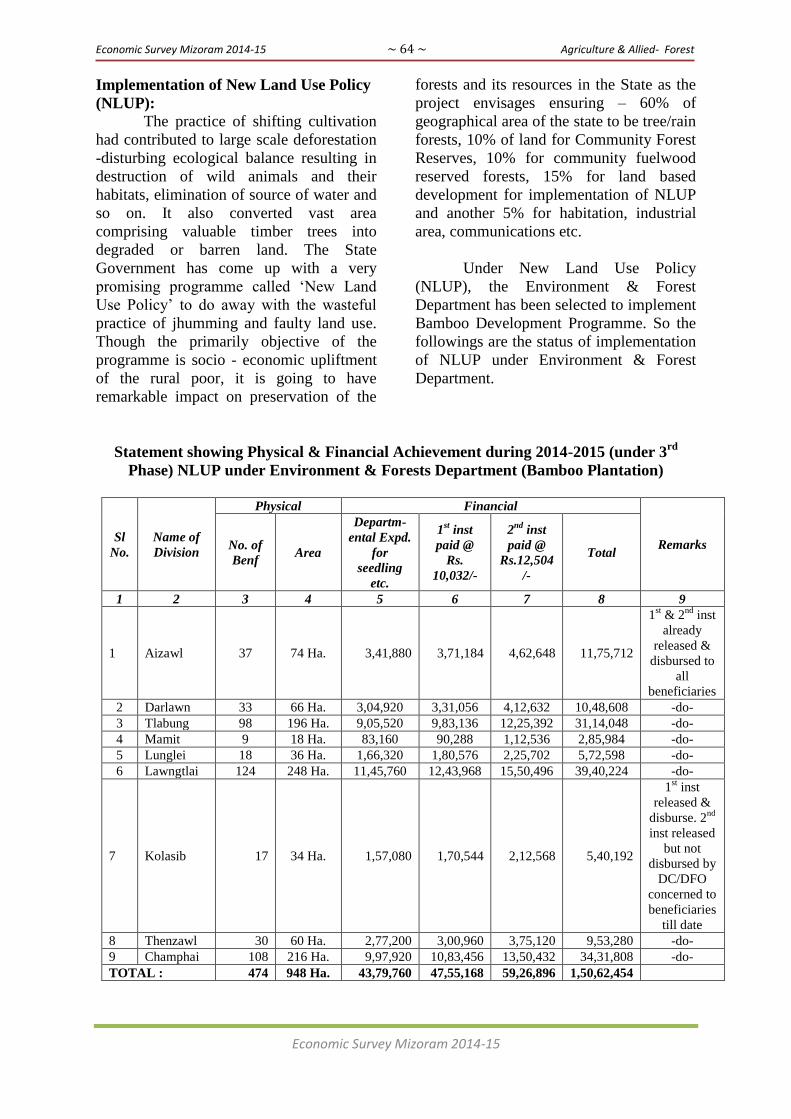
Economic Survey Mizoram 2014-15 ~ 64 ~ Agriculture & Allied- Forest
Economic Survey Mizoram 2014-15
Implementation of New Land Use Policy
(NLUP):
The practice of shifting cultivation
had contributed to large scale deforestation
-disturbing ecological balance resulting in
destruction of wild animals and their
habitats, elimination of source of water and
so on. It also converted vast area
comprising valuable timber trees into
degraded or barren land. The State
Government has come up with a very
promising programme called ‗New Land
Use Policy‘ to do away with the wasteful
practice of jhumming and faulty land use.
Though the primarily objective of the
programme is socio - economic upliftment
of the rural poor, it is going to have
remarkable impact on preservation of the
forests and its resources in the State as the
project envisages ensuring – 60% of
geographical area of the state to be tree/rain
forests, 10% of land for Community Forest
Reserves, 10% for community fuelwood
reserved forests, 15% for land based
development for implementation of NLUP
and another 5% for habitation, industrial
area, communications etc.
Under New Land Use Policy
(NLUP), the Environment & Forest
Department has been selected to implement
Bamboo Development Programme. So the
followings are the status of implementation
of NLUP under Environment & Forest
Department.
Statement showing Physical & Financial Achievement during 2014-2015 (under 3rd
Phase) NLUP under Environment & Forests Department (Bamboo Plantation)
Sl
No.
Name of
Division
Physical Financial
Remarks No. of
Benf Area
Departm-
ental Expd.
for
seedling
etc.
1st inst
paid @
Rs.
10,032/-
2nd
inst
paid @
Rs.12,504
/-
Total
1 2 3 4 5 6 7 8 9
1 Aizawl 37 74 Ha. 3,41,880 3,71,184 4,62,648 11,75,712
1st & 2
nd inst
already
released &
disbursed to
all
beneficiaries
2 Darlawn 33 66 Ha. 3,04,920 3,31,056 4,12,632 10,48,608 -do-
3 Tlabung 98 196 Ha. 9,05,520 9,83,136 12,25,392 31,14,048 -do-
4 Mamit 9 18 Ha. 83,160 90,288 1,12,536 2,85,984 -do-
5 Lunglei 18 36 Ha. 1,66,320 1,80,576 2,25,702 5,72,598 -do-
6 Lawngtlai 124 248 Ha. 11,45,760 12,43,968 15,50,496 39,40,224 -do-
7 Kolasib 17 34 Ha. 1,57,080 1,70,544 2,12,568 5,40,192
1st inst
released &
disburse. 2nd
inst released
but not
disbursed by
DC/DFO
concerned to
beneficiaries
till date
8 Thenzawl 30 60 Ha. 2,77,200 3,00,960 3,75,120 9,53,280 -do-
9 Champhai 108 216 Ha. 9,97,920 10,83,456 13,50,432 34,31,808 -do-
TOTAL : 474 948 Ha. 43,79,760 47,55,168 59,26,896 1,50,62,454
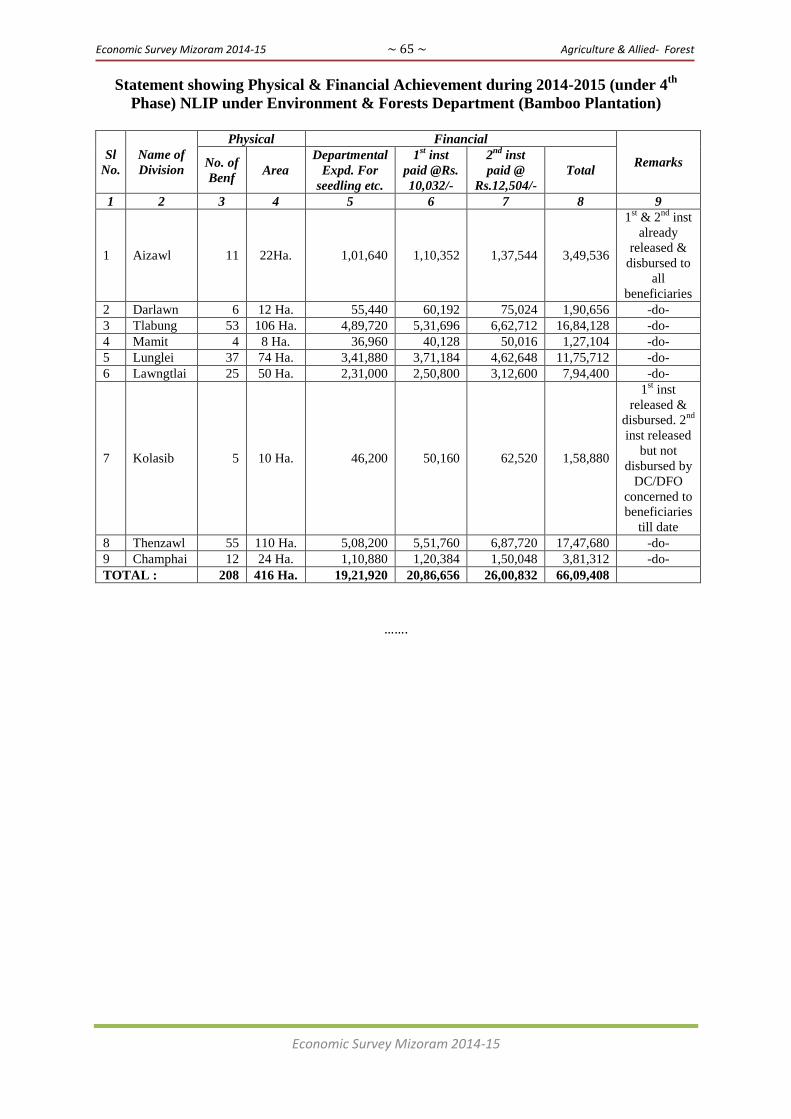
Economic Survey Mizoram 2014-15 ~ 65 ~ Agriculture & Allied- Forest
Economic Survey Mizoram 2014-15
Statement showing Physical & Financial Achievement during 2014-2015 (under 4th
Phase) NLIP under Environment & Forests Department (Bamboo Plantation)
Sl
No.
Name of
Division
Physical Financial
Remarks No. of
Benf Area
Departmental
Expd. For
seedling etc.
1st inst
paid @Rs.
10,032/-
2nd
inst
paid @
Rs.12,504/-
Total
1 2 3 4 5 6 7 8 9
1 Aizawl 11 22Ha. 1,01,640 1,10,352 1,37,544 3,49,536
1st & 2
nd inst
already
released &
disbursed to
all
beneficiaries
2 Darlawn 6 12 Ha. 55,440 60,192 75,024 1,90,656 -do-
3 Tlabung 53 106 Ha. 4,89,720 5,31,696 6,62,712 16,84,128 -do-
4 Mamit 4 8 Ha. 36,960 40,128 50,016 1,27,104 -do-
5 Lunglei 37 74 Ha. 3,41,880 3,71,184 4,62,648 11,75,712 -do-
6 Lawngtlai 25 50 Ha. 2,31,000 2,50,800 3,12,600 7,94,400 -do-
7 Kolasib 5 10 Ha. 46,200 50,160 62,520 1,58,880
1st inst
released &
disbursed. 2nd
inst released
but not
disbursed by
DC/DFO
concerned to
beneficiaries
till date
8 Thenzawl 55 110 Ha. 5,08,200 5,51,760 6,87,720 17,47,680 -do-
9 Champhai 12 24 Ha. 1,10,880 1,20,384 1,50,048 3,81,312 -do-
TOTAL : 208 416 Ha. 19,21,920 20,86,656 26,00,832 66,09,408
…….

Economic Survey Mizoram 2014-15 ~ 66 ~ Agriculture & Allied- Soil & Water Conservation
Economic Survey Mizoram 2014-15
SOIL & WATER CONSERVATION
I. Sectoral Overview
The main aim of Soil & Water
Conservation in the economic upliftment of
the people is enhancement of soil fertility
and its productivity, regeneration of natural
water resources and its conservation for
sustainable biomass production. The
approach is ‗watershed basis‘ and the
means to achieve is through combined
measures of Agronomy, Engineering and
Forestry.
The Department Projected the road
map for development in 12th
PLAN
wherein the thrust areas are: -
1) Intensive rainwater harvesting and
Soil Moisture Conservation for
production enhancement.
2) Protection of arable lands by water
erosion through various forms of
Soil Conservation measures.
3) Extensive cashcrop plantation of
Rubber, Broom, Coffee etc. for
economic upliftment of the people
and for afforestation.
4) Diversification of farming.
5) Improvement of productivity and
production of jhum lands.
6) Manpower and infrastructure
development.
The Annual Plan 2014-15 will
integrate all mechanical and biological
measures for Soil & Water Conservation to
achieve the goal of 12th
Plan following the
road map through land development and
shaping like terracing, bunding, trenching,
water conservation like water harvesting,
farm ponds, percolation tanks, stream bank
Erosion Control Works, series of check
dam across the drainage line, cash crop
plantation like Rubber, Coffee, Broom with
establishment of nurseries. Convergence of
scheme with other line Departments will be
done as far as possible. As in the Annual
Plan 2014-15, NLUP, RKVY and
NABARD RIDF Schemes will form major
components of the revised Annual Plan
2014-15.
II. Activities of the Department in
the Current Fiscal Year
A. New Land Use Policy (NLUP):
Target for 2014 – 2015:
1) Rubber - 371 families
2) Coffee - 350 families
3) Broom - 2200 families
TOTAL - 2921 families
Fund for NLUP during 2014-15 for
development components are as under: -
for 3rd
& 4th
phase beneficiaries:
a) Rubber : 371 families/Ha. @
Rs.62,300.00 = Rs. 231.133 lakh
b) Coffee : 350 families/Ha. @
Rs.74,400.00 = Rs. 260.40 lakh
c) Broom : 2200 families/Ha. @
Rs.88,000.00 = Rs. 1936.00 lakh
TOTAL = Rs. 2427.533 lakh
B. Works under NABARD RIDF:
1000 Ha. Rubber Plantation
had been initiated during 2012-13,
under this scheme with Rs. 362.00
lakh NABARD Loan and Rs. 20.25
lakh as State matching share in the
first year. During 2014-15,
Rs.249.00 lakh as NABARD loan
and State matching share of
Rs.13.11 lakh is utilised for the
following works.
1. Rubber Plantation under
NABARD: (maintenance)
Under this scheme 1000 Ha.
of Rubber Plantation were created
at different Districts and maintained
as follows: -
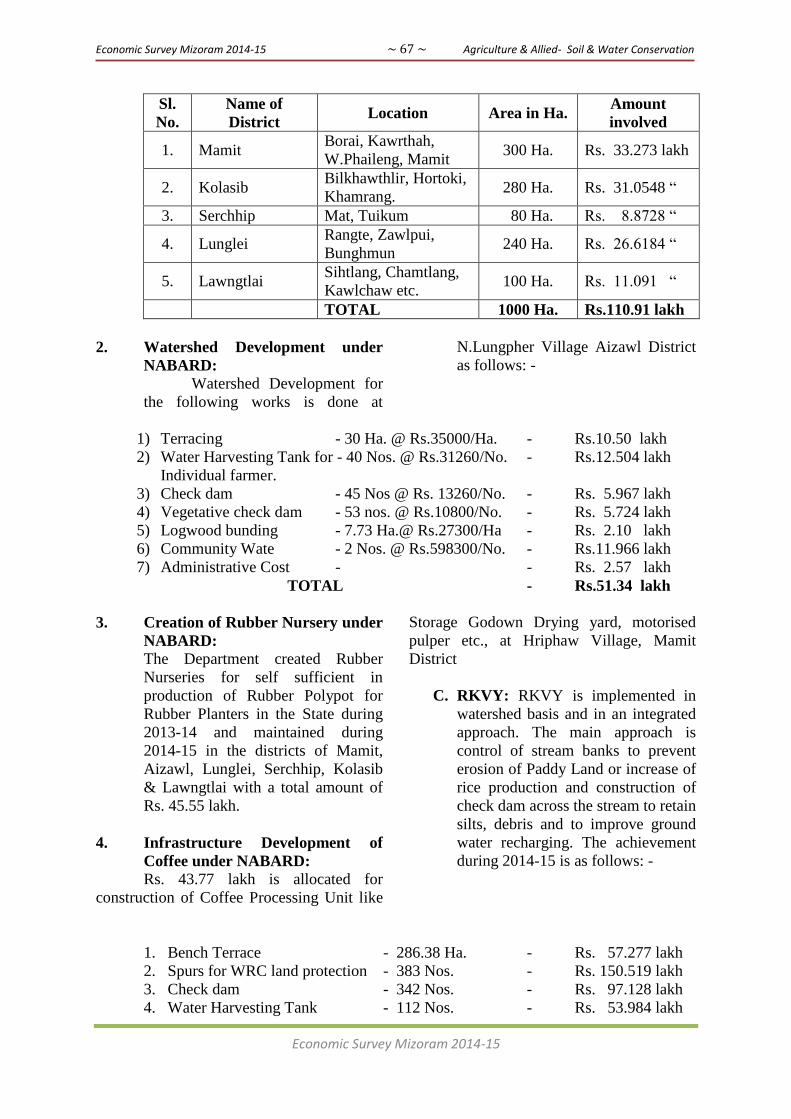
Economic Survey Mizoram 2014-15 ~ 67 ~ Agriculture & Allied- Soil & Water Conservation
Economic Survey Mizoram 2014-15
Sl.
No.
Name of
District Location Area in Ha.
Amount
involved
1. Mamit Borai, Kawrthah,
W.Phaileng, Mamit 300 Ha. Rs. 33.273 lakh
2. Kolasib Bilkhawthlir, Hortoki,
Khamrang. 280 Ha. Rs. 31.0548 ―
3. Serchhip Mat, Tuikum 80 Ha. Rs. 8.8728 ―
4. Lunglei Rangte, Zawlpui,
Bunghmun 240 Ha. Rs. 26.6184 ―
5. Lawngtlai Sihtlang, Chamtlang,
Kawlchaw etc. 100 Ha. Rs. 11.091 ―
TOTAL 1000 Ha. Rs.110.91 lakh
2. Watershed Development under
NABARD:
Watershed Development for
the following works is done at
N.Lungpher Village Aizawl District
as follows: -
1) Terracing - 30 Ha. @ Rs.35000/Ha. - Rs.10.50 lakh
2) Water Harvesting Tank for - 40 Nos. @ Rs.31260/No. - Rs.12.504 lakh
Individual farmer.
3) Check dam - 45 Nos @ Rs. 13260/No. - Rs. 5.967 lakh
4) Vegetative check dam - 53 nos. @ Rs.10800/No. - Rs. 5.724 lakh
5) Logwood bunding - 7.73 Ha.@ Rs.27300/Ha - Rs. 2.10 lakh
6) Community Wate - 2 Nos. @ Rs.598300/No. - Rs.11.966 lakh
7) Administrative Cost - - Rs. 2.57 lakh
TOTAL - Rs.51.34 lakh
3. Creation of Rubber Nursery under
NABARD:
The Department created Rubber
Nurseries for self sufficient in
production of Rubber Polypot for
Rubber Planters in the State during
2013-14 and maintained during
2014-15 in the districts of Mamit,
Aizawl, Lunglei, Serchhip, Kolasib
& Lawngtlai with a total amount of
Rs. 45.55 lakh.
4. Infrastructure Development of
Coffee under NABARD:
Rs. 43.77 lakh is allocated for
construction of Coffee Processing Unit like
Storage Godown Drying yard, motorised
pulper etc., at Hriphaw Village, Mamit
District
C. RKVY: RKVY is implemented in
watershed basis and in an integrated
approach. The main approach is
control of stream banks to prevent
erosion of Paddy Land or increase of
rice production and construction of
check dam across the stream to retain
silts, debris and to improve ground
water recharging. The achievement
during 2014-15 is as follows: -
1. Bench Terrace - 286.38 Ha. - Rs. 57.277 lakh
2. Spurs for WRC land protection - 383 Nos. - Rs. 150.519 lakh
3. Check dam - 342 Nos. - Rs. 97.128 lakh
4. Water Harvesting Tank - 112 Nos. - Rs. 53.984 lakh

Economic Survey Mizoram 2014-15 ~ 68 ~ Agriculture & Allied- Soil & Water Conservation
Economic Survey Mizoram 2014-15
5. Logwood bunding for - 123.95 Ha. - Rs. 22.312 lakh
Improvement of Jhum lands
6. Community Water Storage - 4 Nos. - Rs. 24.280 lakh
TOTAL : - Rs. 405.50 lakh
- - -
The achievement is 50%
from the total allocation of fund
Rs.811.00 lakhs under RKVY for
2014-15.
IV. Outcome of the Department‟s
Activities So Far and Expected
Outcome (Impact on Economy)
1) The existing practice of Jhum
cultivation is not productive and
leads to massive soil erosion. The
introduction of cash crop plantation
like Rubber, Coffee and Broom will
replace Jhumming Practices in a
phase manner for a better
Productivity of the land.
2) Income of the farmers will be
increased to a considerable extent
with the introduction of Rubber,
Coffee and Broom.
3) Employment opportunities in
Rubber, Coffee and Broom
Plantation for the rural unemployed
youth.
4) Permanent Plantation area of
Rubber, Coffee and Broom will
reduce the Jhum area and higher
income to farmers.
5) Conservation of Soil fertility and
soil moisture for sustainable
production.
6) Nurseries created for Rubber under
NABARD will make the State Self
Sufficient in seedlings budwood,
Rubber Stump and Rubber Polypot
Production. This will prevent the
out flow of money to neighbouring
States like Tripura and Assam in
purchasing of Rubber Polypot etc.
7) RKVY works will increase far
production.
V. Policy Constraints required to be
addressed
1. Broom cultivation is not
allotted to any Department in the
business of transanction issued by
the Government. The Department of
Soil & Water Conservation has
taken up broom cultivation under
NLUP and 6552 Broom farmers are
assisted under this Programme.
Therefore, it is suggested that
broom cultivation may be allotted to
Soil & Water Conservation
Department in the Government
Allocation of Bussiness
Transanction please.
2. Important Watershed
Management and Erosion Control
Programme like Integrated
Watershed Management (IWMP) is
presently implimented by the Rural
Development Department of
Mizoram. It is suggested that Soil &
Water Conservation Department
take up the nodality and the
implementation as the Department
has enough technical manpower to
oversee the Programme.
…..
Economic Survey Mizoram 2014-15 ~ 69 ~ Agriculture & Allied- Border Trade
Economic Survey Mizoram 2014-15
TRADE & COMMERCE
I. Sectoral Overview: Trade &
Commerce Department was created in the
year 1987 with a view to improve the
economic condition of the state through
promotion of trade and commercial
activities. Also realizing that agricultural
sectors from the economic backbone of the
State, adequate provisions were made to
improve and promote agricultural
marketing through regulation of
agricultural markets and through
sufficiently safeguarding the interest of
marginal farmers against all forms of
unhealthy competition and exploitation. As
envisaged in the Memorandum of
Settlement signed in the Peace Accord of
1986, the function of development of
Border Trade with the friendly neighboring
countries with whom Mizoram share 722
km long International border was allocated
to Trade & Commerce. This Department
took over the administration and
management of markets from Land
Revenue & Settlement Department (LR&S
Deptt.) and Local Administration
Department (LAD) with effect from
August, 2000. This Department is also
entrusted with the function of Channelizing
ASIDE Scheme fund of the Ministry of
Commerce & Industries (MoC&I),
Government of India and also to clear
projects under ASIDE Scheme.
Thus, with subsequent allocation of
additional functions to Trade & Commerce
Department under the Government of
Mizoram (allocation of Business) Rules,
1987, the following became the functions
of this Department.
1. Promotion and Regulation of Trade
& Commerce.
2. Agricultural Marketing including
Sericulture products.
3. Regulated markets.
4. Establishment of Markets Yards and
Trade Centres.
5. Border Trade.
6. Trading by Non-Tribals
(Regulation) Act, 1974 and Rules
there under
7. Inter-State Trade
8. (a) Market Regulation
(b) Market Rules (vide Notification
No. A.46011/2/97-GAD dt.
10.7.2000)
9. Fund channelizing Agency under
ASIDE Scheme.
10. Development of Border Trade under
ASIDE Scheme.
11. State Level Export Promotion.
12. Collection of Toll Taxes on Indo-
Myanmar Bridge over Tiau River.
Apart from the above allocated
functions, this Department has directly
taken up the responsibility of implementing
Centrally Sponsored Schemes and Projects
such as:
1. Market Research Information
Network (MRIN) Scheme also
called the AGMARKNET Scheme
of the Directorate of Marketing &
Inspection, Ministry of Agriculture.
2. Technology Mission for Integrated
Development of Horticulture in
North East India comprising Mini
Mission III (MM-III) components,
National Horticulture Board (NHB).
3. Gramin Bhandaran Yojana (Rural
Godown Scheme) of Department of
Agriculture, Government of India.
4. Macro-management Scheme,
Ministry of Agriculture &
Cooperation, Government of India.
5. This Department has also been
Notified as the Nodal Department
for the Competition Commission,
Act, 2002 vide No. D.
24015/21/2005-TC Dt. 20.7.2005
II. Department‟s contribution in the
economy (Role of the Sector): By giving
priority to improve marketing of
agricultural produces bu providing physical
market infrastructurre, the Department‘s
Economic Survey Mizoram 2014-15 ~ 70 ~ Agriculture & Allied- Border Trade
Economic Survey Mizoram 2014-15
contribution in the economy i.e. Revenue
Collections by way of Permit fees on
export and import of agricultural products,
market fees and stall rent.
III. Activities of the Department in
the current fiscal year: Besides collection
of revenues, the Department is constructing
infrastructures for the development of
Border Trade with neighbouring countries
etc. with ASIDE Scheme fund of the
Ministry of Commerce & Industries etc.
IV. Outcome of the Department‟s
activities so far and expected outcome
(Impact on economy):
(a) Development of Border Trade:
The Mizoram Allocation of
Business (1987) allocated Border Trade as
under the purview of Trade & Commerce
Department. The Department has taken up
the development of Border Trade with
Myanmar and Bangladesh.
Mizoram share 722km International
boundary with Myanmar and Bangladesh.
The funding of Infrastructure
Development has been met through ASIDE
Scheme from Ministry of Commerce &
Industry, Government of India.
Border Trade with Myanmar
Border Trade Centre at Vaphai,
Farkawn, Sangau and Thingsai:
For improvement of trade and development
of closer ties or bonds with our
neighbouring countries Border Trade
Centre at Vaphai, Farkawn and Sangau has
started with a project cost of Rs. 8 crores
each. The Department spent a sum of Rs.
90 lakhs for Vaphai, Rs. 80 lakhs each for
Farkawn and Sangau for development of
Border Trade Centre. The allocated amount
has been spent for site preparation/side
development, brick wall fencing, godown,
quarters etc.
The State Government received a
sum of Rs. 4.3 crore under ASIDE Scheme
for the current financial year. The fund will
be allocated to Trade & Commerce
Department and Industry Department.
Infrastructure development has
enhanced the generation of employment
like Mistiri, Labourers, Drivers, Material
Suppliers etc. in the contract works; this
has fostered progressive increase of
employment in unorganized sectors.
Development of infrastructure for
Border Trade Centre/LCS is one kind of
Capital formation. On completion, trade
will increase in manifold which will further
lead to increased activities of traders, more
collections of Customs duties etc.
The role of Trade & Commerce
Department will be development of
infrastructure for border trade by
chanelising fund received from Govt. of
India.
Needless to say that, as per clause
41 of VII Schedule of the constitution of
India trading with foreign countries is the
purview of Govt. of India only. Such is the
case that the State Government has no
authority on collection of fees/taxes from
traders.
(b) Export Development Fund for the
North Eastern Region of India
(EDF - NER):
Trade & Commerce Department has
taken up Export Development Fund - North
Eastern Region (EDF - NER) as the nodal
Department. EDF - NER fund is provided
by the Ministry of Commerce & Industry,
Govt. of India and is managed by
Agricultural & Processed Food Products
Export Development Authority (APEDA).
Under the EDF - NER five projects have
been funded by the Ministry of Commerce
& Industry till date as below -
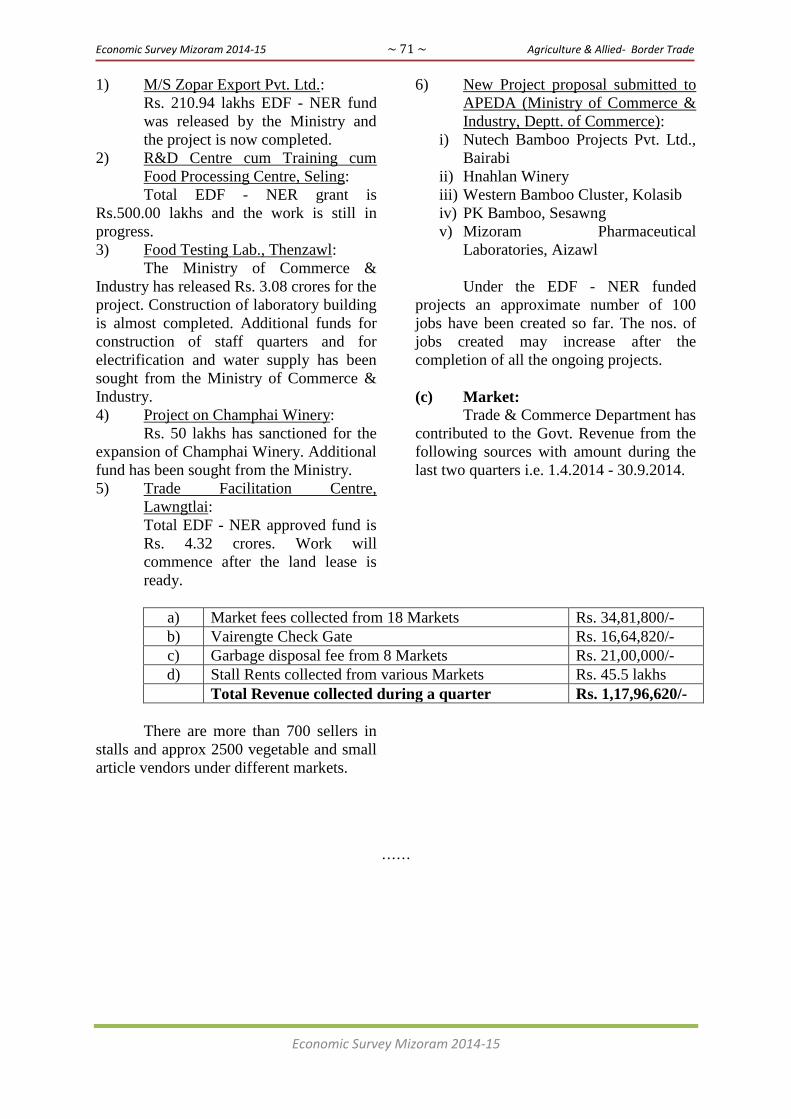
Economic Survey Mizoram 2014-15 ~ 71 ~ Agriculture & Allied- Border Trade
Economic Survey Mizoram 2014-15
1) M/S Zopar Export Pvt. Ltd.:
Rs. 210.94 lakhs EDF - NER fund
was released by the Ministry and
the project is now completed.
2) R&D Centre cum Training cum
Food Processing Centre, Seling:
Total EDF - NER grant is
Rs.500.00 lakhs and the work is still in
progress.
3) Food Testing Lab., Thenzawl:
The Ministry of Commerce &
Industry has released Rs. 3.08 crores for the
project. Construction of laboratory building
is almost completed. Additional funds for
construction of staff quarters and for
electrification and water supply has been
sought from the Ministry of Commerce &
Industry.
4) Project on Champhai Winery:
Rs. 50 lakhs has sanctioned for the
expansion of Champhai Winery. Additional
fund has been sought from the Ministry.
5) Trade Facilitation Centre,
Lawngtlai:
Total EDF - NER approved fund is
Rs. 4.32 crores. Work will
commence after the land lease is
ready.
6) New Project proposal submitted to
APEDA (Ministry of Commerce &
Industry, Deptt. of Commerce):
i) Nutech Bamboo Projects Pvt. Ltd.,
Bairabi
ii) Hnahlan Winery
iii) Western Bamboo Cluster, Kolasib
iv) PK Bamboo, Sesawng
v) Mizoram Pharmaceutical
Laboratories, Aizawl
Under the EDF - NER funded
projects an approximate number of 100
jobs have been created so far. The nos. of
jobs created may increase after the
completion of all the ongoing projects.
(c) Market: Trade & Commerce Department has
contributed to the Govt. Revenue from the
following sources with amount during the
last two quarters i.e. 1.4.2014 - 30.9.2014.
a) Market fees collected from 18 Markets Rs. 34,81,800/-
b) Vairengte Check Gate Rs. 16,64,820/-
c) Garbage disposal fee from 8 Markets Rs. 21,00,000/-
d) Stall Rents collected from various Markets Rs. 45.5 lakhs
Total Revenue collected during a quarter Rs. 1,17,96,620/-
There are more than 700 sellers in
stalls and approx 2500 vegetable and small
article vendors under different markets.
……

Economic Survey Mizoram 2014-15 ~ 72 ~ Infrastructure- Power & Electricity
Economic Survey Mizoram 2014-15
IX. INFRASTRUCTURE
POWER & ELECTRICITY
I. Overview of Power Sector in
Mizoram
Power & Electricity Department of
Mizoram involves in generation,
transmission and distribution of electricity
since 1979. The department sells the
electricity to around 1.9 lakhs consumers
and collects revenue to the tune of around
100 crores annually. The per capita
consumption of electricity of the state is
271kWh during 2013-14. As per the 18th
Power Survey of India, the bulk power
requirement of Mizoram is 201MW and
the allocated share is 103.09MW (real time
power availability is normally 60MW)
hence, there is much power shortage and
the AT&C loss is 30.79% last year. The
present peak demand is 110MW but by
staggering the water pumping and
industrial load during morning and evening
peak hours, the demand is restricted to
around 70 MW in the evening. Against this
demand, the department can generate only
about 15MW from the installed capacity of
29.35MW as the generating stations are
rain fed run-off the river hydro electric
project. The rest of the requirement has to
be imported from various sources like
Loktak, Ranganadi, etc from Central Sector
Utilities like NEEPCO, NHPC, NTPC, etc.
The Department looks after the
following assets as on March 2014: -
1 Thermal Power Plant 1 No (22.92 MW)
2 Diesel Power Station 1 No (0.5 MW)
3 Hydel Generating Station 11 Nos (29.35MW)
4 132kV lines 728.96 Kms
5 66kV lines 117 Kms
6 33kV lines 1170.026 Kms
7 11kV lines 5044.747 Kms
8 LT lines 2746.59 Kms
9 132kV Grid Sub-Station 7 Nos
10 33kV Grid Sub-Station 45 Nos
11 Distribution Transformers 1648 Nos
II. Contribution in the Economy
Mizoram has sizeable scope
towards increase of its revenue by
harnessing its rich hydro potential which is
estimated around 3662.78MW, reduction
of losses by implanting accountability to
various levels and trading of excess power
received from N.E. grid during monsoon
season and in off-peak hours. The situation
of Department Expenditure and Revenue
Collection during 2013-14 is mentioned
below: -
1 Expenditure on Power purchase Rs 178.39 crore
2 Other D&A Expenditure Rs 138.67 crore
3 ARR during 2013-14 (1+2) Rs 317.06 crore
4 Revenue collection Rs 111.63 crore
5 Revenue Arrear Rs 11.96 crore
6 Total Revenue (4+5) Rs 123.59 crore
7 Rate of sale of energy Rs 4.08 per Unit
8 Required sale rate to meet ARR Rs 10.47 per Unit
(ARR = Aggregate Revenue Requirement)

Economic Survey Mizoram 2014-15 ~ 73 ~ Infrastructure- Power & Electricity
Economic Survey Mizoram 2014-15
III. Activities in the Current Fiscal
Year
Generation: The installed capacity of
Hydel Generation in Mizoram at present is
29.35MW. To enhance Hydel generating
capacity the Department is taking up
construction of various Hydel Projects
which are in various stages of construction
as elaborated below: -
a) Small & Micro Hydel Projects
under execution
i) Tlawva SHP (5MW) : Targetted
for completion within March 2017
ii) Kawlbem SHP (3.5MW) :
Targetted for completion within
March 2017
iii) Tuiriza MHP (0.5MW) :
Targetted for completion within
December 2015
iv) Tuiching MHP (0.5MW) :
Targetted for completion within
December 2015
TOTAL – 9MW
b) Hydel Projects which are being
allotted to Independent Power
Producers (IPP)
i) Kolodyne Phase-II (460MW) (MoU
signed with NTPC)
ii) Bairabi Dam Project (80MW)
(MoU signed with M/s SPL)
iii) Tuivawl HEP (42MW) (MoU
signed with M/s SPML)
iv) Mat HEP (75MW) (MoU signed
with NEEPCO)
v) Chhimtuipui HEP (635MW) (MoU
signed with NEEPCO)
vi) Lungreng HEP (815MW) (MoU
signed with NEEPCO)
vii) Tlawng HEP (54MW) (MoU signed
with Shyam Mitalic & Energy)
TOTAL – 2107MW
c) Small Hydel Projects for which
DPRs are ready (1MW to 25MW)
i) Tuirini SHP (25MW)
ii) Iva SHP (3MW)
iii) Ngengrual SHP (1MW)
iv) Tuikum SHP (3.5MW)
v) Tuisih SHP (2MW)
vi) Khawchhaktuipui SHP (3MW)
TOTAL – 29MW
d) Hydel Projects for which DPRs
are to be prepared
i) Tuichang HEP (106MW)
ii) Tuipui HEP (60MW)
TOTAL –166MW
e) Renewable Energy Projects
submitted to MNRE
i) R&M of Tuipanglui SHP (3MW)
ii) R&M of Teirei SHP (3MW)
iii) R&M of Maicham Phase-I (2MW)
TOTAL – 8MW
f) Small Hydel Project where S&I
will start shortly
i) Tut SHP (25MW)
TOTAL – 25MW
Transmission, Transformation &
Distribution: In regard to transmission and
transformation, capacity of 638.37kms and
140MVA respectively was created during
the 11th
Plan. During the 12th
Plan period it
is targeted to add 369Km and 362.50MVA
to augment transformation capacity
throughout the State. Besides, project
proposal for 74Km long 132KV line from
Bairabi to West Phaileng at an estimated
cost of over Rs.45.50 crore has been
submitted to NEC for funding.
Power Distribution system in the
State also needs strengthening and
revamping. The existing distribution lines
and sub-stations were constructed years
ago. The system has become old and its
structural deformities have to be removed
immediately. Otherwise, the AT&C loss,
which is now 30%, cannot be brought
down. This makes the problem of power
shortage more acute. This issue was
discussed in the Power Minister‘s
Conference of 2013. Thereafter, in the light
of the suggestions made in the said
Conference, we have submitted to CEA a
proposal for renovation of the transmission
system at a estimated cost of Rs.137 crore.
Four schemes relating to improvement of
the distribution system are submitted to the
Ministry of DoNER for funding under
NLCPR. Similarly, for the current year the
State Govt. has prioritized 3 schemes for
construction of 33/11KV Sub-stations,
strengthening of 1 existing Sub-station and
Economic Survey Mizoram 2014-15 ~ 74 ~ Infrastructure- Power & Electricity
Economic Survey Mizoram 2014-15
construction of one 33KV transmission line
to be funded under NLCPR.
The state also needs to improve its
Grid discipline by establishing a full-
fledged SLDC - Rs. 30 crore for which
concept note is submitted to NEC for
funding and Upgradation of Control &
Protection of EHV Transmission and
Transformation System - Rs.37.40 crore
for which grant is awaited from PSDI
funding.
RGGVY: Under RGGVY scheme 170 un-
electrified villages have been provided
electricity, 517 villages covered under
Intensive Electrification (IE) and 25537
BPL households have been given free
connection up to Dec 2014.
R-APDRP: Under part ‗A‘ of RAPDRP
baseline data survey for the identified
villages and setting up of IT infrastructure
at an estimated cost of Rs.35.12 crore are
nearing completion. For part ‗B‘ the
Steering Committee approved a project cost
of Rs.240.41 crores and the first installment
has been released by PFC. Work under this
phase is likely to be completed by
September, 2016. With this AT&C loss
will hopefully be kept within 15% at the
scheme area. However, this sanction is
convertible to loan on basis of
performance. The financial position of the
state does not allow fluid release of the
fund to the department and may hamper
progress of the scheme.
Comprehensive Scheme for
strengthening of Transmission and
Distribution System in N.E.R. and
Sikkim: The Scheme envisage
Construction of inter and intra State
Transmission / Sub-Transmission Schemes
and Distribution Scheme (upto 33kV). At
present, Government of India have
approved implementation of the 1st Tranche
for 6 N.E. States viz. Assam, Arunachal
Pradesh, Nagaland, Meghalaya, Mizoram,
Manipur and Tripura at Rs.4923.32 crore.
Out of which the Mizoram package is
Rs.298.90 crore consisting of the following
works: -
1) Transmission Line
a) 132kV Lungsen to Chawngte line 75Km
b) 132kV Chawngte to S.Bungtlang line 80Km
c) 132kV W.Phaileng to Marpara line 59Km
2) Sub-Station
New Sub-Station
a) 2x12.5MVA, 132/33kV S/S at Lungsen
b) 2x12.5MVA, 132/33kV S/S at W.Phaileng
c) 2x12.5MVA, 132/33kV S/S at Marpara
Sub-Station Augmentation
a) Lunglei - 132/33kV, 2×25MVA
b) Lungsen Extension – 33kV Bay
c) Chawngte Extension – 33kV Bay
d) Chawngte Extension – 33kV Bay
e) S.Bungtlang Extension – 33kV Bay
IV. Outcome and Expected Outcome
a) Achievements during 2014-15
i) Construction of 2.5MVA,
33/11kV Sub-Station at
Durtlang with 9Kms associated
line from 132kV Zuangtui S/S
funded by NEC is completed at
an estimated cost of Rs 480.79
lakh and commissioned on
9.12.2014.
ii) Construction of 12.5MVA,
132/33kV Sub-Station at
Champhai is completed at a cost
of Rs 1232.87 lakh under SPA
and commissioned on October
2014.
Economic Survey Mizoram 2014-15 ~ 75 ~ Infrastructure- Power & Electricity
Economic Survey Mizoram 2014-15
iii) Improvement of 33/11kv Sub-
Station at Ngopa with
associated lines funded by NEC
is completed at an estimated
cost of Rs 402.00 lakh.
iv) Construction of 132kV
Khumtung - I bay at Melriat,
Mizoram funded by NEC is
completed at an estimated cost
of Rs 396.00 lakh.
v) Construction of 132kV
Khumtung-II bay at Melriat,
Mizoram funded by NEC is
completed at an estimated cost
of Rs 232.00 lakh.
vi) Construction of 2.5MVA,
33/11kV Sub-Station at
Zokhawsang AR Complex
funded by NEC is completed at
an estimated cost of Rs 367.51
lakh.
b) Projected/Proposed Achievement
for the Year 2015-16
i) Construction of 132 kV D/C
line from 132kV Sub-Station,
Luangmual to 132kV Sub-
station, Sihhmui
ii) Construction of 33/11kV Sub-
Station at Sialhawk
iii) Construction of 33/11kV Sub-
Station at Khawhai
iv) Constn. of new 132kV Sub-
Station for shifting of 132kV
Sub-Station, Zuangtui
v) Construction of 33kV D/C
line from Melriat to link 33kV
S/S at Mualpui and
Tlangnuam
vi) Construction of 132kV S/C
transmission line from Melriat
S/S (14.5cKm.) to Luangmual
and 132kV bay at Luangmual
vii) Construction of Tuiriza
(100kW) and Tuiching
(100kW) Micro Hydel Project
in Phullen and Hrianghmun
viii) Construction of 2.5MVA,
33/11kV Sub-Station at
S.Khawbung with associated
lines.
ix) Construction of 132kV S/C
Line on D/C tower from
Kolasib to Aizawl (Melriat)
with LILO of one Ckt at
Aizawl (Zuangtui) 132kV S/S
V. Policy Constraints
A. Economy Measures
1. Timely allocation of fund for
Purchase of Power and permanent
exemption of Power purchase bill at
Treasury to avoid Power Regulation
to the State.
2. Improvement of procurement
system by re-introducing stock
suspense fund:
Due to the non-availability of stock
suspense fund, the Department
could not mobilize material
requirement for maintenance
purpose and for construction of new
projects viz. EHV Sub-Stations,
Transmission lines and Generating
Stations. If the Government re-
introduce stock suspense fund, there
will be time gain in completion of a
project as the fund sanctioned for a
particular project is ready for
disbursement at a very later stage
due to the long procedure of
obtaining Expenditure Sanction.
3. Presenting Department Cheque
direct to the Bank after
Expenditure Sanction is given:
The present system of Public Works
Cheque, after obtaining
Administrative Approval and
Expenditure Sanction, presented to
the Treasuries for payment which is
held up for sometime and seek
permission of cheque clearance
again to the Government delay the
project works. In order to have
speedy development works, the
present system of public works
cheque presented to the treasury
may be changed as per Central
Public Works Account Code Para
6.2.1
Economic Survey Mizoram 2014-15 ~ 76 ~ Infrastructure- Power & Electricity
Economic Survey Mizoram 2014-15
B. Toning of the Administration
1. Additional Human Resources is
required to prepare check & balance
sheet of the Department. Corporate
accountants are required.
2. To allow the Department to have
Legal Adviser who will be
representing the Department in
Court cases, so that the Department
will have a chance to argue
reasonably.
C. Increasing additional resources of
the Department
1. Amendment of the Mizoram
Allocation of Business Rules 1987
(Rule 3 – Schedule XXVIII) Sl. No.
2 as “Generation, Transmission,
Distribution and Trading of
Electric Power”.
Power trading is activity of
buying and selling of power. At
Power Exchanges, which are
approved by Central Electricity
Regulatory Commission (CERC),
standardized Products are offered to
buy and sell power. Power from
Central Generating Stations (CGSs)
is allocated to beneficiary states on
percentage basis. Sometimes,
surplus power is available for sale
from the total power available for
Mizoram from Inter-State
Generating Stations (ISGS‘s), with
additions from local generations
especially during high hydro period
and during off peak hour of the day.
Alternatively, there can arise
demand of additional power to meet
the shortfall in the state especially
during lean hydro period and peak
hour of the day.
The un-utilised or surplus power
(Under-drawal quantum from
schedule) available can be disposed
off under Deviation Settlement
Mechanism and in line with
relevant CERC regulation, the
rates/charges of which vary
according to the corresponding grid
frequency. Under this mechanism,
there is no deviation charge
receivable for under-drawal in
excess of 12% of scheduled drawal
even if system frequency is less
than 50.05Hz and the charges are
sometimes payable by the
beneficiaries even in case of under-
drawal if the frequency is 50.10 Hz
and above. As such, there is a risk
for sale of power under this
mechanism. Alternatively,
additional demand of power could
also be managed under this
mechanism in a similar manner
depending upon the power
availability as a whole and network
condition.
Apart from the above, power
trading can also facilitate
management of power during
shortage and surplus as well. Power
exchange facilitates equitable,
transparent and efficient trading of
power and acts as a neutral platform
by serving one stop shop. It
provides payment guarantee, credit
management and transparent price
discovery mechanism. Price in
power exchange is governed by the
market forces i.e principle of
demand and supply. On examining
the above mentioned mechanisms,
management of power by way of
trading through exchange is more
recommendable in comparison with
Deviation Settlement Mechanism/
UI Mechanism.
In spite of the above, power
trading is not incorporated in the
Allocation of Business Rules 1987
under Power & Electricity
Department. Therefore, it is
suggested that trading business be
incorporated on the above ground.
…..

Economic Survey Mizoram 2014-15 ~ 77 ~ Infrastructure- Transport & Communications
Economic Survey Mizoram 2014-15
TRANSPORT & COMMUNICATIONS
ROADS
I. Sectoral Overview
A. Roads Sector:
The Mizoram State Road Statistics
2014 is prepared based on the information
gathered from various Road and Highway
Division of PWD, Mizoram. This Statistics
is prepared as per Road Classification-wise
and Sketch Maps of roads under various
Divisions are appended for reference.
As per the Mizoram State Road
Statistics 2014, the total length of all types
of roads in Mizoram as on 2014 is 7548.03
Km and road density is 35.80 Km/00 sq.km
approximately while the Average National
Level Road Density is 129.00 Km/100
Sq.Km.
Roads under State PWD
Sl.
No. Black Top Un-surfaced Total
1 National Highway 876.700 109.830 986.530
2 State Highway 310.450 0.000 310.450
3 Major District Road 587.400 41.600 629.000
4 Other District Road 813.200 208.600 1021.800
5 Village Road 437.537 1473.110 1910.647
6 Road within Towns & Villages 510.524 204.382 714.906
7 City road 253.202 44.204 297.406
Total under State PWD 3789.013 2081.726 5870.739
Road under BRO 877.980 366.410 1244.390
Road under other Departments 0.000 432.900 432.900
Grand Total 4666.993 2881.036 7548.029
In a developing State without big
industries to boost the economic health in
general, Road sector contributes the main
chunk of employment, Job Creation,
Capital Formation and enhancement of the
Gross State Domestic Product apart from
infrastructure created and maintained for
smooth flow of traffic. With minimal
contribution from the private sector, Road
Construction and Maintenance by public
funding through the State Public Works
Department continues to be the biggest
industry in the State.
II. Department‟s contribution in the
economy (Role of the Sector)
Mizoram PWD is responsible for
construction and maintenance of roads,
bridges and building in the state. Since
Road transport is the only mode of
transport within the state, improvement of
road network is the major key to achieve
the development in the state. Better
connectivity enhances the environment for
development and growth by reducing
freight and passenger transport costs, and
by providing quicker and safer access to all
parts of the state and to neighboring state
and countries thereby promoting tourism in
the state. As the major occupation of the
people being agriculture, easy access to a
remote, hilly, mountainous region and low
lying areas of a maximum potential areas
causing increased agricultural product in
the State.
Ultimately, improvement of roads
communication networks in the state results
in economic and social development, better
access to health and education services for
a large portion of the state‘s population
especially women and girls, lower costs for
Economic Survey Mizoram 2014-15 ~ 78 ~ Infrastructure- Transport & Communications
Economic Survey Mizoram 2014-15
goods and services and improved market
access for Mizoram‘s agricultural and
industrial products.
As such above, the contribution of
PWD could not be over-emphasized and it
may be reiterated that Mizoram PWD plays
an indispensable part for boosting
development initiatives and for picking up
of economic development evenly across the
State.
III. Activities of the Department in
the current fiscal year
During 2014-15, Mizoram PWD
has been taking many steps for the building
up of major infrastructure development in
the State. Roads, Highways, Bridges and
Buildings are constructed under different
heads within the state and the activities
may be highlighted as below: -
1. Under State Plan:
The following works are taken up
during fiscal 2014-15 from State Plan as
below: -
I) Improvement of roads
within Aizawl City: Aizawl, being
the Capital City is a fast developing
State capital, the significance
development of the City and its
surrounding Towns is generally
imparted by the development of
internal roads. There is an
approximate road network of
297.00 km length within the city.
An amount of Rs.1000.00 lakhs is
allocated during 2014-15 for
improvement of existing roads
within the city.
a) It was proposed to cover
33.50 km length of 42 roads
for Improvement of Riding
Quality within the City at
the cost of Rs. 590.35 lakh
during the fiscal 2014-15.
b) Also it was proposed to
cover 3.42 km length of 14
roads for construction of
pavement within the City at
an amount of Rs. 107.00
lakh during the fiscal 2014-
15.
c) The remaining amount
Rs.302.65 lakh was kept for
improvement & widening of
19 roads, permanent works
like Retaining walls &
Breast walls, cross drainage,
side drain and link drain at
various places within the
City.
II) Improvement of roads
within District Capital: An amount
of Rs. 400.00 lakh is allocated for
improvement of all the District
capital in the State (7 district capital
except Aizawl).
a) Rs. 103.20 lakh is kept for
Improvement of Riding
quality for roads at various
District capitals in the State.
b) Whereas Rs. 74.17 lakh and
Rs. 170.23 lakh is kept for
Metalling & Blactopping
and for construction of
Pavement respectively for
various roads within the
District capital in the State.
c) The remaining Rs. 52.40
lakh was kept for
construction of permanent
structure and cross drainage
at various places within the
district capital in the State.
III) Improvement of Roads
within Town & Villages: An
amount of Rs. 300.00 lakh is
allocated for improvement of Town
& Villages Roads in the State.
a) Rs. 88.53 lakh is kept for
IRQ of road at various
places in Town & Villages
roads.
b) Rs. 47.00 lakh is kept for
MBT of roads at various
places within Town &
Villages roads.

Economic Survey Mizoram 2014-15 ~ 79 ~ Infrastructure- Transport & Communications
Economic Survey Mizoram 2014-15
c) Rs. 108.77 lakh is kept for
construction of Pavement at
various places within Town
& Villages roads.
d) And the remaining Rs. 55.70
lakh is kept for construction
of permanent structure at
various locations.
IV) Improvement &
Rehabilitation of District Roads: An
amount of Rs.300.00 lakh is
allocated for improvement &
Rehabilitation of District Roads in
the State.
a) Rs. 58.00 lakh is kept for IRQP
of District roads at various
places.
b) Rs. 38.00 lakh is kept for MBT
of District roads at various
places within the state.
c) Rs. 19.00 lakh is kept for
Construction of Pavement for
District roads within the state.
d) The remaining Rs. 185.00 lakh
is kept for construction of
permanent structure and cross
drainage at various locations.
2. Projects under NABARD:
Rs. 900.00 lakh is allocated for
construction of the following roads under
NABARD during 2014-15 as below.
1. Strengthening and Rehabilitation of
W. Phaileng to Marpara Road
(80.00 kms): Sanctioned amount for
the work is Rs. 4,314.00 lakhs.
Present progress of the work is 80%
physically and Rs. 3,937.27 lakhs
financially and the work is expected
to be completed on March 2015.
The balance fund, Rs. 377.00 lakh
is set aside under the Schedule of
Works 2014-15.
2. Pavement of Muallungthu –
Khumtung Road (11.60-33.50
kmp): Sanctioned amount for the
work is Rs. 1,971.00 lakhs.
Administrative Approval for the
work was accorded from Govt. of
Mizoram on 29.3.2014. Selection of
the contractor is being made. Fund
Rs 200.00 lakhs is kept under D-III
and Rs. 523.00 lakh is set aside
under the Schedule of Works 2014-
15.
3. Projects under CRF:
Rs. 1268.00 lakh is allocated for
construction of the following roads during
2014-15 as follows.
i) Strengthening and Improvement of
Aizawl – Reiek - W. Lungdar Road
(Length = 37.00 Kms): Sanctioned
amount for the work is Rs. 1,156.00
lakhs. Fund amounting to Rs.
650.00 lakh is set aside under the
Schedule of Works 2014-15. NIT
for the work has been floated on
15.10.2014 and opened on 07-11-
2014 and the work was awarded to
C.T. Mawia, Kolasib Mizoram on
15-12-2014. The contractor is being
mobilized now.
ii) Strengthening & Improvement of
R.Tuipui – Biate Road (Length =
22.00 Kms): Sanctioned amount for
the work is Rs. 880.00 lakhs. Fund
amounting to Rs. 600.00 lakh is set
aside under the Schedule of Works
2014-15. NIT for the work has been
floated on 24.09.2014 and the work
was awarded to M/s. Sadguru
Engineers & Allied Services Pvt.
Ltd. Guwahati on 15-10-2014. The
contractor is being mobilized now.
(iii)Improvement of New Vervek –
Sakawrdai Road (Length =
7.00km): Sanctioned amount for the
work is Rs. 256.00 lakhs. Present
progress of the work is 100%
physically and Rs. 238.00 lakhs
financially. The balance fund, Rs.
18.00 lakh is set aside for clearing
liabilities under the Schedule of
Works 2014-15.

Economic Survey Mizoram 2014-15 ~ 80 ~ Infrastructure- Transport & Communications
Economic Survey Mizoram 2014-15
4. Projects under PMGSY :
During 2014-15, Rs. 5600.00 lakh
is allocated for Construction of roads under
PMGSY scheme for various works in the
State.
5. Under National Highways:
Mizoram PWD is presently looking
after and maintaining the National
Highways having a total length of 986.00
km within the state. The fund required for
the Highways is funded by the Ministry of
Roads, Transports & Highways (MoRTH),
Government of India.
I. The following works are in
progress during 2014-15 as
belows:-
(Details work list attached in
annexure – I)
a) Work in progress under SARDP - 8
Amount - Rs. 147956.00 lakh
b) Bridge work in progress - 1
Amount - Rs. 795.89 lakh
c) Work in progress under NH(O) - 22
Amount - Rs. 15776.16 lakh
d) Works under Tender process - 3
Amount - Rs. 2561.13 lakh
II. During 2014-2015, Estimate
proposal for 39 new works
amounting to Rs. 313.45 Crores are
being submitted to the Ministry for
getting sanction from the Ministry.
As soon as Sanction is obtained
from the ministry, these works will
be taken up immediately.
6. Under JNNURM:
There are three projects taken up
under Jawaharlal Nehru National Urban
Renewal Mission (JNNURM) scheme by
state PWD in Mizoram. The total
sanctioned amount for the Project are Rs
11090.36 lakhs and the fund released from
Central is Rs.3382.26 and Rs.554.54 lakhs
as State matching share till date. The
projects taken up under JNNURM are as
below:
1. Improvement and widening
of Aizawl City Road Phase -I
(45.76 Kms):
The project was sanctioned in
2012 amounting to Rs 3873.40
lakhs. The total fund released from
central is Rs 1394.00 lakhs and Rs
193.68 lakhs as State matching
share. The physical progress upto
date is 84%.
2. Widening & Improvement of
Vaivakawn to Mizoram University
Road (10.50 km):
The project was sanctioned in
2012 amounting to Rs 1907.64
lakhs. The total fund released from
central is Rs 793.66 lakhs and Rs
95.38 lakhs as State matching share.
Package-I is physically completed
and package-II 35% completed.
3. Sihhmui to Mizoram University
as Spur of Aizawl City Ring Road
(14.17 Km):
The project was sanctioned in
2012 amounting to Rs 5309.32
lakhs. The total fund released from
central is Rs 1194.60 lakhs and Rs
265.48 lakhs as State matching
share. The work is in progress.
7. Under World Bank Phase-II:
The Mizoram State Roads II
Regional Transport Connectivity Project
aims to provide better intra-State and
Regional connectivity for the residents of
landlocked Mizoram with Myanmar,
Bangladesh and N.E India. Rs. 9670.00
lakh is allocated during 2014-15 for the
following works.
i) Champhai – Zokhawthar
(27.25Km.) connecting Myanmar -
USD 26.30million.
Contractor, M/S Tarmat Ltd.
Mumbai was awarded the work
through National Competitive
Bidding. The Contract Agreement
was signed and the work is expected
to be started by January, 2015.

Economic Survey Mizoram 2014-15 ~ 81 ~ Infrastructure- Transport & Communications
Economic Survey Mizoram 2014-15
ii) Chhumkhum – Chawngte
(41.53Km.) connecting MMTP -
USD 38.50million.
Contractor, M/S JKM Infra
Project Ltd. Noida was awarded the
work through National Competitive
Bidding. The Contract Agreement
was signed and the work is expected
to be started by January, 2015.
iii) Tlabung – Kawrpuichhuah (12Km.)
connecting Bangladesh - USD
25.00 million.
Bidding for the work including
Bridge is yet to be done.
Consultant, M/s Sheladia
Associates Inc., USA has been
selected for Construction
Supervision Consultant to assist
PWD in day to day supervision of
the three road works.
8. A.D.B. Funded Project:
Asian Development Bank
(ADB) is assisting Govt. of India
through a programme of work
called the North Eastern State
Roads Investment Programme
(NESRIP) which is a part of
MDoNER initiative to bring the
northeastern region into the
mainstream of development.
The road, Serchhip –
Thenzawl – Buarpui (55.00 km) is
selected for ADB Project. The
project cost is estimated at
Rs.259.20 crores, which will be
financed through MDoNER. Out of
the project cost, GOI share is
Rs.161.43 crores whereas State
share is Rs.97.76 crores.
M/s Tantia Constructions
Ltd., Kolkata is selected to execute
the civil works. Contract amount is
Rs.2,04,51,45,316.40. The
contractor has started the work.
MSV International Inc.
USA, D-7, South City-1, Gurgaon–
1, Haryana is selected as
Construction Supervision
Consultant. They have started their
services.
Rs. 1800.00 lakh is allocated
for Upgradation of Serchhip –
Buarpui Road (55.00 km) under
ADB during 2014-15.
9. Works under NEC:
The North Eastern Council
is one of the main funding sources
of major road works in Mizoram. At
present, there are 10 (ten) nos. of
road projects and 4 (four) nos. of
other projects have been undertaken
by this Department under NEC
scheme, status of the projects are as
below:
1. Improvement &
Upgradation of KDZKT Road
(Khadacherra – Damcherra –
Zamuang – Kawrtethawveng –
Tuilutkawn Road 88.50km)
This road was sanctioned at
an estimated cost of Rs.13470.00
lakhs on January 2013. A sum of
Rs.1300.00 lakhs was released as
the 1st instalment. Tender was
floated in the beginning of FY
2013–14 but since the lowest
quoted rate by the agency is 33.35%
above the approved cost. Revised
DPR amounting to Rs.17963.00
lakhs which is prepared based on
the lowest tender rate is submitted
for approval of NEC on
Dt.11.12.2013 and the Revised
Estimate was approved by the EFC
meeting held on Dt.18.2.2014 and
approval of Ministry of Finance was
also obtained for which sanctioning
order is awaited.
2. Upgradation of Thanlon –
Singhat Road (Ngopa – Tuivai)
43.40 km
The approved sanctioned
amount for this work is Rs. 6767.00
lakhs. The progress of work is 80%.
Economic Survey Mizoram 2014-15 ~ 82 ~ Infrastructure- Transport & Communications
Economic Survey Mizoram 2014-15
3. Upgradation of Serkhan –
Baghabazar Road (115.20 km)
The approved sanctioned
amount for this work is
Rs.14863.00 lakhs. The progress of
work is 60%.
4. Upgradation of Bairabi –
Zamuang Road (30.00 km)
This work was sanctioned at
a revised estimated cost of
Rs.3768.00 lakhs on Dt. 16.9.2011.
All works except bridge over
R.Tlawng is completed. Slow
progress in bridge work is due to tilt
and displacement in pier – 2 and re-
design is in process. The
Department is closely monitoring
the progress of the work and at
present 59% of the work is
completed. Final installment of
Rs.98.98 lakhs is being awaited.
5. Construction of Saitual –
Saichal – NE Bualpui Road (34.33
km)
Formation Cutting is
completed. Pavement work is in
progress. Revised Estimate
amounting to Rs. 6308.00 lakhs as
approved by NEC review meeting
on Dt.5.5.2014 was submitted on
Dt. 27.6.2014. Rs. 300.00 lakhs has
already released by NEC as 8th
installment recently and the same is
being awaited from State
Government.
6. Upgradation of Keitum –
Artahkawn Road (34 km).
This work was physically
completed on April, 2013 and
Completion Certificate was also
furnished to NEC. The Ministry has
already released the final
installment. Last and final SMS is
awaited from State Government.
7. Upgradation of Silchar –
Dwarbon – Phaisen – Buhchang
Road (9.30 km).
This work was physically
completed on January, 2009. The 4th
and final installment was received
from NEC. Last and final SMS is
awaited from State Government.
8. Upgradation of Mamit –
Bairabi Road (37 km)
This work was physically
and financially completed on
March, 2013. Completion
Certificate and UC against the 10th
and final instalment from the
Ministry is also submitted.
9. Upgradation of Saitual –
Phullen Road (60 km).
The approved sanctioned
amount for this work is Rs. 5795.00
lakhs. The work is physically
completed. Completion Certificate
is submitted to NEC on March,
2014 and as per inspection from the
Ministry, Restoration work of roas
surface from 0.00 – 60.00 kmp is
completed on Dt. 6.6.2014
according to which Compliance
Report is also submitted. 10th
Final
Installment for Rs. 122.00 lakhs has
already released by NEC and the
same including SMS of Rs.13.79
lakhs is being awaited from State
Government to wrap up this work.
10. Tlabung – Kawrpuichhuah
Road (16.42).
Revised Estimate of Rs.
1494.00 lakhs was submitted for
this work on Dt. 17.7.2014 while
the project was physically
completed on July, 2014. Approval
of the Revised Estimate and 6th
installment of fund are awaited
from NEC.
10. Works under NLCPR :
Mizoram is one of the State
in North East depended on Central
Funding for development works
like Non-Lapsable Central Pool of
Resources (NLCPR). The scheme is
centrally financed on the basis of
90% Grant and 10% Loan.

Economic Survey Mizoram 2014-15 ~ 83 ~ Infrastructure- Transport & Communications
Economic Survey Mizoram 2014-15
There are 35 projects
implementing through PWD under
NLCPR Scheme in Mizoram. The
projects are mostly on-going and
few projects are in a stage of
completion and some are yet to be
started. The total approved
sanctioned amount for the project is
Rs 24087.43 lakhs and the total
fund released from Ministry of
DoNER is Rs 10524.11 lakhs and
the state matching share already
released is Rs 677.68 lakhs. The
balance amount yet to be released as
state matching share calculated
from MDoNER already released is
Rs. 491.67 lakhs. The factual
position of the project
implementing under NLCPR in
Mizoram taken up by State PWD
may be summarised as below: -
Sl.
No. Description of Projects
Nos of
Projects
Sanctioned
amount
Fund
released by
MDoNER
Fund
released by
State
1 Construction of Bridges (4
Bridges) 2 865.63 532.13 50.61
2 Construction of Roads
(165.153 Kms) 9 8704.82 3619.25 208.51
3
Construction of Helipads
& Improvement of
Lengpui Airport
2 2739.46 968.42 60.44
4 Construction of Buildings 22 11777.52 5404.31 358.12
Total : 35 24087.43 10524.11 677.68
IV. Outcome of the Department‟s
activities so far and expected
outcome (Impact on economy)
Roads and Highways within the
state are being improved and upgraded.
The riding quality of District roads, Town
& Villages is also improved and
rehabilitation of roads also being done to
develop the connectivity network of the
State. It has been witnessed and
considerable achievement has been
observed in the State by providing better
road communication throughout the State.
State government has achieved many goals
in many field of development with the
implementation of project under this
department. Opening up of new enterprises
in rural areas after having connected with
roads enable them to sell their product in
Town and city also observed. It is also
expected that better linkage for Health and
Education facilities arrives soon.
Important government offices
buildings, Sport Stadium and Indoors are
handed over to the concerned department
and are now being utilized having
substantial influence to the public. The
future outcome in the government
establishment and in the field of sports is
definitely warranted with the provision of
these facilities.
With the success of Mizoram State
Road Project - World Bank Phase-I,
Improvement & Upgradation of Aizawl –
Thenzawl – Lunglei road (164 km) was
completed. This road provides an alternate
route reduced distance by 70 km and travel
time by 3 hrs from the existing Highway
i.e., NH54 - Aizawl to Lunglei. This
reduction in travel time and saving of fuel
etc. gain some extent for improvement of
living standard. Again, Aizawl bypass
(13.50 km) also providing free flow of
traffic across Aizawl and various district
reducing hardship of public who crosses
Aizawl city in the peak hours.
The ongoing Mizoram State Road-II
Regional Connectivity Project will
definitely bring some more development in

Economic Survey Mizoram 2014-15 ~ 84 ~ Infrastructure- Transport & Communications
Economic Survey Mizoram 2014-15
the state as well as incidental benefits of
improving the quality of existing
connectivity to Bangladesh and Myanmar.
This will surely promote equal access to
economic and social development
opportunities across the country and
enhance government‘s efforts for poverty
eradication and economic development.
Under Look East Policy, new roads
are being built in the southern part of the
state to connect neighbouring country -
Myanmar for world wide business
development in the region. This project will
surely hit and promote the sentiment of the
Region for the development by drawing the
two countries together in the business
activities and so. This will improve access
to goods, passenger transport service and
reduce transport cost along the route,
improve access to social and economic
development opportunities along the route
by providing high capacity infrastructure.
V. Policy constraints required to be
addressed.
Road Maintenance: Mizoram State
PWD has constructed 1419.82 km of road
under North Eastern Council (NEC)
funding and another 250 km under the
Non-Lapsable Central Pool of Resources
(NLCPR). The scope of Funding Agencies
is to fund the original Construction of the
Roads Project only. There is no provision
for funding of maintenance of these roads
by the Funding Agencies. This creates a
huge burden on the meager resources of a
poor state like Mizoram for the continuous
upkeep and maintenance of these roads.
Maintenance Funds has to be
provided for those roads constructed under
NEC and NLCPR by the same Funding
Agencies for Roads constructed under their
Funds so as to maintain continuous upkeep
and smooth flow of traffic. Steps has also
to be taken by concerned Ministry to ensure
provision of adequate funds to bridge the
gap.
…….

Economic Survey Mizoram 2014-15 ~ 85 ~ Infrastructure- Transport & Communications
Economic Survey Mizoram 2014-15
ROAD TRANSPORT
I. Sectoral Overview:
Road Transport is vital to the
economic development and social
integration of the country. Easy
accessibility, flexibility of operations, door-
to-door service and reliability have earned
road transport an increasingly higher share
of both passenger and freight traffic vis-a-
vis other transport modes.
The Road Transport Sector has
grown significantly during the decades.
Road Transport has deep linkages with the
rest of the economy and a strong multiplier
effect. Transport is essentially a derived
demand depending upon the size and
structure of the economy and demographic
profile of the population. Greater the share
of commodity producing sectors like
agriculture and manufacturing, higher is the
demand for transport. Slower growth in
population may reduce demand for
transport but a higher share of mobile
population/labour force in the total
population is likely to increase demand for
transport.
The growth of vehicular traffic on
roads has been far greater than the growth
of the highways; as a result the main
arteries face capacity saturation.
Passenger transport services are
provided both by the State Road Transport
Undertakings (MST) and private operators.
Following liberalization, the share of MST
has declined with the entry of private
operators to meet the incremental passenger
traffic demand.
Both freight and passenger
movement by road is expected to rapidly
expand in the coming years. In particular,
freight movement by road transport is
expected to show robust growth over the
medium term due to a number of factors,
viz. Substantial investment in improvement
in national highway network which will
facilitate speedy, reliable, door-to-door
services, rising volumes of exports and
imports. Despite good performance of the
road transport sector it is a beset with slow
technological development, low energy
efficiency, pollution and slow movement of
freight and passenger traffic. Sustaining an
annual overall growth in the targeted GSDP
would require growth in both passenger and
freight road transport of much higher order.
II. Department‟s contribution in the
economy (Role of the Sector):
Since Transport falls under service
sector, rendering services to the public on
transportation purposes viz. Transportation
of Passengers and goods to various
destinations, and enforcement of Motor
Vehicle Acts & Rules by way of collecting
fees and fines to Motor Vehicles and issue
of permits to vehicles depending on
necessity by the State of Mizoram and issue
of Driving license to those persons having
efficient driving skill, frame and
amendment of the Motor Vehicle Acts &
Rules in harmony with the overall growth
of the country.
Such is the situation, this
Department have a high contribution to the
State income in revenue earned from MST
passenger Buses as well as in collection of
tax, fees and fines from Motor Vehicles.
Therefore, Transport Department
contributed huge amount of revenue to the
State revenue annually. This shows that the
performance of Transport Department plays
a vital role in the economy of the State.
III. Activities of the Department in
the current fiscal year:
As we are aware, the activities of
Transport Department in the current fiscal
year may be classified into four activities:
i) Public Transport: MST Buses
rendered service to the public in
carrying of passengers and goods to
various destinations within and
outside the State upto Guwahati.
Huge amount of revenue earned
from its service give contribution to
the State income.
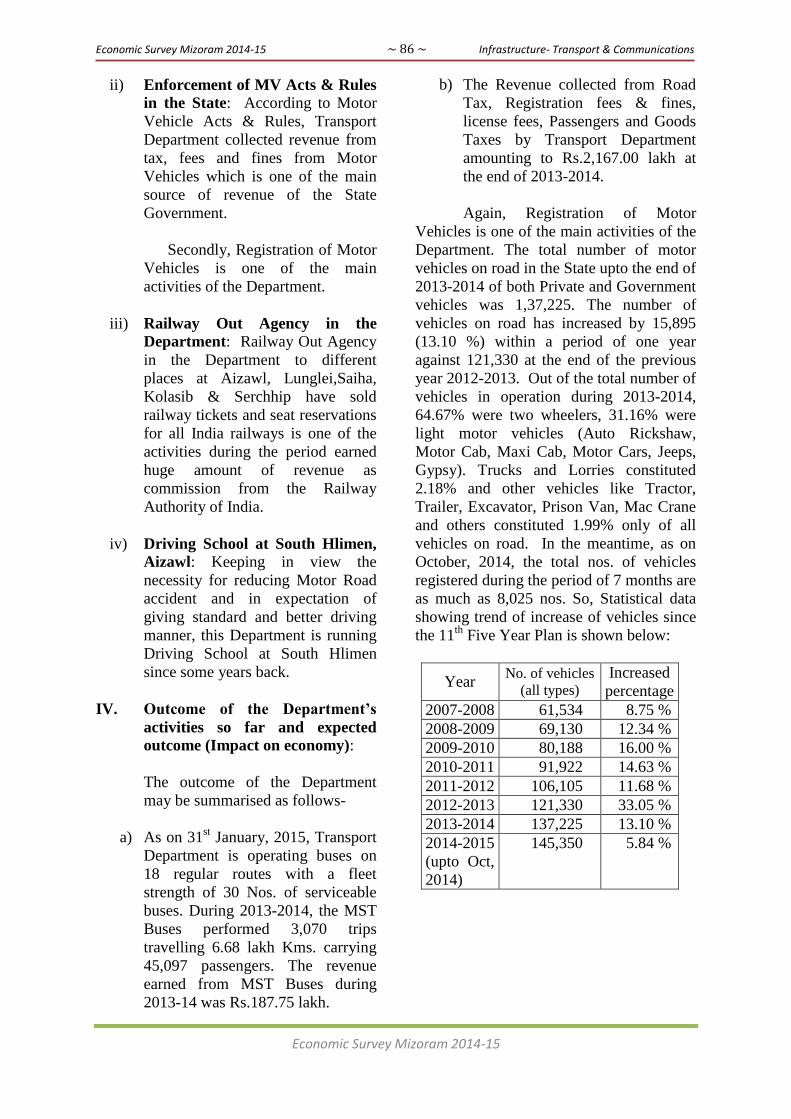
Economic Survey Mizoram 2014-15 ~ 86 ~ Infrastructure- Transport & Communications
Economic Survey Mizoram 2014-15
ii) Enforcement of MV Acts & Rules
in the State: According to Motor
Vehicle Acts & Rules, Transport
Department collected revenue from
tax, fees and fines from Motor
Vehicles which is one of the main
source of revenue of the State
Government.
Secondly, Registration of Motor
Vehicles is one of the main
activities of the Department.
iii) Railway Out Agency in the
Department: Railway Out Agency
in the Department to different
places at Aizawl, Lunglei,Saiha,
Kolasib & Serchhip have sold
railway tickets and seat reservations
for all India railways is one of the
activities during the period earned
huge amount of revenue as
commission from the Railway
Authority of India.
iv) Driving School at South Hlimen,
Aizawl: Keeping in view the
necessity for reducing Motor Road
accident and in expectation of
giving standard and better driving
manner, this Department is running
Driving School at South Hlimen
since some years back.
IV. Outcome of the Department‟s
activities so far and expected
outcome (Impact on economy):
The outcome of the Department
may be summarised as follows-
a) As on 31st January, 2015, Transport
Department is operating buses on
18 regular routes with a fleet
strength of 30 Nos. of serviceable
buses. During 2013-2014, the MST
Buses performed 3,070 trips
travelling 6.68 lakh Kms. carrying
45,097 passengers. The revenue
earned from MST Buses during
2013-14 was Rs.187.75 lakh.
b) The Revenue collected from Road
Tax, Registration fees & fines,
license fees, Passengers and Goods
Taxes by Transport Department
amounting to Rs.2,167.00 lakh at
the end of 2013-2014.
Again, Registration of Motor
Vehicles is one of the main activities of the
Department. The total number of motor
vehicles on road in the State upto the end of
2013-2014 of both Private and Government
vehicles was 1,37,225. The number of
vehicles on road has increased by 15,895
(13.10 %) within a period of one year
against 121,330 at the end of the previous
year 2012-2013. Out of the total number of
vehicles in operation during 2013-2014,
64.67% were two wheelers, 31.16% were
light motor vehicles (Auto Rickshaw,
Motor Cab, Maxi Cab, Motor Cars, Jeeps,
Gypsy). Trucks and Lorries constituted
2.18% and other vehicles like Tractor,
Trailer, Excavator, Prison Van, Mac Crane
and others constituted 1.99% only of all
vehicles on road. In the meantime, as on
October, 2014, the total nos. of vehicles
registered during the period of 7 months are
as much as 8,025 nos. So, Statistical data
showing trend of increase of vehicles since
the 11th
Five Year Plan is shown below:
Year No. of vehicles
(all types)
Increased
percentage
2007-2008 61,534 8.75 %
2008-2009 69,130 12.34 %
2009-2010 80,188 16.00 %
2010-2011 91,922 14.63 %
2011-2012 106,105 11.68 %
2012-2013 121,330 33.05 %
2013-2014 137,225 13.10 %
2014-2015
(upto Oct,
2014)
145,350 5.84 %
Economic Survey Mizoram 2014-15 ~ 87 ~ Infrastructure- Transport & Communications
Economic Survey Mizoram 2014-15
V. Policy constraints required to be
addressed:
Customers were quite justified in
exercising their options. Owing to
increasing personal incomes, long-distance
passengers aspired for luxury services in
rural operations. MST therefore, registered
continuous negative growth and losses. To
improve financial viability, MST was
compelled to withdraw operations that
involved unprofitable trips, services and
routes. Predictably, private operators have
also not introduced services on low-density
routes because these are not profitable.
Therefore, in a liberalized
environment, it becomes a greater
responsibility of the State to protect the
interest of consumers, especially those
passengers who are compelled to travel in
public transport, as they are too poor to
afford quality transport or high taxi fares.
In many post-liberalised economies, such
problems were effectively tackled through
a variety of measures like packaging of
routes, subsidies, and tax concessions,
among others, through the establishment of
a regulatory mechanism which is absent in
Mizoram. Hence, there is an urgent need to
address two issues in passenger road
transport in Mizoram:
First, reforms in MST to improve its
competitiveness in the liberalised
environment while fulfilling the
objectives for which they were set
up in the first place.
Second, establishment of effective
regulatory body to take care of
contractual compensation, fare
management and above all,
consumer interest.
This two-prolonged approach will
sustain a competitive environment, develop
scientific methods in evolving an effective
road transport system that is economically
viable and protects consumer interest. It
calls for political will to conceive,
introduce, support and sustain the process.
……
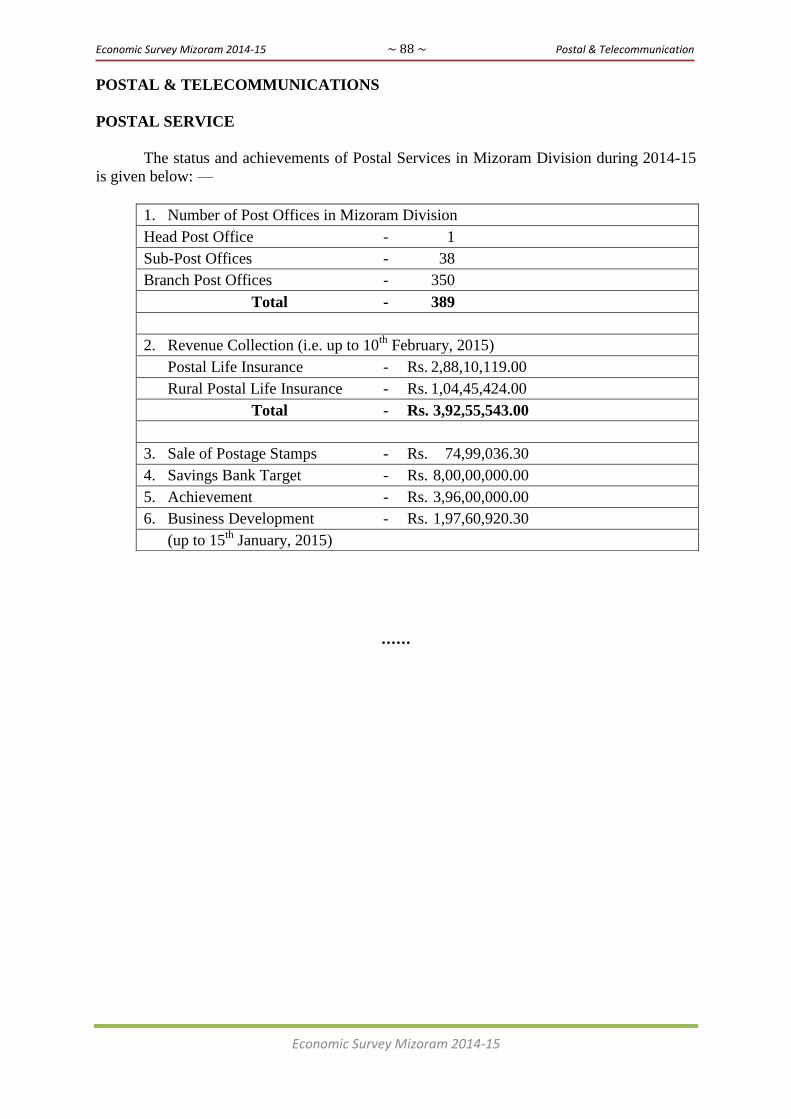
Economic Survey Mizoram 2014-15 ~ 88 ~ Postal & Telecommunication
Economic Survey Mizoram 2014-15
POSTAL & TELECOMMUNICATIONS
POSTAL SERVICE
The status and achievements of Postal Services in Mizoram Division during 2014-15
is given below: —
1. Number of Post Offices in Mizoram Division
Head Post Office - 1
Sub-Post Offices - 38
Branch Post Offices - 350
Total - 389
2. Revenue Collection (i.e. up to 10th
February, 2015)
Postal Life Insurance - Rs. 2,88,10,119.00
Rural Postal Life Insurance - Rs. 1,04,45,424.00
Total - Rs. 3,92,55,543.00
3. Sale of Postage Stamps - Rs. 74,99,036.30
4. Savings Bank Target - Rs. 8,00,00,000.00
5. Achievement - Rs. 3,96,00,000.00
6. Business Development - Rs. 1,97,60,920.30
(up to 15th
January, 2015)
......

Economic Survey Mizoram 2014-15 ~ 89 ~ Postal & Telecommunication
Economic Survey Mizoram 2014-15
TELECOMMUNICATION
Bharat Sanchar Nigam Limited is
the largest Telecommunication Services
provider within the state of Mizoram. As on
February, 2012, there are 6,79,169 mobile
phone connections in the State while there
was 5,47,567 connections during February
2011 which is an increase of 24.03%. Airtel
has the majority of subscribers with
4,19,275 connections followed by BSNL
with 1,83,124 connections.
…..
2012-13 2013-14 2014-15
Pre-Paid 212411 266588 269040
Post Paid 840 805 810
Mobile Tower 100 114 117
Pre-Paid 280000 310000 350000
Post Paid 7200 7800 8100
3G Connection
Internet Connection
Mobile Tower 175 186 202
Pre-Paid 17000 20000 22000
Post Paid 2000 1500 1000
Internet Connection 18000 21000 23000
Mobile Tower 75 75 75
Pre-Paid
Post paid
Internet Connection
Mobile Tower
Pre-Paid 5082 8665 14910
Post Paid 51 16 -
3G Connection
Landline
Internet connection
Mobile Tower 1 1 1
Pre-Paid 173698 125702 130000
Post Paid 21378 21558 21347
Internet Connections 8433 9966 10727
Landline 46716 20648 19043
Mobile towers 171 172 170
NO. OF MOBILE PHONE CONNECTIONS
Information not received
BSNL
IDEA
AIRCEL
AIRTEL
RELIANCE
VODAFONE
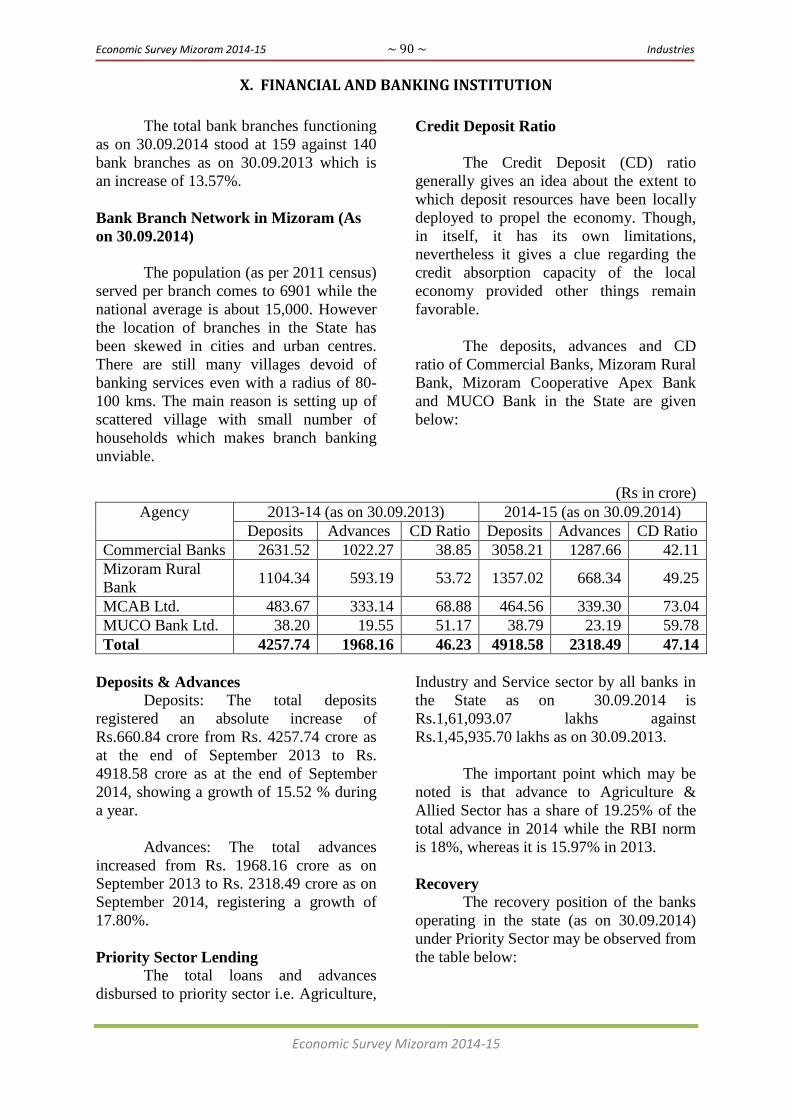
Economic Survey Mizoram 2014-15 ~ 90 ~ Industries
Economic Survey Mizoram 2014-15
X. FINANCIAL AND BANKING INSTITUTION
The total bank branches functioning
as on 30.09.2014 stood at 159 against 140
bank branches as on 30.09.2013 which is
an increase of 13.57%.
Bank Branch Network in Mizoram (As
on 30.09.2014)
The population (as per 2011 census)
served per branch comes to 6901 while the
national average is about 15,000. However
the location of branches in the State has
been skewed in cities and urban centres.
There are still many villages devoid of
banking services even with a radius of 80-
100 kms. The main reason is setting up of
scattered village with small number of
households which makes branch banking
unviable.
Credit Deposit Ratio
The Credit Deposit (CD) ratio
generally gives an idea about the extent to
which deposit resources have been locally
deployed to propel the economy. Though,
in itself, it has its own limitations,
nevertheless it gives a clue regarding the
credit absorption capacity of the local
economy provided other things remain
favorable.
The deposits, advances and CD
ratio of Commercial Banks, Mizoram Rural
Bank, Mizoram Cooperative Apex Bank
and MUCO Bank in the State are given
below:
(Rs in crore)
Agency 2013-14 (as on 30.09.2013) 2014-15 (as on 30.09.2014)
Deposits Advances CD Ratio Deposits Advances CD Ratio
Commercial Banks 2631.52 1022.27 38.85 3058.21 1287.66 42.11
Mizoram Rural
Bank 1104.34 593.19 53.72 1357.02 668.34 49.25
MCAB Ltd. 483.67 333.14 68.88 464.56 339.30 73.04
MUCO Bank Ltd. 38.20 19.55 51.17 38.79 23.19 59.78
Total 4257.74 1968.16 46.23 4918.58 2318.49 47.14
Deposits & Advances
Deposits: The total deposits
registered an absolute increase of
Rs.660.84 crore from Rs. 4257.74 crore as
at the end of September 2013 to Rs.
4918.58 crore as at the end of September
2014, showing a growth of 15.52 % during
a year.
Advances: The total advances
increased from Rs. 1968.16 crore as on
September 2013 to Rs. 2318.49 crore as on
September 2014, registering a growth of
17.80%.
Priority Sector Lending The total loans and advances
disbursed to priority sector i.e. Agriculture,
Industry and Service sector by all banks in
the State as on 30.09.2014 is
Rs.1,61,093.07 lakhs against
Rs.1,45,935.70 lakhs as on 30.09.2013.
The important point which may be
noted is that advance to Agriculture &
Allied Sector has a share of 19.25% of the
total advance in 2014 while the RBI norm
is 18%, whereas it is 15.97% in 2013.
Recovery
The recovery position of the banks
operating in the state (as on 30.09.2014)
under Priority Sector may be observed from
the table below:

Economic Survey Mizoram 2014-15 ~ 91 ~ Industries
Economic Survey Mizoram 2014-15
(Rs in lakh)
Financial Inclusion
Out of 194 wards, survey has been
completed in 173 wards. However, HDFC
(14 wards), SIB (7 wards) could not
complete the survey. Urban Wards‘ Survey
Report reveals that 93 % of the households
are having basic bank accounts, Account
opening of the remaining 7% is required to
be completed.
Survey has also been conducted in
Sub Service Area (SSA). Out of 91 SSAs,
survey has been completed in 82 SSAs.
SBI (7 SSA), FED (1SSA), INDUS (1
SSA) could not complete the survey.
Survey of SSA reveals that 81% of the
households are having basic bank accounts.
Account opening of the remaining 19% is
required to be completed.
…..
2013-2014 (as on 31.12.2012)
Demand Recovery Recovery %
Commercial Banks 12585.50 2853.82 23
Mizoram Rural Banks 3213.02 2377.68 74
MCAB Ltd. 7026.87 4892.77 70
MUCO Bank Ltd. 215.79 27.51 13
TOTAL 23041.18 10151.78 44
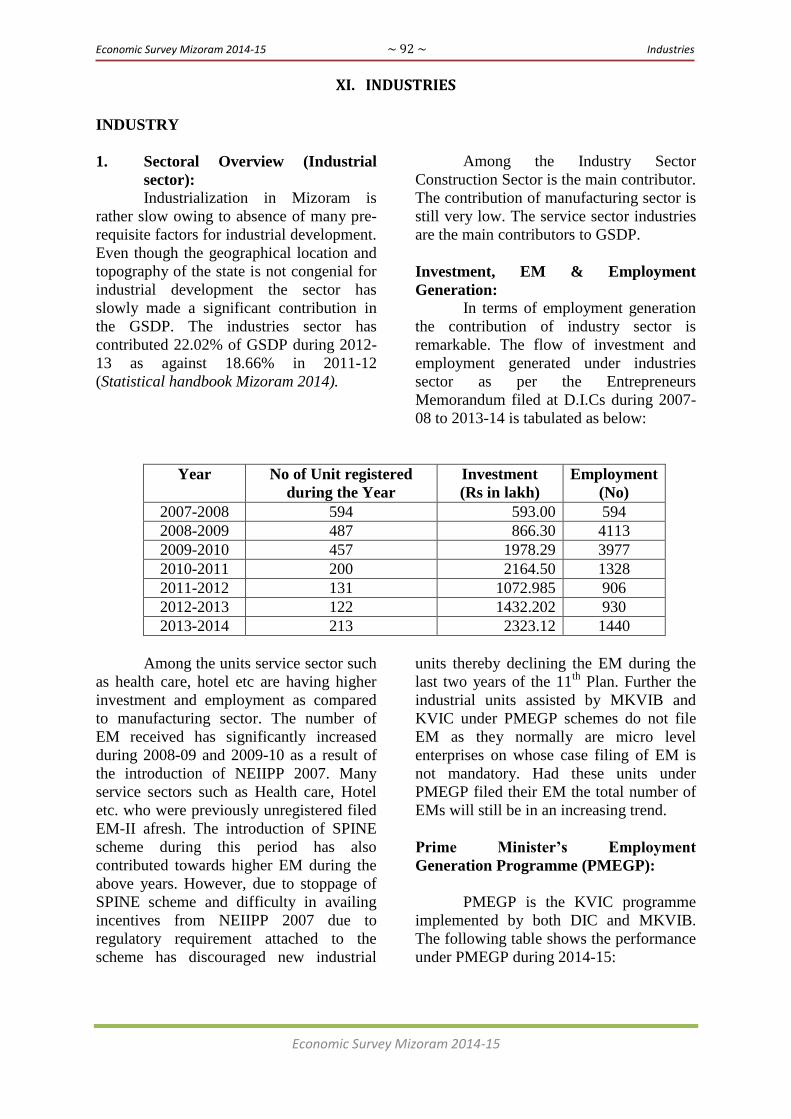
Economic Survey Mizoram 2014-15 ~ 92 ~ Industries
Economic Survey Mizoram 2014-15
XI. INDUSTRIES
INDUSTRY
1. Sectoral Overview (Industrial
sector):
Industrialization in Mizoram is
rather slow owing to absence of many pre-
requisite factors for industrial development.
Even though the geographical location and
topography of the state is not congenial for
industrial development the sector has
slowly made a significant contribution in
the GSDP. The industries sector has
contributed 22.02% of GSDP during 2012-
13 as against 18.66% in 2011-12
(Statistical handbook Mizoram 2014).
Among the Industry Sector
Construction Sector is the main contributor.
The contribution of manufacturing sector is
still very low. The service sector industries
are the main contributors to GSDP.
Investment, EM & Employment
Generation:
In terms of employment generation
the contribution of industry sector is
remarkable. The flow of investment and
employment generated under industries
sector as per the Entrepreneurs
Memorandum filed at D.I.Cs during 2007-
08 to 2013-14 is tabulated as below:
Year No of Unit registered
during the Year
Investment
(Rs in lakh)
Employment
(No)
2007-2008 594 593.00 594
2008-2009 487 866.30 4113
2009-2010 457 1978.29 3977
2010-2011 200 2164.50 1328
2011-2012 131 1072.985 906
2012-2013 122 1432.202 930
2013-2014 213 2323.12 1440
Among the units service sector such
as health care, hotel etc are having higher
investment and employment as compared
to manufacturing sector. The number of
EM received has significantly increased
during 2008-09 and 2009-10 as a result of
the introduction of NEIIPP 2007. Many
service sectors such as Health care, Hotel
etc. who were previously unregistered filed
EM-II afresh. The introduction of SPINE
scheme during this period has also
contributed towards higher EM during the
above years. However, due to stoppage of
SPINE scheme and difficulty in availing
incentives from NEIIPP 2007 due to
regulatory requirement attached to the
scheme has discouraged new industrial
units thereby declining the EM during the
last two years of the 11th
Plan. Further the
industrial units assisted by MKVIB and
KVIC under PMEGP schemes do not file
EM as they normally are micro level
enterprises on whose case filing of EM is
not mandatory. Had these units under
PMEGP filed their EM the total number of
EMs will still be in an increasing trend.
Prime Minister‟s Employment
Generation Programme (PMEGP):
PMEGP is the KVIC programme
implemented by both DIC and MKVIB.
The following table shows the performance
under PMEGP during 2014-15:
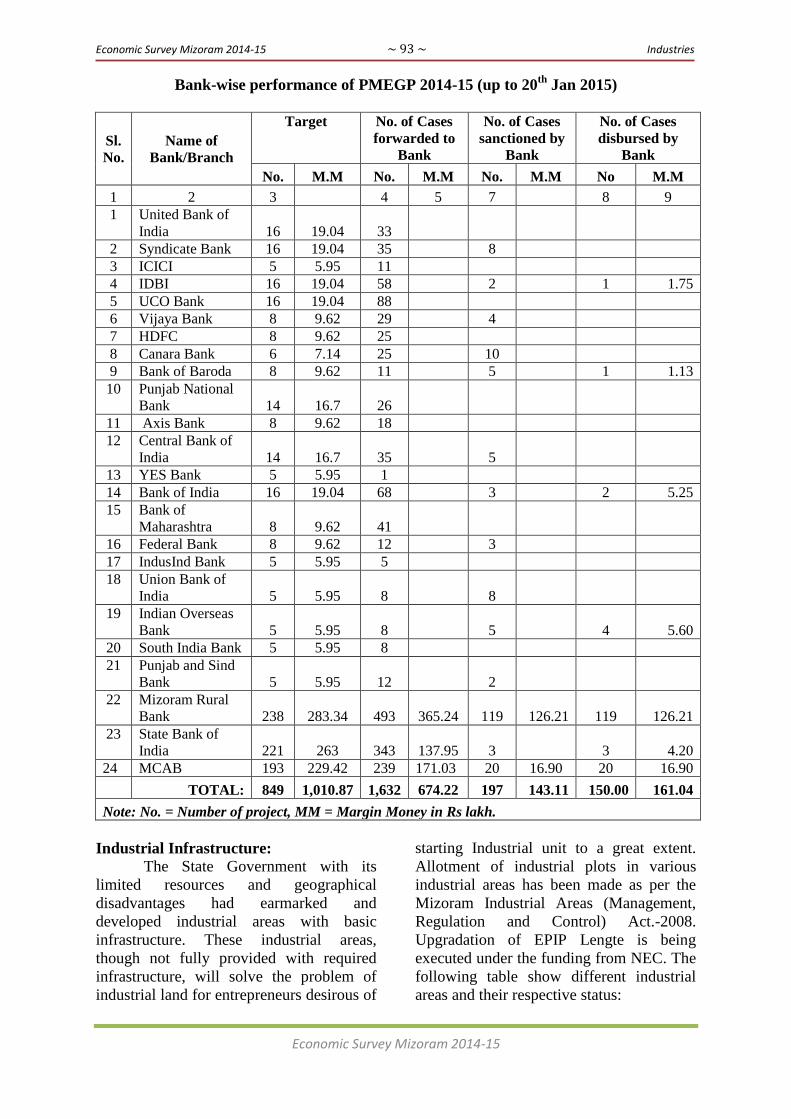
Economic Survey Mizoram 2014-15 ~ 93 ~ Industries
Economic Survey Mizoram 2014-15
Bank-wise performance of PMEGP 2014-15 (up to 20th
Jan 2015)
Sl.
No.
Name of
Bank/Branch
Target No. of Cases
forwarded to
Bank
No. of Cases
sanctioned by
Bank
No. of Cases
disbursed by
Bank
No. M.M No. M.M No. M.M No M.M
1 2 3 4 5 7 8 9
1 United Bank of
India 16 19.04 33
2 Syndicate Bank 16 19.04 35 8
3 ICICI 5 5.95 11
4 IDBI 16 19.04 58 2 1 1.75
5 UCO Bank 16 19.04 88
6 Vijaya Bank 8 9.62 29 4
7 HDFC 8 9.62 25
8 Canara Bank 6 7.14 25 10
9 Bank of Baroda 8 9.62 11 5 1 1.13
10 Punjab National
Bank 14 16.7 26
11 Axis Bank 8 9.62 18
12 Central Bank of
India 14 16.7 35 5
13 YES Bank 5 5.95 1
14 Bank of India 16 19.04 68 3 2 5.25
15 Bank of
Maharashtra 8 9.62 41
16 Federal Bank 8 9.62 12 3
17 IndusInd Bank 5 5.95 5
18 Union Bank of
India 5 5.95 8 8
19 Indian Overseas
Bank 5 5.95 8 5 4 5.60
20 South India Bank 5 5.95 8
21 Punjab and Sind
Bank 5 5.95 12 2
22 Mizoram Rural
Bank 238 283.34 493 365.24 119 126.21 119 126.21
23 State Bank of
India 221 263 343 137.95 3 3 4.20
24 MCAB 193 229.42 239 171.03 20 16.90 20 16.90
TOTAL: 849 1,010.87 1,632 674.22 197 143.11 150.00 161.04
Note: No. = Number of project, MM = Margin Money in Rs lakh.
Industrial Infrastructure:
The State Government with its
limited resources and geographical
disadvantages had earmarked and
developed industrial areas with basic
infrastructure. These industrial areas,
though not fully provided with required
infrastructure, will solve the problem of
industrial land for entrepreneurs desirous of
starting Industrial unit to a great extent.
Allotment of industrial plots in various
industrial areas has been made as per the
Mizoram Industrial Areas (Management,
Regulation and Control) Act.-2008.
Upgradation of EPIP Lengte is being
executed under the funding from NEC. The
following table show different industrial
areas and their respective status:
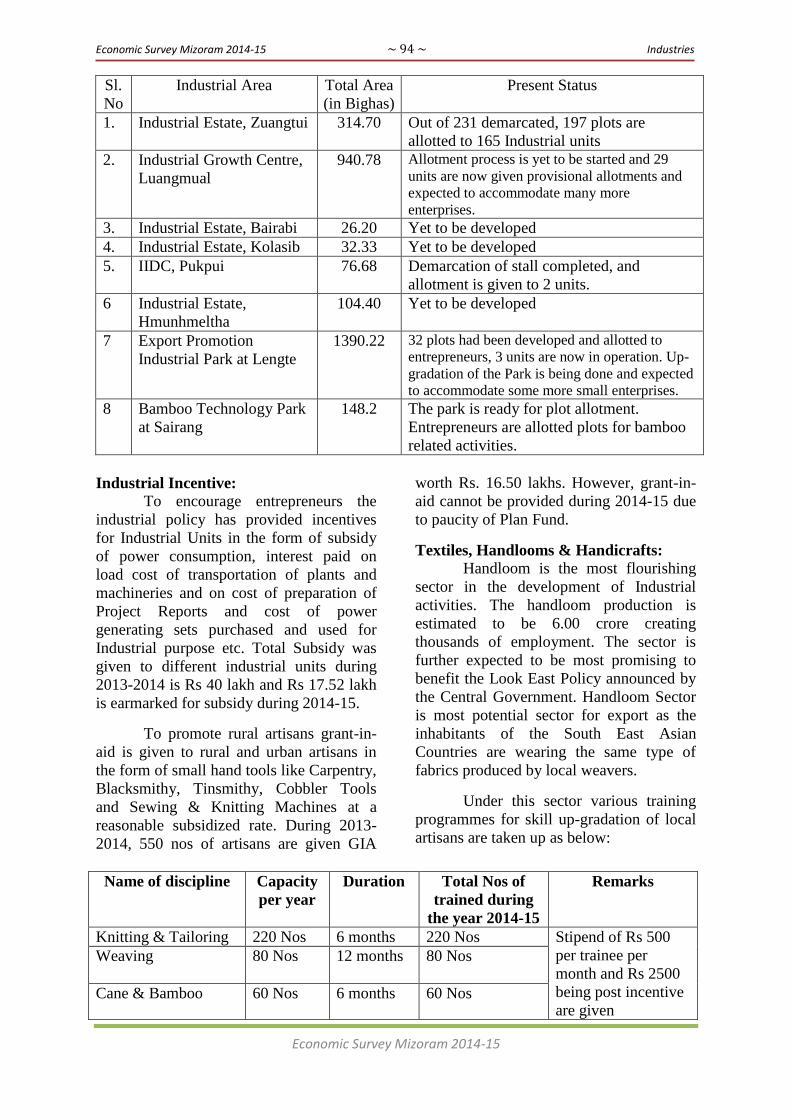
Economic Survey Mizoram 2014-15 ~ 94 ~ Industries
Economic Survey Mizoram 2014-15
Sl.
No
Industrial Area Total Area
(in Bighas)
Present Status
1. Industrial Estate, Zuangtui 314.70 Out of 231 demarcated, 197 plots are
allotted to 165 Industrial units
2. Industrial Growth Centre,
Luangmual
940.78 Allotment process is yet to be started and 29
units are now given provisional allotments and
expected to accommodate many more
enterprises.
3. Industrial Estate, Bairabi 26.20 Yet to be developed
4. Industrial Estate, Kolasib 32.33 Yet to be developed
5. IIDC, Pukpui 76.68 Demarcation of stall completed, and
allotment is given to 2 units.
6 Industrial Estate,
Hmunhmeltha
104.40 Yet to be developed
7 Export Promotion
Industrial Park at Lengte
1390.22 32 plots had been developed and allotted to
entrepreneurs, 3 units are now in operation. Up-
gradation of the Park is being done and expected
to accommodate some more small enterprises.
8 Bamboo Technology Park
at Sairang
148.2 The park is ready for plot allotment.
Entrepreneurs are allotted plots for bamboo
related activities.
Industrial Incentive:
To encourage entrepreneurs the
industrial policy has provided incentives
for Industrial Units in the form of subsidy
of power consumption, interest paid on
load cost of transportation of plants and
machineries and on cost of preparation of
Project Reports and cost of power
generating sets purchased and used for
Industrial purpose etc. Total Subsidy was
given to different industrial units during
2013-2014 is Rs 40 lakh and Rs 17.52 lakh
is earmarked for subsidy during 2014-15.
To promote rural artisans grant-in-
aid is given to rural and urban artisans in
the form of small hand tools like Carpentry,
Blacksmithy, Tinsmithy, Cobbler Tools
and Sewing & Knitting Machines at a
reasonable subsidized rate. During 2013-
2014, 550 nos of artisans are given GIA
worth Rs. 16.50 lakhs. However, grant-in-
aid cannot be provided during 2014-15 due
to paucity of Plan Fund.
Textiles, Handlooms & Handicrafts:
Handloom is the most flourishing
sector in the development of Industrial
activities. The handloom production is
estimated to be 6.00 crore creating
thousands of employment. The sector is
further expected to be most promising to
benefit the Look East Policy announced by
the Central Government. Handloom Sector
is most potential sector for export as the
inhabitants of the South East Asian
Countries are wearing the same type of
fabrics produced by local weavers.
Under this sector various training
programmes for skill up-gradation of local
artisans are taken up as below:
Name of discipline Capacity
per year
Duration Total Nos of
trained during
the year 2014-15
Remarks
Knitting & Tailoring 220 Nos 6 months 220 Nos Stipend of Rs 500
per trainee per
month and Rs 2500
being post incentive
are given
Weaving 80 Nos 12 months 80 Nos
Cane & Bamboo 60 Nos 6 months 60 Nos
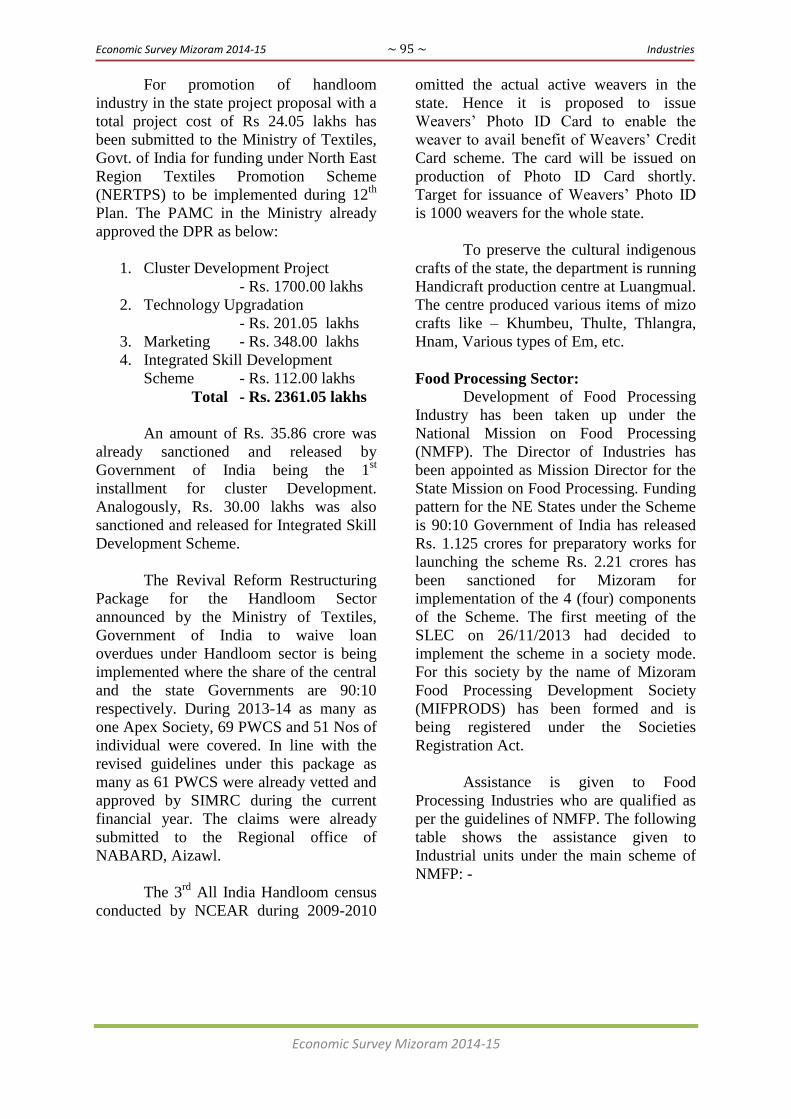
Economic Survey Mizoram 2014-15 ~ 95 ~ Industries
Economic Survey Mizoram 2014-15
For promotion of handloom
industry in the state project proposal with a
total project cost of Rs 24.05 lakhs has
been submitted to the Ministry of Textiles,
Govt. of India for funding under North East
Region Textiles Promotion Scheme
(NERTPS) to be implemented during 12th
Plan. The PAMC in the Ministry already
approved the DPR as below:
1. Cluster Development Project
- Rs. 1700.00 lakhs
2. Technology Upgradation
- Rs. 201.05 lakhs
3. Marketing - Rs. 348.00 lakhs
4. Integrated Skill Development
Scheme - Rs. 112.00 lakhs
Total - Rs. 2361.05 lakhs
An amount of Rs. 35.86 crore was
already sanctioned and released by
Government of India being the 1st
installment for cluster Development.
Analogously, Rs. 30.00 lakhs was also
sanctioned and released for Integrated Skill
Development Scheme.
The Revival Reform Restructuring
Package for the Handloom Sector
announced by the Ministry of Textiles,
Government of India to waive loan
overdues under Handloom sector is being
implemented where the share of the central
and the state Governments are 90:10
respectively. During 2013-14 as many as
one Apex Society, 69 PWCS and 51 Nos of
individual were covered. In line with the
revised guidelines under this package as
many as 61 PWCS were already vetted and
approved by SIMRC during the current
financial year. The claims were already
submitted to the Regional office of
NABARD, Aizawl.
The 3rd
All India Handloom census
conducted by NCEAR during 2009-2010
omitted the actual active weavers in the
state. Hence it is proposed to issue
Weavers‘ Photo ID Card to enable the
weaver to avail benefit of Weavers‘ Credit
Card scheme. The card will be issued on
production of Photo ID Card shortly.
Target for issuance of Weavers‘ Photo ID
is 1000 weavers for the whole state.
To preserve the cultural indigenous
crafts of the state, the department is running
Handicraft production centre at Luangmual.
The centre produced various items of mizo
crafts like – Khumbeu, Thulte, Thlangra,
Hnam, Various types of Em, etc.
Food Processing Sector: Development of Food Processing
Industry has been taken up under the
National Mission on Food Processing
(NMFP). The Director of Industries has
been appointed as Mission Director for the
State Mission on Food Processing. Funding
pattern for the NE States under the Scheme
is 90:10 Government of India has released
Rs. 1.125 crores for preparatory works for
launching the scheme Rs. 2.21 crores has
been sanctioned for Mizoram for
implementation of the 4 (four) components
of the Scheme. The first meeting of the
SLEC on 26/11/2013 had decided to
implement the scheme in a society mode.
For this society by the name of Mizoram
Food Processing Development Society
(MIFPRODS) has been formed and is
being registered under the Societies
Registration Act.
Assistance is given to Food
Processing Industries who are qualified as
per the guidelines of NMFP. The following
table shows the assistance given to
Industrial units under the main scheme of
NMFP: -

Economic Survey Mizoram 2014-15 ~ 96 ~ Industries
Economic Survey Mizoram 2014-15
Grant-in-Aid in provided under the main scheme of NMFP:
Year Name of firm with
Name of proprietor Name of scheme
Amount of
GIA sought
Amount of GIA
sanctioned
2012-
2013
1) 1) Koinonia Juice
Plant, Lengte Prop :
Lalchhanhima, Kanaan
Veng
Tech. upgradation /
Establishment /
Modernization of Food
Processing Industries
Rs.38,19,685.00 Rs.24,51,321.00
2) Mizoram Food
Processing
Industry
(Mifproy), Sihphir
Prop : Zorempuia
Tech. upgradation /
Establishment /
Modernization of Food
Processing Industries
Rs.15,34,180.00 Rs.10,75,726.00
3) Mizoram
Entrepreneurship
Network,
Chawnpui
Human Resources
Development (EDP)
Rs.8,00,000.00 Rs.8,00,000.00
4) Mizoram
Entrepreneurship
Network (MEN)
Promotional activities
- Survey
Rs.3,00,000.00 Rs.3,00,000.00
5) Mizoram
Entrepreneurship
Network (MEN)
Promotional activities
- Survey
Rs.3,00,000.00 Rs.3,00,000.00
2013-
2014
1) State Food
Processing
Mission
Promotional activities –
Exhibition / Fare (Food
Fest)
Rs.30,00,000.00 Rs.30,00,000.00
2) Jay Jay Foods
Ramhlun Venglai
Prop : Jervis
Lalramnghaka
Tech. upgradation /
Establishment /
Modernization of Food
Processing Industries
Rs.10,11,000.00 Rs.10,11,000.00
3) 3L Mizo Food
Salem Veng
Prop : Lalrodinga
Tech. upgradation /
Establishment /
Modernization of Food
Processing Industries
Rs.35,59,000.00 Rs.30,00,000.00
4) Damdiai Modern
Meat Shop
Chanmari West
Prop : J.H.
Thawmlianmawia
Modernisation of Meat
Shop
Rs.2,88,115.00 Rs.2,88,115.00
TOTAL Rs.122,26,162.00
New Land Use Policy:
Achievement during 2014-15:
During the year an amount of Rs 14.5795
crore was spent for completion of 2nd
phase
of NLUP covering 6509 families as on
28.1.2015. It is expected that the remaining
families of 2nd
phase with a total of 1186
families will also be completed during the
current year. Hence, it is targeted that 2nd
phase of NLUP will be completed during
2014-15. Further, an amount of Rs 10,000/-
each being 1st installment was also released
to 5656 families and 2842 families of 3rd
phase and 2nd
phase respectively during the
year. The fund utilized from fund spillover
from 2013-14.
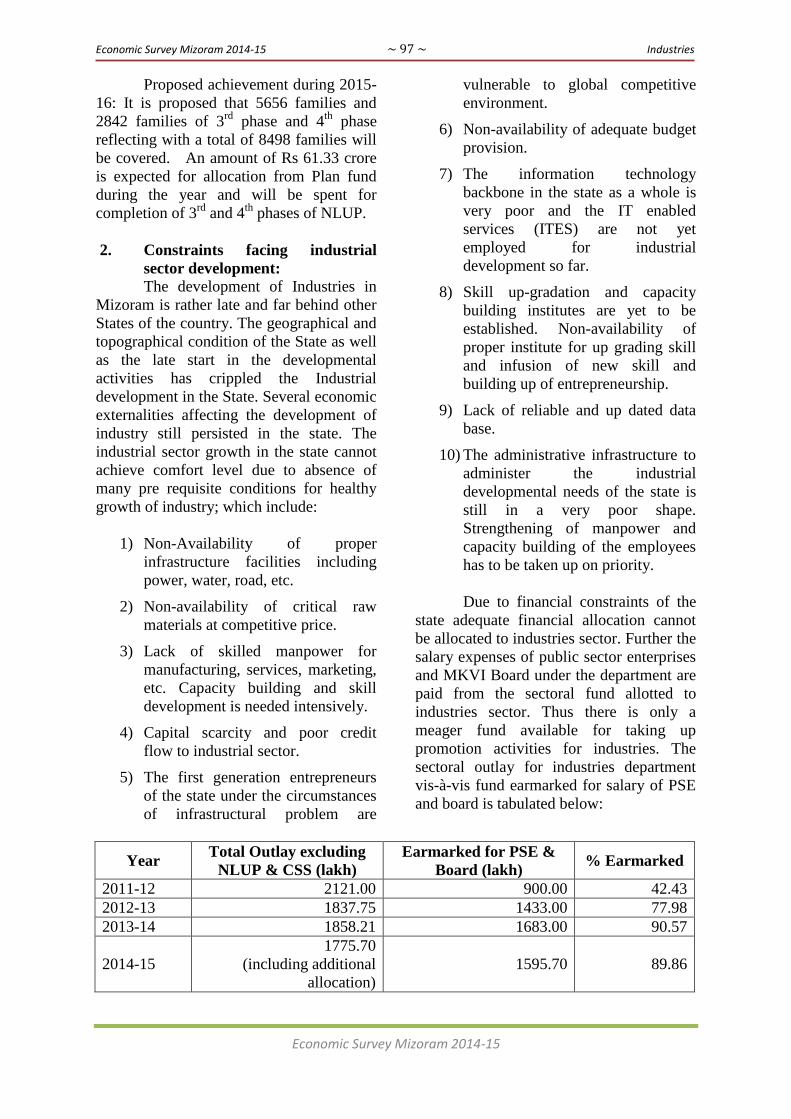
Economic Survey Mizoram 2014-15 ~ 97 ~ Industries
Economic Survey Mizoram 2014-15
Proposed achievement during 2015-
16: It is proposed that 5656 families and
2842 families of 3rd
phase and 4th
phase
reflecting with a total of 8498 families will
be covered. An amount of Rs 61.33 crore
is expected for allocation from Plan fund
during the year and will be spent for
completion of 3rd
and 4th
phases of NLUP.
2. Constraints facing industrial
sector development:
The development of Industries in
Mizoram is rather late and far behind other
States of the country. The geographical and
topographical condition of the State as well
as the late start in the developmental
activities has crippled the Industrial
development in the State. Several economic
externalities affecting the development of
industry still persisted in the state. The
industrial sector growth in the state cannot
achieve comfort level due to absence of
many pre requisite conditions for healthy
growth of industry; which include:
1) Non-Availability of proper
infrastructure facilities including
power, water, road, etc.
2) Non-availability of critical raw
materials at competitive price.
3) Lack of skilled manpower for
manufacturing, services, marketing,
etc. Capacity building and skill
development is needed intensively.
4) Capital scarcity and poor credit
flow to industrial sector.
5) The first generation entrepreneurs
of the state under the circumstances
of infrastructural problem are
vulnerable to global competitive
environment.
6) Non-availability of adequate budget
provision.
7) The information technology
backbone in the state as a whole is
very poor and the IT enabled
services (ITES) are not yet
employed for industrial
development so far.
8) Skill up-gradation and capacity
building institutes are yet to be
established. Non-availability of
proper institute for up grading skill
and infusion of new skill and
building up of entrepreneurship.
9) Lack of reliable and up dated data
base.
10) The administrative infrastructure to
administer the industrial
developmental needs of the state is
still in a very poor shape.
Strengthening of manpower and
capacity building of the employees
has to be taken up on priority.
Due to financial constraints of the
state adequate financial allocation cannot
be allocated to industries sector. Further the
salary expenses of public sector enterprises
and MKVI Board under the department are
paid from the sectoral fund allotted to
industries sector. Thus there is only a
meager fund available for taking up
promotion activities for industries. The
sectoral outlay for industries department
vis-à-vis fund earmarked for salary of PSE
and board is tabulated below:
Year Total Outlay excluding
NLUP & CSS (lakh)
Earmarked for PSE &
Board (lakh) % Earmarked
2011-12 2121.00 900.00 42.43
2012-13 1837.75 1433.00 77.98
2013-14 1858.21 1683.00 90.57
2014-15
1775.70
(including additional
allocation)
1595.70 89.86
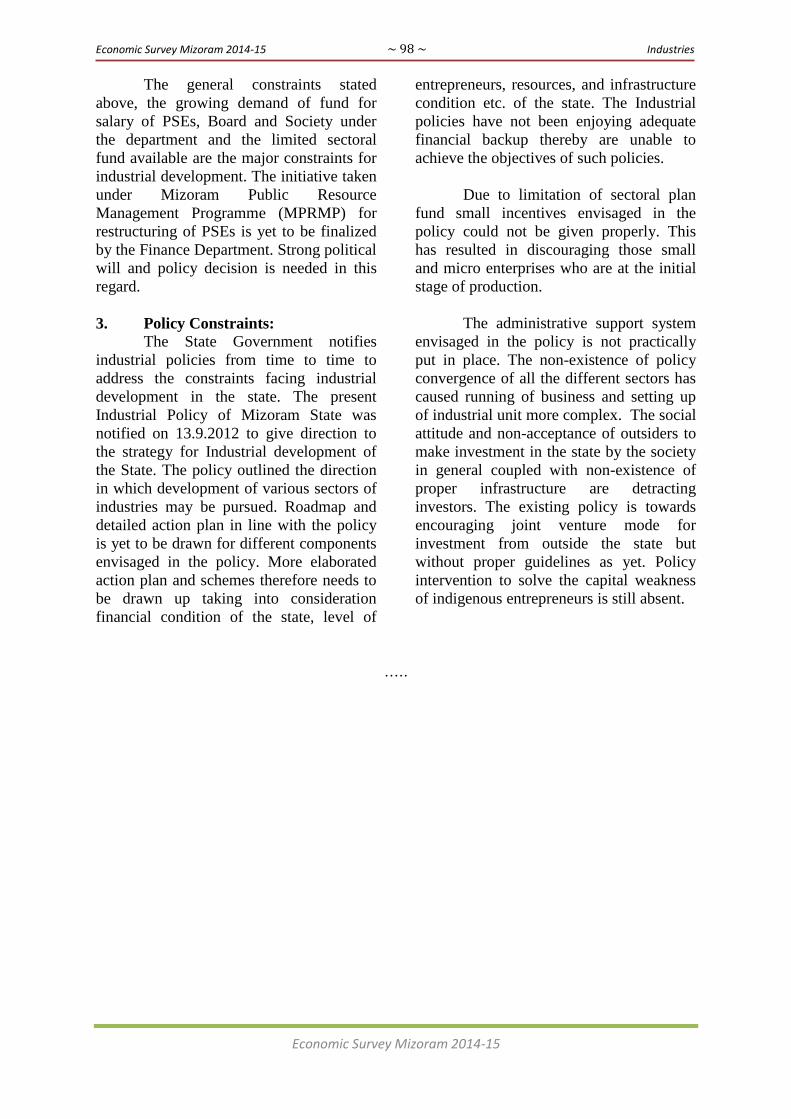
Economic Survey Mizoram 2014-15 ~ 98 ~ Industries
Economic Survey Mizoram 2014-15
The general constraints stated
above, the growing demand of fund for
salary of PSEs, Board and Society under
the department and the limited sectoral
fund available are the major constraints for
industrial development. The initiative taken
under Mizoram Public Resource
Management Programme (MPRMP) for
restructuring of PSEs is yet to be finalized
by the Finance Department. Strong political
will and policy decision is needed in this
regard.
3. Policy Constraints:
The State Government notifies
industrial policies from time to time to
address the constraints facing industrial
development in the state. The present
Industrial Policy of Mizoram State was
notified on 13.9.2012 to give direction to
the strategy for Industrial development of
the State. The policy outlined the direction
in which development of various sectors of
industries may be pursued. Roadmap and
detailed action plan in line with the policy
is yet to be drawn for different components
envisaged in the policy. More elaborated
action plan and schemes therefore needs to
be drawn up taking into consideration
financial condition of the state, level of
entrepreneurs, resources, and infrastructure
condition etc. of the state. The Industrial
policies have not been enjoying adequate
financial backup thereby are unable to
achieve the objectives of such policies.
Due to limitation of sectoral plan
fund small incentives envisaged in the
policy could not be given properly. This
has resulted in discouraging those small
and micro enterprises who are at the initial
stage of production.
The administrative support system
envisaged in the policy is not practically
put in place. The non-existence of policy
convergence of all the different sectors has
caused running of business and setting up
of industrial unit more complex. The social
attitude and non-acceptance of outsiders to
make investment in the state by the society
in general coupled with non-existence of
proper infrastructure are detracting
investors. The existing policy is towards
encouraging joint venture mode for
investment from outside the state but
without proper guidelines as yet. Policy
intervention to solve the capital weakness
of indigenous entrepreneurs is still absent.
…..

Economic Survey Mizoram 2014-15 ~ 99 ~ Sericulture
Economic Survey Mizoram 2014-15
SERICULTURE
I. Sectoral Overview
Mizoram State is one of the most
promising states for development of
Sericulture in North East India where all
four varieties of silk producing good plants
are grown and silkworms are reared for silk
production. Though Sericulture Department
has been included under Ministry of
Textiles, Government of India, however
considering its affinity in all the activities
and Farmers oriented, it has been included
as one of Agriculture & Allied activities by
Government of India. Hence all the projects
and schemes under Agriculture and allied
can be availed by the Department.
Following are variety wise
farms/Centres:
1. Mulberry Seed Farm - 10 nos
2. Muga Seed Farm - 3 nos.
3. Eri Seed Farm - 2 nos
4. Oak Tasar Seed Farm - 1 no.
5. Basic Mulberry Seed Farm
- 1 no.
6. Commercial Grainage Centre
- 2 nos
7. Reeling Factory - 1 no.
Present Status:
1. Practiced - 175
Villages
2. Area of Plantation - 4300 ha.
3. No. of Farmer covered- 7000 nos.
4. No. of Farmers under NLUP
- 2200 nos
The Strength of Technical Staff
1. Group A - 13 nos
2. Group B - 34 nos.
3. Group C - 184 nos
4. Group D - 52 nos
Total - 283 nos
Out of the total staff of 283, 184 are
of Technical and 99 are Ministerial.
II. Department‟s contribution in the
economy (Role of the Sector)
i) Upliftment of the rural economy in
the State.
ii) Generation of direct and indirect
gainful employment.
iii) In the context of Mizoram, it aims
at weaning away the devastating
Jhum Cultivation by establishing
Sericulture farming in the private
sector, which is permanent and
sustainable occupation for the rural
poor and useful tool to combat
global warming as it is environment
friendly.
iv) Production of cocoon and raw silk
for the benefit of the farmer in
particular and increase the State‘s
revenue in general.
v) Indiscriminate utilization of family
manpowers.
III. Activities of the Department in
the current fiscal year
The Department has, so far been
implementing 7 ongoing schemes viz.
Direction, Administration, Promotion,
Marketing, Training, Silk Processing and
Seed Organisation.
Scheme No. 1 : Direction
This scheme aims at improvement
and upkeep of Directorate Office
Establishment, Strengthening of Planning
Cell, Information Cell, Publicity through
different media, organisation of seminars,
participation of Industrial fairs. Planning,
monitoring of all plan implementation
programmes, overall control of financial
expenditures, etc.
Scheme No. 2 : Administration
Maintenance and up-keep of all
District level office establishments,
farms/centres including production of basic
silkworm seeds and other work
components.
Scheme No. 3 : Promotion
This scheme mainly concern with
extension and promotional activities
benefiting mostly the private farmers. It
provides technical assistance and gives

Economic Survey Mizoram 2014-15 ~ 100 ~ Sericulture
Economic Survey Mizoram 2014-15
subsidy/GIA to the registered farmers
/societies from time to time.
Various schemes like Catalytic
Development Projects (CSB) had been
incorporated under this scheme for
augmentation of Mulberry, Eri, Muga and
Oak Tasar development in the State.
Tentative provisions to match those
schemes have been made under this
scheme.
Scheme No. 4 : Marketing
Since a separate marketing cell has
not yet been created, the marketing activity
is directly controlled by the Directorate
through the District Officers. Generally
marketing activities should not come within
the purview of the Department without the
existing of Master Reelers and Weavers in
the private sector in the State. In the
absence of Reelers and Weavers in the
State the marketing activities are bound to
be looked after by the Department alone. In
this circumstance the Department is
compelled to continue to purchase cocoons
produced by the farmers and reel them in
the reeling factory for producing raw silk.
As such a major portion of the fund outlay
for this scheme has to be set aside for
purchase of cocoons.
Scheme No. 5 : Research & Training
Sericulture Industry is an Agro-
based which requires wide range of
scientific technologies with different
financial investments. Therefore, proper
studies on silkworm metamorphose,
pathology, Agronomy, Arboriculture and
ecology are indispensable to make
Sericulture Industry flourish and
economically viable. The success of
sericulture Industry largely depends on the
availability of required scientific
knowledge and its application in the field at
the right time and at the right place.
This can be achieved through
realisation of the importance of Research
and Training activities based on well-
organised scientific lines, equipped with the
most advanced scientific instruments to
evolve new concepts of scientific
methodology for application to field
activities with minimum financial
investment.
This Training Institute had been
upgraded as full-fledged Sericulture
Training Centre from the assistance of the
Central Silk Board.
Scheme No. 6 : Silk Processing
The main theme of Sericulture
Industry is to make earnings through Sales
of various Sericulture products to
individuals, societies in the State.
Unless the cocoons so produced are
processed to produce raw silk and silk
fabrics, Sericulture activities are said to be
incomplete. The cocoons produced are
subjected to various post Cocoon
technologies in order to produce quality
raw silk and silk goods for sale in the
market.
The cocoon processing comprises of
selection of quality cocoons, stifling,
cooking, degumming, reeling/spinning,
twisting, weaving and so on. Cocoon
processing required highly skilled hands in
order to produce quality raw silk and silk
fabrics to catch viable markets.
At this objective, the Sericulture
Department is having one Reeling Factory
at Zemabawk. Apart from producing raw
silk and silk fabrics these units have also
been producing silk quilts in abundance
which has marketing potential everywhere
in the country.
Scheme No. 7 : Seed Organisation
Common occurrence of crop failure
is exclusively attributed to bad quality of
silkworm seeds. Therefore production of
quality seed is a vital aspect for the success
of Sericulture Industry. Quality seed may
be defined as seed which is completely free
from diseases.

Economic Survey Mizoram 2014-15 ~ 101 ~ Sericulture
Economic Survey Mizoram 2014-15
The whole gamut of seed
production comprises of seed organisation
for systematic and methodical
multiplication of basic seed and Industrial
seed on scientific line and its proper and
efficient management of breeders stock and
its multiplication for the ultimate
production of Industrial hybrid seed. Seed
production involved in maintenance of
breeder‘s stock, basic seed and industrial
seed and maintaining the purity, its vigor
and vitality
Scheme No. 8 : New Scheme – NLUP
Sericulture has been selected as one
of the line Departments to implement the
NLUP from 2010 onwards. Although there
are four (4) viable varieties of silk cultures
like Mulberry, Eri, Muga and Oak Tasar in
the State, the Department is intending to
introduce only Mulberry Cultivation in 1
ha. of land for it is most economically
viable than all other Silk varieties. The
plantation raised can be utilized within 12
months and last for a minimum of 50 years.
Mulberry Silkworm can easily be reared for
5-7 times in a year where a person having a
plantation area of 1 ha. can earn more than
Rs 1.00 lakh in a year from sales of the
cocoons produced by him. From the
beginning till date the department covered
2206 families under NLUP.
IV. Outcome of the Department during 2014-15 (upto January 2015)
Items Production
Target
Achievement
Mulberry
Dfls production (Lakh nos.) 8.00 7.5818
Cocoon Production (MT) 400 350.74
Raw Silk Production (MT) 40 39.97
Eri
Dfls production (Lakh nos.) 1.125 0.95
Cocoon Production (MT) 12.5 9.30
Raw Silk Production (MT) 10 7.44
Muga
Dfls production (Lakh nos.) 1.875 0.11
Cocoon Production (Lakh nos.) 75.00 2.734
Raw Silk Production (Kgs.) 1.5 0.0471
Oak Tasar
Dfls production (Lakh nos.) 1.25 0.28
Cocoon Production (Lakh nos.) 50.00 1.04
Raw Silk Production (Kgs.) 1.00 0.024
…….

Economic Survey Mizoram 2014-15 ~ 102 ~ Tourism
Economic Survey Mizoram 2014-15
TOURISM
I. Sectoral Overview:
The Department of Tourism was
bifurcated from the Department of
Information and Public Relations in the
year 1987. Tourism Department‘s main
function has been the development of
tourism and its allied activities and building
basic infrastructures for tourists. From its
inception, it has been concentrating in
building tourist infrastructure for
accommodation as well as recreation
facilities. It has developed a number of
Tourist Lodges, Highway Restaurants and
Picnic spots all over the State through
financial assistance from the Ministry of
Tourism, Government of India. In addition
to this, the department has been running
various Tourist Lodges and Highway
restaurants in the State, meeting the
demands of the Government as well as the
general public and the tourists visiting the
State. The Department has now completed
43 Tourist Lodges and Highway
Restaurants, and these are being managed
by the Department. The Department also
organizes Anthurium Festival and
Thalfavang Kut every year which are both
celebrated with traditional festivities and
fanfare to attract more tourists to the State.
In order to create skilled manpower in
hospitality sector, the Department sponsors
students for training courses in hospitality
and related services to Institute of Hotel
Management Guwahati and Shillong every
year.
II. Department‟s Contribution in the
economy:
The revenue earned by the
Department credited to the Government
account during 2014-2015 (up to
December) was Rs. 17,373,327. The
number of tourist arrival (Domestic and
Foreign) as recorded by the Department
during 2014-2015 (up to December 2014)
was 51,901 persons. There are at present
eight (8) tour operators that are affiliated
with the Department .It may be pertinent to
point out here that hotel and restaurants are
not within the purview of the Department
as per the Allocation of Business Rules,
Government of Mizoram.
III. Activities of the Department in
the current fiscal year:
With financial assistance of the
Ministry of Tourism, Government of India,
the Tourism Department, Government of
Mizoram has been implementing the
following projects during the year 2014-
2015:
i) Development of Theme Park & Eco
Tourism Lungleng with sanction
amount Rs. 800.00 lakh
ii) Trekking Route – Aizawl, Reiek,
Ailawng with sanction amount
Rs.400.80 lakh
iii) Trekking Route Development of
Blue Mountain Sangau Route in
Mizoram with sanction amount
Rs.495.07 lakh
iv) Trekking Route Development of
Chalfilh (Tuirial, Tuirini,
confluence to Saitual) with sanction
amount Rs. 800.00 lakh
v) Wayside Amenities at Lungpher
with sanction amount Rs. 450.40
lakh
vi) Wayside Amenities at Kawlchaw
West with sanction amount
Rs.443.41 lakh
vii) Tourist Destination Chalfilh Phase
II with sanction amount Rs. 500.00
lakh
viii) Tourist Circuit Bilkhawthlir –
Kawnpui – Bukvannei – Phaisen,
Kolasib District with sanction
amount RS. 781.48 lakh (which
have been shifted to Khuangleng,
Vaphai & Khawlailung)
In addition, the Department also
organizes two (2) festivals namely
Anthurium Festival (24th
– 26th
September
2014) at Reiek Tourist Resort and
Thalfavang Kut (10th
– 12th
December
2014) at Tuirial Airfield to promote and
attract more visitors to the State.

Economic Survey Mizoram 2014-15 ~ 103 ~ Tourism
Economic Survey Mizoram 2014-15
IV. Outcome of the Department‟s
activities and expected outcome:
The Department has been successful
in providing basic accommodation facilities
to tourists visiting the State in all corners of
Mizoram. It has been understood that
Mizoram has all the basic ingredients for
promoting adventure tourism and nature
based tourism and stress has been given to
these sectors of tourism industry. Rural
tourism which aimed at transformation of
rural areas through tourism with
participation of the rural masses has also
come into focus. It is hoped that these new
ventures of the Department would result in
transformation of the State economy
thereby increasing the livelihood
opportunities of the people of Mizoram.
V. Policy Constraints:
It may be pointed out that the main
business of looking after hotel and
restaurants in Mizoram does not lie with
the Tourism Department, but with Aizawl
Minicipal Council (AMC). This has to be
rectified immediately, so that this sector of
tourism industry should be under the
purview of the Tourism Department.
….
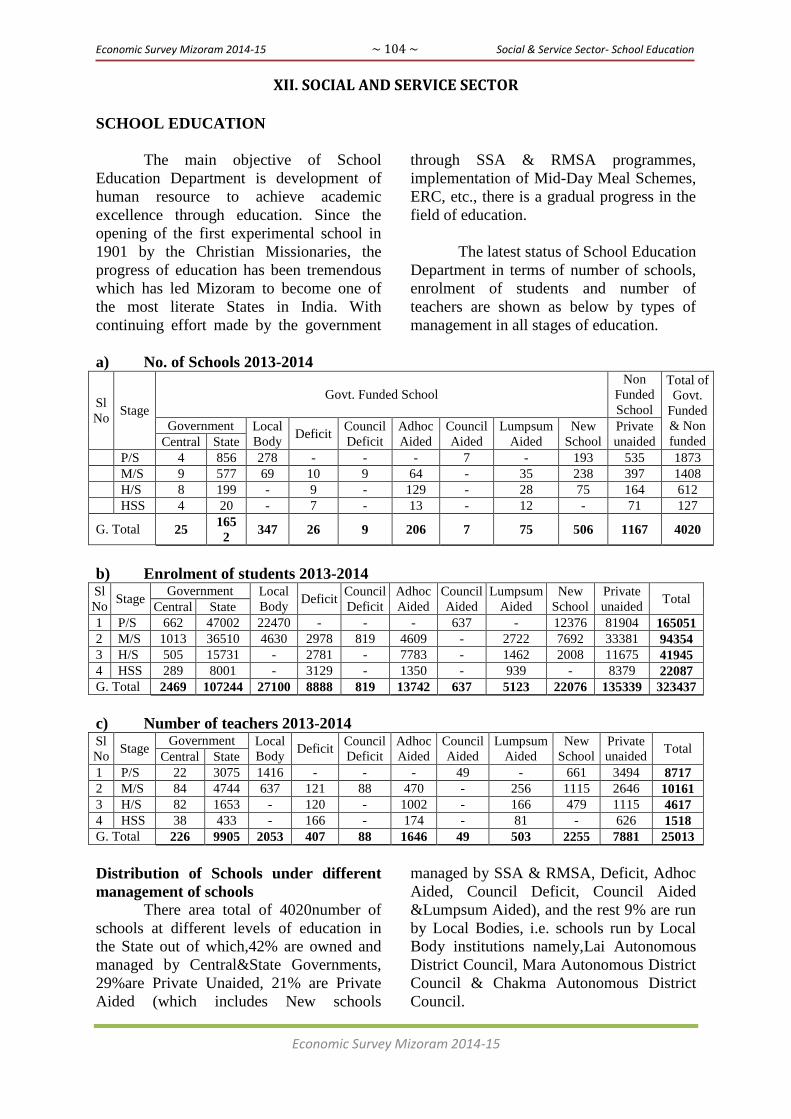
Economic Survey Mizoram 2014-15 ~ 104 ~ Social & Service Sector- School Education
Economic Survey Mizoram 2014-15
XII. SOCIAL AND SERVICE SECTOR
SCHOOL EDUCATION
The main objective of School
Education Department is development of
human resource to achieve academic
excellence through education. Since the
opening of the first experimental school in
1901 by the Christian Missionaries, the
progress of education has been tremendous
which has led Mizoram to become one of
the most literate States in India. With
continuing effort made by the government
through SSA & RMSA programmes,
implementation of Mid-Day Meal Schemes,
ERC, etc., there is a gradual progress in the
field of education.
The latest status of School Education
Department in terms of number of schools,
enrolment of students and number of
teachers are shown as below by types of
management in all stages of education.
a) No. of Schools 2013-2014
Sl
No Stage
Govt. Funded School
Non
Funded
School
Total of
Govt.
Funded
& Non
funded
Government Local
Body Deficit
Council
Deficit
Adhoc
Aided
Council
Aided
Lumpsum
Aided
New
School
Private
unaided Central State
1 P/S 4 856 278 - - - 7 - 193 535 1873
2 M/S 9 577 69 10 9 64 - 35 238 397 1408
3 H/S 8 199 - 9 - 129 - 28 75 164 612
4 HSS 4 20 - 7 - 13 - 12 - 71 127
G. Total 25 165
2 347 26 9 206 7 75 506 1167 4020
b) Enrolment of students 2013-2014 Sl
No Stage
Government Local
Body Deficit
Council
Deficit
Adhoc
Aided
Council
Aided
Lumpsum
Aided
New
School
Private
unaided Total
Central State
1 P/S 662 47002 22470 - - - 637 - 12376 81904 165051
2 M/S 1013 36510 4630 2978 819 4609 - 2722 7692 33381 94354
3 H/S 505 15731 - 2781 - 7783 - 1462 2008 11675 41945
4 HSS 289 8001 - 3129 - 1350 - 939 - 8379 22087
G. Total 2469 107244 27100 8888 819 13742 637 5123 22076 135339 323437
c) Number of teachers 2013-2014 Sl
No Stage
Government Local
Body Deficit
Council
Deficit
Adhoc
Aided
Council
Aided
Lumpsum
Aided
New
School
Private
unaided Total
Central State
1 P/S 22 3075 1416 - - - 49 - 661 3494 8717
2 M/S 84 4744 637 121 88 470 - 256 1115 2646 10161
3 H/S 82 1653 - 120 - 1002 - 166 479 1115 4617
4 HSS 38 433 - 166 - 174 - 81 - 626 1518
G. Total 226 9905 2053 407 88 1646 49 503 2255 7881 25013
Distribution of Schools under different
management of schools
There area total of 4020number of
schools at different levels of education in
the State out of which,42% are owned and
managed by Central&State Governments,
29%are Private Unaided, 21% are Private
Aided (which includes New schools
managed by SSA & RMSA, Deficit, Adhoc
Aided, Council Deficit, Council Aided
&Lumpsum Aided), and the rest 9% are run
by Local Bodies, i.e. schools run by Local
Body institutions namely,Lai Autonomous
District Council, Mara Autonomous District
Council & Chakma Autonomous District
Council.

Economic Survey Mizoram 2014-15 ~ 105 ~ Social & Service Sector- School Education
Economic Survey Mizoram 2014-15
Percentage Distribution of Schools under different Manangement (2013-14)
Sl.
No Stage Government Local Body
Private
Aided
Private
Unaided
1 Primary School 45.92% 14.84% 10.68% 28.56%
2 Middle School 41.62% 4.90% 25.28% 28.20%
3 High School 33.82% NIL 39.38% 26.80%
4 Higher Secondary
School 18.90% NIL 25.20% 55.91%
Overall Percentage 41.72% 8.63% 20.62% 29.03%
Teacher-Pupil Ratio (TPR)
Teacher-Pupil Ratio means the
average number of students per teacher at a
specific level of education during a given
school year. At present, the overall
distribution of TPR at different stages &
management of schools is 1:13. One
teacher is considered to teach
approximately 19students at Primary
Schools, 9 students at Middle Schools,
9students at High Schools and 15students
at Higher Secondary Schools. The
distribution of TPR of different
managements of schools is Central
Government – 1:11, State Government –
1:11, Local Body – 1:13, Deficit – 1:22,
Council Deficit – 1:9, Adhoc Aided 1:8;
Council Aided 1:13; Lumpsum Aided –
1:10, New Schools – 1:10, Private Unaided
– 1:17.AdhocAided Schools have the
lowest TPR, i.e. 1:8 while Deficit schools
has the highest TPR in the state, i.e. 1:22.
Status of Trained Teachers
Availability of trained teachers is
one of the most important indicators of
quality education. Out of the total teachers,
69.91% are trained in Government schools
(Central and State Government),55.28% are
trainedin Local body schools, 24.01% are
trained in Private Aided schools (Deficit,
Adhoc Aided, Lumpsum Aided, SSA,
RMSA, Council Aided and Council
Deficit), and 6.52% are trained in Private
unaided schools.
Gross Enrolment Ratio (GER)
GER means the total enrolment in a
specific level of education regardless of
age, expressed as a percentage of the
eligible official school-age population
corresponding to the same level of
education in a given school year. An
increase in GER indicates a decrease in the
number of drop-out students and out of
school children in the State.
Status of GER during 2010-11, 2011-12& 2012-13
Age Stage 2011-12 2012-13 2013-14
6 – 9 Primary School (I-IV) 112.86 110 108
10 – 13 Middle School (V-VIII) 82.22 82 82
14 – 15 High School (IX-X) 69.55 73 75
16 – 18 Higher Secondary School (XI-XII) 41.60 43 42
(GER is high in P/S because there are many under-aged and over-aged students enrolled in
P/S)
Drop-Out Rate Drop-out rate is one of the most
important indicators of quality education.
Drop-Out Rate is defined as the proportion
of children that cease to remain enrolled in
the school system. It is very difficult to
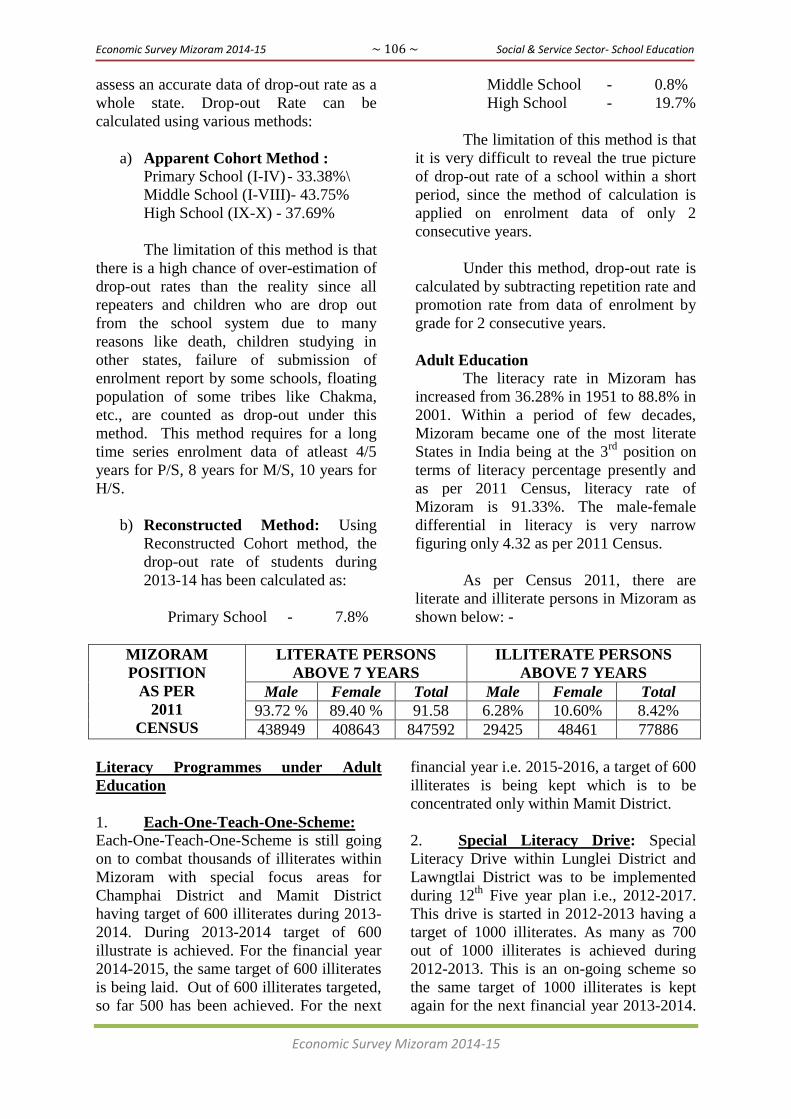
Economic Survey Mizoram 2014-15 ~ 106 ~ Social & Service Sector- School Education
Economic Survey Mizoram 2014-15
assess an accurate data of drop-out rate as a
whole state. Drop-out Rate can be
calculated using various methods:
a) Apparent Cohort Method : Primary School (I-IV) - 33.38%\
Middle School (I-VIII)- 43.75%
High School (IX-X) - 37.69%
The limitation of this method is that
there is a high chance of over-estimation of
drop-out rates than the reality since all
repeaters and children who are drop out
from the school system due to many
reasons like death, children studying in
other states, failure of submission of
enrolment report by some schools, floating
population of some tribes like Chakma,
etc., are counted as drop-out under this
method. This method requires for a long
time series enrolment data of atleast 4/5
years for P/S, 8 years for M/S, 10 years for
H/S.
b) Reconstructed Method: Using
Reconstructed Cohort method, the
drop-out rate of students during
2013-14 has been calculated as:
Primary School - 7.8%
Middle School - 0.8%
High School - 19.7%
The limitation of this method is that
it is very difficult to reveal the true picture
of drop-out rate of a school within a short
period, since the method of calculation is
applied on enrolment data of only 2
consecutive years.
Under this method, drop-out rate is
calculated by subtracting repetition rate and
promotion rate from data of enrolment by
grade for 2 consecutive years.
Adult Education
The literacy rate in Mizoram has
increased from 36.28% in 1951 to 88.8% in
2001. Within a period of few decades,
Mizoram became one of the most literate
States in India being at the 3rd
position on
terms of literacy percentage presently and
as per 2011 Census, literacy rate of
Mizoram is 91.33%. The male-female
differential in literacy is very narrow
figuring only 4.32 as per 2011 Census.
As per Census 2011, there are
literate and illiterate persons in Mizoram as
shown below: -
MIZORAM
POSITION
AS PER
2011
CENSUS
LITERATE PERSONS
ABOVE 7 YEARS
ILLITERATE PERSONS
ABOVE 7 YEARS
Male Female Total Male Female Total
93.72 % 89.40 % 91.58 6.28% 10.60% 8.42%
438949 408643 847592 29425 48461 77886
Literacy Programmes under Adult
Education
1. Each-One-Teach-One-Scheme: Each-One-Teach-One-Scheme is still going
on to combat thousands of illiterates within
Mizoram with special focus areas for
Champhai District and Mamit District
having target of 600 illiterates during 2013-
2014. During 2013-2014 target of 600
illustrate is achieved. For the financial year
2014-2015, the same target of 600 illiterates
is being laid. Out of 600 illiterates targeted,
so far 500 has been achieved. For the next
financial year i.e. 2015-2016, a target of 600
illiterates is being kept which is to be
concentrated only within Mamit District.
2. Special Literacy Drive: Special
Literacy Drive within Lunglei District and
Lawngtlai District was to be implemented
during 12th
Five year plan i.e., 2012-2017.
This drive is started in 2012-2013 having a
target of 1000 illiterates. As many as 700
out of 1000 illiterates is achieved during
2012-2013. This is an on-going scheme so
the same target of 1000 illiterates is kept
again for the next financial year 2013-2014.

Economic Survey Mizoram 2014-15 ~ 107 ~ Social & Service Sector- School Education
Economic Survey Mizoram 2014-15
Target could not be achieved but 750 has
been achieved out of 1000 targetted.
3. Social Service Camp and Literacy
Campaign: Social Service Camp and
Literacy Campaign have been organized
annually as awareness campaign among the
illiterates and for all other members of the
community interested in acquiring
knowledge about the importance of literacy
for the befitting and fruitful implementation
of various Literacy Programmes.
Sarva Shiksha Abhiyan (SSA)
550 PS Teachers and 1643 UPS
Teachers have been appointed till 2014-
15.
410 Art Education Instructors and 404
Health & Physical Education Instructors
appointed.
Free Textbook was distributed to134510
students.
7610 Children with Special Needs
(CWSN) were provided Aids and
Appliances.
11 Residential Hostels are successfully
running.
Out of 3335 School Children, 2197 were
mainstreamed in regular schools.
Kasturba Gandhi BalikaVidhyalaya
(KGBV)
One (1) Residential Hostel with capacity
of 100 girl child is running in Lungsen
Block, Lunglei district.
Rashtriya Madyamik Shiksha Abhiyan
(RMSA)
New School: The construction of 23
RMSA new High School which are
approved in 2009-10 were
completed and functional. The
construction of 58 RMSA new High
Schools approved in 2010-11 &
2011-12 are in progress. All these
Schools are also functional and were
constructed through contractors.
Open tender for the construction of 6
new H/S which are approved in
2013-14 was floated The e-
publishing system was followed
while floating Open Tenders.
Teacher‟s Quarters: Construction
of 126 Units of Quarters approved
during 2010-11 and 15 Units of
Quarters approved during 2011-12
are completed.
Strengthening: All the 199 Govt
Schools are already strengthened
under this intervention and 98 % of
Schools construction are completed.
In-Service Training of Teachers: In-Service Training of Teachers for
5 days is conducted every year for
all Govt. H/S, Govt. Aided H/S and
RMSA new Secondary School
teachers.
In-Service Training of
Headmasters: This training is also
conducted every year for 5 days for
all Govt. H/S, Govt. Aided H/S and
RMSA new Secondary School
Headmasters. Resource persons for
the training were acquired from
IASE, SCERT, DIET, Mizoram
University and faculty from
Directorate of School Education and
other expert within the state. This
training proved to be fruitful and
was heartily welcomed by the
trainees.
Remedial Teaching: Under this
activity 20% of the Class-IX
enrolment, who are academically
weaker were given special class in
difficult subjects like Mathematics,
Science and English every year.
Experienced and Good teachers were
engaged for this activity.
Study Tour/Local Trip for
Students: Under this activity the
districts and SMDCs selected Class
IX and X students from their own
jurisdiction as per physical number
approved by the PAB. The places
visited by the students vary from
districts to districts and SMDCs to
SMDCs.
Maths Lab kit: Fund for Maths lab
kit for all Govt. H/S and 23 New
RMSA H/S, 4 kits per school was
released to 8 districts and is a one-
time grant.

Economic Survey Mizoram 2014-15 ~ 108 ~ Social & Service Sector- School Education
Economic Survey Mizoram 2014-15
Science Lab kit: PAB has also
approved one time grant for Science
Lab Kit for all Govt. H/S, Govt.
Aided H/S and 81 New RMSA H/S
and released to SMDCs.
Community Training: The training
was conducted for 2 days for all
SMDC members of all Govt. H/S
and RMSA New Secondary Schools
every year.
Annual School Grant: Annual
School Grant, (Rs. 50000/-) for all
199 Govt. H/S and 81 RMSA New
Secondary was approved by the
PAB every year since the inception,
the grant was released to all SMDC
through District Project Offices.
Self Defense Training for Girls
Student: Self defense training for
girls student who were enrolled in
Government H/S including RMSA
H/S and Government Aided H/S was
approved in 2011-12 and 2013-14.
This activity is organized at school
level and the fund was also released
to all SMDC through DPOs.
Setting up of Guidance and
Counseling Centre at SCERT: The
Guidance and Counseling Centre
was established at SCERT in the
previous year. The centre provides
resource persons wherever required
within the state. Awareness
campaign was recently conducted
successfully in different parts of the
state during in-service training of
teachers and headmasters.
Mid-Day Meal Scheme
Mid-Day Meal Programme was
implemented in Mizoram since 15th
February, 2006 by providing cooked Mid-
Day Meal in the entire State to school going
children of Government Primary School,
A.l.E and E.G.S Centres. Prior to this year
the scheme was implemented by providing
raw rice to students.
The scheme has a good impact to the
students and also parents of students who
are indirectly the beneficiary of the scheme
in the sense that they can work freely
without having to worry about their
children's lunch. It is popularly known to
common people in the State and very much
welcome. Its impact may be stated as the
increase in enrolment, retention and increase
average attendance rate and reduce drop-out
students etc. The main objectives of the
scheme are – improving the nutritional
status of children, increasing and
encouraging, retaining and reducing drop-
out students.
Mid-Day Meal Programme was also
implemented in Educationally Backward
Block of Lungsen in Lunglei District from
15th
October, 2007 and was officially
launched on 7th
December, 2007 by Shri
Lalmalsawma, IAS, Finance & Planning
Commissioner, Government of Mizoram.
Shri Arvin Suri, Director (MDM), Ministry
of Human Resource Development,
Government of India, also grace the
occasion.
Since 1st August 2009 Mid-Day
Meal was implemented in Govt. Middle
Schools and SSA assisted schools all over
the state. The scheme covered Class VIII
from the academic session of 2011-2012.
During 2014-15, as many as 98825
Primary (Class- I–V) and 46550 Upper
Primary (Class VI-VIII) students availing
Mid-day Meal in every schooling day and
Cook-cum-helper engaged under Mid-Day
Meal Scheme in Mizoram stands at 3057 for
Primary and 2109 for Upper Primary.
Implementation of Mizoram Education
Reforms Commission Report
The School Education Department
strives to uplift and improve the quality of
education to achieve world class level in all
spheres. In order to achieve this objective,
and to improve the quality of education and
reform the education system in Mizoram,
the Government of Mizoram constituted the
Education Reforms Commission, Mizoram

Economic Survey Mizoram 2014-15 ~ 109 ~ Social & Service Sector- School Education
Economic Survey Mizoram 2014-15
(ERCM) in 2009 vide Notification letter No.
B. 12012/1/2009, dated 8th
May 2009 with
clear terms of reference. The commission
submitted its report to the Government on
30th
July, 2010.
The Commission‘s report was again
re-examined by a Group of Experts (GoE)
constituted by the Government with the
following Terms of Reference; (i) To
scrutinize and make recommendations to the
Government from the Report of the
Education Reforms Commission; (ii) To
determine the actions necessary to be taken
on priority from the recommendations of the
Education Reforms Commission; and (iii)
To prepare road map for implementation of
the report of the Education Reforms
Commission.
The Group of Experts, after due
deliberation and in-depth study, prioritized
the report of the Commission into the
following categories, namely, (i) Short term
(urgent) (ii) Short term (iii) Medium term
and (iv) Long term.
In pursuance of the report of the
Group of Experts, the Education
Department formed a Task Force under the
chairmanship of Secretary, School
Education to implement the
recommendations of the Commission. The
Task Force in turn identified items that can
be implemented immediately without
incurring huge expenditure. The Task Force
then formed five working groups to perform
different tasks. Consequently, the following
actions have been taken to improve the
quality of education:
(i) A good number of small and unviable
schools were identified and
amalgamated.
(ii) In order to clear backlog of untrained
teachers as many as 2035 teachers
serving in various schools (including
private schools) have been deputed for
training.
(iii)In order to conform to the Government
of India‘s norms and as recommended
by ERC, Class VIII which used to be
part of High School was shifted to
Middle School, for which additional
class rooms for Middle Schools were
constructed.
(iv) As recommended by ERC, multimode
programme for B.Ed. has been
accorded, and the first batch will
commence from March, 2015.
(v) In order to improve the quality of
education, subject-wise teacher
recruitment is being under active
consideration. Also, Internal Quality
Assurance Cell (IQAC) has been set up
in all colleges.
(vi) To improve the administration, panel of
inspection have been set up. Also,
detailed Inspection Format have been
designed and used.
(vii) For effective teaching of Hindi,
Roman script and Devnagari script have
been introduced in Hindi text books.
Also, all Governments and Aided High
Schools and Middle Schools have been
provided with Hindi Teachers.
(viii) In order to improve the literacy rate
in Mizoram, intensive literacy drive and
revival of State Level Mission
Authority (SLMA) have been carried
out.
(ix) Education Rules is being framed and is
under active consideration.
(x) A number of rules under School
Education Department have been
reviewed and amendment is being
sought.
(xi) The Department intends to introduce
Early Childhood Care and Education
(ECCE) to 66 Primary Schools from the
Academic Session of 2015-16 for
which Text Books are being printed.
(xii) Development of skills for wage and
self-employment through
vocationalization of education.
The Education Department of
Mizoram will continue to work on to
achieve the desired goal of establishing
World Class Level Education in Mizoram.
The Department will be taking incremental
steps forward in spite of several constraints
such as finance, expertise, etc.
…..

Economic Survey Mizoram 2014-15 ~ 110 ~ Social & Service Sector- Health & Medical
Economic Survey Mizoram 2014-15
HEALTH & FAMILY WELFARE
I. Sectoral Overview
Health & Family Welfare
Department aims at achieving overall
improvements in the health status of the
people by raising access to quality health
care for everyone, taking the major health
issues and raising awareness about
nutrition, environmental sanitation,
diseases prevention and control measures.
This required expansion of health
infrastructures, posting of skilled medical
and para-medical staffs and providing
medicines and supplies.
A vast network has been built up for
providing preventive, promotive and
curative health care and it has now reaches
the present status of 12 CHC, 57 PHC and
370 Sub Centres.
Health Centres with Bed Strength
Institutions Nos. Bed Strength
Community Health Centre (CHC) 12 270
Primary Health Centre (PHC) 57 560
Family Welfare Programme
Programme of Family Welfare
services aims at acceptance of small family
norms to stabilize population and improve
quality of life of the people through
sterilizations operations and IUD insertion
etc.
Though sterilization is the mainstay
of the Family Welfare programme, the
spacing of births has became equally
important, of which spacing by using Oral
Pill and contraceptives/condoms are given
more stress in the propagation of spacing
methods.
The physical achievements under
Family Welfare programme during 2014-15
(April-December) is as tabulated below: -
Sl.
No. ITEM
2014-15
(Apr.-Dec.)
1 Female Sterilization 1221
2 Male Sterilization 0
3 IUD Insertion 1796
4 Oral Pill users (in cycles) 2969
5 Condom users 1990
National Rural Health Mission (NRHM)
Recognizing the importance of
Health in the process of economic and
social development and improving the
quality of life of our citizens, the
Government of India has resolved to launch
the National Rural Health Mission to carry
out necessary architectural correction in the
basic health care delivery system. The Goal
of the Mission is to improve the availability
of an access to quality health care by
people, especially for those residing in rural
areas, the poor, women and children.
NRHM was launched in Mizoram
on June 2005 by setting up a State Health
Mission and a District Health Mission.
The Mission bring the schemes of
Reproductive and Child Health (RCH)-II as
well as National Disease Control
Programmes and various Family related
activities under its umbrella as detailed
below: -
i) 987 Accredited Social Health Activist
(ASHA) have been selected and
completed all Trainings except fourth
round of Module 6 & 7 which is going
to be finished by February, 2015. The

Economic Survey Mizoram 2014-15 ~ 111 ~ Social & Service Sector- Health & Medical
Economic Survey Mizoram 2014-15
ASHAs are provided Drug Kits and
HBNC Kits. The ASHA are expected
to bring about increase in complete
Ante-Natal Checkup, Institutional
Delivery and Post Natal Checkup.
This is to improve in Maternal and
Child Health. The important indicators
like IMR and MMR are also expected
to come down. ASHAs brought about
improvement in coordination between
the health sector and the community.
ii) Village Health & Sanitation
Committee (VHSC) have been formed
in 815 in revenue villages out of 830
villages. 15 other VHSNC have been
approved in the State PIP 2014-15 and
the State is in the process of forming
15 VHSNC. The total amount of
VHSNC fund approved by the Govt. of
India in 2014-15 is Rs. 83 lakhs (@
Rs.10000/- per VHSNC). SUB-
CENTRE untied fund and maintenance
grants amounting to Rs.74 lakhs (@
Rs. 20000/- per Sub-Centre).
iii) Rogi Kalyan Samiti fund for 8 Districts
Hospital amounting to Rs. 80 lakhs, for
3 SDHs amounting to Rs. 6 lakhs, for 9
CHCs amounting to Rs. 45 lakhs. 57
PHCs for Rs. 99.75 lakhs and Rs.
7400000 for 370 Sub-Centre. As the
fund received from the treasury is only
25% so the fund release is Rs.
11587500 only but the State is
planning to release as soon as the fund
is available.
Reproductive & Child Health (RCH)
The vision of RCH programme is to
bring about outcomes as envisages in the
National Population policy 2000 (NPP-
2000), the National population policy 2002,
minimizing the regional variations in the
areas of Reproductive and Child Health and
population stabilization through integrated,
focused, participatory programme, meeting
the unmet demands of the target population
and provision of assured, equitable,
responsive quality services. RCH
programme focuses on reduction of
Maternal Mortality Ratio, Infant Mortality
Rate and Total Fertility Rate. It also aims to
increase the couple protection rate and
coverage of child immunization. The goals
are –
1. To reduce Maternal Mortality Ratio
from 60 (State Report) to 55
2. To reduce Infant Mortality Rate
from 34 (NFHS-3) to 25
3. To reduce Total Fertility Rate from
2.9 (NFHS-3) to 2.5
Physical Achievements:
1) JSY beneficiaries –
Year Institutional Deliveries Home Deliveries Total
2014-15
(upto Dec 2014) 3064 0 3064
2) Family Planning Method Users
Sl. No. FP Method 2014-15
(upto Dec 2014)
1 Female Sterilized 1221
2 Male Sterilized 0
3 IUD Insertion 1796
4 Oral Pill users 38600
5 Condom users 143908

Economic Survey Mizoram 2014-15 ~ 112 ~ Social & Service Sector- Health & Medical
Economic Survey Mizoram 2014-15
3) Health Indicators
Indicators 2014-15
(upto Dec 2014)
Ante Natal Care (ANC) within 1st Trimester (%) 72
Ante Natal Care (ANC) with 3 Check-up 72
Post Natal Care within 48 hrs (%) 76
Total live Births 16742
Institutional Deliveries (%) 87
Home deliveries attended by Doctor/HW/SN (%) 9
Maternal Mortality Ratio (MMR) 131
National Vector Borne Diseases Control
Programme (Malaria)
The main aims of National vector
Borne Disease Control Programme are -
1) Early diagnostic and prompt
treatment
2) Risk Reduction of Malaria
Transmission
3) Enhance awareness about Malaria
control by promoting NGOs
participation
4) The main goal is to reduce Malaria
morbidity by 30% and mortality by
50%
Early Diagnosis and Complete
Treatment through ASHAs and Community
Health Volunteers (CHVs) from the
Christian Medical Association of India have
corporately contributed in bringing down
Malaria deaths (January to September) from
30 in 2011 to 20 in 2012. The Annual
Parasite Incidence, the object of which is to
lower Malaria cases to less than 1 per 1000
population by 2017 is also slowly gaining
momentum. It has been shot down to 6.55 in
2012 from 8.58 in 2011. With the
significant presence of ASHAs and CHVs in
the villages, more Plasmodium Falciparum
cases have been detected and treated.
95.09% of Malaria cases were detected and
treated in 2012 as against 94% found during
2011. All the yearly comparisons are based
on January – September data.
Integrated Disease Surveillance Project
(IDSP)
Integrated Disease Surveillance
Project (IDSP) was launched on 5th
April,
2005 to detect early warning signals of
impending outbreaks and help initiate an
effective response in a timely manner and to
provide essential data and help allocate
health resources more effectively.
Out Break Monitoring: Swine Flu (H1N1)
Sl.No. Particulars Achievement
1. No. of Persons screened for H1N1 1,59,492
2. No. of suspected cases given Oseltamvir (Cat.B) 20
3. No. of Patients admitted in Hospitals (Cat.C) 6
4. No. of Patients whose sample were tested 82
5. No. of Patients found positive with travel history to
H1N1 notified country (imported cases)
1
6. No. of Patients found positive without travel history
to H1N1 notified country (imported cases)
5
7. No. of patients discharged 4
8. No. of patients still in Hospital 0
9. No. of patients critical Nil
10. No. of deaths 1

Economic Survey Mizoram 2014-15 ~ 113 ~ Social & Service Sector- Health & Medical
Economic Survey Mizoram 2014-15
Revised National TB Control
Programme (RNTCP)
The goal of RNTCP is to decrease
the mortality and morbidity due to
Tuberculosis and cut down the chain of
transmission of infection until TB cases to
be a public health problem. The goal is
achieved through the following objectives;
to achieve and maintain a cure rate of at
least 85% among newly detected smear-
positive (infectious) pulmonary TB cases in
a community. However, the current focus
is on ensuring universal access to quality
assured TB diagnosis and treatment
services under the programme.
During the year 2014-2015, the total
number of patients examined for TB was
9111, the total number of patients
registered was 1993 out of which the total
New Smear Positive patients diagnosed
was 511. The cure rate of New Smear
Positive patients was 90%.
Programme Management of Drug
Resistant TB (PMDT, erstwhile DOTS
Plus) has been implemented in every
district since 2012. Now MDR-TB can be
diagnosed in Mizoram using Cartridge
Based Nucleic Acid Amplification Test
(CBNAAT) since November 2013. For
follow-up of MDR-TB patients, a Culture
& Drug Sensitivity Testing Laboratory is
currently under construction at DR-TB
Centre, Falkawn. There are 85 MDR-TB
patients taking treatment under PMDT.
The Cure Rate for MDR-TB patients is
54%. For all districts, CBNAAT
Laboratory has been planned for the
upcoming FY 2015-2016.
AYUSH
Activities and Achievement on 2014:
1) N. Vanlaiphai PHC, Thingsulthliah
PHC, Haulawng PHC was
established with posting one M.O.
(AYUSH).
2) 3 nos. of Medical Officer (AYUSH)
was recruited under NHM on
contractual basis.
3) The Government of Mizoram has
recruited 10 nos. of Medical Officer
(AYUSH) post on regular basis.
4) Construction of 50 bedded AYUSH
Hospital at Thenzawl is under way
and 75% of the work is completed.
5) AYUSH Free Clinic / Health Camp
was organized at Hnahthial CHC
and Champhai District in which
medicine was distributed at free of
cost to the entire patient who attend
the clinic.
6) No. of OPD (AYUSH attendance in
the current year is 33500.
Expanded Programme of Immunization
(EPI)
Presently, the Routine NIS
(National Immunization Schedule) for
Mizoram is as follows: -
1. BCG – at birth (for institutional
deliveries) or as early as possible till
one year of age.
2. OPV – One dose at birth or as early
as possible within the first 15 days
followed by 3 more doses at 6
weeks, 10 weeks and 14 weeks and
one booster dose at 16-24 months.
3. DPT – 3 doses – at 6 weeks, 10
weeks and 14 weeks followed by
one booster dose at 16-24 months
and at 5-6 years of age.
4. Hepatitis B- one dose at birth
(institutional deliveries) or as early
as possible within 24 hours of birth
followed by 3 more doses at 6
weeks, 10 weeks and 14 weeks.
5. Measles – 1st dose at 9-12 months,
2nd
dose at 16-24 months.
6. Vitamin A – 1st dose at 9 months,
2nd
dose at 16 months then one dose
every 6 months to complete 9(nine)
doses within the first 5 years.
7. TT – at 10 years and 16 years.
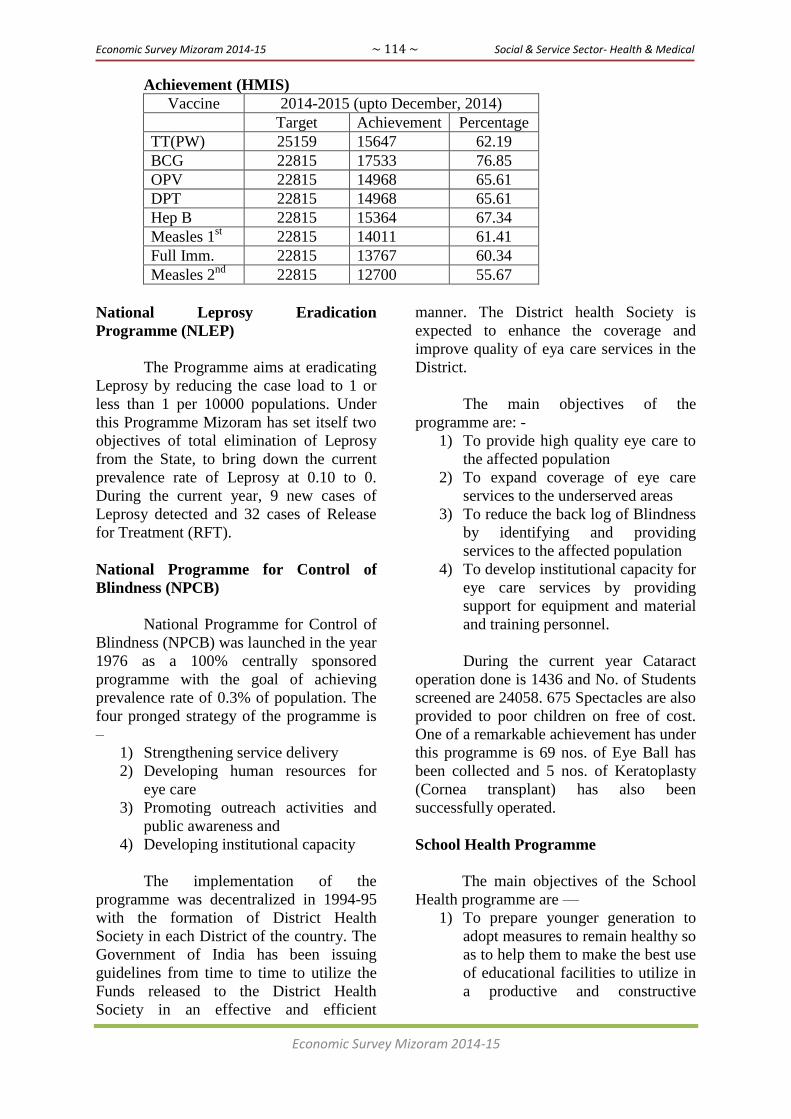
Economic Survey Mizoram 2014-15 ~ 114 ~ Social & Service Sector- Health & Medical
Economic Survey Mizoram 2014-15
Achievement (HMIS)
Vaccine 2014-2015 (upto December, 2014)
Target Achievement Percentage
TT(PW) 25159 15647 62.19
BCG 22815 17533 76.85
OPV 22815 14968 65.61
DPT 22815 14968 65.61
Hep B 22815 15364 67.34
Measles 1st 22815 14011 61.41
Full Imm. 22815 13767 60.34
Measles 2nd
22815 12700 55.67
National Leprosy Eradication
Programme (NLEP)
The Programme aims at eradicating
Leprosy by reducing the case load to 1 or
less than 1 per 10000 populations. Under
this Programme Mizoram has set itself two
objectives of total elimination of Leprosy
from the State, to bring down the current
prevalence rate of Leprosy at 0.10 to 0.
During the current year, 9 new cases of
Leprosy detected and 32 cases of Release
for Treatment (RFT).
National Programme for Control of
Blindness (NPCB)
National Programme for Control of
Blindness (NPCB) was launched in the year
1976 as a 100% centrally sponsored
programme with the goal of achieving
prevalence rate of 0.3% of population. The
four pronged strategy of the programme is
–
1) Strengthening service delivery
2) Developing human resources for
eye care
3) Promoting outreach activities and
public awareness and
4) Developing institutional capacity
The implementation of the
programme was decentralized in 1994-95
with the formation of District Health
Society in each District of the country. The
Government of India has been issuing
guidelines from time to time to utilize the
Funds released to the District Health
Society in an effective and efficient
manner. The District health Society is
expected to enhance the coverage and
improve quality of eya care services in the
District.
The main objectives of the
programme are: -
1) To provide high quality eye care to
the affected population
2) To expand coverage of eye care
services to the underserved areas
3) To reduce the back log of Blindness
by identifying and providing
services to the affected population
4) To develop institutional capacity for
eye care services by providing
support for equipment and material
and training personnel.
During the current year Cataract
operation done is 1436 and No. of Students
screened are 24058. 675 Spectacles are also
provided to poor children on free of cost.
One of a remarkable achievement has under
this programme is 69 nos. of Eye Ball has
been collected and 5 nos. of Keratoplasty
(Cornea transplant) has also been
successfully operated.
School Health Programme
The main objectives of the School
Health programme are —
1) To prepare younger generation to
adopt measures to remain healthy so
as to help them to make the best use
of educational facilities to utilize in
a productive and constructive

Economic Survey Mizoram 2014-15 ~ 115 ~ Social & Service Sector- Health & Medical
Economic Survey Mizoram 2014-15
manner, to enjoy recreation and to
develop concern for others.
2) To help the younger generations to
become healthy and useful citizens
who will be the community at large
and the country as a whole.
3) Promotion of positive health of
School children
4) Prevention of diseases
5) Early diagnosis / treatment / follow
up / referral
6) Awakening of health consciousness
7) Provision of healthful environment
School Health Team across all
districts of the state continue conducting
School Health Check up among all Govt.
and Govt. – Aided Schools. Youth Clinic
under ARSH has been made functional in
27 DH/SDH/CHC/PHC across the state.
The Clinic is operationalized with ICTC,
MSACS. The clinic is opened to
adolescents in need of counseling –
psychological as well as physical.
During School visit, Health
Education Session is also organized and for
prevention of Anaemia, Tab. Albendazole,
Tab. Iron Folic Acid and Micronutrients
like Vit. A & D, Calcium etc. were also
distributed to School Children free of cost.
Rashtrya Bal Swasthya Karyakram
(RBSK):
Comprehensive child health care
implies assurance of extensive health
services for all children from birth to 18
years of age for a set of health conditions.
These conditions are Diseases,
Deficiencies, Disability and Developmental
delays – 4 Ds. Universal screening would
lead to early detection of medical
conditions, timely intervention, ultimately
leading to a reduction in mortality,
morbidity and lifelong disability. The
launch of this programme assumes great
significance as it corresponds to the release
of Reproductive, Maternal, Newborn, Child
Health and Adolescent Health Strategy
(RMNCH+A) and also with the Child
Survival and Development.
The main aims and objectives of
RBSK is to improve the overall quality of
life of children through early detection of
30 identified health conditions or 4D‘s
including Defects at Birth, Diseases,
Deficiencies Conditions and Development
Delays including Disability, to improve
children‘s academic performance and
reduce the rate of child mortality in the
State.
At present, eighteen (18) Mobile
Health Teams are engaged under RBSK,
wherein; each team conducts health
screening programmes across the State.
Two (2) Teams are placed in each district.
Each team comprises of 2 Medical
Officers, 1 Pharmacist / Staff Nurse and 1
Health Worker.
District Early Intervention Centre
(DEIC):
District Early Intervention Centre
(DEIC), a core component of RBSK is a
designated 1st Referral Centre under the
programme. At present, there are two
DEICs, one each at Aizawl and Lunglei
Districts.
The purpose of DEIC is to provide
referral support to children detected with
health conditions during health screening,
primarily for children upto six years of age
group.
The centre provides referral services
to refer children for confirmation of
diagnosis, treatment and quality monitoring
following health screening.

Economic Survey Mizoram 2014-15 ~ 116 ~ Social & Service Sector- Health & Medical
Economic Survey Mizoram 2014-15
Achievement under RBSK during 2014-2015:
No. of School visited No. of Anganwadi
Centre visited
No. of children
screened
1st Quarter 499 331 36388
2nd
Quarter 228 227 36922
3rd
Quarter 207 128 27203
Rashtrya Kishor Swasthya Karyakram
(RKSK):
The Ministry of Health and Family
Welfare has launched this programme for
adolescent, in the age group of 10-19 years.
RKSK mainly focuses on their nutrition,
reproductive health and substance abuse,
among other issues.
RKSK focuses on age group 10-14
years & 15-19 years with universal
coverage i.e., males & females, urban &
rural, in school & out of school, married &
unmarried, vulnerable and underserved.
Goal of RKSK:
Improve adolescent health and well-
being.
II. Outcome of the Department‟s
activities so far and expected
outcome (Impact on economy)
Government of India awarded
Incentive Grant to Mizoram for our
performance in reducing Infant Mortality
Rate and Maternal Mortality Ratio and for
further improvement, amounting to
Rs.3,132.00 lakhs during 2013-2014. The
State plans to utilize the Incentive Grant for
improving and strengthening infrastructure
development by construction of Staff
Quarters, Sub-Centre, complete set of
Equipments and medicines for all Labour
Rooms, capacity buildings, training,
seminar, awareness generation and
incentive to mothers for institutional
delivery, focusing on the improvement of
supervision and monitoring and ASHAS
strengthening would immensely help in
delivering standard and quality health
services in the State. During 2014-2015,
Government of India re-allocated Incentive
Grant for Mizoram amounting to
Rs.1632.58 lakhs under IMR for upliftment
of health problems amongst the community
in the State even in the remotest corner in
rural areas.
The outcome of which will results
in more institutional delivery, better health
for mothers and reduction of infant deaths.
v) Policy constraints required to be
addressed.
State Plan outlay has been mostly
spent for salary component and the
Department is not able to take up other
various health programme within this
meager allocation of fund. The Department
could not even provide the indispensable
items such as Diet Supplies to patient in all
CHC/PHC, supply of materials and
equipments, maintenance of existing
infrastructures and other development
works for improving of the existing 12
Community Health Centres (CHC), 57
Primary Health Centre (PHC) and 370 Sub-
Centres (SC) as desired.
Due to financial constraint, there is
banned for filling up of vacant post and
creation of new post, thus the Department
has insufficient staff to cater to the
healthcare needs of the people which
resulted in our high rate of Infant Mortality
Rate (IMR) and Maternal Mortality Rate
(MMR).
…..

Economic Survey Mizoram 2014-15 ~ 117 ~ Social & Service Sector- Health & Medical
Economic Survey Mizoram 2014-15
HOSPITAL & MEDICAL EDUCATION
I. SECTORAL OVERVIEW: The Directorate of Hospital &
Medical Education is a social service sector
encompassing most of the aspects of human
life, it is a secondary health care
department, it has also inter-sectoral role
and linkage with majority of the other
departments under Government for the
services to the people of Mizoram. It is one
of the two wings of Health & Family
Welfare Department with a separate budget
since 2006-07. Since its inception, the
Department‘s function is to look after
various Hospitals of Mizoram and Health
Institution as detailed under: -
GOVERNMENT HOSPITALS
Sl. No. Name of Hospitals No. of Beds
1 Civil Hospital, Aizawl 300
2 Kulikawn Hospital, Aizawl 50
3 Civil Hospital, Lunglei 120
4 District Hospital, Champhai 60
5 District Hospital, Serchhip 50
6 District Hospital, Saiha 65
7 District Hospital, Kolasib 60
8 District Hospital, Mamit 30
9 District Hospital, Lawngtlai 30
10 Referral Hospital, Falkawn 150
11 Cancer Hospital (RCC), Zemabawk 54
12 Tlabung Sub-divisional Hospital 30
Total 969
NON-GOVERNMENT (PRIVATE) HOSPITALS
Sl. No. Name of Hospitals No. of Beds
1 Presbyterian Hospital, Durtlang 300
2 Christian Hospital, Serkawn 100
3 Greenwood Hospital, Bawngkawn 68
4 Adventist Hospital, Seventh Day Tlang 45
5 Nazareth Hospital, Chaltlang 33
6 Bethesda Hospital, Bawngkawn 70
7 Aizawl Hospital & Research Centre, Mission Veng 100
8 Vaivenga Hospital & Research Centre, Dawrpui 20
9 Grace Nursing Home, Electric Veng 38
10 New Life Hospital, Chanmary 43
11 Maraland Gospel Centenary Hospital, Saiha 70
12 Lairam Christian Medical Centre, Lawngtlai 60
13 Alpha Hospital, Kulikawn 28
14 Med-Aim Adventist Hospital, Champhai 32
15 B.N. Hospital Kulikawn 21
16 Nazareth Nursing Home, Tumpui Kolasib 25
17 Hope Hospital, Lunglei 40
18 Faith Hospital, Lunglei 30
19 D.M Hospital, Champhai 22
Total 1145

Economic Survey Mizoram 2014-15 ~ 118 ~ Social & Service Sector- Health & Medical
Economic Survey Mizoram 2014-15
Tlabung Sub-Divisional Hospital is
under the establishment of
Directorate of Health Services
included in Government Hospitals.
OUT-PATIENT & IN-PATIENTS DURING 2013 – 2014 (April 2012 – March 2014)
Sl. No. Hospitals No. of Out-Patients No. of In-Patients
1 Government Hospitals 723515 46315
2 Non- Government Hospitals 174478 41467
No. of patients referred outside
the state of Mizoram for
investigation and treatment –
2568 (1.4.2014 – up to Jan‟ 15)
Empanelled Hospitals outside the
State
a) Kolkata –
i) BM Birla Heart Research
Institute
ii) Kothari Medical Centre
iii) AMRI Hospital
iv) Calcutta medical research
Institute
v) Apollo Gleneagleas Hospital
vi) Chitaranjan National Cancer
hospital
vii) DESUN Hospital
b) Guwahati –
i) BBCI
ii) GNRC Hospital
iii) Downtown Hospital
iv) International Hospital
v) Pratiksha Hospital
vi) Arya hospital
vii) Sankardeva Netralaya
c) New Delhi –
i) Indian Spinal Injury Centre
ii) Indraprathasta Apollo
Hospital
iii) St. Stephens Hospital
iv) Escort Heart Institute &
Research Centre
v) Sitaram Bhartia Hospital
d) Mumbai – Tata Memorial
Hospital
e) Shillong – Bethany Hospital
f) Vellore – Christian Medical
College
g) Apollo Hospitals – Chennai &
Hyderabad
h) Bangalore – Narayana
Hrudayalaya Institute of cardiac
Science
Empanelled Hospitals within the
State:
Aizawl –
Presbyterian Hospital,
Durtlang
Greenwood Hospital
Bethesda Hospital
Nazareth Hospital
New Life Hospital
Grace Nursing Home
Vaivenga Hospital &
Research Foundation
Aizawl Hospital
Seventh Day Adventist
Hospital, Aizawl
Mizoram Health Care
Lunglei –
Christian Hospital, Serkawn
Hope Hospital
Faith Hospital
Lawngtlai –
Lairam Christian Medical
Centre
Saiha –
Maraland Gospel Centenary
Hospital
Kolasib –
Nazareth nursing Home
Champhai –
DM Hospital,
Med. Adventist, Sevenday
Hospital.

Economic Survey Mizoram 2014-15 ~ 119 ~ Social & Service Sector- Health & Medical
Economic Survey Mizoram 2014-15
II. Activities of the Department in
the Current Financial Fiscal Year
In order to offer good health care to
the people of Mizoram, the Department has
been initiated steps for building good
infrastructures, diagnostic equipments as
well as increase in man-power. Steps are
also taken to avoid large no. of patients
being referred outside the State, for
investigations and treatment as heavy
financial loss is incurred to the Government
exchequer.
In order to fulfill the objectives of
the National Health Mission, the need of
the state of Mizoram in regard to the
Medical Doctors, Staff Nurses &
Paramedical staffs, the state of Mizoram
lacks qualified Doctors/Nurses/
Paramedical staffs both in the urban and
rural areas. In order to bridge this gap and
deficiency, the Department has been
making effort to set up a Medical College
as „Mizoram Institute of Medical
Education and Research (MIMER)‟ it is
proposed to be housed at State Referral
Hospital, Falkawn, prompt action has been
taken so as to admit 50 students on August,
2015, fund for establishment of a Medical
College is expected to release soon from
the Ministry of Health & Family Welfare,
Government of India and permission to
establish a Medical College is being
awaited from the Medical Council of India.
Furthermore, the Department has
also initiated to establish 4(four) GNM
Schools under Ministry of Health & Family
(Nursing Division), Government of India,
at Champhai, Saiha, Kolasib and Serchhip,
the construction of building is undertaken
and on the verge of completion.
Due to high incidence of Cancer in
the State of Mizoram as the state is in fact
the highest in the country comparing to its
population. The Government has
established 40(forty) bedded Cancer
Hospital, Zemabawk. The Hospital is being
equipped with sophisticated instruments /
machines viz. 3-D Treatment Planning
System (TPS), C-Arus, X-Ray Machine,
etc. with fund from the Ministry of Health
& Family Welfare (Cancer Division),
Government of India. It has also been
initiated to upgrade the existing 40 –
Bedded Cancer Hospital into 100 –
Bedded; Detailed Project Report is being
prepared for onward submission to the
Ministry of Health & Family Welfare,
Government of India.
The Directorate of Hospital &
Medical Education if functioning without
having own building/office, construction of
Directorate building is being undertaken at
New Secretariat Complex, Aizawl with an
estimated cost of Rs 8.25 crores under
Special Plan Assistance.
The 200-Bedded Hostel – Block-I
& II for Mizoram College of Nursing,
Falkawn has been started with an estimated
cost of Rs 1169.97 lakhs under Special
Plan Assistance.
The Staff Quarters (Assam Type)
buildings of Civil Hospital, Lunglei are too
old and not suitable for accommodation of
Hospital Staff whose service plays vital
role to ensure good health care to the
people, the Detailed Project Report had
been submitted to the Ministry of DoNER
for possible funding under NLCPR as it is a
retained project to the cost of Rs 17.31
crore.
The State Referral Hospital,
Falkawn (150 Bedded) has been
functioning after the inauguration on 10th
Dec, 2012 by Hon‘ble Chief Minister,
Government of Mizoram. To run the said
Hospital successfully 137 posts have been
created and filling up of the same are being
taken up. It is proposed to be upgraded into
400 Bedded Hospital/ Medical College.
In order to have sufficient clean and
safe water supply installation of water
treatment plants at referral Hospital,
Falkawn, District Hospital, Lawngtlai,
Champhai and Mamit is being undertaken
on BOOT Basis (Build Own Operate and
Transfer) by Intergen Energy Limited. The
State‘s contribution toward the said scheme
had been provided under the State Plan.

Economic Survey Mizoram 2014-15 ~ 120 ~ Social & Service Sector- Health & Medical
Economic Survey Mizoram 2014-15
In order to have good back up
power for Hospitals, the Solar Power Plants
along with batteries – 100 Kwp each have
been installed at the Hospitals noted below
Ministry of New & Renewable Energy,
Government of India, has funded the
project.
1. State Referral Hospital, Falkawn.
2. District Hospital, Champhai.
3. District Hospital, Serchhip.
4. District Hospital, Lawngtlai
5. District Hospital, Mamit.
However, due to financial constraint
in the State, major developments like
infrastructure viz. construction of Hospital
buildings, staff quarters and high tech
equipments could not be met from the State
Plan Budget as about 85% of the total plan
outlay has been utilized for salaries.
Therefore, developments stated above in
respect of the state like Mizoram depend
upon other source of funding agencies like
NEC, NLCPR (MoDNER) etc.
Since the Hospitals hi-tech
machines, diagnostic equipments and
construction of buildings as well are out of
bounds from the state budget, fund has
been sought to the funding agencies stated
above, the on-going projects with funding
pattern of 90:10 is as below: -
1. Improvement of CSSD at 5(five)
Hospitals in the state of Mizoram
viz. Civil Hospital Aizawl, Lunglei,
Districts Hospital Saiha, Kolasib,
Serchhip under NEC (on the verge
of completion)
2. Procurement of CT Scan (16 slice)
at Civil Hospital Aizawl under NEC
(already) installed).
3. Strengthening of Cardiology
Department at Civil Hospital
Aizawl under NEC (being
functioned).
4. Establishment of State Medical
Library at Civil Hospital Aizawl
(civil works portion being started)
5. Strengthening of Dental Department
at Civil Hospital Aizawl along with
District Hospitals in the state of
Mizoram under NEC (being started)
6. Construction of 100-Bedded
Hospital Saiha under NLCPR (n/a
being taken up by the executing
Department State (PWD).
Mizoram State Health Care Scheme
(MSHCS) The Government of Mizoram is
committed to providing Health Insurance
covering to its population and had
implemented for all its population,
excepting Government Servants and their
dependents a Health Insurance Scheme
called the MSHCS (Mizoram State Health
Care Scheme) since April 2008. It had also
formed the Mizoram State Health Care
Society, a registered Society to oversee and
implement directly or indirectly the
implementation of the Scheme. The
Governing Body of the Scheme is chaired
by the Hon‘ble Chief Minister Government
of Mizoram. The intended benefit of the
said scheme is being availed by the needy
patients.
At the same time, RSBY (Rashtriya
Swasthya Bima Yojana), a BPL Scheme for
the unorganised sector under the Ministry
of Labour & Employment, being
implemented all over the country is linked
with MSHCS from 2010. Under the two
Schemes, a BPL family can avail the usual
RSBY cover of Rs. 30,000/- and an
additional cover from MSHCS of
Rs.70,000/- for hospitalised illness and
another cover of Rs. 2 lakhs under MSHCS
for critical illness, thereby making the total
cover up to Rs. 3 lakhs. Moreover, APL
(Above Poverty Line) families could avail
critical illness cover only up to Rs. 3 lakhs
under MSHCS. Both the schemes were
implemented using an Insurance provider
but from 2011-12, MSHCS is being
implemented on Self Finance Basis by the
Society.
The two schemes are being
implemented and there is much
improvement in enrolment as can be
deduced as given:

Economic Survey Mizoram 2014-15 ~ 121 ~ Social & Service Sector- Health & Medical
Economic Survey Mizoram 2014-15
Enrolment status for Policy Period of 2010 -2011
No of Enrolment Target Percentage
Health Care BPL Family 28245 NA NA
APL Family 11940 NA NA
RSBY 18129 67418 26.9
Enrolment status for Policy Period of 2010 -2011
Percentage No of Enrolment Target Percentage
Health Care BPL Family 27383 NA NA
APL Family 4555 NA NA
RSBY 45461 73577 61.8
The claims payment status is as given:
Claims payment status for Policy Period of 2010 - 2011
Particulars MSHCS RSBY
Claims
(No)
Amount
(Rs)
Claims
(No)
Amount
(Rs)
MR Bills Received 8494 105397072 966 5018390
MR Bills Accepted 8092 86851644 931 4608125
Bills Paid 6266 68193295 784 3830775
Bills Rejected 402 18545428 35 74900
Bills Pending 1826 18658349 147 777350
Claims payment status for Policy Period of 2011 – 2012
Particulars MSHCS RSBY
Claims (No) Amount (Rs) Claims (No) Amount (Rs)
MR Bills Received 4205 81949916 9073 55750670
MR Bills Accepted 3843 77028876 7222 47717420
Bills Paid 3797 59750489 6525 43688370
Bills Rejected 362 4921040 1851 8033250
Bills under Processed 46 17278387 697 4029050
CLAIMS PAYMENTS STATUS FOR POLICY PERIOD OF 2013-2014.
Particulars MSHCS RSBY OPD
Claims Amount Claims Amount Claims Amount
MR Bills Received 5192 100277791 18888 104167805 4013 459720
MR Bills Accepted 4453 74453458 14991 79166514 3322 358545
Bills Paid 4453 74453458 14991 79166514 3322 358545
Bills Rejected 178 2827598 2453 10616475 34 2625
Bills Under Processed 561 22996735 1444 14384816 657 98550
CLAIMS PAYMENTS STATUS FOR POLICY PERIOD OF 2014-2015
Particulars MSHCS RSBY OPD (Lawngtlai
& Saiha)
Claims Amount Claims Amount Claims Amount
Enrollment 59196 152983
MR Bill accepted 3062 Rs. 48260225 10992 Rs. 59484025 440 Rs. 67100
Bills paid 3062 Rs. 48260225 10992 Rs. 59484025 440 Rs. 67100
Bills reject 128 Rs. 2046370

Economic Survey Mizoram 2014-15 ~ 122 ~ Social & Service Sector- Health & Medical
Economic Survey Mizoram 2014-15
IV. Outcome of the Department‟s
Activities so far and Expected
Outcome (Impact on Economy)
Due to inadequate availability of
state of the art equipments and shortage of
man power, there are many instances when
patients have to be referred outside the state
for necessary investigation and treatment at
the cost of the Government of Mizoram‘s
exchequer. Various measures have been
made by the department to improve the
treatment of facilities in the state so as to
cut down Government spending as well as
inconveniences to the patient party. It is
envisaged that the services and facilities of
the District Hospitals be upgraded so that
the people in the rural areas do not need to
make long journey to the state capital to
receive necessary treatment for their illness.
V. Policy Constraints to be addressed
Man power:
The Directorate of Hospital &
Medical Education has been functioning
with inadequate man power since its
inception 2006, the Hospitals are managed
by a separate Administrative
Establishment, however, most of the
Hospitals are still not functioning as full
fledge establishments due to lack of
adequate man power. The Hospital services
being a labour intensive zone, the fund
provision could not cope with the
requirement of man-power with compared
to the minimum requirement of the Indian
Public Health Standard Norms (IPHS).
Patients have also been facing difficulties
in proper utilization of facilities due to
absence of man power.
Diagnostic Equipment:
Due to curtailment of plan fund, the
Department could not equip the vital
requirements of Hospital viz. Hi-tech and
Med tech equipments and machineries. As
a result of these, there are many instances
when patients have to be referred outside
the state for necessary investigations and
treatment at the cost of Government
exchequer.
Construction of Buildings /staff
quarters:
Due to financial constraint in the
Department, major developments viz.
construction of hospital buildings, staff
quarters could not be taken up as the
existing hospital buildings, staff quarters,
structures are semi pucca and very old.
They are also in a dilapidated condition due
to natural wear and tear. Some of the
buildings are not fit for occupation.
Moreover, maintenance of Hospital
buildings and staff quarters could not have
been undertaken.
Proposal for Solving the Identified
Problems and Policy Constraints
The following measures to improve
the development gap occurred in Medical
& Health Sector under Directorate of
Hospital & Medical Education as
elaborated as under:
Conversion of Plan post into Non-Plan: About 85% of the Department‘s total outlay
has been utilized for salaries and wages,
such being the case, the Department is not
in a position to provide vital requirement of
Hospitals viz. Hospital Diet, supply of
materials and equipments, supply of
emergency medicines etc and other
development works. It is therefore
suggested that most of our Plan Post might
be converted into Non-Plan which may
reduce the utilization of fund on salary &
wages.
Provision of Diagnostic Equipments /
Supply of vital medicines and
consumables: In order to avoid a large
number of referred cases outside the state
for necessary investigation and treatment,
the various hospitals need to be well
equipped with machineries, diagnostic
equipments, supply of vital medicines and
consumables. Hence, more funds are
Economic Survey Mizoram 2014-15 ~ 123 ~ Social & Service Sector- Health & Medical
Economic Survey Mizoram 2014-15
required so as to achieve the financial loss
of Government exchequer.
Renovation / Construction of Buildings: The existing Hospital buildings and staff
quarters are very old, dilapidated and
congested to accommodate the increasing
no. of patients, re-construction of Hospital
buildings, quarters are very much essential
so as to provide good health care to the
people. Hence, more funds are required.
Telemedicine at District Hospitals: Telemedicine is a real need for patients out
there who cannot get clinical consultation
and decision making due to unavailability
of doctors, lack of communication
infrastructure or not fit for travel. To
improve the health care facilities in the
State, telemedicine is considered absolutely
necessary to install at the District Hospitals
– so that the development gap hindering
better treatment for patients in Medical &
Health Sector may be abolished which in
turn automatically provide better treatment
of patients in the state. Hence, more funds
are required.
…..

Economic Survey Mizoram 2014-15 ~ 124 ~ Social & Service Sector- Water Supply & Sanitation
Economic Survey Mizoram 2014-15
WATER SUPPLY AND SANITATION
Rural Water Supply:
Rural Drinking Water Supply are
implemented mainly by providing Piped
Water Supply using Gravity Flow,
Pumping Scheme, Rain Water Harvesting
Scheme (RWHS), Hand Pump Tube Well,
Improvement of Village Spring Source and
Impounding Reservoir, etc. As per
Habitation Survey 2003 conducted by
PHED, Mizoram and as revalidated by
Indian Institute of Public Administration,
New Delhi, there are 777 Rural Habitations
in Mizoram.
The Government has introduced
new guidelines of National Rural Drinking
Water Programme (NRDWP) with effect
from 1.4.2009 which envisages covering of
all rural habitations by 2012. The status of
rural habitations as on 1.4.2012 was as
under:
1. Non-Covered (NC) i.e. upto 10 lpcd
= 0 habitations
2. Partially Covered (PC) i.e. above10
lpcd but below 40 lpcd = 66
habitations
3. Fully Covered habitation (FC) i.e.
above 40 lpcd = 711 habitations
Total = 777 habitations
The present status as on 1.4.2014 is
as under:
1. Non-Covered (NC) i.e. upto 10 lpcd
= 0 habitations
2. Partially Covered (PC) i.e. above10
lpcd but below 40 lpcd = 438
habitations
3. Fully Covered habitation (FC) i.e.
above 40 lpcd = 339 habitations
Total = 777 habitations
Rural Sanitation (TSC):
Total Sanitation Campaign (TSC)
was introduced in 2003-04, which was later
known as Nirmal Bharat Abhiyan (NBA)
and now renamed as Swachh Bharat
Mission (Gramin). The Implementing
Department has constructed 84648 nos. of
Individual Household Latrines, 4124 nos.
of school toilets and 1453 nos. of
Anganwadi toilets and 568 nos. of Sanitary
complex have been constructed so far.
Urban Water Supply:
Mizoram is still on its way in
achieving the National norms of Water
Supply Level (70 lpcd) in Urban Water
Supply Programme. There are 1 city and 22
towns in Mizoram, 12 towns have been
brought under fully covered status (70
lpcd), 8 towns are brought under Partially
Covered (i.e. above 10 lpcd but below 70
lpcd) and 3 towns are non-covered (i.e. less
than 10 lpcd).
Water Supply Projects:
There are some projects which are
being implemented under various sources
of funding with a view to bring the towns /
villages to fully covered status. They are as
follows: -
S.
No. Name of Project
Approved
cost Programme/ Funded by
1 Greater Lawngtlai Water Supply Scheme 2564.50 DoNER
2 Greater Hnahthial Water Supply Scheme 825.60 DoNER
3 Tuipang Water Supply Scheme 941.13 DoNER
4 Greater Saitual Water Supply Scheme 2153.00 DoNER
5 Bilkhawthlir Water Supply Scheme 780.47 DoNER
6 W. Phaileng Water Supply Scheme 995.19 DoNER
7 Bairabi Water Supply Scheme 490.37 DoNER
8 S. Khawbung Water Supply Scheme 827.38 DoNER
9 Sairang Water Supply Scheme 221.14 DoNER

Economic Survey Mizoram 2014-15 ~ 125 ~ Social & Service Sector- Water Supply & Sanitation
Economic Survey Mizoram 2014-15
10 Aibawk Water Supply Scheme 979.42 DoNER
11 Greater Saiha Water Supply Scheme 2070.20 10% L.S. Grant under
Urban Ministry
12 Tlabung Water Supply Scheme 441.00 10% L.S. Grant under
Urban Ministry
13 Greater Khawzawl Water Supply Scheme 2497.00 10% L.S. Grant under
Urban Ministry (New
Scheme)
14 Sangau Water Supply Scheme Ph-I 484.00 NEC
15 Phuaibuang Water Supply Scheme 391.50 NEC
16 Bualpui ‗NG‘ & Lungzarhtum Water
Supply Scheme
493.00 NEC
17 Lengpui Town & Lengpui Airport WSS
(Pumping)
458.20 NEC
18 Sangau Water Supply Scheme (Pumping)
Ph-II
471.60 NEC
19 Darlawn Water Supply Scheme (Aug) 485.20 NEC
20 Vairengte Water Supply Scheme 783.11 NEC
Slipped Back Problems:
In Mizoram, sources of water have
been depleting and even some sources are
drying up in various places on account of
deforestation of catchment areas and other
factors. Many schemes have slipped back
due to those reasons. Methods like Rain
Water Harvesting, Sustainability approach
through Scientific Source finding, Isotope
study in catchment for Recharging spring
sources are being tried and adopted to solve
the ever increasing problem of drying up of
water sources.
……
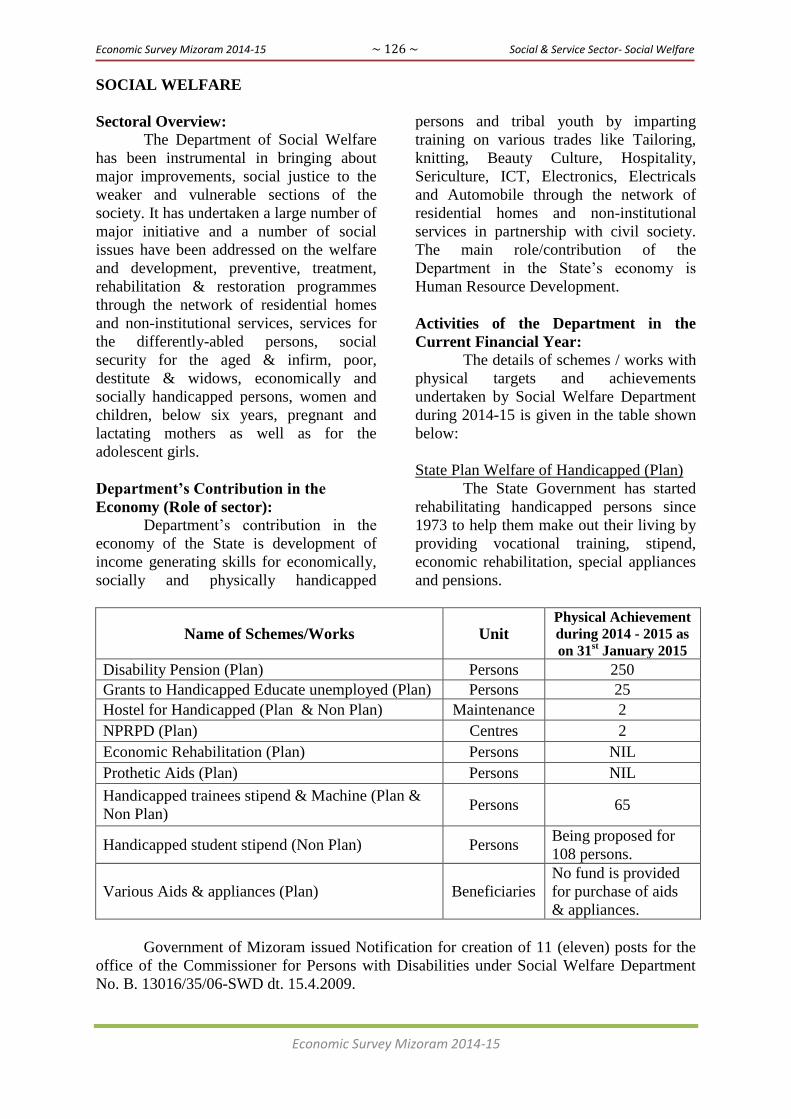
Economic Survey Mizoram 2014-15 ~ 126 ~ Social & Service Sector- Social Welfare
Economic Survey Mizoram 2014-15
SOCIAL WELFARE
Sectoral Overview:
The Department of Social Welfare
has been instrumental in bringing about
major improvements, social justice to the
weaker and vulnerable sections of the
society. It has undertaken a large number of
major initiative and a number of social
issues have been addressed on the welfare
and development, preventive, treatment,
rehabilitation & restoration programmes
through the network of residential homes
and non-institutional services, services for
the differently-abled persons, social
security for the aged & infirm, poor,
destitute & widows, economically and
socially handicapped persons, women and
children, below six years, pregnant and
lactating mothers as well as for the
adolescent girls.
Department‟s Contribution in the
Economy (Role of sector):
Department‘s contribution in the
economy of the State is development of
income generating skills for economically,
socially and physically handicapped
persons and tribal youth by imparting
training on various trades like Tailoring,
knitting, Beauty Culture, Hospitality,
Sericulture, ICT, Electronics, Electricals
and Automobile through the network of
residential homes and non-institutional
services in partnership with civil society.
The main role/contribution of the
Department in the State‘s economy is
Human Resource Development.
Activities of the Department in the
Current Financial Year:
The details of schemes / works with
physical targets and achievements
undertaken by Social Welfare Department
during 2014-15 is given in the table shown
below:
State Plan Welfare of Handicapped (Plan)
The State Government has started
rehabilitating handicapped persons since
1973 to help them make out their living by
providing vocational training, stipend,
economic rehabilitation, special appliances
and pensions.
Name of Schemes/Works Unit Physical Achievement
during 2014 - 2015 as
on 31st January 2015
Disability Pension (Plan) Persons 250
Grants to Handicapped Educate unemployed (Plan) Persons 25
Hostel for Handicapped (Plan & Non Plan) Maintenance 2
NPRPD (Plan) Centres 2
Economic Rehabilitation (Plan) Persons NIL
Prothetic Aids (Plan) Persons NIL
Handicapped trainees stipend & Machine (Plan &
Non Plan) Persons 65
Handicapped student stipend (Non Plan) Persons Being proposed for
108 persons.
Various Aids & appliances (Plan) Beneficiaries
No fund is provided
for purchase of aids
& appliances.
Government of Mizoram issued Notification for creation of 11 (eleven) posts for the
office of the Commissioner for Persons with Disabilities under Social Welfare Department
No. B. 13016/35/06-SWD dt. 15.4.2009.

Economic Survey Mizoram 2014-15 ~ 127 ~ Social & Service Sector- Social Welfare
Economic Survey Mizoram 2014-15
The Office of the Commissioner for
Persons with Disabilities under Social
Welfare Department has started functioning
with the following staffs as follows: -
1. Assistant Commissioner - On
Deputation
2. Research-cum-Programme
Assistant - Contract Basis
3. Assistant - Regular
Selection of remaining 8 staffs will
be carried out in short time.
2. Child Welfare
Development is the key concern of
all the nations. Full development of human
resource and efficient utilization is one of
the most important resources in the nation
building activities. For the fullest
development of human resource, its
foundation must be laid in the early stages
of life. Social Welfare Department is
implementing various schemes that caters
to the needs of children of different age
groups to mould their characters as well as
their all round development.
Name of Schemes/Works Unit
Physical Achievement
during 2014 – 2015 as on
January 31st 2015
(a) Pre-School for Children (Plan & Non Plan) Centres 10
(b) Creche/Day Care Centre (Plan & Non Plan) Centres 29
(c) State Council for Child Welfare (Plan) Centre 1
(d) Adoption Cell Centre 1
(e) Bal Bhavan (Plan) Persons 700
3. Women Welfare
To reduce the acute Social &
economic problems faced by unfortunate
widows, divorcees, unmarried mothers and
destitute women particularly with minor
children to look after, the scheme of socio-
economic development programmes have
been implemented since 1985 – 1986 with
considerable success.
(a) Socio-economic Programme for Destitute (Plan) Persons 263
(b) RITC for 25 inmates (Non Plan) Center 1
(c) Women Commission (Plan) Centre 1
(d) Vocational Training Centers (CSS) Centres 5
(e) Protective Home/Reception Centre (Plan) Centre 1
(f) Observation/Remand Home Centres 2
4. Welfare of Aged, Infirm &
Destitute
The State Government has been
implementing the ‗IGNOAP‘ by providing
Old Age Pension to poor, destitute Older
Persons who have attained 60 years and
above 55 years in case of physically and
mentally handicapped living below poverty
line.
To provide shelter, security &
protection to older persons above 60 years
and having no near relative or supporter, an
Old Age Home is run since 1989.
(a) Old Aged Home (Non Plan) Home 1
(b) IGNOAPS (ACA) Persons 25251
(c) IGNWPS (ACA) Persons 1925
(d) IGNDPS (ACA) Persons 618
(e) NFBS (ACA) Persons 197

Economic Survey Mizoram 2014-15 ~ 128 ~ Social & Service Sector- Social Welfare
Economic Survey Mizoram 2014-15
5. Integrated Child Development
Scheme (CSS)
In pursuance of the National Policy
for Children adopted in 22nd
August, 1974
which laid emphasis on the integrated
delivery of early childhood services for
children below 6 years and expectant and
nursing women. Based on the
recommendation of the Inter-Ministerial
Study Teams set up by the Planning
Commission, the scheme of Integrated
Development Services (ICDS) was evolved
to make a coordinated effort for an
integrated programme of delivery of
package of such services. The first 33 pilot
projects were set up in 1975–1976. Later on
the Planning Commission on the basis of
the evaluation report sanctioned more
projects. By the turn of the 12th
Five Year
Plan, the ICDS Programme is planned to be
universalize covering all the habitations of
India.
Data of ICDS in the State is shown
below: -
No. of ICDS Projects 27
No. of AWC 2244
No. AWWs Persons 2244
No. of children enrolled 6 months – 6 years Persons 73734
No. of AWTC 1
No. of Pregnant Women Persons 10000
No. of Lactating Women Persons 10417
No. of AWC providing PSE for 21 days 601
No. of beneficiaries
(i) Boys
(ii) Girls
Persons
37009
36725
6. Supplementary Nutrition
Programme Plan & CSS
Supplementary Nutrition
Programme aims at reducing the prevalence
of malnutrition among children between 6
months to 6 years, pregnant and lactating
mother and adolescent girls. It provides
supplementary feeding to an extent of 500
calories and 12 – 15 grams of protein to
children, 800 calories and 20 25 grams of
protein to pregnant, lactating mothers and
adolescent girls.
In the State of Mizoram, different
types of foods rich in proteins and calories,
fortified with micro-nutrient are selected as
supplementary foods for distribution to the
beneficiaries at Anganwadi Centres. To
combat micro-nutrients deficiencies,
micronutrients such as Vitamin A, Iron,
Zinc, Vitamin B Complex and Calcium are
given in the form of syrups and tablets.
The State Government has compiled
with the nutritional and feeding norms of
the Government of India. It provides
feeding for 300 days in a year.
Physical Achievement:
Beneficiaries covered during the
year 2014 - 2015:
Year Normal
Children
Malnourished
Children
Severely
Malnourished
Children
Mothers
No of
AWWs
&
AWHs
TOTAL
2014 – 15 134016 24450 767 31872 4488 195593
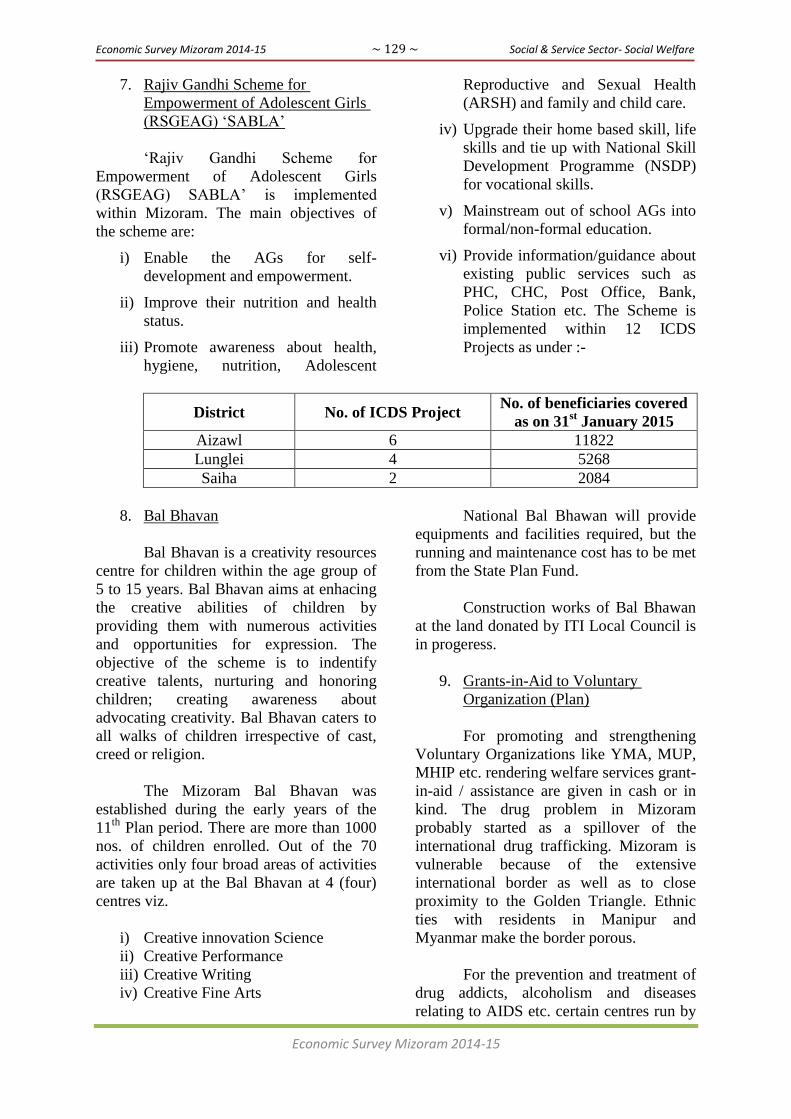
Economic Survey Mizoram 2014-15 ~ 129 ~ Social & Service Sector- Social Welfare
Economic Survey Mizoram 2014-15
7. Rajiv Gandhi Scheme for
Empowerment of Adolescent Girls
(RSGEAG) ‗SABLA‘
‗Rajiv Gandhi Scheme for
Empowerment of Adolescent Girls
(RSGEAG) SABLA‘ is implemented
within Mizoram. The main objectives of
the scheme are:
i) Enable the AGs for self-
development and empowerment.
ii) Improve their nutrition and health
status.
iii) Promote awareness about health,
hygiene, nutrition, Adolescent
Reproductive and Sexual Health
(ARSH) and family and child care.
iv) Upgrade their home based skill, life
skills and tie up with National Skill
Development Programme (NSDP)
for vocational skills.
v) Mainstream out of school AGs into
formal/non-formal education.
vi) Provide information/guidance about
existing public services such as
PHC, CHC, Post Office, Bank,
Police Station etc. The Scheme is
implemented within 12 ICDS
Projects as under :-
District No. of ICDS Project No. of beneficiaries covered
as on 31st January 2015
Aizawl 6 11822
Lunglei 4 5268
Saiha 2 2084
8. Bal Bhavan
Bal Bhavan is a creativity resources
centre for children within the age group of
5 to 15 years. Bal Bhavan aims at enhacing
the creative abilities of children by
providing them with numerous activities
and opportunities for expression. The
objective of the scheme is to indentify
creative talents, nurturing and honoring
children; creating awareness about
advocating creativity. Bal Bhavan caters to
all walks of children irrespective of cast,
creed or religion.
The Mizoram Bal Bhavan was
established during the early years of the
11th
Plan period. There are more than 1000
nos. of children enrolled. Out of the 70
activities only four broad areas of activities
are taken up at the Bal Bhavan at 4 (four)
centres viz.
i) Creative innovation Science
ii) Creative Performance
iii) Creative Writing
iv) Creative Fine Arts
National Bal Bhawan will provide
equipments and facilities required, but the
running and maintenance cost has to be met
from the State Plan Fund.
Construction works of Bal Bhawan
at the land donated by ITI Local Council is
in progeress.
9. Grants-in-Aid to Voluntary
Organization (Plan)
For promoting and strengthening
Voluntary Organizations like YMA, MUP,
MHIP etc. rendering welfare services grant-
in-aid / assistance are given in cash or in
kind. The drug problem in Mizoram
probably started as a spillover of the
international drug trafficking. Mizoram is
vulnerable because of the extensive
international border as well as to close
proximity to the Golden Triangle. Ethnic
ties with residents in Manipur and
Myanmar make the border porous.
For the prevention and treatment of
drug addicts, alcoholism and diseases
relating to AIDS etc. certain centres run by
Economic Survey Mizoram 2014-15 ~ 130 ~ Social & Service Sector- Social Welfare
Economic Survey Mizoram 2014-15
NGOs who are found deserving are given
Financial Assistance.
(a) Assistance to NGOs – 186
10. Tribal Welfare Scheme under
Article 275(ACA) & Others
Under Article 275(1), grants are
provided to the States on the basis of ST
population percentage in the State of the
total tribal population of the Country. The
fund are released to the State Government
against specific projects for the welfare of
Scheduled Tribes and strengthening of
administration of tribal areas. The scheme
is valid with effect from 2002 – 2003 in the
State of Mizoram.
Major Projects taken up under this
Scheme are – Tribal Art Centre – 1,
Eklavya Model Residential School – 2,
Forest Village Development.
11. Integrated Child Protection Scheme
(ICPS) (CSS/Plan)
The Government of India, Ministry
of Women & Child Development has
formulated a new Centrally Sponsored
Scheme called Integrated Child Protection
Scheme which has been initiated during the
11th
Five Year Plan. The scheme is broadly
based on the Juvenile Justice (Care &
Protection of Children) Act 2000, and its
Amendment Act 2006. The Government of
India views child protection as an essential
component of the country‘s strategy to
place ‗Development of the Child at the
Centre of the Plan’ As per the scheme all
the existing child welfare schemes comes
under one umbrella.
The following structures and
support services are established: -
i) State Child Protection Society - 1
ii) District Child Protection Unit - 8
iii) Recognized Children Home - 27
iv) Specialized Adoption Agency - 4
v) Observation Home - 2
vi) Special Home - 2
vii) Child Welfare Committee - 8
viii) Juvenile Justice Board - 8
ix) Special Juvenile Police Unit - 8
x) State Project Support Unit - 1
Funding pattern for the cost of the
implementation of the Scheme will be
shared by the Central Government and
State Government in the ration of 90:10.
Construction of Observation Home
at Durtlang and Lunglei at the cost of Rs.83
lakhs completed during 2014-15.
Outcome of the Department‟s Activities
so far and Expected Outcome (Impact on
economy):
The Department is taking up various
schemes and projects for the welfare,
development and socio-economic
rehabilitation programme for economically
and socially handicapped persons through
the network of residential homes and non-
institutional services in partnership with
civil society. Training on various trades
like Tailoring, Knitting, Beauty Culture,
Hospitality, Sericulture, ICT, Electronics,
Electricals and Automobile are imparted at
the Training Centres viz. Handicapped
Training Centres at Aizawl and Lunglei for
handicapped persons, RITC for
economically and socially handicapped/
destitute women, 5 (five) Vocational
Training Centres for tribal youth for
development of income generating skills to
enable them to earn their living.
It is expected that total number of
beneficiaries as per the capacity of each
and every Centres i.e. 580 could benefit
from the schemes/projects each year. Thus
the outcome of the Department‘s activities
every year is shifting of dependent
population to independent population to the
tune of 280 by enabling them to earn their
livelihood.
Economic Survey Mizoram 2014-15 ~ 131 ~ Social & Service Sector- Social Welfare
Economic Survey Mizoram 2014-15
Policy Constraints required to be
addressed:
Inspite of its own limitations and
shortcomings owing to variety of factors
like insufficient funding, poor
infrastructures or lack of it, a large number
of major initiatives have been taken up by
the Department providing welfare
programmes and services to the differently
abled persons, social security for the aged,
infirm, poor and destitute widows,
rehabilitation programme for economically
and socially handicapped persons,
combating drugs abuse, alcoholism,
trafficking of women and children,
imparting training for income generating
skills, etc.
However, the Department could not
realize the implementation of the schemes
to the fullest due to insufficient provision
of fund. Thus it is most desirable that
sufficient fund is provided to enable the
Department to carry out its various
activities to the most beneficial manner in
bringing about the human resource
development to the fullest.
…..
Economic Survey Mizoram 2014-15 ~ 132 ~ Social & Service Sector- Cooperation
Economic Survey Mizoram 2014-15
COOPERATION
The strategy of the Cooperative
Department is to strengthen and enhancing
the progress of Cooperative Movement
already launched within the State which
broadly aimed at Socio-Economic
development of the people of Mizoram.
Socio-Economic upliftment through
Cooperative movement envisaged
organization and registration of new
Cooperative Society to cover wider field of
activities, cancellation and winding up of
defunct societies, strengthening of
Cooperative credit structures, obtaining
credit facilities, providing financial
assistances to Cooperatives, providing
Cooperative education and training and
strengthening the organizational set up and
infrastructure of the department.
As per sectoral allocation for
Annual Plan 2014-15, the outlay for
Annual Plan 2014-15 in respect of
Cooperation Department is fixed at
Rs.848.66 lakhs including expected
Rs.560.00 lakhs from NCDC and
Rs.168.16 lakhs SCA for GIA to MSCU,
etc. As such the Department is having only
Rs.120.00 lakhs for implementation of
normal schemes resulting in a shortfall for
contribution to Gross State Domestic
Product (GSDP), employment, job creation
and capital formation etc.
Keeping in view of fund constraints
with the State Government, the
Cooperation Department proposed
implementation of ICDP Programme in 5
(five) District of Mizoram and the project
was approved and sanction by NCDC with
total cost of Rs.4494.452 lakhs and this
programme is to be implemented for 4
(four) years. During 2014-15, Rs.560.00
lakhs was earmarked under Plan for
NCDC/ICDP. Out of this, Rs.160.08 lakhs
had already been incurred for NCDC
Schemes.
Under Revival Package for
Handloom of the Government of India, 70
(seventy) Primary Handloom Weavers
Cooperative Societies were selected and
payment to the tune of Rs.21,729.609/- was
released for waving off their accumulated
loss and loan liabilities.
During 2014-15, Amendment of
Mizoram Cooperative Societies Rules,
2012 was legislated. There is no financial
implication in the MCS (Amendment)
Rules, 2014. All the financial involvement
in this Rule had already been contained in
the Mizoram Cooperative Societies Act,
2006, Amendment Act, 2009, 2010 &
2012.
During 2014-15, a target of
Revenue Receipt in respect of Cooperation
Department is Rs. 23.00 lakhs and the
Department achieved Rs. 26.85 lakhs upto
December, 2014.
There are at present 1430 Primary
Cooperative Societies and 10 State Level
Cooperative Societies scattered all over the
State serving the people for their economic
upliftment and improving their economic
conditions. The position of different types
of Cooperative Societies in Mizoram
including 10 State Level Cooperative
Societies at a glance for the year 2012-13
can be seen from the following table.

Economic Survey Mizoram 2014-15 ~ 133 ~ Social & Service Sector- Cooperation
Economic Survey Mizoram 2014-15
(Rupees in lakhs)
Sl.
No.
Type of Cooperative
Societies
No. of
Socie-
ties
No. of
Members
Paid
up Share
Capital
Business
Turnover
No. of
Societies
running
in profit
1 2 3 4 5 6 7
1. Industrial Cooperatives 87 1,937 11.05 36.30 42
2. Multipurpose Cooperatives 167 5,635 39.63 264.61 128
3. Dairy & Livestock
Cooperatives
104 2,618 14.72 959.62 72
4. Piggery Cooperatives 242 5,545 53.95 103.04 150
5. Handloom Cooperatives 184 4,914 84.34 2,623.18 135
6. Consumers Cooperatives 134 5,991 69.46 748.91 85
7. Service Cooperatives 49 1,869 34.97 234.88 35
8. Fisheries Cooperatives 66 1,588 21.61 10.41 30
9. Farming Cooperatives 279 11,441 106.90 175.39 155
10. Poultry Farming Coops. 20 522 15.25 3.48 6
11. Canteen Cooperatives 12 428 5.99 9.41 8
12. Labour Cooperatives 8 577 2.37 5.72 4
13. Sericulture Cooperatives 35 1,066 6.65 9.21 12
14. Housing Cooperatives 5 100 2.65 - 3
15. Marketing Cooperatives 12 256 8.29 0.50 5
16. Floriculture Cooperatives 5 125 0.64 0.97 3
17. Meat Processing Coops. 11 273 1.91 0.31 6
18. Large Size Agriculture 11 1,264 32.61 106.76 7
19. Banking Cooperatives 2 4,719 351.01 646.00 1
20. State Level Cooperatives 10 - 1,630.52 37,293.01 10
TOTAL 1,443 50,865 2,494.52 43,231.70 897
State Level Cooperatives:
There are 10 (ten) nos. of registered
State Level Cooperative Societies in
Mizoram. The achievements of such State
Level Cooperatives during the year 2012-
13 are as follows: -
1. Mizoram State Agriculture
Horticulture and Marketing
Cooperative Federation Ltd.
(MAHFED):
(a) Nos. of affiliated Primary
Cooperatives - 81 nos.
(b) Nos. of Employees - 12 nos.
(c) Financial Support:
i) Ministry of Tribal Affairs
under Minor Forest Produces
Scheme - Rs. 24.00 lakhs
ii) NCDC Margin Money
Scheme out of Rs. 40.00 lakhs
proposal - Rs. 30.00 lakhs
(d) Business Activity :
MAHFED procured Fertilizers such
as DAP, Urea, MOP, SSP and SL
Worths of Rs. 110.63 lakhs and
distributed to the Farmers.
MAHFED is running Sales
Emporium at Aizawl since 2011
wherein different agricultural tools
and implements are being sold.

Economic Survey Mizoram 2014-15 ~ 134 ~ Social & Service Sector- Cooperation
Economic Survey Mizoram 2014-15
(e) Financial Aspect :
2011-12 2012-13
1 Paid up Share Capital Rs. 13,92,900 Rs. 14,12,900
2 Business turnover Rs. 66,12,335 Rs. 71,90,953
3 Profit during the year Rs. 4,26,271 Rs. 2,61,202
4 Accumulated Profit Rs. 39,04,838 Rs. 24,65,807
2. Mizoram Apex Handloom &
Handicraft Cooperative Society
Ltd. (MAHCO): MAHCO procures yarns from
outside the State through National Handloom Development Corporation under Mill Gate Price Scheme for which transportation charges have been reimbursed by the Corporation. These Yarn materials are being sold out from showroom located at Aizawl and also through its sub-agent at Thenzawl.
MAHCO also procured finished products from its affiliated Primary Handloom Cooperatives for which Handloom fairs have been organized at different district Headquarters annually for which financial support has been received from the Ministry of Textiles Development Commissioner for Handlooms. During the year 2011-12 and 2012-13, MAHCO organized Handloom Fairs at Champhai, Khawzawl, Hnahthial, Lunglei, Vairengte and Hnahlan.
Membership:
a) Nos. of affiliated Primary Handloom Cooperatives - 152
b) Nos. of Employees - 10
c) Paid up share capital - Rs. 38.99 lakhs
Financial Aspects:
Items 2011 – 2012 2012 – 2013 a) Business turnover Rs. 120.80 lakhs 128.06 lakhs
b) Profit (+) / Loss (-) Rs. (-) 5.60 lakhs (+) 6.95 lakhs
c) Accumulated Profit Rs. 29.92 lakhs 36.88 lakhs
3. Mizoram Milk Producers
Cooperative Union Ltd.
(MULCO): MULCO procures Dairy Milk from
its affiliated Primary Dairy Cooperatives and distributed to the public through its selling agents. MULCO installed 10,000
lits. Capacity Chilling Plant as permitted by the Integrated Dairy Development (IDDP). During the year 2012-13, MULCO marketed Dairy Milk as much as 28,27,671 litres worths of Rs. 107.57 lakhs. There are 34 Primary Dairy Cooperatives affiliated to MULCO.
Financial Aspects:
2011 – 2012 2012 – 2013
a) Paid up share capital : Rs. 8,20,650 13,03,650
b) Business turnover : Rs. 965,58,106 13,14,01,875
c) Profit(+)/Loss(-) during the year : Rs.(+) 25,62,084 (-) 19,00,558
d) Accumulated Profit : Rs. 87,44,970 26,40,049
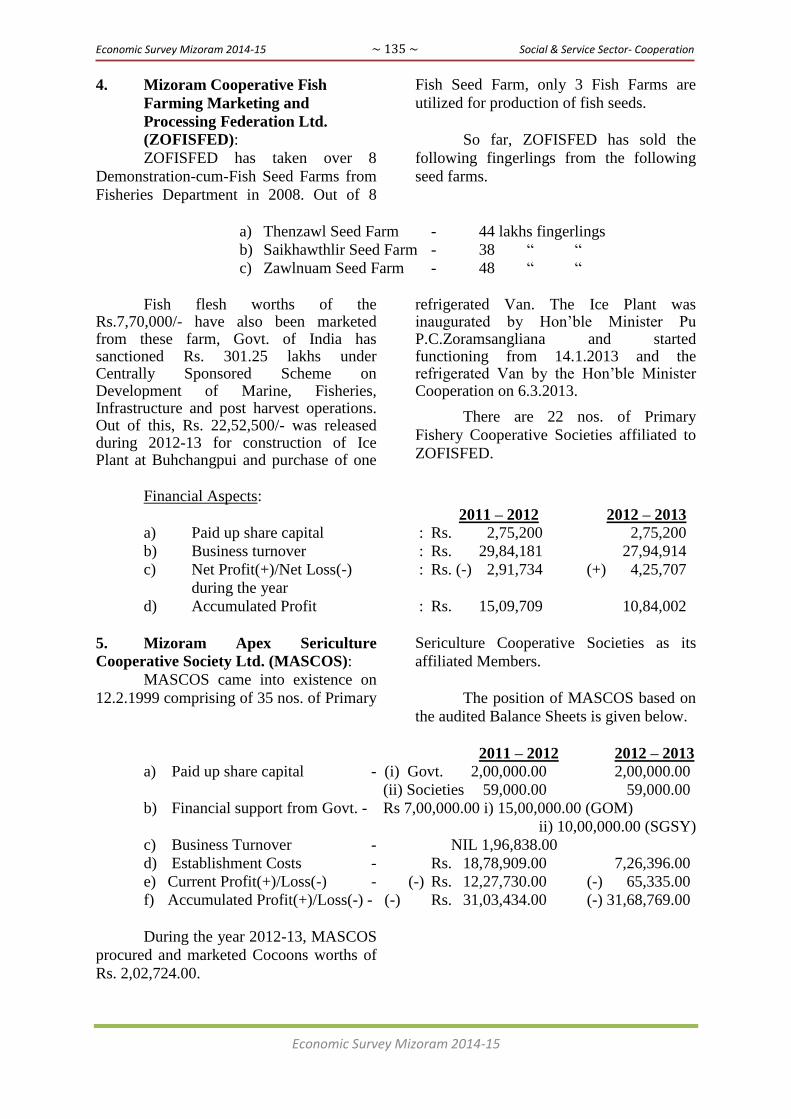
Economic Survey Mizoram 2014-15 ~ 135 ~ Social & Service Sector- Cooperation
Economic Survey Mizoram 2014-15
4. Mizoram Cooperative Fish
Farming Marketing and
Processing Federation Ltd.
(ZOFISFED):
ZOFISFED has taken over 8
Demonstration-cum-Fish Seed Farms from
Fisheries Department in 2008. Out of 8
Fish Seed Farm, only 3 Fish Farms are
utilized for production of fish seeds.
So far, ZOFISFED has sold the
following fingerlings from the following
seed farms.
a) Thenzawl Seed Farm - 44 lakhs fingerlings
b) Saikhawthlir Seed Farm - 38 ― ―
c) Zawlnuam Seed Farm - 48 ― ―
Fish flesh worths of the
Rs.7,70,000/- have also been marketed from these farm, Govt. of India has sanctioned Rs. 301.25 lakhs under Centrally Sponsored Scheme on Development of Marine, Fisheries, Infrastructure and post harvest operations. Out of this, Rs. 22,52,500/- was released during 2012-13 for construction of Ice Plant at Buhchangpui and purchase of one
refrigerated Van. The Ice Plant was inaugurated by Hon‘ble Minister Pu P.C.Zoramsangliana and started functioning from 14.1.2013 and the refrigerated Van by the Hon‘ble Minister Cooperation on 6.3.2013.
There are 22 nos. of Primary
Fishery Cooperative Societies affiliated to
ZOFISFED.
Financial Aspects:
2011 – 2012 2012 – 2013
a) Paid up share capital : Rs. 2,75,200 2,75,200
b) Business turnover : Rs. 29,84,181 27,94,914
c) Net Profit(+)/Net Loss(-) : Rs. (-) 2,91,734 (+) 4,25,707
during the year
d) Accumulated Profit : Rs. 15,09,709 10,84,002
5. Mizoram Apex Sericulture
Cooperative Society Ltd. (MASCOS):
MASCOS came into existence on
12.2.1999 comprising of 35 nos. of Primary
Sericulture Cooperative Societies as its
affiliated Members.
The position of MASCOS based on
the audited Balance Sheets is given below.
2011 – 2012 2012 – 2013
a) Paid up share capital - (i) Govt. 2,00,000.00 2,00,000.00
(ii) Societies 59,000.00 59,000.00
b) Financial support from Govt. - Rs 7,00,000.00 i) 15,00,000.00 (GOM)
ii) 10,00,000.00 (SGSY)
c) Business Turnover - NIL 1,96,838.00
d) Establishment Costs - Rs. 18,78,909.00 7,26,396.00
e) Current Profit(+)/Loss(-) - (-) Rs. 12,27,730.00 (-) 65,335.00
f) Accumulated Profit(+)/Loss(-) - (-) Rs. 31,03,434.00 (-) 31,68,769.00
During the year 2012-13, MASCOS
procured and marketed Cocoons worths of
Rs. 2,02,724.00.

Economic Survey Mizoram 2014-15 ~ 136 ~ Social & Service Sector- Cooperation
Economic Survey Mizoram 2014-15
6. Mizoram Women Cooperative
Federation Ltd. (WOMENFED):
WOMENFED was set up on the
17th
August 1995 with members comprising
of 26 nos. of Primary Women Cooperative
Societies. This Federation play vital role in
the economic upliftment of women by
imparting effective training on different
trades such tailoring, knitting and other
related activities. WOMENFED organized
Training Course on Tailoring and Knitting
from time to time as a result of which many
of the members are now becoming an
earners in their respective family. The
Federation also provides financial support
to the affiliated Primary Women
Cooperative Societies at low rate of interest
for creating enthusiasm among the
members and to generate income.
Position of WOMENFED for 2 years are of the followings: -
2011-2012 2012-2013
1 Paid up share capital:
a) Government Rs. 1,50,000 Rs. 1,50,000
b) Cooperative Societies Rs. 49,00 Rs. 49,000
2 No. of affiliated Coop. Societies 26 26
3 Business Turnover Rs. 36,915 Rs. 39,175
4 Operating Profit Rs. 53,413 Rs. 46,112
5 Accumulated Profit Rs. 64,336 Rs. 1,10,448
6 Audit Classification ‗C‘ Class ‗C‘ Class
7. Mizoram Pig Producers
Cooperative Federation Ltd.
(PIGFED):
PIGFED was registered on the 6th
June, 1989 and is now comprises of 154
Primary Piggery Cooperative Societies.
The process for strengthening the piggery
development programme rests with
PIGFED and is now running a pig breeding
farm at Thenzawl which produces quality
and high breed types of piglet. For further
improvement of the farm, the State
Government has sanctioned Rs. 20,00,000
to PIGFED in the form of Grant.
The position of PIGFED during the
last two years is given below: -
2011-2012 2012-2013
1 Paid up share capital:
a) Government Rs. 12,25,000 Rs. 12,25,000
b) Cooperative Societies Rs. 5,93,550 Rs. 6,27,550
2 No. of affiliated Coop. Societies 154 156
3 Business Turnover Rs. 47,89,405 Rs. 52,49,270
4 Operating Profit/Loss Rs.22,57,499(N/Loss) Rs.4,43,195(N/Loss)
5 Accumulated Profit Rs. 60,18,760 Rs. 55,75,564
6 Audit Classification ‗C‘ Class ‗C‘ Class
8. Mizoram State Cooperative
Marketing and Consumers
Federation Ltd. (MIZOFED):
MIZOFED came into being by the
amalgamation of the three erstwhile Apex
Cooperative Societies namely, Mizoram
Apex Marketing Coop. Society Ltd, the
Mizo Wholesale Cooperative Stores Ltd
and the Mizoram Cooperative Super
Market Ltd and was registered on
9.12.1981.
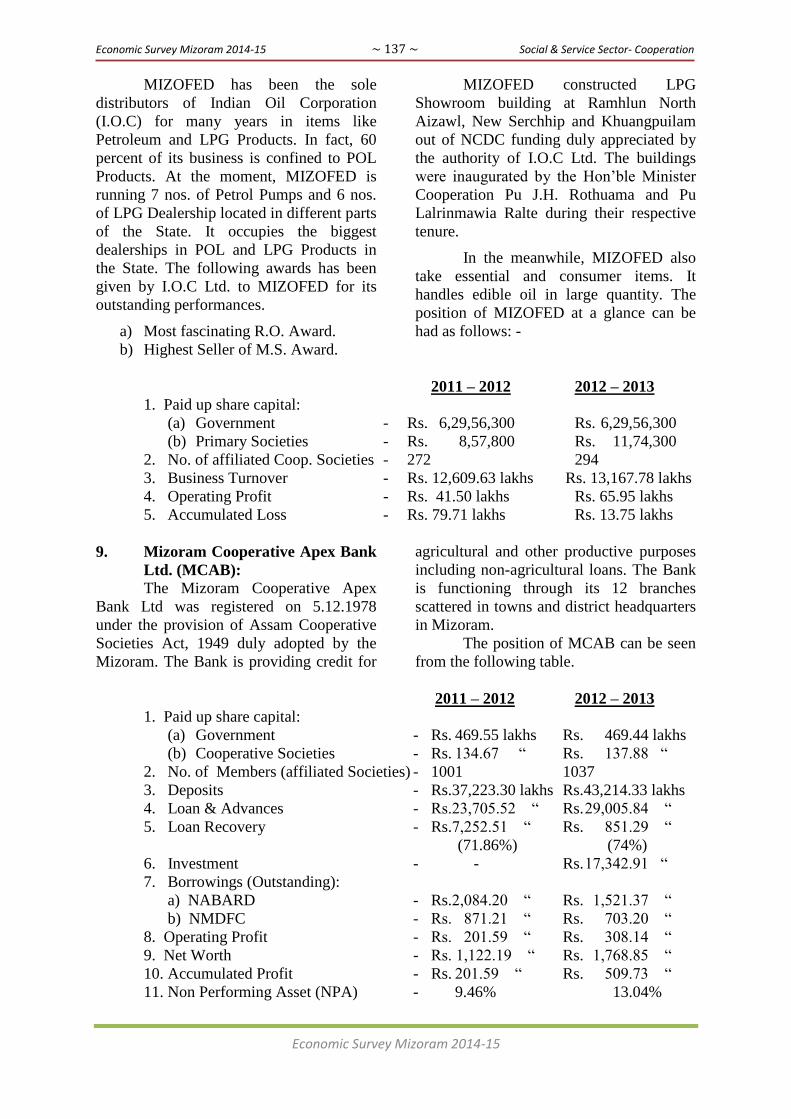
Economic Survey Mizoram 2014-15 ~ 137 ~ Social & Service Sector- Cooperation
Economic Survey Mizoram 2014-15
MIZOFED has been the sole
distributors of Indian Oil Corporation
(I.O.C) for many years in items like
Petroleum and LPG Products. In fact, 60
percent of its business is confined to POL
Products. At the moment, MIZOFED is
running 7 nos. of Petrol Pumps and 6 nos.
of LPG Dealership located in different parts
of the State. It occupies the biggest
dealerships in POL and LPG Products in
the State. The following awards has been
given by I.O.C Ltd. to MIZOFED for its
outstanding performances.
a) Most fascinating R.O. Award.
b) Highest Seller of M.S. Award.
MIZOFED constructed LPG
Showroom building at Ramhlun North
Aizawl, New Serchhip and Khuangpuilam
out of NCDC funding duly appreciated by
the authority of I.O.C Ltd. The buildings
were inaugurated by the Hon‘ble Minister
Cooperation Pu J.H. Rothuama and Pu
Lalrinmawia Ralte during their respective
tenure.
In the meanwhile, MIZOFED also
take essential and consumer items. It
handles edible oil in large quantity. The
position of MIZOFED at a glance can be
had as follows: -
2011 – 2012 2012 – 2013
1. Paid up share capital:
(a) Government - Rs. 6,29,56,300 Rs. 6,29,56,300
(b) Primary Societies - Rs. 8,57,800 Rs. 11,74,300
2. No. of affiliated Coop. Societies - 272 294
3. Business Turnover - Rs. 12,609.63 lakhs Rs. 13,167.78 lakhs
4. Operating Profit - Rs. 41.50 lakhs Rs. 65.95 lakhs
5. Accumulated Loss - Rs. 79.71 lakhs Rs. 13.75 lakhs
9. Mizoram Cooperative Apex Bank
Ltd. (MCAB):
The Mizoram Cooperative Apex
Bank Ltd was registered on 5.12.1978
under the provision of Assam Cooperative
Societies Act, 1949 duly adopted by the
Mizoram. The Bank is providing credit for
agricultural and other productive purposes
including non-agricultural loans. The Bank
is functioning through its 12 branches
scattered in towns and district headquarters
in Mizoram.
The position of MCAB can be seen
from the following table.
2011 – 2012 2012 – 2013
1. Paid up share capital:
(a) Government - Rs. 469.55 lakhs Rs. 469.44 lakhs
(b) Cooperative Societies - Rs. 134.67 ― Rs. 137.88 ―
2. No. of Members (affiliated Societies) - 1001 1037
3. Deposits - Rs.37,223.30 lakhs Rs.43,214.33 lakhs
4. Loan & Advances - Rs.23,705.52 ― Rs. 29,005.84 ―
5. Loan Recovery - Rs.7,252.51 ― Rs. 851.29 ―
(71.86%) (74%)
6. Investment - - Rs. 17,342.91 ―
7. Borrowings (Outstanding):
a) NABARD - Rs.2,084.20 ― Rs. 1,521.37 ―
b) NMDFC - Rs. 871.21 ― Rs. 703.20 ―
8. Operating Profit - Rs. 201.59 ― Rs. 308.14 ―
9. Net Worth - Rs. 1,122.19 ― Rs. 1,768.85 ―
10. Accumulated Profit - Rs. 201.59 ― Rs. 509.73 ―
11. Non Performing Asset (NPA) - 9.46% 13.04%

Economic Survey Mizoram 2014-15 ~ 138 ~ Social & Service Sector- Cooperation
Economic Survey Mizoram 2014-15
Over and above, the Bank has
purchased R.C.C Building with 4 storeys in
Tuikual South Aizawl at the cost of Rs.
3.20 crores wherein the entire Head Office
of the Bank with Officers and Staff are
being accommodated.
11. Mizoram Urban Cooperative
Development Bank Ltd. (MUCO Bank):
MUCO Bank Ltd was registered on
3rd
November, 1987 by the Registrar of
Cooperative Societies Mizoram under the
provision of Assam Cooperative Societies
Act, 1949 duly adopted by Mizoram.
MUCO Bank is a Primary Urban
Cooperative Bank and accordingly its
memberships comprise of only individual
Members and its area of operation confined
to only Aizawl District.
The position of the Bank for the last
two years may be seen from the following
table.
2011 – 2012 2012 – 2013
1. Paid up share capital:
(a) Government - Rs. 262.09 lakhs Rs. 262.90 lakhs
(b) Individuals - Rs. 73.97 ― Rs. 88.88 ―
2. Total Deposits - Rs. 2,969.62 ― Rs. 3,531.50 ―
3. Loan & Advances - Rs. 1,187.75 ― Rs. 1,731.53 ―
4. Investment - Rs. 1,792.00 ― Rs. 1,680.88 ―
5. NPA - Rs. 8.10 ― Rs. 38.33 ―
6. Operating Profit - Rs. 36.68 ― Rs. 36.36 ―
7. Accumulated Loss - Rs. 207.44 ― Rs. 171.08 ―
……
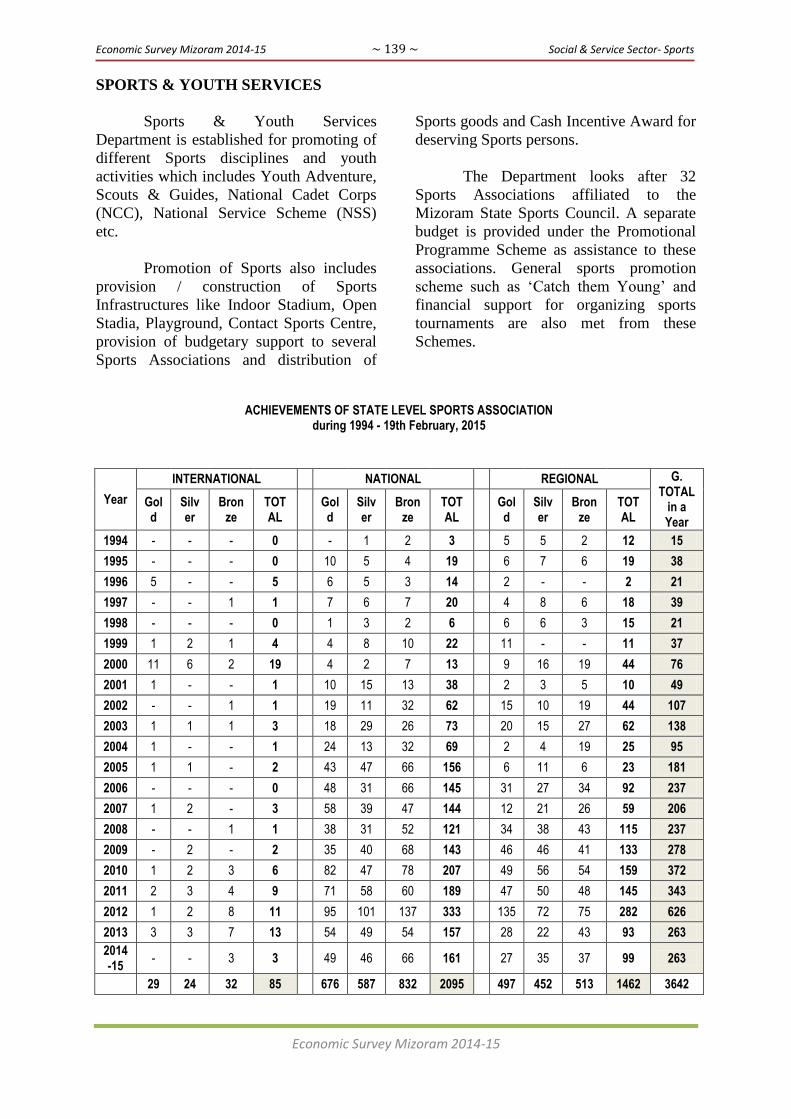
Economic Survey Mizoram 2014-15 ~ 139 ~ Social & Service Sector- Sports
Economic Survey Mizoram 2014-15
SPORTS & YOUTH SERVICES
Sports & Youth Services
Department is established for promoting of
different Sports disciplines and youth
activities which includes Youth Adventure,
Scouts & Guides, National Cadet Corps
(NCC), National Service Scheme (NSS)
etc.
Promotion of Sports also includes
provision / construction of Sports
Infrastructures like Indoor Stadium, Open
Stadia, Playground, Contact Sports Centre,
provision of budgetary support to several
Sports Associations and distribution of
Sports goods and Cash Incentive Award for
deserving Sports persons.
The Department looks after 32
Sports Associations affiliated to the
Mizoram State Sports Council. A separate
budget is provided under the Promotional
Programme Scheme as assistance to these
associations. General sports promotion
scheme such as ‗Catch them Young‘ and
financial support for organizing sports
tournaments are also met from these
Schemes.
ACHIEVEMENTS OF STATE LEVEL SPORTS ASSOCIATION during 1994 - 19th February, 2015
Year
INTERNATIONAL NATIONAL REGIONAL G. TOTAL
in a Year
Gold
Silver
Bronze
TOTAL
Gold
Silver
Bronze
TOTAL
Gold
Silver
Bronze
TOTAL
1994 - - - 0 - 1 2 3 5 5 2 12 15
1995 - - - 0 10 5 4 19 6 7 6 19 38
1996 5 - - 5 6 5 3 14 2 - - 2 21
1997 - - 1 1 7 6 7 20 4 8 6 18 39
1998 - - - 0 1 3 2 6 6 6 3 15 21
1999 1 2 1 4 4 8 10 22 11 - - 11 37
2000 11 6 2 19 4 2 7 13 9 16 19 44 76
2001 1 - - 1 10 15 13 38 2 3 5 10 49
2002 - - 1 1 19 11 32 62 15 10 19 44 107
2003 1 1 1 3 18 29 26 73 20 15 27 62 138
2004 1 - - 1 24 13 32 69 2 4 19 25 95
2005 1 1 - 2 43 47 66 156 6 11 6 23 181
2006 - - - 0 48 31 66 145 31 27 34 92 237
2007 1 2 - 3 58 39 47 144 12 21 26 59 206
2008 - - 1 1 38 31 52 121 34 38 43 115 237
2009 - 2 - 2 35 40 68 143 46 46 41 133 278
2010 1 2 3 6 82 47 78 207 49 56 54 159 372
2011 2 3 4 9 71 58 60 189 47 50 48 145 343
2012 1 2 8 11 95 101 137 333 135 72 75 282 626
2013 3 3 7 13 54 49 54 157 28 22 43 93 263
2014-15
- - 3 3 49 46 66 161 27 35 37 99 263
29 24 32 85 676 587 832 2095 497 452 513 1462 3642

Economic Survey Mizoram 2014-15 ~ 140 ~ Social & Service Sector- Sports
Economic Survey Mizoram 2014-15
The Government of Mizoram is
committed to train its sportspersons to
qualify for participation in the Olympic
2016. A special programme “Olympic
Vision 2016” has been launched in which
sportspersons are given special intensive
training in selected disciplines such as
Archery, Taekwondo, Table Tennis,
Boxing, Weightlifting, Judo, Badminton,
Shooting and Hockey. Results seen have so
far been very encouraging.
In the recently held Santosh trophy
Tournament at Siliguri, Mizoram Team
won the Championship title for the first
time in the history of Mizoram Football.
Santosh trophy is the highest National level
football tournament in the country.
Mizoram Football Team was the
Champion team in the recently held NEC
Dr. T.Ao Memorial Football Tournament at
Aizawl, Mizoram. The event was organized
by Sports & Youth Services Department in
collaboration with MFA and was funded by
North Eastern Council.
The Department contributes to the
development of young people in achieving
their full physical, intellectual and social-
economics potentials as individuals, to
guide and help them to be responsible
citizens and as members of the local and
national communities. These are achieved
through various sports programme and
establishment of youth welfare unit such as
National Cadet Corp, National Service
Schemes, Scouts & Guides and Youth
Adventure. Present strength of youth
enrolled under such units is given in the
table:
Unit Number of
enrollment
Main Activities
20 Mizoram Indep Coy,
NCC
1520 Imparting military way of life through training
activities
1 Mizo Bn NCC 1748 Imparting military way of life through training
activities
1 Mizo Air Sqn NCC 1768 Imparting military way of life through training
activities
National Service Schemes 23700 Cleanliness drive, Skills & vocational training,
blood donation among college students
Cubs & Bulbul 615 Imparting progressive self education through
training activities
Scouts & Guides 4500 Imparting progressive self education through
training activities
Rovers & Rangers 136 Imparting progressive self education through
training activities
Adventure 3500 Conducting Adventure training camp viz.
mountain climbing, rapelling, rafting, basic life
saving skills etc.
Total 37487
During the last few years a large
number of Sports Infrastructure are
constructed. Projects worth mentioning
which are already completed, ongoing and
in the pipeline are given in the table below.
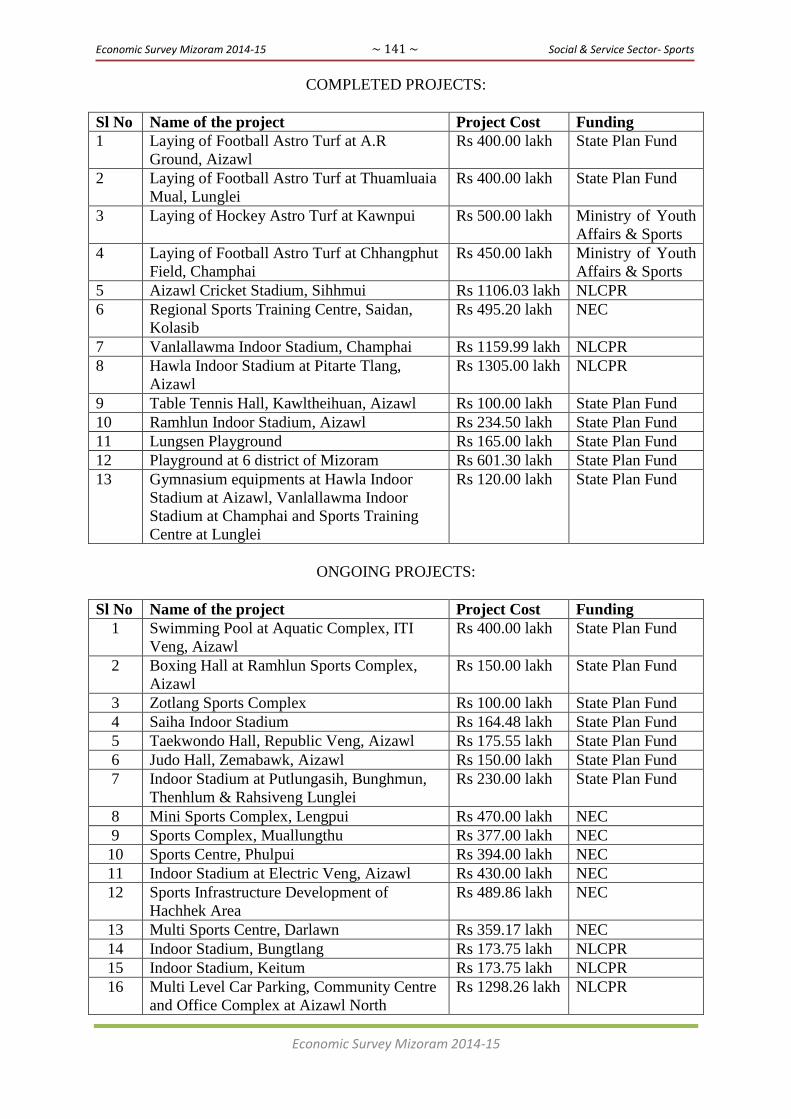
Economic Survey Mizoram 2014-15 ~ 141 ~ Social & Service Sector- Sports
Economic Survey Mizoram 2014-15
COMPLETED PROJECTS:
Sl No Name of the project Project Cost Funding
1 Laying of Football Astro Turf at A.R
Ground, Aizawl
Rs 400.00 lakh State Plan Fund
2 Laying of Football Astro Turf at Thuamluaia
Mual, Lunglei
Rs 400.00 lakh State Plan Fund
3 Laying of Hockey Astro Turf at Kawnpui Rs 500.00 lakh Ministry of Youth
Affairs & Sports
4 Laying of Football Astro Turf at Chhangphut
Field, Champhai
Rs 450.00 lakh Ministry of Youth
Affairs & Sports
5 Aizawl Cricket Stadium, Sihhmui Rs 1106.03 lakh NLCPR
6 Regional Sports Training Centre, Saidan,
Kolasib
Rs 495.20 lakh NEC
7 Vanlallawma Indoor Stadium, Champhai Rs 1159.99 lakh NLCPR
8 Hawla Indoor Stadium at Pitarte Tlang,
Aizawl
Rs 1305.00 lakh NLCPR
9 Table Tennis Hall, Kawltheihuan, Aizawl Rs 100.00 lakh State Plan Fund
10 Ramhlun Indoor Stadium, Aizawl Rs 234.50 lakh State Plan Fund
11 Lungsen Playground Rs 165.00 lakh State Plan Fund
12 Playground at 6 district of Mizoram Rs 601.30 lakh State Plan Fund
13 Gymnasium equipments at Hawla Indoor
Stadium at Aizawl, Vanlallawma Indoor
Stadium at Champhai and Sports Training
Centre at Lunglei
Rs 120.00 lakh State Plan Fund
ONGOING PROJECTS:
Sl No Name of the project Project Cost Funding
1 Swimming Pool at Aquatic Complex, ITI
Veng, Aizawl
Rs 400.00 lakh State Plan Fund
2 Boxing Hall at Ramhlun Sports Complex,
Aizawl
Rs 150.00 lakh State Plan Fund
3 Zotlang Sports Complex Rs 100.00 lakh State Plan Fund
4 Saiha Indoor Stadium Rs 164.48 lakh State Plan Fund
5 Taekwondo Hall, Republic Veng, Aizawl Rs 175.55 lakh State Plan Fund
6 Judo Hall, Zemabawk, Aizawl Rs 150.00 lakh State Plan Fund
7 Indoor Stadium at Putlungasih, Bunghmun,
Thenhlum & Rahsiveng Lunglei
Rs 230.00 lakh State Plan Fund
8 Mini Sports Complex, Lengpui Rs 470.00 lakh NEC
9 Sports Complex, Muallungthu Rs 377.00 lakh NEC
10 Sports Centre, Phulpui Rs 394.00 lakh NEC
11 Indoor Stadium at Electric Veng, Aizawl Rs 430.00 lakh NEC
12 Sports Infrastructure Development of
Hachhek Area
Rs 489.86 lakh NEC
13 Multi Sports Centre, Darlawn Rs 359.17 lakh NEC
14 Indoor Stadium, Bungtlang Rs 173.75 lakh NLCPR
15 Indoor Stadium, Keitum Rs 173.75 lakh NLCPR
16 Multi Level Car Parking, Community Centre
and Office Complex at Aizawl North
Rs 1298.26 lakh NLCPR
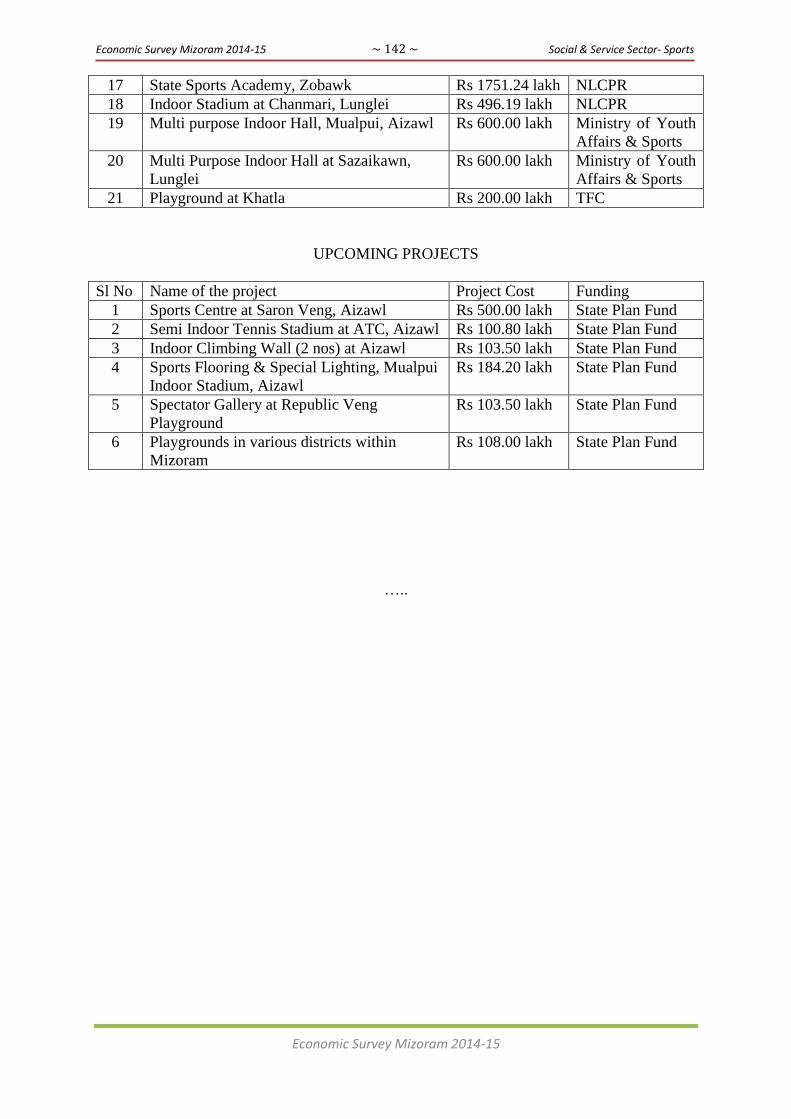
Economic Survey Mizoram 2014-15 ~ 142 ~ Social & Service Sector- Sports
Economic Survey Mizoram 2014-15
17 State Sports Academy, Zobawk Rs 1751.24 lakh NLCPR
18 Indoor Stadium at Chanmari, Lunglei Rs 496.19 lakh NLCPR
19 Multi purpose Indoor Hall, Mualpui, Aizawl Rs 600.00 lakh Ministry of Youth
Affairs & Sports
20 Multi Purpose Indoor Hall at Sazaikawn,
Lunglei
Rs 600.00 lakh Ministry of Youth
Affairs & Sports
21 Playground at Khatla Rs 200.00 lakh TFC
UPCOMING PROJECTS
Sl No Name of the project Project Cost Funding
1 Sports Centre at Saron Veng, Aizawl Rs 500.00 lakh State Plan Fund
2 Semi Indoor Tennis Stadium at ATC, Aizawl Rs 100.80 lakh State Plan Fund
3 Indoor Climbing Wall (2 nos) at Aizawl Rs 103.50 lakh State Plan Fund
4 Sports Flooring & Special Lighting, Mualpui
Indoor Stadium, Aizawl
Rs 184.20 lakh State Plan Fund
5 Spectator Gallery at Republic Veng
Playground
Rs 103.50 lakh State Plan Fund
6 Playgrounds in various districts within
Mizoram
Rs 108.00 lakh State Plan Fund
…..
Economic Survey Mizoram 2014-15 ~ 143 ~ Rural & Urban Development
Economic Survey Mizoram 2014-15
XIII. RURAL AND URBAN DEVELOPMENT
RURAL DEVELOPMENT
I. Sectoral Overview
The main objectives of the Rural
Development Department are to improve
the socio-economic conditions of the rural
community, to uplift the people living
below the poverty line by providing wage
employment, self employment through
income generating activities and also to
create permanent assets for strengthening
the rural infrastructure. Most of the
programmes implemented by the
Department are meant for poverty
alleviation, reduction of unemployment or
to give additional employment to enhance
livelihood security of the people living in
rural areas.
The various rural development
schemes undertaken by the Department are
broadly classified into the following
categories: -
1. SPECIAL PROGRAMMES FOR
RURAL DEVELOPMENT (SPRD) 1) State Level Monitoring Cell and
Internal Audit Cell
2) Administration of Rural
Development Programmes (ARDP)
3) State Institute of Rural
Development (SIRD)
4) DRDA Administration
5) Integrated Wasteland Development
Programme (IWDP)/Hariyali
6) Integrated Watershed Management
Programme (IWMP):
7) Swarnjayanti Gram Swarozgar
Yojana (SGSY)
8) National Rural Livelihoods Mission
(NRLM)
2. RURAL EMPLOYMENT
National programmes-
1) Indira Awaas Yojana (IAY)
2) Mahatma Gandhi National Rural
Employment Guarantee Scheme
3. OTHER RURAL DEVELOPMENT
PROGRAMMES (ORDP)
1) Direction and Block Level
Administration
4. OTHER SPECIAL AREAS
PROGRAMMES (OSAP) 1) Backward Region Grant Fund
(BRGF)
2) Border Area Development
Programme (BADP)
5. CAPITAL OUTLAY ON OTHER
RURAL DEVELOPMENT
PROGRAMMES
1) Social Education
2) Housing for Project Staff
3) Distribution of GCI roofs
II. Department‟s Contribution in the
Economy (Role of the Sector)
1. SPECIAL PROGRAMMES FOR
RURAL DEVELOPMENT (SPRD)
a) State Level Monitoring Cell
and Internal Audit Cell
The main function of the State Level
Monitoring Cell & Internal Audit Cell
(SLMC & IAC) is to monitor the
implementation of various Centrally
Sponsored Schemes like NREGA, SGSY,
IWDP, IAY, etc implemented by Rural
Development Department. It also audits the
accounts of the District Rural Development
Agencies (DRDAs) and RD Block Offices.
It scrutinizes proposals for release of
sanctions under various Centrally
Sponsored Schemes (CSS) and examines
reports and returns received from the
DRDAs for onward submission to the
Ministry of Rural Development, Govt. of
India. Moreover, it gives guidance to the
DRDAs in the implementation of the
various rural development schemes
sponsored by the Central Government.

Economic Survey Mizoram 2014-15 ~ 144 ~ Rural & Urban Development
Economic Survey Mizoram 2014-15
b) State Institute of Rural
Development (SIRD)
The main function of State Institute
of Rural Development (SIRD) is to impart
training in the field of Rural Development
to Rural Development functionaries at
State, Districts, Block and Village levels to
enable them to carry out their mandate for
the effective planning and implementation
of various poverty alleviation programmes.
2(two) Extension Training Centres (ETC)
of SIRD were established at Pukpui in 2003
and Thingsulthliah in 2007 to enhance the
functioning of SIRD.
The State Institute for Rural
Development (SIRD) is funded by
Government of India and the State
Government in the ratio of 90:10.
c) Integrated Wasteland
Development Programme
(IWDP)/Hariyali
IWDP aims at an integrated
development of wasteland/degraded lands
based on village/micro watershed plans.
These plans are prepared by the Watershed
Associations/Watershed Committees and
Gram Panchayats/Village Councils (under
Hariyali Guidelines) with the technical
guidance of the Watershed Development
Teams of the Project Implementation
Agencies (PIAs) after taking into
consideration the land capability, site
condition and local needs of the people.
There are 52 projects in Mizoram,
out of which 17 are IWDP (pre-Hariyali)
projects and 35 are Hariyali projects. 6
overdue projects were closed during 2009-
2010 and 13 projects are expected to be
completed during the current financial year.
All the remaining projects have been
completed during 2014-2015.
d) Integrated Watershed
Management Prog. (IWMP): The main objectives of IWMP are to
restore ecological balance by harnessing,
conserving and developing natural
resources such as soil, vegetative cover and
water, while at the same time, providing
sustainable livelihood options to the people
residing in the watershed area. The
expected outcomes are prevention of soil
run off, regeneration of natural vegetation,
rain water harvesting, recharging of the
ground water table, multi-cropping and
introduction of diverse agro-based
activities, which help to provide sustainable
livelihoods to the people residing in the
watershed area. This Programme is
expected to boost productivity and income
of rural households. The project costs are to
be shared between the Centre and the State
on 90:10 ratio. There are 89 Projects
covering 3.74 lakhs Hectares within the
state spanning through all the 8 districts.
The total Project cost for these 89
sanctioned projects is Rs.56,087.250 lakhs.
e) National Rural Livelihoods
Mission (NRLM):
The main objective of the National
Rural Livelihood Mission (NRLM) is
similar to that of the SGSY. A systematic
review of SGSY has brought into focus
certain shortcomings and the impact is not
found to be that significant. In this
background, the Central Government has
approved the restructuring of SGSY as
National Rural Livelihoods Mission
(NRLM). The scheme is being
implemented in a mission mode across the
country. In Mizoram, NRLM is
implemented through MzSRLM headed by
State Mission Director.
2. RURAL EMPLOYMENT
National programmes -
a) Indira Awaas Yojana (IAY)
The objective of IAY is to provide
financial assistance for construction and
upgradation of houses to rural households
living below the Poverty Line. The quantum
of financial assistance provided for
construction of a new dwelling unit is
Rs.48,500/- which is enhanced to
Rs.75,000/- and for upgradation of an
existing house is Rs.15,000/- per unit, in
hilly/difficult areas. This Scheme is funded
Economic Survey Mizoram 2014-15 ~ 145 ~ Rural & Urban Development
Economic Survey Mizoram 2014-15
on a ratio of 90:10 by the Centre and the
State respectively.
The Annual Physical target under
IAY is fixed by the Ministry of Rural
Development and funds are released
accordingly in installments.
b) Mahatma Gandhi National
Rural Employment Guarantee
Scheme
The objective of this Scheme is to
provide at least 100 days of wage
employment in a financial year to every
household whose unemployed adult
members are willing to do unskilled manual
labour. The funding pattern of MGNREGS
is 90:10 between the Centre and the State
respectively. The entire cost of wages for
unskilled manual workers is paid by the
Central Government.
3. OTHER RURAL DEVELOPMENT
PROGRAMMES (ORDP)
a) Direction and Block Level
Administration
Rural Development Blocks are the
grassroots delivery points of rural
development programmes, for which Rural
Development Block Offices and
functionaries need to be maintained
efficiently. Mizoram has one directorate
having 26 Blocks with 26 Block
Development Officers and about 400 staff
of various categories working in these
blocks. The provision of funds for their
salary, wages, T.E., O.E., Medical
treatment, advertisements, publications, and
other charges like expenditures on
maintenance of vehicles and POL are met
from this head.
4. OTHER SPECIAL AREAS
PROGRAMMES (OSAP)
a) Backward Region Grant Fund
(BRGF)
The Backward Region Grant Fund is
designed to redress regional imbalances in
development. The Government of India
identified two districts i.e. Lawngtlai and
Saiha for the implementation of BRGF in
Mizoram.
b) Border Area Development
Programme (BADP) This Programme is wholly funded
by the Ministry of Home Affairs,
Department of Border Management,
Government of India. The main objective of
BADP is to meet the special development
needs of the people living in remote and
inaccessible areas situated near the
international border and to bridge the gaps
in the physical and social infrastructure of
such areas. The aim is to transform the
border areas by ensuring multifaceted
development and to saturate the border
areas with the entire essential infrastructure
through convergence of Schemes and
participatory approach. This Programme is
implemented in villages situated near the
international border viz. Indo-Bangladesh
border and Indo-Myanmar border. Priority
is to be given to villages/areas situated
within 0-10 km of the international border,
and only after saturating these areas,
villages located deeper inside are to be
taken up.
5. CAPITAL OUTLAY ON OTHER
RURAL DEV. PROGRAMMES
a) Social Education
The main objective of Social
Education Scheme is to create durable
assets of public utility and civic
infrastructure which are genuinely needed
by the society, thereby creating rapport
within the community, forging closer ties
among the people and facilitating their
socio-economic development. Such assets
created under this scheme should be
accessible to all members of society. During
the last five years, 94 community halls and
7 play grounds have been constructed and
completed while there are still 67 on-going
works at various places of the state under
this scheme.
b) Housing for Project Staff Construction, repair and
maintenance of offices and staff quarters in
Economic Survey Mizoram 2014-15 ~ 146 ~ Rural & Urban Development
Economic Survey Mizoram 2014-15
26 Rural Development Blocks are taken up
under this Scheme.
There are 26 RD Blocks under Rural
Development Department with more than
200 officers and staff running offices
throughout the state. There are cases like
Tlangnuam RD Block, the first and
foremost created RD Block in the state in
the year 1953 which does not have office
building of their own till date and have to
run office in a rented building. Likewise,
there are many RD Blocks without their
own office buildings or where the buildings
and staff quarters are more than 10 to 15
years old and badly needing
maintenance/repairs or need to be wholly
reconstructed. During the last five years,
169 quarters/offices have been
constructed/renovated.
5.3 Distribution of GCI roofs
Distribution of GCI sheets for
roofing was introduced during the 11th
Plan
period in the year 2010-2011 by the State
Government.
As per proposed action plan, each
selected household will be provided with
4(four) bundles of GCI sheets. This will
help in providing of quality roofing to the
rural households and also in harvesting rain
water so that the daily living condition will
be improved.
III. Activities of the Department in the
current fiscal year:
Information relating to Annual Budget
2015-16
1. Achievement of Rural Development Department durng 2014-15 (Rs. in lakh)
Sl.
No. Head of Development
Budgetary allocation during
2014-15
Financial Achievement (as on
31.12.2014)
Physical
Achieve-
ment (as
on
31.12.14) Central State Total
Central
Released
State
Released Total
1 2 3 4 5 6 7 8 9
1 North Eastern
Council (NEC)
i Irrigation & Flood
Control at Ngopa
0.00 0.00 0.00 0.00 0.00 0.00 73.42%
ii Aloe vera Plantation at
Chhanchhuahna
Khawpui
160.00 0.00 160.00 0.00 0.00 0.00 NA
2 Central Pool of
Resources for North
East & Sikkim
(NLCPR)
0.00 0.00 0.00 0.00 0.00 0.00 NA
3 Special Central Assistance (SCA)-untied
i SLMC & IAC 0.00 15.00 15.00 0.00 14.27 14.27 Salary
etc. of 13
Staff
ii Special Prog. for
Rural Dev. (SPRD)
DRDA Admin. 39.00 0.00 39.00 0.00 0.00 0.00 Salary
etc. of
192 staff
SIRD
iii Other Rural Dev.
Prog. (ORDP)
Direction & Admn 0.00 73.55 73.55 0.00 238.00 238.00 Salary
etc. of
110 staff BLA 0.00 166.65 166.65 0.00
Social Education 0.00 0.00 0.00 0.00 0.00 0.00 NA

Economic Survey Mizoram 2014-15 ~ 147 ~ Rural & Urban Development
Economic Survey Mizoram 2014-15
Rural Housing-Dist. of
GCI Sheet
0.00 0.00 0.00 0.00 0.00 0.00 NA
ARDP 0.00 80.00 80.00 0.00 71.00 71.00 Salary of
27 staff
Sub-Total 199.00 335.20 534.20 0.00 323.27 323.27
i Backward Region
Grant Fund (BRGF)
2,812.00 0.00 2,812.00 0.00 0.00 0.00 NIL
ii Intergrated Watersdhed
Management
Programme (IWMP)
7,696.18 0.00 7,696.18 115.18 0.00 115.18 NIL
iii Indira Awaaz Yojana
(IAY)
908.00 0.00 908.00 453.84 0.00 453.84 410
houses
const.
Mahatma Gandhi
National Rural
Employment Guarantee
Act (MGNREGA)
22,462.00 225.00 22,687.00 6,708.13 225.00 6,933.13 24.377
lakh
mandays
National Rural
Livelihood Mission
32.00 0.00 32.00 32.00 0.00 32.00 458
SHGs
Sub-Total 33,910.18 225.00 34,135.18 7,309.15 225.00 7,534.15
C CSS-Other Scheme
i Border Area
Development
Programme (BADP)
4,017.00 0.00 4,017.00 418.02 0.00 418.02 77 nos of
works
done
Sub-Total 4,017.00 0.00 4,017.00 418.02 0.00 418.02
Grant-Total 38,126.18 560.20 38,686.38 7,727.17 548.27 8,275.44
IV. Expected outcome (Projected achievement for 2015-16)
Information relating to Annual Budget 2015-16
2. Projected Achievement of RD Department durng 2015-16
(Rs. in lakh)
Sl.
No. Head of Development
Projected Financial Achievement for
2015-16 Projected
Physical
Achievement Central
Released
State
Released Total
1 2 3 4 5 6
1 North Eastern Council (NEC)
i Irrigation & Flood Control at
Ngopa
115.00 0.00 115.00 1 project
ii Aloe vera Plantation at
Chhanchhuahna Khawpui
0.00 0.00 0.00 NA
2 Central Pool of resources for North
East & Sikkim (NLCPR)
0.00 0.00 0.00 NA
3 Special Central Assistance
(SCA)-untied
i SLMC & IAC 0.00 30.00 30.00 Salary of 13 staff
ii Special Programme for Rural
Development (SPRD)
DRDA Admin. 631.00 70.00 701.00 Salary of 192
staff
SIRD 360.00 40.00 400.00 110 nos of
training

Economic Survey Mizoram 2014-15 ~ 148 ~ Rural & Urban Development
Economic Survey Mizoram 2014-15
Sl.
No. Head of Development
Projected Financial Achievement for
2015-16 Projected
Physical
Achievement Central
Released
State
Released Total
1 2 3 4 5 6
iii Other Rural Development
Programme (ORDP)
Direction & Admn 0.00 570.00 570.00 Salary etc. of 110
no of staff BLA
Social Education
Rural Housing-Dist. of GCI Sheet
ARDP 0.00 110.00 110.00 Salary etc of 27
no of staff
Sub-Total 1,106.00 820.00 1,926.00
i Backward region Grant Fund
(BRGF)
3,093.00 0.00 3,093.00 630 nos of works
ii Intergrated Watershed Management
Programme (IWMP)
14,091.00 1,566.00 15,657.00 100 Projects (89
existing plus 11
new Projects to
be taken up)
iii Indira Awaaz Yojana (IAY) 999.00 111.00 1,110.00 to be finalised by
GOI
Mahatma Gandhi National Rural
Employment Guarantee Act
(MGNREGA)
24,708.00 2,574.00 27,282.00 to be fixed after
finalisation of LB
National Rural Livelihood Mission 257.00 29.00 286.00 to be fixed after
finalisation of LB
Sub-Total 43,148.00 4,280.00 47,428.00
C CSS-Other Scheme
i Border Area Development
Programme (BADP)
4,418.00 0.00 4,418.00 615 nos of works
Sub-Total 4,418.00 0.00 4,418.00
Grant-Total 48,672.00 5,100.00 53,772.00
Physical & Financial Achievement for the last two years (2012-13 & 2013-14)
(Rs. in lakh)
Sl.
No. Item
2012-2013 Physi-
cal
achieve-
ment
2013-2014 Physical
achiev-
ement Central State Total Central State Total
A Block Grants
1 North Eastern
Council (NEC)
i Irrigation & Flood
Control at Ngopa
111.12 0.00 111.12 1 Project 0.00 0.00 0.00 NA
ii Aloe vera
Plantation at
Chhanchhuahna
Khawpui
0.00 0.00 0.00 NA 0.00 0.00 0.00 NA
2 Central Pool of
Resources for
North East &
Sikkim (NLCPR)
43.60 0.00 43.60 25
C/Hall
60.17 0.00 60.17 25
C/Hall

Economic Survey Mizoram 2014-15 ~ 149 ~ Rural & Urban Development
Economic Survey Mizoram 2014-15
3 Special Central
Assistance (SCA)-
untied
i SLMC & IAC 0.00 22.50 22.50 13 staff 0.00 12.26 12.26 13 staff
ii Special Prog. for
Rural Dev.
(SPRD)
DRDA Admin. 0.00 90.90 90.90 192 staff
SIRD 105.11 52.00 52.00 99
trainings
124.47 35.00 159.47 103
trainings
iii Other Rural Dev.
Prog. (ORDP)
Direction & Admn 0.00 136.60 136.60 110 staff
0.00 135.97 135.97 110 staff
BLA 0.00 299.80 299.80 0.00 304.90 304.90
Social Education 0.00 10.00 10.00 2 nos of
works
0.00 305.00 305.00 87 nos of
works
Housing for Project
Staff
0.00 0.00 0.00 0.00 0.00 50.00 50.00 1 no of
work
Rural Housing-Dist.
Of GCI Sheet
0.00 399.90 399.90 12545
bundles
0.00 49.95 49.95 1175
bundles
ARDP 0.00 97.70 97.70 27 staff 0.00 97.58 97.58 27 staff
Sub-Total 259.83 1,109.40 1,264.12 184.64 990.67 1,175.31
B CSS-Flagship
programme
i Backward region
Grant Fund (BRGF)
1,916.00 0.00 1,916.00 1354
works
2,562.00 0.00 2,562.00 509
works
ii Intergrated
Watershed
Management Prog.
(IWMP)
1,643.84 145.00 1,788.84 15
Projects
6,917.38 931.34 7,848.72 14
Projects
iii Indira Awaaz
Yojana (IAY)
1,127.32 125.26 1,252.58 1636
houses
construct
ed
2,570.02 286.83 2,856.85 3678
houses
construct
ed
Mahatma Gandhi
National Rural
Employment
Guarantee Act
(MGNREGA)
32,956.72 2,995.00 35,951.72 127.42
lakh
person-
days
25,530.14 1,194.69 26,724.84 138.46
lakh
person-
days
National Rural
Livelihood Mission 140.48 0.00 140.48
282.86 37.39 320.25 446
SHGs
Sub-Total 37,784.36 3,265.26 41,049.62 37,862.40 2,450.25 40,312.66
C CSS-Other
Scheme
i Border Area Dev.
Prog. (BADP)
4,154.73 0.00 4,154.73 548
works
3,977.33 0.00 3,977.33 588
works
Sub-Total 4,154.73 0.00 4,154.73 3,977.33 0.00 3,977.33
Grant-Total 42,198.92 4,374.66 46,468.47 42,024.37 3,440.92 45,465.30
I. Policy Constraint/ Solution/
Suggestion:
1. With the exception of BADP and
BRGF (which are 100% funded schemes of
the Central Government) and Mahatma
Gandhi National Rural Employment
Guarantee Scheme (which is funded in the
ratio of 89.583:10.417) all other CSS
programmes are funded in the ratio of
90:10. Mizoram being a resource-starved
State, the State Government always has a
problem in releasing the state matching
share whenever funds under various CSS
programmes are released by the Central
Government. Since non-release of the State
Matching share affects the subsequent

Economic Survey Mizoram 2014-15 ~ 150 ~ Rural & Urban Development
Economic Survey Mizoram 2014-15
release of the next instalment of the Central
share, the flow of fund gets disrupted which
in turn causes change reaction thus
hampering the progress and execution of
the works. The works to be implemented
under various schemes are mostly ‗working
season based‘ and for this reason it is
imperative for the successful
implementation of our programmes that
funds are always released on time.
2. No allocation was made for State
Plan Funded Schemes like Housing for
Project Staff (HPS), Social Education and
Rural Housing Scheme (RHS) during 2014-
15. These schemes are of utmost benefit to
the public and to the Department in
achieving its goals in rural areas. Hence, it
is felt necessary to allocate fund in these
head of development in future Plans.
3. CSS fund which were directly
released by the Government of India to the
Department have now been routed through
the overall State Plan Budget. This is
becoming a bottleneck of the Department as
timely implementation of the scheme as per
the DPR has been delayed due to procedural
formalities. Reverting back to status quo
ante is desirable for the successful
implementation of the CSS schemes.
…..
Economic Survey Mizoram 2014-15 ~ 151 ~ Rural & Urban Development
Economic Survey Mizoram 2014-15
URBAN DEVELOPMENT & POVERTY ALLEVIATION
I. Sectoral Overview
The Department had been
implementing the nation-wide mission of
the ‗Jawaharlal Nehru National Urban
Renewal Mission (JNNURM)‘ for urban
renewal and development. Other Central
Programmes like SJSRY/NULM for urban
poverty alleviation, Rajiv Rinn Yojana
(RRY) for housing the urban poor with
interest subvention by the government, etc.
are also implemented. The special
provision of 10% Gross Budgetary Support
for NER in respect of the 2 Ministries of
Urban Development and the Housing &
Urban Poverty Alleviation had also been
implemented on a big scale for creation of
critical urban infrastructure. The Scheme of
‗Rajiv Awas Yojana (RAY)‘ for provision
of housing stock to the Slum-Dwellers has
been taken up for from 2011-12 and
implementation will take up during the 12th
Five-year Plan in a big scale.
Besides, the existing scheme of
SJSRY had been revamped and enlarged in
the name of ‗National Urban Livelihood
Mission (NULM)‘ as a 12th
Plan Scheme to
address the poverty in urban areas in a
mission-mode approach. Further, the Asian
Development Bank (ADB) assisted project
of ‗North-Eastern Region Urban
Development Project (NERUDP)‘ had been
implemented in Aizawl City by a separate
wing of SIPMIU for critical city
infrastructure and various institutional
development activities. The Department
has also been charged with issues of Urban
Sanitation & Solid Waste Management,
Town & Country Planning and
Municipalities. The Department also
implements various schemes within the
State‘s Annual Plan under Minor Works for
urban infrastructure development activities.
The Department has the agencies and
parastatal such as the Aizawl Development
Authority, Aizawl Municipal Council.
Employment opportunity creations
out of various schemes implemented by the
Department such as skill development
training especially through SJSRY/NULM,
JNNURM/RAY and 12000 beneficiaries
are so far benefit various training since
inception of the programme.
Sources of fund/capital comes
mainly from State Government by way of
yearly allocation of Plan Fund Most of the
capital for activities/programmes
undertaken by the Department comes
directly from Central Government by way
of Grant under 10% GBS for NER,
Additional Central Assistance through State
Government like JNNURM/RAY, SPA and
SCA. Another Capital investment of the
State received from ADB loan for
NERUDP which is operated by SIPMIU
under UD&PA Department.
II. Department‟s contribution in the
economy (Role of the Sector)
It is now accepted worldwide that
Urban Centres are engines of growth of the
economy. Major economic activities,
particularly the service sectors, which
contributes a major portion of the country‘s
Gross Domestic Product mainly come from
urban area. Besides, the manufacturing
sector also trend to centre around cities and
towns. Thus the Government of India and
the State Government are now giving
emphasis on various issues for urban
development, and alleviation of urban
poverty.
The Department‘s efforts in
building up Urban infrastructure and Urban
management take the following forms: -
1. Question of basic infrastructure on
water supply, sewerage and
sanitation, Roads and transport,
markets, etc. through the Scheme of
JNNURM, 10% Lump-sum Grant
for NER, State‘s Annual Plan
(Special Project)
2. Urban Sanitation, Cleanliness &
Solid Waste Management,
Networks through State Annual

Economic Survey Mizoram 2014-15 ~ 152 ~ Rural & Urban Development
Economic Survey Mizoram 2014-15
Plan, and Asian Development
Bank-Assisted NERCCDIP.
The effort towards
alleviation of poverty and provision
of basic services for Urban Poor
takes the following forms: -
1) Provision of Housing for
EWS Families through the Scheme
of JNNURM (BSUP & IHSDP)
2) Provision of Housing and
Slum Up gradation through the
Scheme of RAY, Housing for All
and RRY
3) Economic Empowerment of
Urban Poor through Skill Training
initiative and Self Employment
Programme through the Scheme of
National Urban Livelihood Mission
(NULM).
These initiatives taken
together contributed to the economy
by providing Urban Infrastructure
for growth and development of
economy. Further the poverty
alleviation programmes, enable
empowerment activities, resulting in
their economic improvement.
Lastly, the huge shortfall of housing
stock in Urban Areas is slowly
addressed through government‘s
intervention to achieve the ultimate
aim of Housing for All.
III. Activities of the Department in
the current fiscal year
The following show the abstract of
Financial Achievement during the year
2014-15:
Rs in lakh
Sl.
No. HEAD
Re-
Allocation Addl.
Total
Fund
Available
Anticipated
Expenditure
during
2014 – 2015
1 2 3 4 5 6
1 Dir & Admn.
a) Salaries 183.00 183.00 183.00
b) Wages 80.28 80.28 80.28
c) Other Establishment Cost 57.76 1.00 58.76 58.76
Sub Total 321.04 1.00 322.04 322.04
2 Plan Scheme CSS, SPA (Earmark)
a) JNNURM 8193.00 8193.00 8193.00
b) RAY
c) NERCCDIP / EAP 6175.00 6175.00 6175.00
d) National Urban Livelihood
Mission 1307.00 1307.00 1307.00
e) New Land Use Policy 1334.00 1334.00 1334.00
f) 10% Lumpsum Grants 960.60 960.60 960.60
g) Incentive award under JNNURM 5.00 5.00 5.00
h) Special Plan Assistance 3100.00 3100.00 3100.00
i) Solar city 0.00 0.00 0.00
Sub Total 20109.00 965.60 21074.60 21074.60
3 SMS required scheme
a) SMS for JNNURM 0.00 0.00 0.00
b) SMS for RAY
c) SMS for NULM 38.96 38.96 38.96
d) SMS for 10% Lumpsum Grants 0.00 0.00 0.00
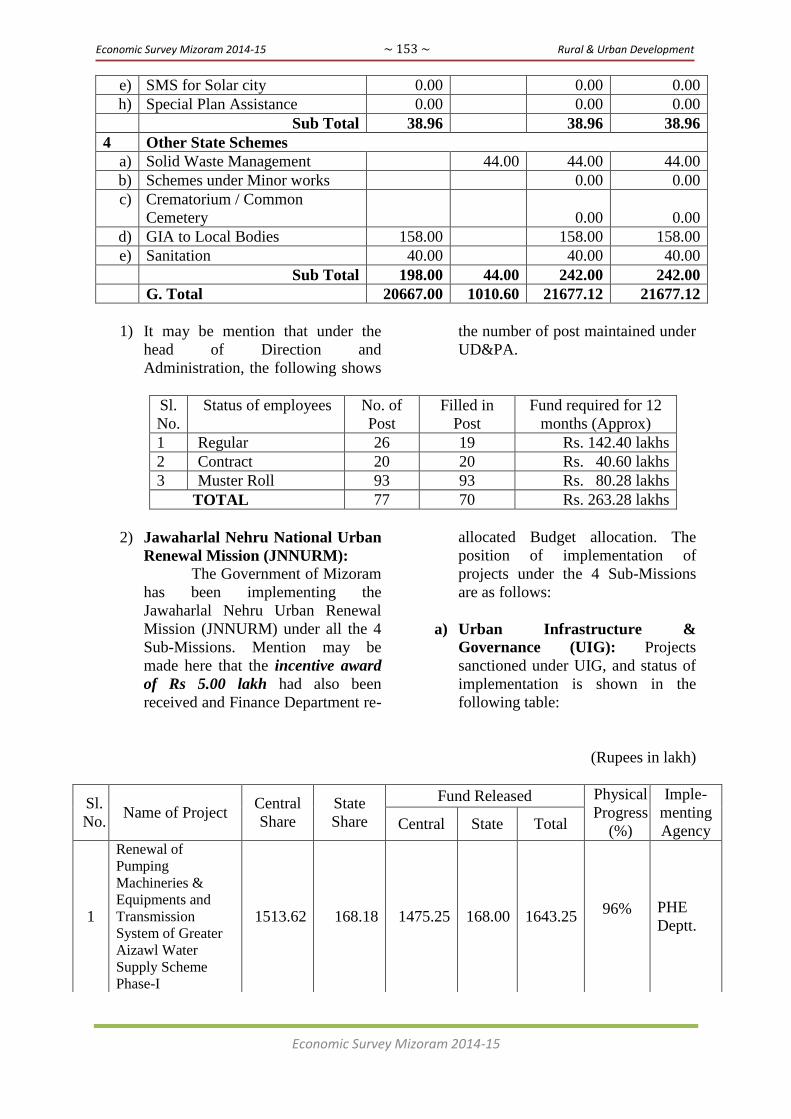
Economic Survey Mizoram 2014-15 ~ 153 ~ Rural & Urban Development
Economic Survey Mizoram 2014-15
e) SMS for Solar city 0.00 0.00 0.00
h) Special Plan Assistance 0.00 0.00 0.00
Sub Total 38.96 38.96 38.96
4 Other State Schemes
a) Solid Waste Management 44.00 44.00 44.00
b) Schemes under Minor works 0.00 0.00
c) Crematorium / Common
Cemetery 0.00 0.00
d) GIA to Local Bodies 158.00 158.00 158.00
e) Sanitation 40.00 40.00 40.00
Sub Total 198.00 44.00 242.00 242.00
G. Total 20667.00 1010.60 21677.12 21677.12
1) It may be mention that under the
head of Direction and
Administration, the following shows
the number of post maintained under
UD&PA.
Sl.
No.
Status of employees No. of
Post
Filled in
Post
Fund required for 12
months (Approx)
1 Regular 26 19 Rs. 142.40 lakhs
2 Contract 20 20 Rs. 40.60 lakhs
3 Muster Roll 93 93 Rs. 80.28 lakhs
TOTAL 77 70 Rs. 263.28 lakhs
2) Jawaharlal Nehru National Urban
Renewal Mission (JNNURM): The Government of Mizoram
has been implementing the
Jawaharlal Nehru Urban Renewal
Mission (JNNURM) under all the 4
Sub-Missions. Mention may be
made here that the incentive award
of Rs 5.00 lakh had also been
received and Finance Department re-
allocated Budget allocation. The
position of implementation of
projects under the 4 Sub-Missions
are as follows:
a) Urban Infrastructure &
Governance (UIG): Projects
sanctioned under UIG, and status of
implementation is shown in the
following table:
(Rupees in lakh)
Sl.
No. Name of Project
Central
Share
State
Share
Fund Released Physical
Progress
(%)
Imple-
menting
Agency Central State Total
1
Renewal of
Pumping
Machineries &
Equipments and
Transmission
System of Greater
Aizawl Water
Supply Scheme
Phase-I
1513.62 168.18 1475.25 168.00 1643.25 96% PHE
Deptt.
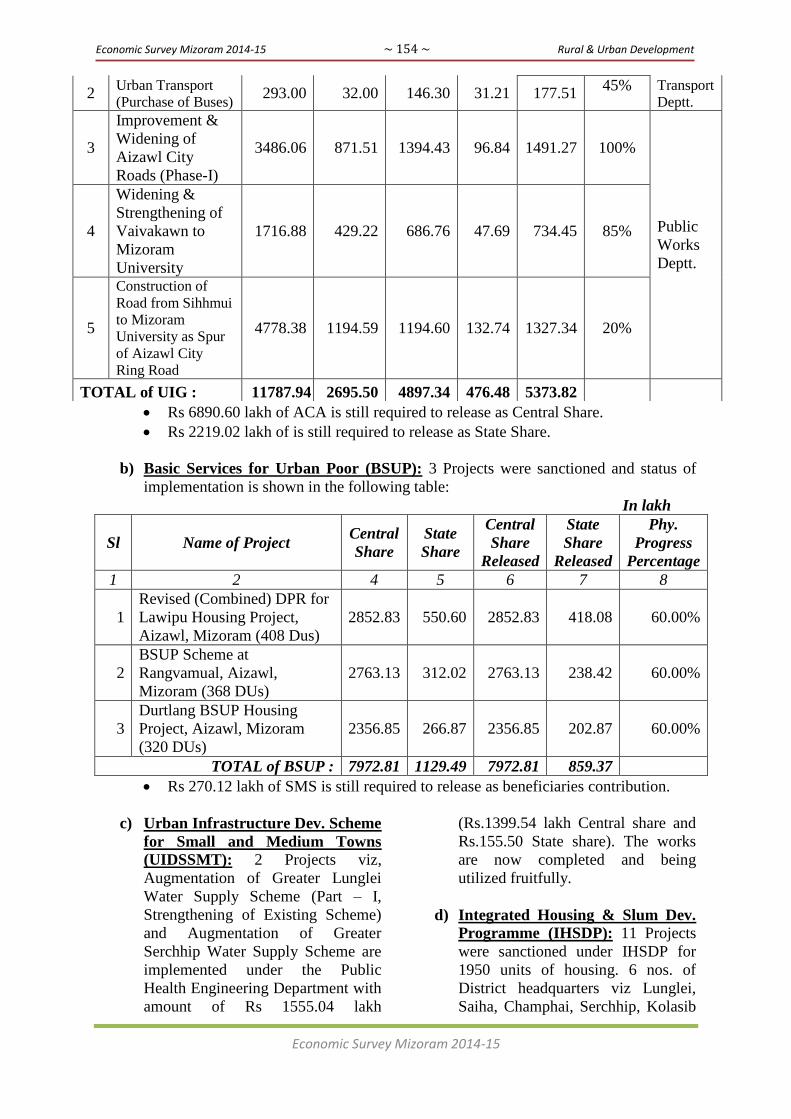
Economic Survey Mizoram 2014-15 ~ 154 ~ Rural & Urban Development
Economic Survey Mizoram 2014-15
Rs 6890.60 lakh of ACA is still required to release as Central Share.
Rs 2219.02 lakh of is still required to release as State Share.
b) Basic Services for Urban Poor (BSUP): 3 Projects were sanctioned and status of
implementation is shown in the following table:
In lakh
Sl Name of Project Central
Share
State
Share
Central
Share
Released
State
Share
Released
Phy.
Progress
Percentage
1 2 4 5 6 7 8
1
Revised (Combined) DPR for
Lawipu Housing Project,
Aizawl, Mizoram (408 Dus)
2852.83 550.60 2852.83 418.08 60.00%
2
BSUP Scheme at
Rangvamual, Aizawl,
Mizoram (368 DUs)
2763.13 312.02 2763.13 238.42 60.00%
3
Durtlang BSUP Housing
Project, Aizawl, Mizoram
(320 DUs)
2356.85 266.87 2356.85 202.87 60.00%
TOTAL of BSUP : 7972.81 1129.49 7972.81 859.37
Rs 270.12 lakh of SMS is still required to release as beneficiaries contribution.
c) Urban Infrastructure Dev. Scheme
for Small and Medium Towns
(UIDSSMT): 2 Projects viz,
Augmentation of Greater Lunglei
Water Supply Scheme (Part – I,
Strengthening of Existing Scheme)
and Augmentation of Greater
Serchhip Water Supply Scheme are
implemented under the Public
Health Engineering Department with
amount of Rs 1555.04 lakh
(Rs.1399.54 lakh Central share and
Rs.155.50 State share). The works
are now completed and being
utilized fruitfully.
d) Integrated Housing & Slum Dev.
Programme (IHSDP): 11 Projects
were sanctioned under IHSDP for
1950 units of housing. 6 nos. of
District headquarters viz Lunglei,
Saiha, Champhai, Serchhip, Kolasib
2 Urban Transport
(Purchase of Buses) 293.00 32.00 146.30 31.21 177.51
45% Transport
Deptt.
3
Improvement &
Widening of
Aizawl City
Roads (Phase-I)
3486.06 871.51 1394.43 96.84 1491.27 100%
Public
Works
Deptt.
4
Widening &
Strengthening of
Vaivakawn to
Mizoram
University
1716.88 429.22 686.76 47.69 734.45 85%
5
Construction of
Road from Sihhmui
to Mizoram
University as Spur
of Aizawl City
Ring Road
4778.38 1194.59 1194.60 132.74 1327.34 20%
TOTAL of UIG : 11787.94 2695.50 4897.34 476.48 5373.82
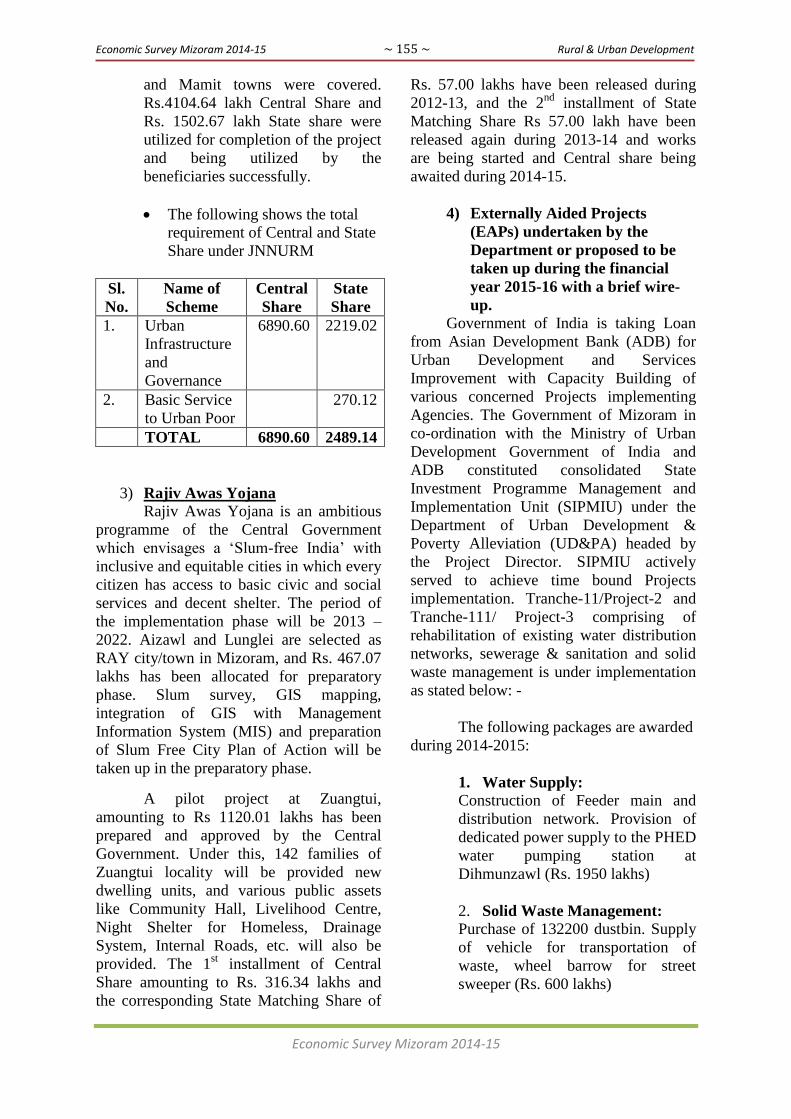
Economic Survey Mizoram 2014-15 ~ 155 ~ Rural & Urban Development
Economic Survey Mizoram 2014-15
and Mamit towns were covered.
Rs.4104.64 lakh Central Share and
Rs. 1502.67 lakh State share were
utilized for completion of the project
and being utilized by the
beneficiaries successfully.
The following shows the total
requirement of Central and State
Share under JNNURM
Sl.
No.
Name of
Scheme
Central
Share
State
Share
1. Urban
Infrastructure
and
Governance
6890.60 2219.02
2. Basic Service
to Urban Poor
270.12
TOTAL 6890.60 2489.14
3) Rajiv Awas Yojana Rajiv Awas Yojana is an ambitious
programme of the Central Government
which envisages a ‗Slum-free India‘ with
inclusive and equitable cities in which every
citizen has access to basic civic and social
services and decent shelter. The period of
the implementation phase will be 2013 –
2022. Aizawl and Lunglei are selected as
RAY city/town in Mizoram, and Rs. 467.07
lakhs has been allocated for preparatory
phase. Slum survey, GIS mapping,
integration of GIS with Management
Information System (MIS) and preparation
of Slum Free City Plan of Action will be
taken up in the preparatory phase.
A pilot project at Zuangtui,
amounting to Rs 1120.01 lakhs has been
prepared and approved by the Central
Government. Under this, 142 families of
Zuangtui locality will be provided new
dwelling units, and various public assets
like Community Hall, Livelihood Centre,
Night Shelter for Homeless, Drainage
System, Internal Roads, etc. will also be
provided. The 1st installment of Central
Share amounting to Rs. 316.34 lakhs and
the corresponding State Matching Share of
Rs. 57.00 lakhs have been released during
2012-13, and the 2nd
installment of State
Matching Share Rs 57.00 lakh have been
released again during 2013-14 and works
are being started and Central share being
awaited during 2014-15.
4) Externally Aided Projects
(EAPs) undertaken by the
Department or proposed to be
taken up during the financial
year 2015-16 with a brief wire-
up.
Government of India is taking Loan
from Asian Development Bank (ADB) for
Urban Development and Services
Improvement with Capacity Building of
various concerned Projects implementing
Agencies. The Government of Mizoram in
co-ordination with the Ministry of Urban
Development Government of India and
ADB constituted consolidated State
Investment Programme Management and
Implementation Unit (SIPMIU) under the
Department of Urban Development &
Poverty Alleviation (UD&PA) headed by
the Project Director. SIPMIU actively
served to achieve time bound Projects
implementation. Tranche-11/Project-2 and
Tranche-111/ Project-3 comprising of
rehabilitation of existing water distribution
networks, sewerage & sanitation and solid
waste management is under implementation
as stated below: -
The following packages are awarded
during 2014-2015:
1. Water Supply:
Construction of Feeder main and
distribution network. Provision of
dedicated power supply to the PHED
water pumping station at
Dihmunzawl (Rs. 1950 lakhs)
2. Solid Waste Management: Purchase of 132200 dustbin. Supply
of vehicle for transportation of
waste, wheel barrow for street
sweeper (Rs. 600 lakhs)

Economic Survey Mizoram 2014-15 ~ 156 ~ Rural & Urban Development
Economic Survey Mizoram 2014-15
3. Sewerage and Sanitation: Construction of Sewerage Treatment
Plant. Construction of Sewerage
network. Implementation of Bio-
digester Technology (Rs. 1900
lakhs)
4. Consultancy: Engagement of Design Supervision
Management Consultant (DSMC)
(Rs. 180 lakhs)
5. Project Implementation &
Administration (PI&A):
Expenses for Project Implementation
and Administration (Rs. 387.86
lakhs)
5) National Urban Livelihood
Mission (NULM)
The mission aims to reduce poverty
and vulnerability of the urban poor
households by enabling them to access
gainful self-employment and skilled wage
employment opportunities, resulting in an
appreciable improvement in their
livelihoods on a sustainable basis, through
building strong grassroots level institutions
of the poor. The mission would also aim at
providing shelter equipped with essential
services to the urban homeless in a phased
manner. In addition, the Mission would also
address livelihood concerns of the urban
street vendors by facilitating access to
suitable spaces, institutional credit, social
security and skills to the urban street
vendors for accessing emerging market
opportunities. it is allocated that amount of
Rs 1307.00 lakhs of CSS during 2014 -
2015, out of which Rs 851.52 lakhs as upto
2nd
Installment is already released by the
Central Government during 2014 – 2015,
while SMS is not release by the state till
date.
6) New Land Use Policy
UD&PA Department has been
engaged in the Mizoram Government
Flagship Programme NLUP since 2013 –
2014 financial year for taking ten number of
Trades within Aizawl Municipal Council
Area. The achievement so far under
UD&PA Department is shown as under: -
Sl.
No.
NAME OF
TRADE
2nd
Phase
(Fully Achieved)
3rd
Phase
(Rs 10,000/- per
beneficiary)
4th Phase
(Rs 10,000/- per
beneficiary)
TOTAL
No. of
Benefi
ciaries
Amount
No. of
Benefi
ciaries
Amount
No. of
Benefi
ciaries
Amount
No. of
Benefi
ciaries
Amount
1 Automobile
Reparing 87 89.53 51 5.10 20 2.00 158 96.63
2 Beauty Parlour 91 91.47 65 6.50 19 1.90 175 99.87
3 Desk Top
Publishing 181 175.10 279 27.90 90 9.00 550 212.00
4 Electronic
Repairing 105 106.40 100 10.00 32 3.20 237 119.60
5 Hair Cutting 46 44.45 18 1.80 4 0.40 68 46.65
6 Knitting 8 8.00 6 0.60 2 0.20 16 8.80
7 Leather &
Hood Works 5 7.40 12 1.20 3 0.30 20 8.90
8 Video &
Photography 67 65.14 129 12.90 43 4.30 239 82.34
9 Shoe Repairing 26 13.60 8 0.80 6 0.60 40 15.00
10 Tailoring 815 816.23 576 57.60 214 21.40 1605 895.23
TOTAL 1431 1417.32 1244 124.40 433 43.30 3108 1585.02
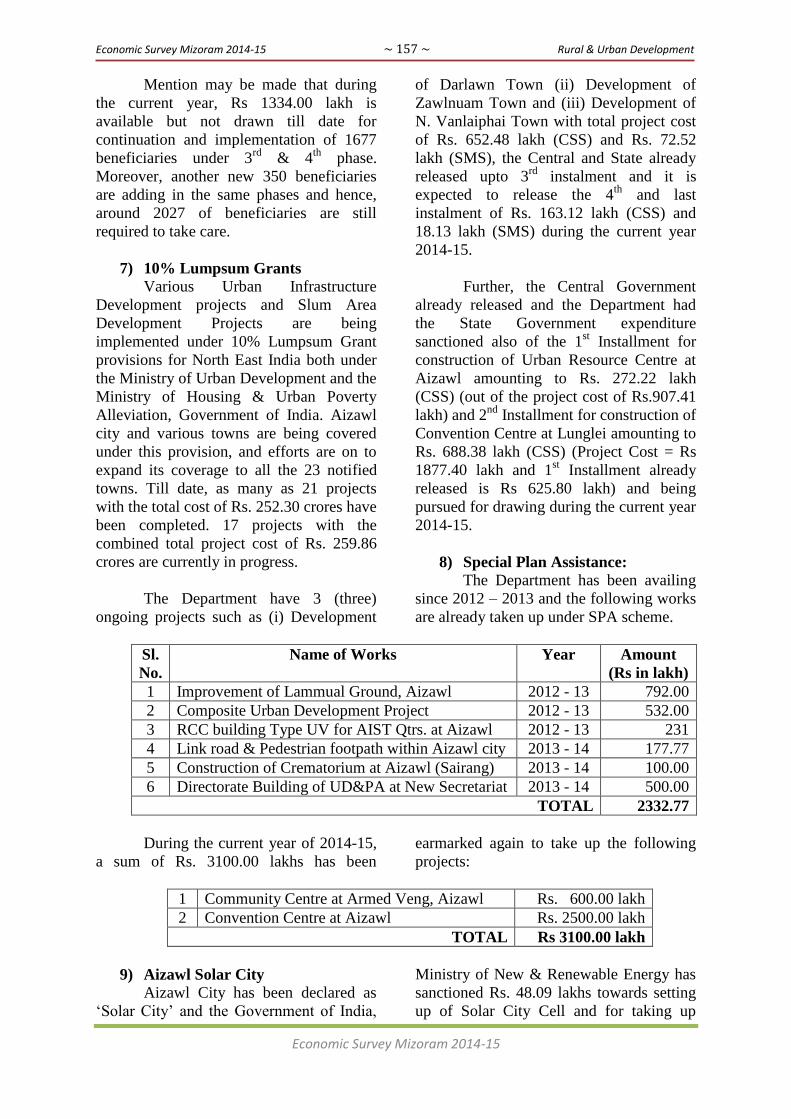
Economic Survey Mizoram 2014-15 ~ 157 ~ Rural & Urban Development
Economic Survey Mizoram 2014-15
Mention may be made that during
the current year, Rs 1334.00 lakh is
available but not drawn till date for
continuation and implementation of 1677
beneficiaries under 3rd
& 4th
phase.
Moreover, another new 350 beneficiaries
are adding in the same phases and hence,
around 2027 of beneficiaries are still
required to take care.
7) 10% Lumpsum Grants
Various Urban Infrastructure
Development projects and Slum Area
Development Projects are being
implemented under 10% Lumpsum Grant
provisions for North East India both under
the Ministry of Urban Development and the
Ministry of Housing & Urban Poverty
Alleviation, Government of India. Aizawl
city and various towns are being covered
under this provision, and efforts are on to
expand its coverage to all the 23 notified
towns. Till date, as many as 21 projects
with the total cost of Rs. 252.30 crores have
been completed. 17 projects with the
combined total project cost of Rs. 259.86
crores are currently in progress.
The Department have 3 (three)
ongoing projects such as (i) Development
of Darlawn Town (ii) Development of
Zawlnuam Town and (iii) Development of
N. Vanlaiphai Town with total project cost
of Rs. 652.48 lakh (CSS) and Rs. 72.52
lakh (SMS), the Central and State already
released upto 3rd
instalment and it is
expected to release the 4th
and last
instalment of Rs. 163.12 lakh (CSS) and
18.13 lakh (SMS) during the current year
2014-15.
Further, the Central Government
already released and the Department had
the State Government expenditure
sanctioned also of the 1st Installment for
construction of Urban Resource Centre at
Aizawl amounting to Rs. 272.22 lakh
(CSS) (out of the project cost of Rs.907.41
lakh) and 2nd
Installment for construction of
Convention Centre at Lunglei amounting to
Rs. 688.38 lakh (CSS) (Project Cost = Rs
1877.40 lakh and 1st Installment already
released is Rs 625.80 lakh) and being
pursued for drawing during the current year
2014-15.
8) Special Plan Assistance:
The Department has been availing
since 2012 – 2013 and the following works
are already taken up under SPA scheme.
Sl.
No.
Name of Works Year Amount
(Rs in lakh)
1 Improvement of Lammual Ground, Aizawl 2012 - 13 792.00
2 Composite Urban Development Project 2012 - 13 532.00
3 RCC building Type UV for AIST Qtrs. at Aizawl 2012 - 13 231
4 Link road & Pedestrian footpath within Aizawl city 2013 - 14 177.77
5 Construction of Crematorium at Aizawl (Sairang) 2013 - 14 100.00
6 Directorate Building of UD&PA at New Secretariat 2013 - 14 500.00
TOTAL 2332.77
During the current year of 2014-15,
a sum of Rs. 3100.00 lakhs has been
earmarked again to take up the following
projects:
1 Community Centre at Armed Veng, Aizawl Rs. 600.00 lakh
2 Convention Centre at Aizawl Rs. 2500.00 lakh
TOTAL Rs 3100.00 lakh
9) Aizawl Solar City
Aizawl City has been declared as
‗Solar City‘ and the Government of India,
Ministry of New & Renewable Energy has
sanctioned Rs. 48.09 lakhs towards setting
up of Solar City Cell and for taking up

Economic Survey Mizoram 2014-15 ~ 158 ~ Rural & Urban Development
Economic Survey Mizoram 2014-15
preparatory activities including preparation
of Master Plan. Master Plan for Aizawl
City with an estimated investment of Rs.
190.58 crores for 5 years has already been
prepared. Seven Projects have been already
completed, such as New Secretariat
Building, Assembly House Building,
Aizawl Municipal Council Building,
Aizawl Theological College Building,
Millennium Centre Building, Protective
Home Building and Chief Secretary‘s
Bungalow.
Projects proposal for installation of
250,000 LPD Solar Water Heating System
amounting to Rs 590.00 lakhs is being
submitting and approval from Central
Government is being awaited.
10) Solid Waste Management
The problem of solid waste
management is a common phenomenon
around the world as solid waste is
concomitant to the changing human
civilization. For quite a long time, the
municipal waste that consists of organic,
non-organic and inert materials like debris
in mixed form is collected by the Sanitation
Wing of this Department and dumped at
two places namely Sakawrhmuituai and
Tuirial. This practice within Aizawl city is
now confines by Aizawl Municipal
Council, and all employees under Senior
Sanitation were also shifted to AMC office,
Rs. 60.00 lakh is proposed for employees
of Senior Sanitation establishment to
provide their salary component with
personal claim. Action is being taken as
new initiative for proper and effective
disposal of garbage/solid waste within City
on PPP Model from 4th
October, 2010, this
novel system, the Local Councils within
Aizawl City are responsible for collection,
transportation and disposal of garbage
within their respective jurisdictional areas.
This venture has been highly appreciated
by the people and is very successful.
The Department looks after the
Garbage collection and disposal within the
five Districts headquarters. Garbage
collection and disposal is being done with
Departmental Garbage trucks, which
habitually necessitate POL as well as
maintenance of such vehicles, also
renovation of each dumping ground.
Rs.44.00 lakh is to be utilized for the said
purposed during the current year.
11) Schemes under Minor Works
Minor Works under various
schemes have been successfully
implemented by the Department to provide
critical urban infrastructures like Link
Roads, Steps & Retaining Wall, Parks and
Recreation, Urban Forestry, Public Utilities
and Beautification, etc. It may be
mentioned that due to the inadequate Plan
Fund during the current year, Minor Works
cannot be implemented while the need of
the public is pressing hard.
12) Crematorium / Common Cemetery
The Department is maintaining the
Common Cemetery at Hlimen and Mikhual
Thlanmual at Muanna Veng. It is
constantly required to renovate. The
Department being constructed
Crematorium at Sairang under SPA scheme
which require supporting from the other
source of fund. There is no allocation
during the current year due to the limited
Plan Fund.
13) GIA to Local Body :-
Aizawl Development Authority: Aizawl
Development Authority (ADA) was created
under Aizawl Development Authority Act,
2005 (Act No. 9 of 2005) on December,
2006 with the major objective of having a
planned city for Aizawl. As resolved and
notified by the Government during 2011-
12, 40 (forty) nos. of Officers and Staff of
the ADA are placed under the Aizawl
Municipal Council to deal with Building
Regulation Matters, as this subject has been
transferred to the AMC from ADA. The
remaining Officers and Staff continue to
function under ADA and are now finalising
Aizawl Master Plan.

Economic Survey Mizoram 2014-15 ~ 159 ~ Rural & Urban Development
Economic Survey Mizoram 2014-15
Aizawl Municipal Council: With the
establishment of the Aizawl Municipal
Council, various subjects are being
transferred to them as envisaged in the
Constitution (74th
Ammendment Act) and
as provided in the Mizoram Municipalities
Act, 2007, taking into account their
capacity and readiness to take over these
functions, such as (i) Finance Commission
Grants, ULB. (ii) Solid Waste Management
(iii) Cemetery and Burial Grounds (iv)
Parking Lots (v) Property Tax (vi)
Regulation of land-use and construction of
buildings (Building Regulation) (vii) Public
Health Sanitation and (viii) Provision of
urban amenities such as parks,
playgrounds.
Services like solid waste
management, water supply, drainage and
other public amenities within Aizawl have
been implemented under the 13th
Finance
Commission Grants for Urban Local
Bodies.
14) Non Tax Revenue :-
The following shows the
achievement so far of Non Tax Revenue
collected under UD&PA during the year
2014 – 2015: -
Sl.
No Non Tax Revenue
Target Budget
(in lakh)
2014-2015
Progressive
1
00 - 01 - Receipt Under Town
Sanitation Rules,
Licence Fee
6.00
3,85,579.00
2 00 - 02 - Hoarding & Public
Advertisement 7,850.00
3 00 - 03 - Sanitary Inspection
Fee 0.00
4 04- Miscellaneous 3,976.00
5 (01)- Cost of Tender Forms 97,000.00
6 (02)- Cost of Vehicle Aution 2,73,687.00
7 (03) Cost of Application Form 31,300.00
8 (04) Others 74,047.00
TOTAL 6.00 8,73,439.00
IV. Outcome of the Department‟s
activities so far and expected
outcome (Impact on economy)
A. Outcomes so far:
The Department‘s activities have so
far resulted as below:-
1) Overall cleanliness of cities, and
towns due to collection of solid
waste and transportation to
dumping sites.
2) Provision of critical Urban
Infrastructure like:-
Truck Terminal, Bus
Terminal
Critical Urban Roads and
pedestrian facilities
Supply of Clean & surface
drinking water supply to
Urban Areas.
Critical Urban Centre‘s like
Convention Centre,
Auditorium, etc.
Sport facilities for the youth
and Sports persons.
3) Provision of Housing Stock for
Urban Poor

Economic Survey Mizoram 2014-15 ~ 160 ~ Rural & Urban Development
Economic Survey Mizoram 2014-15
B. The Departments‘ activities are
expected to bring about the
following outcome:-
1) Making our cities clean, tidy
and having environment
healthy.
2) Solid wastes are collected
transported and processed as
scientific manner to attain the
goal of ―Waste to Wealth‖
3) Cities and Towns of the State
are developed as economically
sustainable and vibrant urban
centres.
4) Shortfall in housing stock is
gradually reduced and all the
Urban dwellers are provided
affordable housing by 2022
5) Urban Poverty is successfully
addressed and Urban Waste
Earnests are provided required
skills to earn their livelihood.
V. Policy constraint required to be
addressed.
1. Convergence Committee(s) for
Urban Service Delivery Functions
• Different Department under the
State Government delivers various
urban functions to the people of
cities and towns. Such functions
include:
▫ Water supply, Urban Sanitation
& Solid Waste Management
▫ Sewerage & Drainage (roadside
drainage & storm water drains)
▫ Urban transportation , Housing
& land development
▫ Poverty alleviation & skill
development
• The functions are handled by
various Departments, authorities
and agencies without much
coordination and convergence
between the agencies.
• The Departments involved in
delivering urban function include:
▫ Urban Development & Poverty
Alleviation Department, Aizawl
▫ Municipal Council, Public
Work Department,
▫ Public Health Engineer
Department,
▫ Police (Traffic),
▫ Transport, District Development
Boards/ High Power
Committee, etc.
• In order to bring about convergence
of activities and making optimum
utilization of scarce public
resources it is extremely essential
that unified authorities and
convergence committees with
statutory backing need to be put in
place and institutionalized.
• Presently, there are a few such
committees doing the co-ordination
of urban functions viz.:
▫ Aizawl City Traffic Co-
ordination Committee.
▫ Aizawl City Road Authority.
▫ Aizawl City Water Authority.
• These Committees are constituted
by Government Notifications. It is
felt essential that more of such
committees/authorities be put in
place at State/ District/ City/ Town
Levels with statutory backing, by
appropriate legislations, or by
making rules by the Government.
• This will enable convergence of
activities in delivering urban
functions to the citizens and result
in optimum utilization of resources.
2. Housing for all: Urban housing
and related issues.
Growth and development of urban
areas to a large extent is determined
by the availability of affordable
housing stock for all classes of
people.
Housing necessarily includes decent
living space and sanitation facilities
including waste management
system.

Economic Survey Mizoram 2014-15 ~ 161 ~ Rural & Urban Development
Economic Survey Mizoram 2014-15
Having a look at the availability of
housing stock and the quality of
social amenities in our cities and
towns, a lot needs to be done.
The Government of India has
launched various schemes to
provide housing to the urban poor
with the ambitious vision of
―HOUSING FOR ALL 2022‖.
In order to be able to address the
issues effectively and to be able to
reap the benefits of this vision, the
State Government will need to put
in place institutional arrangements
such as :
Establishment of Housing
Regulatory Authority (Housing
Board, etc.)
Acts / Rules Regulating Housing
development and related matters.
UD&PA Department is in the
process of developing a draft bill
regulating housing development and
will be ready for consideration of
the government soon.
It is essential that the government
give priority to this matter keeping
in view the need for proper
regulation of housing development
and various connected matters.
This may enable mobilization of
various housing developers for
development of housing complexes
in the cities and towns of the State.
3. Assets management: Mobilization
of resources through management
of completed assets and
utilization of private parties.
• Various urban assets are created by
the Department under different
programmes and schemes.
• Sustainable management of these
completed assets is a matter of great
concern.
• Operation and management of these
assets had resulted in incurring of
expenditure of the Government. It is
essential that management of assets
should not result in incurring of
expenditure from the Government.
• It should rather result in generation
of resources to the Government. For
this, the overall concept of asset
management in urban areas needs to
undergo a paradigm shift.
• UD&PA Department has been
working on development of a set of
guidelines to regulate principles of
assets management in which the
completed assets will be placed for
management of registered societies/
private parties so that they become
revenue earning in nature.
4. Regulation of Urban functions:
Repeal of the Act “The Mizo
District (Administration of Town
Committees) Act, 1955” and
Legislation of new Act and
developing new Rules.
• The existing Act of 1955 regulating
provision of urban functions and
amenities is very old, outdated and
does not meet contemporary
requirements.
• Further, the main rules under the
said Act, i.e. ―The Mizoram Town
Sanitation Rules, 1980‖ also need
wholesale revision to meet the
upcoming challenges in the urban
section.
• The Department will need to start
working on this so that there are
governance and administrative
framework for administering urban
functions. This will require
enactment of new Act and
developing new Rules so that
management of urban areas is
properly provided in a legal
framework.
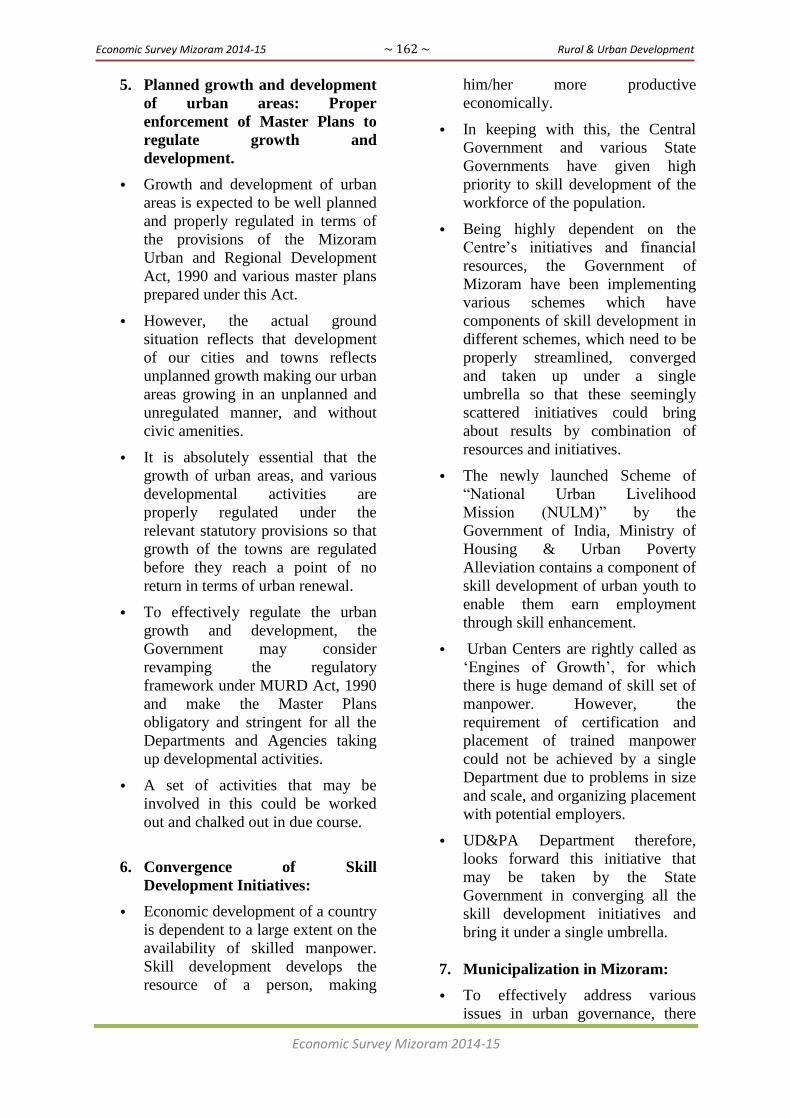
Economic Survey Mizoram 2014-15 ~ 162 ~ Rural & Urban Development
Economic Survey Mizoram 2014-15
5. Planned growth and development
of urban areas: Proper
enforcement of Master Plans to
regulate growth and
development.
• Growth and development of urban
areas is expected to be well planned
and properly regulated in terms of
the provisions of the Mizoram
Urban and Regional Development
Act, 1990 and various master plans
prepared under this Act.
• However, the actual ground
situation reflects that development
of our cities and towns reflects
unplanned growth making our urban
areas growing in an unplanned and
unregulated manner, and without
civic amenities.
• It is absolutely essential that the
growth of urban areas, and various
developmental activities are
properly regulated under the
relevant statutory provisions so that
growth of the towns are regulated
before they reach a point of no
return in terms of urban renewal.
• To effectively regulate the urban
growth and development, the
Government may consider
revamping the regulatory
framework under MURD Act, 1990
and make the Master Plans
obligatory and stringent for all the
Departments and Agencies taking
up developmental activities.
• A set of activities that may be
involved in this could be worked
out and chalked out in due course.
6. Convergence of Skill
Development Initiatives:
• Economic development of a country
is dependent to a large extent on the
availability of skilled manpower.
Skill development develops the
resource of a person, making
him/her more productive
economically.
• In keeping with this, the Central
Government and various State
Governments have given high
priority to skill development of the
workforce of the population.
• Being highly dependent on the
Centre‘s initiatives and financial
resources, the Government of
Mizoram have been implementing
various schemes which have
components of skill development in
different schemes, which need to be
properly streamlined, converged
and taken up under a single
umbrella so that these seemingly
scattered initiatives could bring
about results by combination of
resources and initiatives.
• The newly launched Scheme of
―National Urban Livelihood
Mission (NULM)‖ by the
Government of India, Ministry of
Housing & Urban Poverty
Alleviation contains a component of
skill development of urban youth to
enable them earn employment
through skill enhancement.
• Urban Centers are rightly called as
‗Engines of Growth‘, for which
there is huge demand of skill set of
manpower. However, the
requirement of certification and
placement of trained manpower
could not be achieved by a single
Department due to problems in size
and scale, and organizing placement
with potential employers.
• UD&PA Department therefore,
looks forward this initiative that
may be taken by the State
Government in converging all the
skill development initiatives and
bring it under a single umbrella.
7. Municipalization in Mizoram:
• To effectively address various
issues in urban governance, there

Economic Survey Mizoram 2014-15 ~ 163 ~ Rural & Urban Development
Economic Survey Mizoram 2014-15
need to be urban institutions. The
urban institutions are primarily the
Urban Local Bodies (ULBs)
provided under Part IX-A of the
Constitution of India which
provides for 3 types of
Municipalities:
▫ Municipal Corporations for
Larger Urban Areas;
▫ Municipal Councils for
Medium cities & towns,
▫ Municipal Boards for
Smaller Urban Areas, called
transitional habitations.
• Mizoram has one and only ULB in
Aizawl City, established with the
first election in November 2010. So
far, there have not been serious
considerations on establishment of
municipalities in other town of the
State.
• For proper growth and development
of the urban areas, the first issue to
be addressed is setting up of urban
institutions like ULB to take up the
urban functions and be the owner of
the cities/towns. Only with the
setting up of Municipal Bodies that
the urban functions could be taken
up in a streamlined and focused
manner.
• In Mizoram State, we may consider
establishment of Municipalities at
least at the District Hqtrs., and
bigger towns in the Sub-Division
Hqtrs. It may, however be taken up
in phase manner, so that ULBs
could be established in all bigger
towns of the State in the next 5/10
years.
• UD&PA Department, on its part
will need to provide various Rules
and Regulations under the
provisions of The Mizoram
Municipalities Act, 2007 to provide
the ULBs with various
administrative and legal instruments
to enable them function and take up
various urban functions.
8. Rural - Urban Divide in
Mizoram:
• There are 23 Notified Towns in
Mizoram, which are duly included
in the decadal census in 2011. The
combined population of these towns
constitutes approximately half of
the population of the State, thereby
making the State one of the most
urbanized States in India.
9. The procedure for notification of
towns in the State is not clearly provided in
the Allocation of Business, or the
Transaction of Business Rules. While the
subject appears to be that of the ‗General
Administration Department‘, the
Department apparently has not issued
specific notifications and the notifications
were issued by different Departments like
Local Administration Department, Land
Revenue & Settlement Department, etc.
This is apparent when the UD&PA
Department tries to obtain copies of the
appropriate notifications made by the
Government of Mizoram for submission to
the Government of India. The Department
could not obtain most of the relevant
notifications, and wherever available, they
were issued by different Departments.
Urbanization is taking place at a fast
pace over the world, including India. The
issues and challenges have been taken up
by the Government of India in an integrated
approach covering various facets of
• Urban governance, Urban
infrastructure development, Urban
poverty alleviation.
• Urban housing, Urban transport,
Urban sanitation, Urban habitation,
etc.

Economic Survey Mizoram 2014-15 ~ 164 ~ Rural & Urban Development
Economic Survey Mizoram 2014-15
• To move in tune with the national
government, the State needs to
make suitable institutional
arrangements. However, with the
exception of Aizawl City, the
system of urban governance in
Mizoram remains the traditional
Village Councils.
• This makes it difficult to take up
various central sector schemes, and
move in line with various initiatives
of the Government of India.
• Further, to successfully take up
various urban issues and challenges,
there need to be proper urban
institutions like Urban Local
Bodies, or similar institutions which
can successfully take up the
challenges, with peoples‘
participation.
• As the saying goes ‗Urban Centers
are Engines of Growth‘, we need to
make the cities and towns grow
along the national and international
practices so that they can really be
made centers of growth, both in the
industrial and service sectors and
contribute to the economy
significantly.
• The Government of Mizoram
presently has 23 Towns as urban
areas by issuance of notifications.
However, so far there are no proper
urban institutions, and from the
view point of governance, they
remain like a group of villages.
• They have also been covered under
various schemes of Rural
Development, both under the
Central and State Governments.
• The Central Government is slowly
putting pressures upon the State
Government to make the Rural-
Urban Divide clear. This naturally
implies that the areas notified as
urban areas need to have proper
urban institutions and are governed
and managed as urban areas.
• They will, accordingly be covered
under different programmes of
urban development and poverty
alleviation of the Central and State
Governments. At the same time,
areas falling under Rural Areas will
continue to have rural institutions
(Panchayats/Village Councils) and
will avail rural development and
rural poverty alleviation schemes of
the Central and State Governments.
• To move in this direction, the
Government of Mizoram needs to
look into the matter so that there is a
proper line of demarcation between
rural and urban areas so that
governance and development
administration could be better
streamlined.
• This issue will need to include the
following set of activities:
• Laying down clear guidelines
for notification of habitations as
urban areas (cities/towns) based
on a set of parameters - social,
economics and other
considerations.
• The existing list of urban
locations will need to be re-
looked in line with a set of
parameters and some may need
to be de-notified, if they do not
have the basic tenets of urban
locations.
• A Department responsible to
take up the matter needs to be
clearly indicated in the
Allocation of Business Rules.
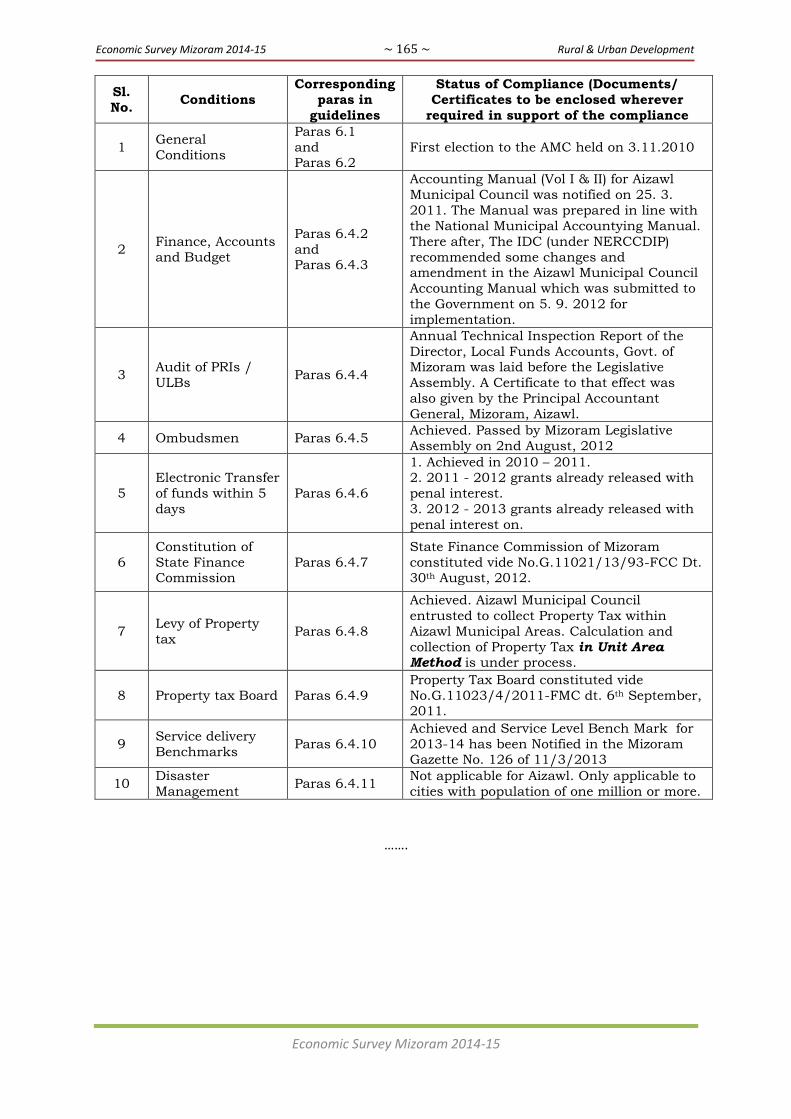
Economic Survey Mizoram 2014-15 ~ 165 ~ Rural & Urban Development
Economic Survey Mizoram 2014-15
Sl.
No. Conditions
Corresponding
paras in
guidelines
Status of Compliance (Documents/
Certificates to be enclosed wherever
required in support of the compliance
1 General
Conditions
Paras 6.1
and Paras 6.2
First election to the AMC held on 3.11.2010
2 Finance, Accounts
and Budget
Paras 6.4.2
and Paras 6.4.3
Accounting Manual (Vol I & II) for Aizawl
Municipal Council was notified on 25. 3.
2011. The Manual was prepared in line with
the National Municipal Accountying Manual.
There after, The IDC (under NERCCDIP)
recommended some changes and amendment in the Aizawl Municipal Council
Accounting Manual which was submitted to
the Government on 5. 9. 2012 for
implementation.
3 Audit of PRIs /
ULBs Paras 6.4.4
Annual Technical Inspection Report of the
Director, Local Funds Accounts, Govt. of Mizoram was laid before the Legislative
Assembly. A Certificate to that effect was
also given by the Principal Accountant
General, Mizoram, Aizawl.
4 Ombudsmen Paras 6.4.5 Achieved. Passed by Mizoram Legislative
Assembly on 2nd August, 2012
5
Electronic Transfer
of funds within 5
days
Paras 6.4.6
1. Achieved in 2010 – 2011. 2. 2011 - 2012 grants already released with
penal interest.
3. 2012 - 2013 grants already released with
penal interest on.
6
Constitution of
State Finance Commission
Paras 6.4.7
State Finance Commission of Mizoram
constituted vide No.G.11021/13/93-FCC Dt. 30th August, 2012.
7 Levy of Property
tax Paras 6.4.8
Achieved. Aizawl Municipal Council
entrusted to collect Property Tax within
Aizawl Municipal Areas. Calculation and
collection of Property Tax in Unit Area Method is under process.
8 Property tax Board Paras 6.4.9
Property Tax Board constituted vide
No.G.11023/4/2011-FMC dt. 6th September, 2011.
9 Service delivery
Benchmarks Paras 6.4.10
Achieved and Service Level Bench Mark for
2013-14 has been Notified in the Mizoram Gazette No. 126 of 11/3/2013
10 Disaster
Management Paras 6.4.11
Not applicable for Aizawl. Only applicable to
cities with population of one million or more.
…….
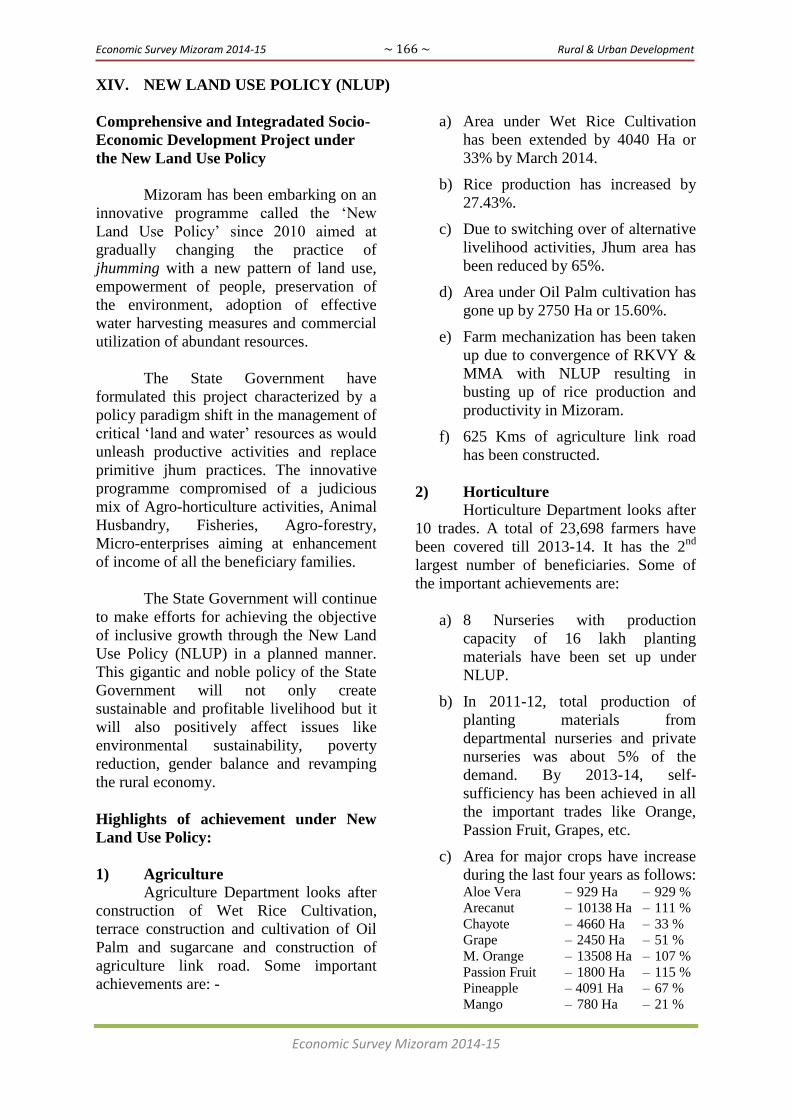
Economic Survey Mizoram 2014-15 ~ 166 ~ Rural & Urban Development
Economic Survey Mizoram 2014-15
XIV. NEW LAND USE POLICY (NLUP)
Comprehensive and Integradated Socio-
Economic Development Project under
the New Land Use Policy
Mizoram has been embarking on an
innovative programme called the ‗New
Land Use Policy‘ since 2010 aimed at
gradually changing the practice of
jhumming with a new pattern of land use,
empowerment of people, preservation of
the environment, adoption of effective
water harvesting measures and commercial
utilization of abundant resources.
The State Government have
formulated this project characterized by a
policy paradigm shift in the management of
critical ‗land and water‘ resources as would
unleash productive activities and replace
primitive jhum practices. The innovative
programme compromised of a judicious
mix of Agro-horticulture activities, Animal
Husbandry, Fisheries, Agro-forestry,
Micro-enterprises aiming at enhancement
of income of all the beneficiary families.
The State Government will continue
to make efforts for achieving the objective
of inclusive growth through the New Land
Use Policy (NLUP) in a planned manner.
This gigantic and noble policy of the State
Government will not only create
sustainable and profitable livelihood but it
will also positively affect issues like
environmental sustainability, poverty
reduction, gender balance and revamping
the rural economy.
Highlights of achievement under New
Land Use Policy:
1) Agriculture
Agriculture Department looks after
construction of Wet Rice Cultivation,
terrace construction and cultivation of Oil
Palm and sugarcane and construction of
agriculture link road. Some important
achievements are: -
a) Area under Wet Rice Cultivation
has been extended by 4040 Ha or
33% by March 2014.
b) Rice production has increased by
27.43%.
c) Due to switching over of alternative
livelihood activities, Jhum area has
been reduced by 65%.
d) Area under Oil Palm cultivation has
gone up by 2750 Ha or 15.60%.
e) Farm mechanization has been taken
up due to convergence of RKVY &
MMA with NLUP resulting in
busting up of rice production and
productivity in Mizoram.
f) 625 Kms of agriculture link road
has been constructed.
2) Horticulture
Horticulture Department looks after
10 trades. A total of 23,698 farmers have
been covered till 2013-14. It has the 2nd
largest number of beneficiaries. Some of
the important achievements are:
a) 8 Nurseries with production
capacity of 16 lakh planting
materials have been set up under
NLUP.
b) In 2011-12, total production of
planting materials from
departmental nurseries and private
nurseries was about 5% of the
demand. By 2013-14, self-
sufficiency has been achieved in all
the important trades like Orange,
Passion Fruit, Grapes, etc.
c) Area for major crops have increase
during the last four years as follows: Aloe Vera – 929 Ha – 929 %
Arecanut – 10138 Ha – 111 %
Chayote – 4660 Ha – 33 %
Grape – 2450 Ha – 51 %
M. Orange – 13508 Ha – 107 %
Passion Fruit – 1800 Ha – 115 % Pineapple – 4091 Ha – 67 %
Mango – 780 Ha – 21 %

Economic Survey Mizoram 2014-15 ~ 167 ~ Rural & Urban Development
Economic Survey Mizoram 2014-15
Tea – 384 Ha – 52 %
Tung – 500 Ha – Newly
introduce
Substantial area expansion has
taken place for the major crops
under the department with potential
for substantial enhancement of
production capacity and production.
3) Animal Husbandry & Veterinary
Animal Husbandry & Veterinary
Department looks after dairy cow, piggery,
poultry and mithun/hill cattle trades. It has
maximum number of beneficiaries. Some
of the important achievements are:
a) 100% self-sufficiency in production
of day old chicks (input supply)
from below 3% of demand in 2011-
12.
b) Milk production has gone up by
22% in 4 years time. Three milk
processing units have been set up
and one existing milk processing
unit at Thuampui, Aizawl was
upgraded to increase production
capacity by 25%.
c) Animal feed plants at Tanhril,
Aizawl and under PIGFED were
renovated. Production of animal
feed has gone up by 150%
compared to 2010-11. As per testing
conducted by the nutrition experts
of Regional Vety College, under
Central Agriculture University, the
quality of concentrated feed was
found to be fully satisfactory.
d) Production of egg has gone up by
11.31 lakh number or 3.2%.
e) Meat production has gone up by
25.66%.
f) There was large scale infection of
pig by a disease called PRRS since
June 2013. Most of the sows in the
16 piglet multiplication centres and
other farms have died or been culled
creating serious set-backs under
piggery trade. Experts of Govt. of
India and the FAO have now been
involved to prepare detail action
plan and repopulation of pig.
4) Environment & Forest
The New Land Use Pattern
approved under NLUP envisaged
earmarking of 80% of the geographical area
of the state under forest or green cover out
of which 70% will be protected forest for
dense forest and 10% for community
reserve forest. The following actions have
been taken:-
a) Detail guideline for afforestation
has been prepared.
b) Strategies for afforestation, area
demarcation and development of
forest have been formulated.
c) About 6000 hectare has been
covered for Bamboo plantation.
d) A new project for bio-diversity and
improvement of eco-system is under
process in collaboration with FAO
and other expert agencies under
JICA and German Development
Bank.
5) Fisheries
Fisheries Department takes up
Aquaculture (semi-intensive fish farming).
a) About 1644.5 hectare of water has
been benefiting 3289 jhumia
families.
b) Modern technology of fish farming
has been imparted to the fish
farmers.
c) Production of fish fingerlings
within the state was about 5% of the
demand in 2011-12 through
installation of modern hatchery,
adoption of induced breeding, etc.,
the state has achieved self
sufficiency in production of fish
fingerlings.
d) Productivity has gone up from
about 1500 Kg per hectare to 2500
Kg per hectare, leading to increase
of fish production in the state by
17%.
e) Income of the fish farmers have
increased by 75% to 150% per
annum.
f) Per capita consumption of fish has
gone up contributing to
improvement in nutrition intake.

Economic Survey Mizoram 2014-15 ~ 168 ~ Rural & Urban Development
Economic Survey Mizoram 2014-15
6) Industries
Under Industries Department,
Special Micro Enterprise Schemes (SMES)
of various trades including Carpentry, Food
Processing, etc. are taken up. 24298
families are covered. Success rate varies
from ‗outstanding‘ to ‗fair‘. About 60% are
expected to be successful i.e. to support the
family through the NLUP trade taken up by
them
7) Soil & Water Conservation
Soil & Water Conservation
Department looks after cultivation of
Rubber, Coffee and Broomstick trades. The
important achievements are as follows:
a) There was no functional rubber
nursery in Mizoram till 2009-10.
Under NLUP six numbers of
Rubber seedling nurseries were
created with annual production
capacity of 2.5 lakh rubber
seedlings and saplings.
b) During the first two years of
implementation of NLUP
production of Rubber
seedlings/saplings was nil.
Production of planting materials in
2013-14 and 2014-15 is 24.30% and
77.92% of the demand respectively.
Self-sufficiency is expected in
2015-16.
c) Under Broom cultivation value of
broom stick production has gone up
from Rs. 37 lakhs in 2009-10 to Rs.
14.26 crore by 2013-14. Increase in
the income of broom grass farmers
have gone up by 75% to 3 or 4
times before commencement of
NLUP.
8) Sericulture
Production of mulberry-based
silkworm trade was taken up under
Sericulture Department. 2208 families have
been covered. Some of the important
achievements are -
a) 2208 Ha of area for 2208 families
have been taken up for silk
production.
b) In 2009-10, production of seed was
below 5% of the demand. Self-
sufficiency in seed production has
been achieve by 2013-14 i.e. 8 lakh
dfls per year. Demand for about
3000 silkworm-rearers has also
been met.
c) Infrastructural support: Infrastructural facilities like rearing
house, grainage house have been
constructed. Due to this reason,
capacity for production of 1100
lakh dfls per year has been created.
d) For preservation of silkworm seed,
cold-storage with 20 lakh dfls has
been created.
e) Cocoon production has gone up by
40%.
f) To ensure 24 hrs stable power
supply, 25 KW solar power plant
has been installed which reduced
power consumption from the
electricity department by 90%.
g) Marketing: In order to enhance
income of beneficiaries, cocoon van
was purchased and supply of
cocoon at the village gate has
started from 2014-15.
9) Urban Development & Poverty
Alleviation
10 trades including automobile
repairing, beauty parlour, desktop
publishing, electronic repair, Video &
Photography, etc. are implemented under
UD & PA. 3108 beneficiaries have been
covered so far. As per assessment of the
department, important achievements are as
follows:-
a) 28% beneficiaries have increased
their income 2 to 3 times.
Economic Survey Mizoram 2014-15 ~ 169 ~ Rural & Urban Development
Economic Survey Mizoram 2014-15
b) 67% of beneficiaries have depended
fully on their income for their
livelihood.
c) Most of the beneficiaries who earn
their livelihood as casual labour are
promoted to self-supported family.
d) Importance of entrepreneurship
development and skill-development
has been realized creating new
awakening.
e) Strategy for convergence with
various CSS has substantially
contributed for improvement under
various Centrally Sponsor Scheme.
CONCLUDING REMARKS OF MID
TERM ASSESSMENT REPORT OF
NABCONS
The present midterm review
informs us that the project‘s progress is
invariably good with a degree of diversity
in sectoral achievements. The project have
influenced the lives and livelihoods of the
treatment group in several ways but two of
the important impacts are (i) expanded the
multifaceted opportunities to certain extent
and (ii) given the beneficiaries liberty to
exert choice and to choose from a range of
livelihoods options. This means that an
opportunity to opt for income generation
activities not common to the family history
in case of some households and the liberty
to make a choice when income increased in
case of others. These are essential
‗takeaway‘ achievements for the project.
The project has contributed to the
state‘s economy with the annual food grain
production having been increased by 19.07
percent along with the continuously
declining areas under Mid Term
Assessment (MTA) Report Jhum
cultivation by more than 10.36 percent per
year ( Project Progress Report:2012). This
progressive result is further supplemented
by a remarkable expansion in the
infrastructure undertaken according to the
project‘s convergence plan with CSS.
The study also enlightens us that the
beneficiary‘s participation and commitment
to make the project a success is remarkable.
With the standard of living having been
improved, forest dependencies have
decreased among the beneficiaries
suggesting better scope for the preservation
of natural forest in the state. Alongside the
commendable response to the project,
productivities are found to improve for
certain activities undertaken in the key land
based sectors during the post-project period,
agriculture and horticulture for instance.
On the contrary, critical to the
project‘s success is the current landholding
system and the pressing need for a land
reform in the state. Though the project may
have been seen as an entry-point for
augmentation of the land reforms, a shift
from the customary to the statutory land
rights framework wouldn‘t be easy and free
from resistance. That said, although effort
had been made by the project Implementing
Board to ensure systematic land utilization
through preparation of ‗land utilization
road map‘ and land use plan in every
village, success of this initiative is factored
into several other dimensions, the time-
bound tenure of the project for instance.
Another important component of
the project is infrastructure development.
The major portion of the infrastructural
expenditure has been spent on production
facilitation purposes, viz. Raising nurseries
for different horticulture and plantation
crops, agro-seeds processing plants, piglet
production, etc. Excepting these initiatives,
major attempt to develop basic
infrastructure for the enhancement of
management, quality assurance, harvesting
and marketing of the produce of the
farmers is yet to be made. Also, the need is
of a concrete effort by the state government
to restructure the existing set of
institutional infrastructures to facilitate the
success of marketing policies and land use
target set out in the project manual. Further,
the development of the institutional
infrastructure includes existing legal
Economic Survey Mizoram 2014-15 ~ 170 ~ Rural & Urban Development
Economic Survey Mizoram 2014-15
framework for marketing and this is equally
vital as the ongoing developmental
interventions.
The training components are
another constituent of the project and have
received lesser emphasis as it should be in
real terms. The project documents suggest
that each implementing department have
developed an annual activity calendar and
rely on the same for implementation
throughout the year. This isn‘t clear from
given documents that how have the
requisite trainings for these trades been
imparted. Also, whether the training doses
were sufficient and have considered the
local knowledge or not is also not reflected.
As New Land Use Policy, Government of
Mizoram recommended in the earlier
section, the development of an activity-
based and thematic areas-wise training
calendar and follow up action is very
essential for the project.
To sum up, the new land use policy-
project demonstrates a model based on the
public private partnership ideologies. The
project should focus on documentation of
the project learnings and success stories so
that the model could be replicated
elsewhere in future. Besides meeting the
target and achievement goals, one of the
major challenges before the state
government would be to carry forward the
policy-making process for the land reforms
programmes alongside the timely delivery
of the project. In the pursuit of an
integrated and all-round development,
bringing in the policy-making authorities
and implementers to one table would
require focus and employment of an
effective strategy.
Highlight of Survey of NLUP
beneficiaries & Trade Selection by
Mizoram University, Aizawl
1. 54.08 percent of the beneficiaries
selected depend on daily labour as
their main source of income.
2. Average per capita income of the
beneficiaries is Rs. 1396.25. The
per capita income ranged from Rs.
1245.20 in Aizawl East-I to Rs.
1607.50 in Aizawl North-III.
3. The majority of the beneficiaries
(68.71%) have the per capita
income of less than Rs.1500 per
month.
4. This survey revealed that 33.73% of
NLUP beneficiaries are BPL
families.
5. Out of 7668 families surveyed,
2088 families or 27.23% are headed
by female as bread earner.
6. In 28 families, the head of
family/bread earner is below 20
years.
7. More than 52% of the beneficiaries
stay in rented house, while 63% do
not have land in any other place.
8. While the average number of room,
excluding kitchen, among the
beneficiaries turned out to be 2
rooms per family; the average
family size is approximately 5
persons per family.
9. NLUP beneficiaries are the families
who have the least access to loan
from either financial institution or
private money lenders to undertake
any new venture.
10. 22.95% increase in the average per
capita income could lead to the
upliftment of all poor beneficiaries
to abve poverty line.
11. 74 families of NLUP beneficiary
within Aizawl have permanent
government sevant among the
members of their families; while
215 families have temporary
government servants.
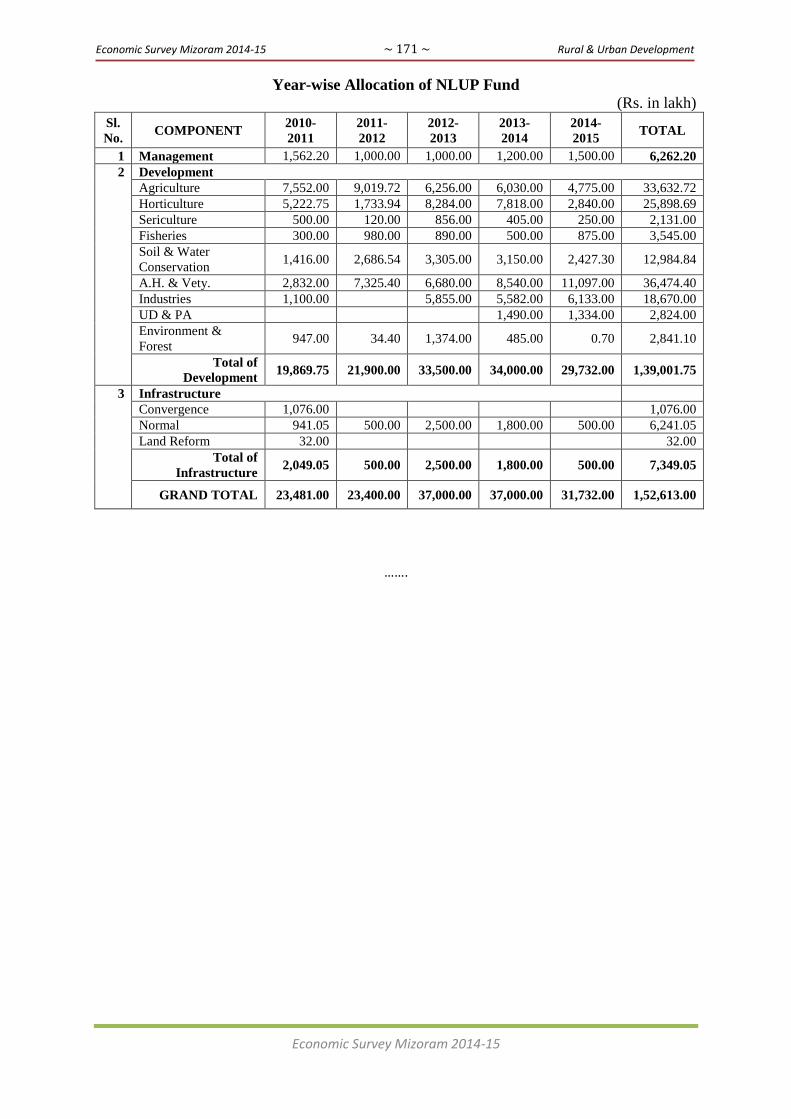
Economic Survey Mizoram 2014-15 ~ 171 ~ Rural & Urban Development
Economic Survey Mizoram 2014-15
Year-wise Allocation of NLUP Fund
(Rs. in lakh)
Sl.
No. COMPONENT
2010-
2011
2011-
2012
2012-
2013
2013-
2014
2014-
2015 TOTAL
1 Management 1,562.20 1,000.00 1,000.00 1,200.00 1,500.00 6,262.20
2 Development
Agriculture 7,552.00 9,019.72 6,256.00 6,030.00 4,775.00 33,632.72
Horticulture 5,222.75 1,733.94 8,284.00 7,818.00 2,840.00 25,898.69
Sericulture 500.00 120.00 856.00 405.00 250.00 2,131.00
Fisheries 300.00 980.00 890.00 500.00 875.00 3,545.00
Soil & Water
Conservation 1,416.00 2,686.54 3,305.00 3,150.00 2,427.30 12,984.84
A.H. & Vety. 2,832.00 7,325.40 6,680.00 8,540.00 11,097.00 36,474.40
Industries 1,100.00 5,855.00 5,582.00 6,133.00 18,670.00
UD & PA 1,490.00 1,334.00 2,824.00
Environment &
Forest 947.00 34.40 1,374.00 485.00 0.70 2,841.10
Total of
Development 19,869.75 21,900.00 33,500.00 34,000.00 29,732.00 1,39,001.75
3 Infrastructure
Convergence 1,076.00 1,076.00
Normal 941.05 500.00 2,500.00 1,800.00 500.00 6,241.05
Land Reform 32.00 32.00
Total of
Infrastructure 2,049.05 500.00 2,500.00 1,800.00 500.00 7,349.05
GRAND TOTAL 23,481.00 23,400.00 37,000.00 37,000.00 31,732.00 1,52,613.00
…….
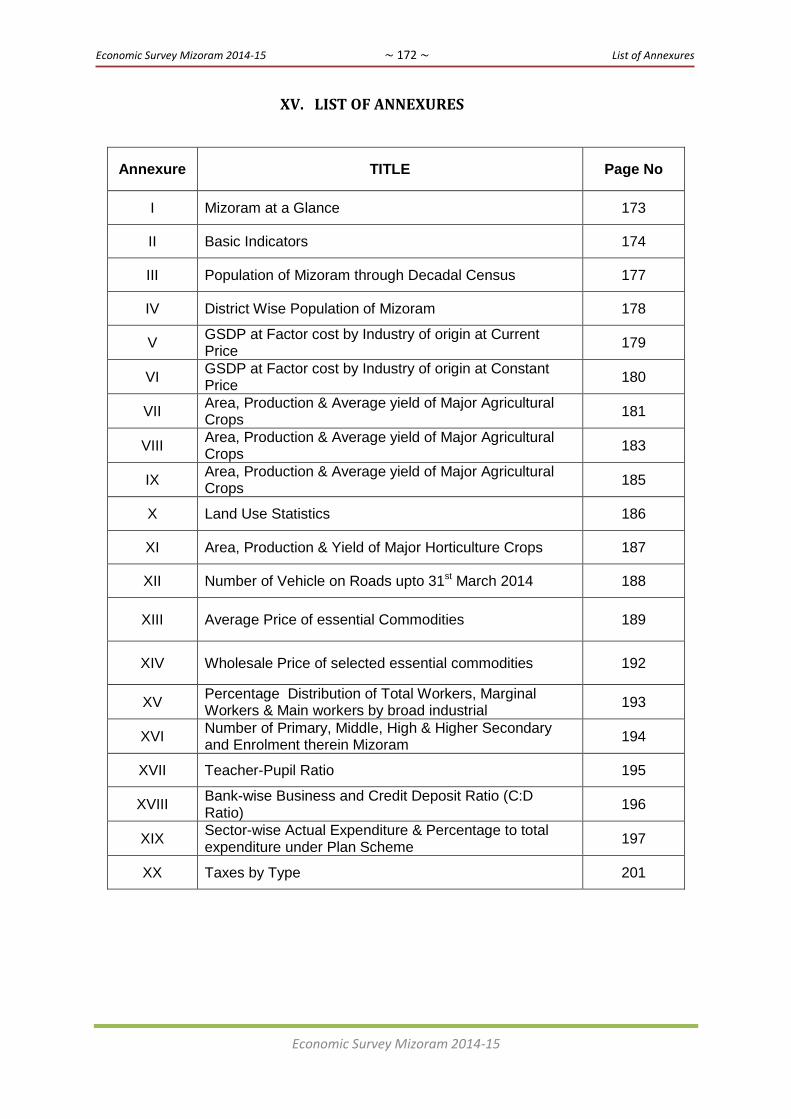
Economic Survey Mizoram 2014-15 ~ 172 ~ List of Annexures
Economic Survey Mizoram 2014-15
XV. LIST OF ANNEXURES
Annexure TITLE Page No
I Mizoram at a Glance 173
II Basic Indicators 174
III Population of Mizoram through Decadal Census 177
IV District Wise Population of Mizoram 178
V GSDP at Factor cost by Industry of origin at Current Price
179
VI GSDP at Factor cost by Industry of origin at Constant Price
180
VII Area, Production & Average yield of Major Agricultural Crops
181
VIII Area, Production & Average yield of Major Agricultural Crops
183
IX Area, Production & Average yield of Major Agricultural Crops
185
X Land Use Statistics 186
XI Area, Production & Yield of Major Horticulture Crops 187
XII Number of Vehicle on Roads upto 31st March 2014 188
XIII Average Price of essential Commodities 189
XIV Wholesale Price of selected essential commodities 192
XV Percentage Distribution of Total Workers, Marginal Workers & Main workers by broad industrial
193
XVI Number of Primary, Middle, High & Higher Secondary and Enrolment therein Mizoram
194
XVII Teacher-Pupil Ratio 195
XVIII Bank-wise Business and Credit Deposit Ratio (C:D Ratio)
196
XIX Sector-wise Actual Expenditure & Percentage to total expenditure under Plan Scheme
197
XX Taxes by Type 201

Economic Survey Mizoram 2014-15 ~ 173 ~ List of Annexures
Economic Survey Mizoram 2014-15
Annexure I
MIZORAM AT A GLANCE
Sl.
No. Particulars Unit
1. Geographical Area Sq. Km 21,081
2.
Geographical Location
Longitude Degree 92o.15‘E to 93
o29‘E
Latitude Degree 21o.58‘ N to 24
o.35‘ N
3.
Length
North to South Kms 277
East to West Kms 121
4.
International Borders
With Myanmar Kms 404
With Bangladesh Kms 318
5.
Inter State Borders
With Assam Kms 123
With Tripura Kms 66
With Manipur Kms 95
6.
Administrative Set Up
1. No. of District No. 8
2. No. of Autonomous
District Council No. 3
3. No. of Sub-Division No. 23
4. No. of R.D. Block No. 26
5. No. of villages (2011
census) No. 830
Sl.
No. Particulars Unit
7.
Total Population (2011 Census)
Persons No. 1,097,206
Males No. 5,55,339
Females No. 5,41,867
8.
Decadal Population Growth (2001 –
2011)
Absolute No. 2,08,633
Percentage % 23.48%
9. Population
Density
Per
Sq.
Km
52
10. No. of females per
1000 males
No. 976
11.
0 – 6 Population (2011 Census)
Persons No. 1,68,531
Males No. 85,561
Females No. 82,970
12.
Literacy (2011 Census)
Persons No. 8,48,175
Males No. 4,38,529
Females No. 4,09,646
Rate % 91.33
13.
Population (2011 Census)
Rural No. 5,25,435
Urban No. 5,71,771
14.
Total Workers
(2011 Census)
No. 4,86,705
Main workers No. 4,15,030
Marginal
workers
No. 71,675
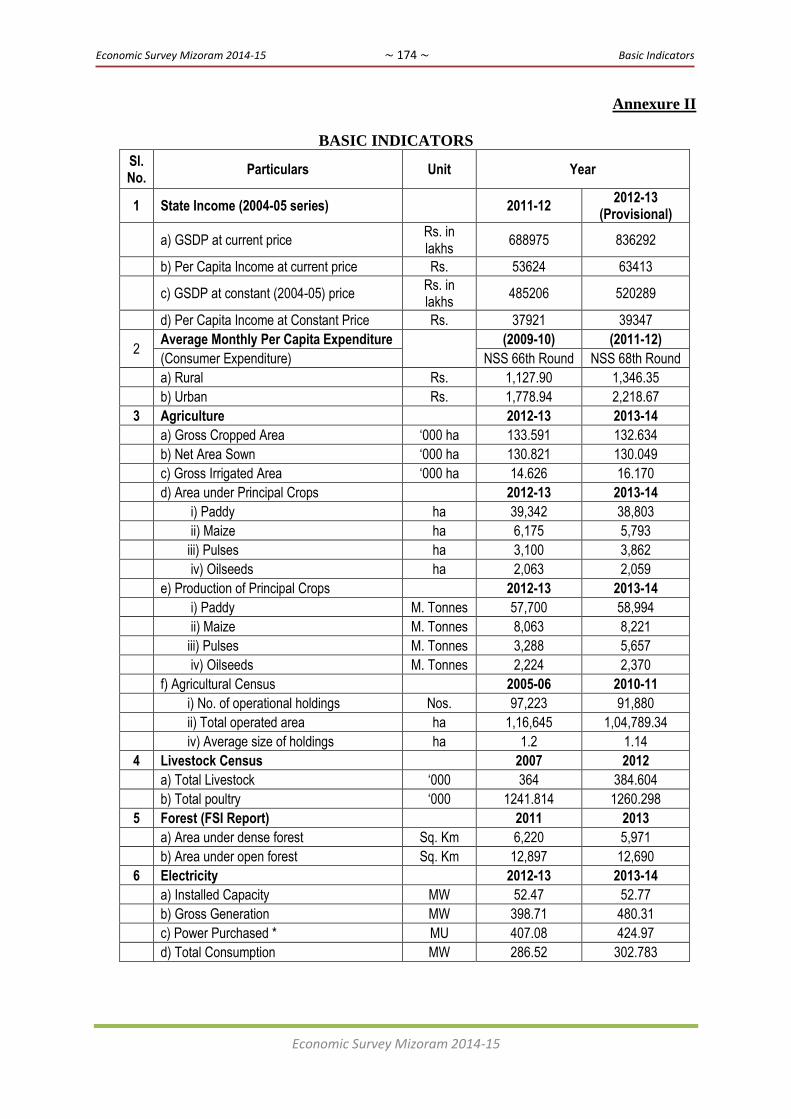
Economic Survey Mizoram 2014-15 ~ 174 ~ Basic Indicators
Economic Survey Mizoram 2014-15
Annexure II
BASIC INDICATORS
Sl. No.
Particulars Unit Year
1 State Income (2004-05 series) 2011-12 2012-13
(Provisional)
a) GSDP at current price Rs. in lakhs
688975 836292
b) Per Capita Income at current price Rs. 53624 63413
c) GSDP at constant (2004-05) price Rs. in lakhs
485206 520289
d) Per Capita Income at Constant Price Rs. 37921 39347
2 Average Monthly Per Capita Expenditure
(2009-10) (2011-12)
(Consumer Expenditure) NSS 66th Round NSS 68th Round
a) Rural Rs. 1,127.90 1,346.35
b) Urban Rs. 1,778.94 2,218.67
3 Agriculture 2012-13 2013-14
a) Gross Cropped Area ‘000 ha 133.591 132.634
b) Net Area Sown ‘000 ha 130.821 130.049
c) Gross Irrigated Area ‘000 ha 14.626 16.170
d) Area under Principal Crops 2012-13 2013-14
i) Paddy ha 39,342 38,803
ii) Maize ha 6,175 5,793
iii) Pulses ha 3,100 3,862
iv) Oilseeds ha 2,063 2,059
e) Production of Principal Crops 2012-13 2013-14
i) Paddy M. Tonnes 57,700 58,994
ii) Maize M. Tonnes 8,063 8,221
iii) Pulses M. Tonnes 3,288 5,657
iv) Oilseeds M. Tonnes 2,224 2,370
f) Agricultural Census 2005-06 2010-11
i) No. of operational holdings Nos. 97,223 91,880
ii) Total operated area ha 1,16,645 1,04,789.34
iv) Average size of holdings ha 1.2 1.14
4 Livestock Census 2007 2012
a) Total Livestock ‘000 364 384.604
b) Total poultry ‘000 1241.814 1260.298
5 Forest (FSI Report) 2011 2013
a) Area under dense forest Sq. Km 6,220 5,971
b) Area under open forest Sq. Km 12,897 12,690
6 Electricity 2012-13 2013-14
a) Installed Capacity MW 52.47 52.77
b) Gross Generation MW 398.71 480.31
c) Power Purchased * MU 407.08 424.97
d) Total Consumption MW 286.52 302.783

Economic Survey Mizoram 2014-15 ~ 175 ~ Basic Indicators
Economic Survey Mizoram 2014-15
7 Industries 2012-13 2013-14
a) Registered SSI Units during No. 8,341 8,554
b) No. of farmers registered in Sericulture Family 3,880 5,058
c) No. of enterprises (as per 1998 economic census)
No. 24,943 24,943
d) No. of enterprises (as per 2005 economic census)
No. 47,378 47,378
e) Average annual growth rate of enterprise (1998 to 2005)
9.60% 9.60%
8 Cooperation 2011-12 2012-13
a) No. of Coop. Societies No. 1440 1443
b) Membership No. 50520 50865
c) Working Capital Rs. crore 547.49 548.27
9 Banking As on
30.09.2013 As on
30.09.2014
a) No. of Banks/Branches No. 140 159
b) Total Deposits Rs. crores 4257.74 4918.58
c) Total Advances Rs. crores 1968.16 2318.49
d) Credit Deposit Ratio % 46.23 47.14
10 Education 2012-13 2013-14
a) No. of Primary Schools No. 1,831 1,873
b) Enrolment in Primary Schools No. 1,61,581 1,65,051
c) No. of Middle Schools No. 1,381 1,408
d) Enrolment in Middle Schools No. 89,755 94,354
e) No. of High Schools No. 584 612
f) Enrolment in High Schools No. 38,870 41,945
g) No. of Higher Secondary Schools No. 118 127
h) Enrolment in Higher Secondary Schools No. 21,472 22,087
i) No. of Colleges No. 22 22
a) Enrolment in Colleges No. 12,008 10,767
b) No. of Universities No. 2 2
c) Enrolment in Universities No. 3,467 4,698
11 Health 2012-13 2013-14
a) No. of Hospitals (incl. Non-Government) No. 31 31
b) Community Health Centres No. 12 12
c) Primary Health Centres No. 57 57
d) Sub-Centres No. 370 370
2011 2012
e) Birth Rate Per '000 23.30 23.73
f) Death Rate Per '000 5.03 5.93
g) Infant Mortality Rate Per '000 33.67 (CRS) 35.83 (CRS)
12 Roads 2012-13 2013-14
a) Total Road Length under State PWD Kms N.A. 5870.739
b) National Highway Kms N.A. 986.530
c) State Highway Kms N.A. 310.450
d) District Road Kms N.A. 1650.800
e) Village Road Kms N.A. 1910.647
f) Town Road Kms N.A. 714.906
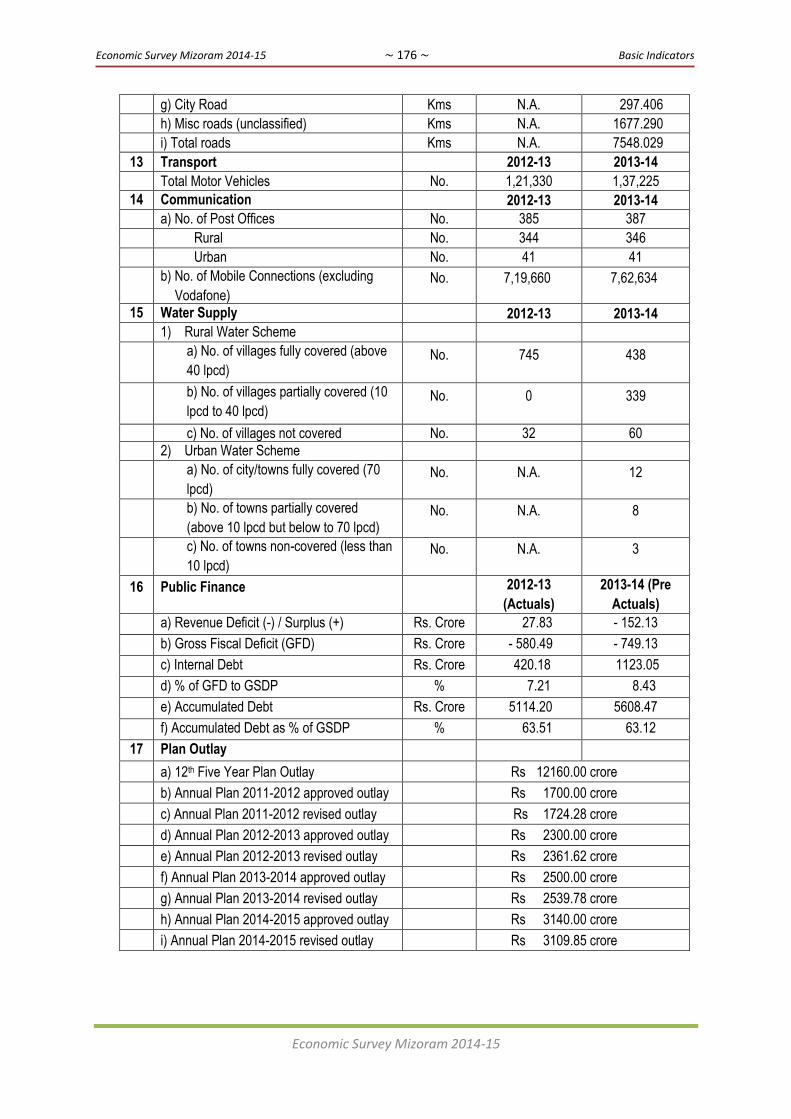
Economic Survey Mizoram 2014-15 ~ 176 ~ Basic Indicators
Economic Survey Mizoram 2014-15
g) City Road Kms N.A. 297.406
h) Misc roads (unclassified) Kms N.A. 1677.290
i) Total roads Kms N.A. 7548.029
13 Transport 2012-13 2013-14
Total Motor Vehicles No. 1,21,330 1,37,225
14 Communication 2012-13 2013-14
a) No. of Post Offices No. 385 387
Rural No. 344 346
Urban No. 41 41
b) No. of Mobile Connections (excluding
Vodafone)
No. 7,19,660 7,62,634
15 Water Supply 2012-13 2013-14
1) Rural Water Scheme
a) No. of villages fully covered (above
40 lpcd) No. 745 438
b) No. of villages partially covered (10
lpcd to 40 lpcd) No. 0 339
c) No. of villages not covered No. 32 60
2) Urban Water Scheme
a) No. of city/towns fully covered (70
lpcd) No. N.A. 12
b) No. of towns partially covered
(above 10 lpcd but below to 70 lpcd) No. N.A. 8
c) No. of towns non-covered (less than
10 lpcd) No. N.A. 3
16 Public Finance 2012-13
(Actuals)
2013-14 (Pre
Actuals)
a) Revenue Deficit (-) / Surplus (+) Rs. Crore 27.83 - 152.13
b) Gross Fiscal Deficit (GFD) Rs. Crore - 580.49 - 749.13
c) Internal Debt Rs. Crore 420.18 1123.05
d) % of GFD to GSDP % 7.21 8.43
e) Accumulated Debt Rs. Crore 5114.20 5608.47
f) Accumulated Debt as % of GSDP % 63.51 63.12
17 Plan Outlay
a) 12th Five Year Plan Outlay Rs 12160.00 crore
b) Annual Plan 2011-2012 approved outlay Rs 1700.00 crore
c) Annual Plan 2011-2012 revised outlay Rs 1724.28 crore
d) Annual Plan 2012-2013 approved outlay Rs 2300.00 crore
e) Annual Plan 2012-2013 revised outlay Rs 2361.62 crore
f) Annual Plan 2013-2014 approved outlay Rs 2500.00 crore
g) Annual Plan 2013-2014 revised outlay Rs 2539.78 crore
h) Annual Plan 2014-2015 approved outlay Rs 3140.00 crore
i) Annual Plan 2014-2015 revised outlay Rs 3109.85 crore

Economic Survey Mizoram 2014-15 ~ 177 ~ Population of Mizoram through decadal census
Economic Survey Mizoram 2014-15
Annexure-III
POPULATION OF MIZORAM THROUGH DECADAL CENSUS
Sl No.
Year Population (in nos.)
Percentage decadal variation Male Female Total
1 2 3 4 5 6
1 1901 39,004 43,430
82,434 -
2 1911 430,028 48,176
91,204 (+) 10.64
3 1921 46,652 51,754
98,406 (+) 7.90
4 1931 59,186 65,218 1,24,404 (+) 26.42
5 1941 73,855 78,931 1,52,786 (+) 22.81
6 1951 96,136 1,00,066 1,96,202 (+) 28.42
7 1961 1,32,465 1,33,598 2,66,063 (+) 35.61
8 1971 1,70,824 1,61,566 3,32,390 (+) 24.93
9 1981 2,57,239 2,36,518 4,93,757 (+) 48.55
10 1991 3,58,978 3,30,778 6,89,756 (+) 39.70
11 2001 4,59,109 4,29,464 8,88,573 (+) 28.82
12 2011 5,55,339 5,41,867 10,97,206 (+)23.48

Economic Survey Mizoram 2014-15 ~ 178 ~ District Wise Population of Mizoram
Economic Survey Mizoram 2014-15
Annexure-IV
DISTRICT-WISE POPULATION OF MIZORAM
CENSUS
YEAR SEX MAMIT KOLASIB AIZAWL CHAMPHAI SERCHHIP LUNGLEI
LAWNGTLA
I SAIHA MIZORAM
1991
MALE 34147 25425 122940 42347 23484 58331 28750 23554 358978
FEMALE 30425 23344 112939 41109 22305 53084 25450 22122 330778
PERSONS 64572 48769 235879 83456 45789 111415 54200 45676 689756
2001
MALE 33114 34562 166877 55756 27380 71402 38776 31242 459109
FEMALE 29671 31398 158799 52636 26481 65821 34844 29814 429464
PERSONS 62785 65960 325676 108392 53861 137223 73620 61056 888573
2011
MALE 44828 42918 199270 63388 32851 82891 60599 28594 555339
FEMALE 41536 41037 201039 62357 32086 78537 57295 27980 541867
PERSONS 86364 83955 400309 125745 64937 161428 117894 56574 1097206

Economic Survey Mizoram 2014-15 ~ 179 ~ Gross Domestic Product
Economic Survey Mizoram 2014-15
P=Provisional; Pr=Projected
1999-00 2000-01 2001-02 2002-03 2003-04 2004-05 2005-06 2006-07 2007-08 2008-09 2009-10 2010-11 2011-12 2012-13(P) 2013-14(Pr)
1 Agriculture 31792 31589 37113 37954 39264 36138 37848 40782 52208 64830 75931 93447 102041 112341 123681
2 Forestry & logging 1491 1666 1771 2198 2033 23867 23866 24608 25800 27090 29218 30138 31060 33872 36939
3 Fishing 1627 1782 2585 2665 3027 3020 3073 3175 2101 2145 2687 4621 4854 5747 6804
Agr and Allied 34910 35037 41469 42817 44324 63025 64787 68565 80109 94065 107836 128206 137955 151960 167424
4 Mining & quarrying 776 244 477 234 927 802 610 1084 1683 2425 1674 1796 2331 1653 1172
a Sub Total of Primary 35686 35281 41946 43051 45251 63827 65397 69649 81792 96490 109510 130002 140286 153613 168596
5 Manufacturing 2447 2617 2667 2745 3073 3767 3904 4783 5987 6002 6040 6946 7727 8642 10035
5.1 Manu-Registered 536 597 688 695 702 571 824 582 676 548 672 1145 1762 1262 904
5.2 Manu-Unregistered 1911 2020 1979 2050 2371 3196 3080 4201 5311 5454 5368 5801 5965 7380 9131
6 Construction 15205 15945 19731 22635 26940 28901 42655 45021 52065 73610 78957 80651 96516 147574 225642
7 Electricity,gas and Water supply 6567 8400 7463 9738 8110 11059 12614 13320 16610 13164 16058 21038 21972 26253 31368
b Sub Total of Secondary 24219 26962 29861 35118 38123 43727 59173 63124 74662 92776 101055 108635 126215 182469 267045
Industry 24995 27206 30338 35352 39050 44529 59783 64208 76345 95201 102729 110431 128546 184122 268217
8 Transport,storage & communication 3147 3532 3977 4437 4915 7187 7806 8836 10073 11142 11632 12735 16356 20211 25047
8.1 Railways 16 15 17 30 33 25 26 35 47 32 38 40 39 44 50
8.2 Transport by other means 2093 2526 2861 3036 3625 5592 5917 6717 7812 8674 8764 9779 13250 16795 21288
8.3 Storage 56 59 61 57 59 54 57 68 83 100 120 147 181 216 258
8.4 Communication 982 932 1038 1314 1198 1516 1806 2016 2131 2336 2710 2769 2886 3156 3451
9 Trade,hotels and restaurants 15020 14431 16852 16855 18263 25717 28852 32957 39102 45517 51723 58489 60967 71116 82954
10 Banking & Insurance 3873 4524 4530 7237 8086 7297 7714 8967 10131 11723 13544 15072 19135 19233 19332
11 Real estate,ownership of dwellings
and business services 22768 28204 31762 35835 42154 36517 42599 49681 58174 65676 74595 93731 109288 127939 149773
12 Public administration 27469 35433 39948 48598 48623 49498 49681 54875 60227 76669 97390 133127 122707 155176 196236
13 Other services 22824 25375 25777 25448 27083 34427 35893 40909 47390 57718 66536 86997 94021 106535 120715
c. Sub Total of Tertiary 95101 111499 122846 138410 149124 160643 172545 196225 225097 268445 315420 400151 422474 500210 594057
14 State domestic product (Rs. lacs) 155006 173742 194653 216579 232498 268197 297115 328998 381551 457711 525985 638788 688975 836292 1029698
15 Calculated State domestic
product (Rs. lacs) 155006 173742 194653 216579 232498 268197 297115 328998 381551 457711 525985 638788 688975 836292 1029698
16 Population 857200 879200 901700 924900 948600 972986 997943 1023540 1049794 1076721 1104338 1132665 1161717 1191514 1222075
17 State Per Capita Income (Rs.) 18083 19761 21587 23416 24510 27564 29773 32143 36345 42510 47629 56397 59307 70187 84256
18 Calculated State Per Capita
Income (Rs.) 18083 19761 21587 23416 24510 27564 29773 32143 36345 42510 47629 56397 59307 70187 84258
GROSS DOMESTIC PRODUCT AT FACTOR COST BY INDUSTRY OF ORIGIN (Rs in Lakhs)Annexure-V
Sl.
No.Sector
1999-2000 SERIES AT CURRENT PRICES 2004-2005 SERIES AT CURRENT PRICES
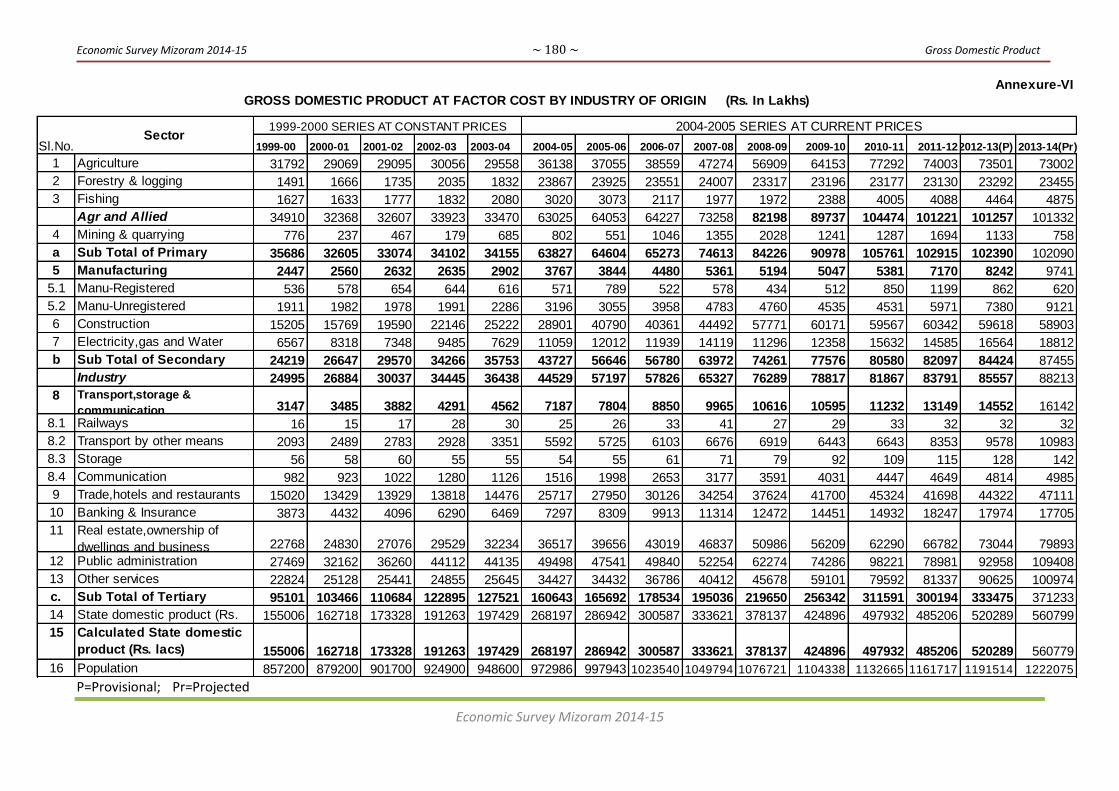
Economic Survey Mizoram 2014-15 ~ 180 ~ Gross Domestic Product
Economic Survey Mizoram 2014-15
P=Provisional; Pr=Projected
1999-00 2000-01 2001-02 2002-03 2003-04 2004-05 2005-06 2006-07 2007-08 2008-09 2009-10 2010-11 2011-122012-13(P) 2013-14(Pr)
1 Agriculture 31792 29069 29095 30056 29558 36138 37055 38559 47274 56909 64153 77292 74003 73501 73002
2 Forestry & logging 1491 1666 1735 2035 1832 23867 23925 23551 24007 23317 23196 23177 23130 23292 23455
3 Fishing 1627 1633 1777 1832 2080 3020 3073 2117 1977 1972 2388 4005 4088 4464 4875
Agr and Allied 34910 32368 32607 33923 33470 63025 64053 64227 73258 82198 89737 104474 101221 101257 101332
4 Mining & quarrying 776 237 467 179 685 802 551 1046 1355 2028 1241 1287 1694 1133 758
a Sub Total of Primary 35686 32605 33074 34102 34155 63827 64604 65273 74613 84226 90978 105761 102915 102390 102090
5 Manufacturing 2447 2560 2632 2635 2902 3767 3844 4480 5361 5194 5047 5381 7170 8242 9741
5.1 Manu-Registered 536 578 654 644 616 571 789 522 578 434 512 850 1199 862 620
5.2 Manu-Unregistered 1911 1982 1978 1991 2286 3196 3055 3958 4783 4760 4535 4531 5971 7380 9121
6 Construction 15205 15769 19590 22146 25222 28901 40790 40361 44492 57771 60171 59567 60342 59618 58903
7 Electricity,gas and Water
supply
6567 8318 7348 9485 7629 11059 12012 11939 14119 11296 12358 15632 14585 16564 18812
b Sub Total of Secondary 24219 26647 29570 34266 35753 43727 56646 56780 63972 74261 77576 80580 82097 84424 87455
Industry 24995 26884 30037 34445 36438 44529 57197 57826 65327 76289 78817 81867 83791 85557 88213
8 Transport,storage &
communication 3147 3485 3882 4291 4562 7187 7804 8850 9965 10616 10595 11232 13149 14552 16142
8.1 Railways 16 15 17 28 30 25 26 33 41 27 29 33 32 32 32
8.2 Transport by other means 2093 2489 2783 2928 3351 5592 5725 6103 6676 6919 6443 6643 8353 9578 10983
8.3 Storage 56 58 60 55 55 54 55 61 71 79 92 109 115 128 142
8.4 Communication 982 923 1022 1280 1126 1516 1998 2653 3177 3591 4031 4447 4649 4814 4985
9 Trade,hotels and restaurants 15020 13429 13929 13818 14476 25717 27950 30126 34254 37624 41700 45324 41698 44322 47111
10 Banking & Insurance 3873 4432 4096 6290 6469 7297 8309 9913 11314 12472 14451 14932 18247 17974 17705
11 Real estate,ownership of
dwellings and business 22768 24830 27076 29529 32234 36517 39656 43019 46837 50986 56209 62290 66782 73044 79893
12 Public administration 27469 32162 36260 44112 44135 49498 47541 49840 52254 62274 74286 98221 78981 92958 109408
13 Other services 22824 25128 25441 24855 25645 34427 34432 36786 40412 45678 59101 79592 81337 90625 100974
c. Sub Total of Tertiary 95101 103466 110684 122895 127521 160643 165692 178534 195036 219650 256342 311591 300194 333475 371233
14 State domestic product (Rs.
lacs)
155006 162718 173328 191263 197429 268197 286942 300587 333621 378137 424896 497932 485206 520289 560799
15 Calculated State domestic
product (Rs. lacs) 155006 162718 173328 191263 197429 268197 286942 300587 333621 378137 424896 497932 485206 520289 560779
16 Population 857200 879200 901700 924900 948600 972986 997943 1023540 1049794 1076721 1104338 1132665 1161717 1191514 1222075
GROSS DOMESTIC PRODUCT AT FACTOR COST BY INDUSTRY OF ORIGIN (Rs. In Lakhs)
1999-2000 SERIES AT CONSTANT PRICESSector
Sl.No.
2004-2005 SERIES AT CURRENT PRICES
Annexure-VI

Economic Survey Mizoram 2014-15 ~ 181 ~ Net State Domestic Product
Economic Survey Mizoram 2014-15
Annexure VII Net State Domestic Product at Current Prices (2004-05 Series)
As on 01.08.2014
(Rs. in Crore)
Sl. No. State\UT 2004-05 2005-06 2006-07 2007-08 2008-09 2009-10 2010-11 2011-12 2012-13 2013-14
1 2 3 4 5 6 7 8 9 10 11 12
1 Andhra Pradesh (undivided) 201303 229367 269120 325955 384005 427560 524695 594117 678524 770225
2 Arunachal Pradesh 3188 3439 3765 4407 5199 6840 8352 9632 10941 12468
3 Assam 47181 52440 57033 62342 71478 85253 100627 112126 126149 146199
4 Bihar 70167 74144 91331 102853 129690 148151 185745 222442 271439 315529
5 Chhattisgarh 41387 45664 57536 69348 82809 84196 102912 123333 137756 154488
6 Goa 10999 12488 14394 17045 22149 25224 29387 38061 37035 na
7 Gujarat 172265 206440 240733 281579 314485 371187 454853 518560 584367 na
8 Haryana 86222 97903 116104 136584 164636 203855 237163 273192 310990 350167
9 Himachal Pradesh 21189 23743 26247 28873 33115 39141 46216 51885 58489 64995
10 Jammu & Kashmir 23292 25278 27652 30720 34290 38718 46740 55174 62449 70874
11 Jharkhand 53056 53358 58512 74388 76234 87112 108652 115975 129402 150333
12 Karnataka 148729 174911 203819 243028 278534 300747 368338 406821 462395 516516
13 Kerala 104776 120269 135104 153981 180134 206070 233177 272065 309332 na
14 Madhya Pradesh 99940 109612 127663 142917 175503 202225 232794 276789 333010 406055
15 Maharashtra 370023 437103 526910 619884 677781 770794 950771 1064689 1196754 1333684
16 Manipur 4603 5138 5504 6048 6612 7372 8020 9746 10919 na
17 Meghalaya 5846 6461 7701 8619 10341 11122 12852 15144 16070 18504
18 Mizoram 2400 2664 2944 3411 4154 4717 5772 6230 7556 9302*
19 Nagaland 5421 6116 6728 7477 8784 9711 10850 12788 14441 16328
20 Odisha 67987 73550 87921 111109 127516 135837 164760 176822 210683 235166
21 Punjab 86108 95902 113013 135706 154827 176187 202025 227387 251852 281128
22 Rajasthan 112636 125333 151428 172250 203939 233767 300907 361067 410834 459322

Economic Survey Mizoram 2014-15 ~ 182 ~ Net State Domestic Product
Economic Survey Mizoram 2014-15
Sl. No. State\UT 2004-05 2005-06 2006-07 2007-08 2008-09 2009-10 2010-11 2011-12 2012-13 2013-14
1 2 3 4 5 6 7 8 9 10 11 12
23 Sikkim 1511 1733 1871 2139 2796 5463 6636 8029 9432 11137
24 Tamil Nadu 193645 228846 276711 313812 359391 430013 527912 602851 671728 771762
25 Tripura 8170 9040 9981 10808 12509 14162 16573 19690 22453 na
26 Uttar Pradesh 231029 258643 296767 335810 392771 463583 532218 609924 693539 789483
27 Uttarakhand 22288 26968 32670 40279 48616 61138 72970 85602 93730 106512
28 West Bengal 190029 209726 238629 273557 310530 362517 421231 480376 557092 635784
29 Andaman & Nicobar Islands 1633 1848 2296 2715 3168 3742 3939 4500 5031 5672
30 Chandigarh 7610 9179 11074 12327 13745 15739 17883 20259 21998 25489
31 Delhi 94717 109127 128276 149519 178822 205376 241234 282717 332521 387097
32 Puducherry 5033 7135 7429 8179 8908 11085 11786 13034 14771 19754
All-India NDP(2004-05 base) 2651573 3026782 3534547 4097390 4738369 5449104 6488641 7511795 8372744 9299345
Source: For Sl. No. 1-32 — Directorate of Economics & Statistics of respective State Governments, and for All-India — Central Statistics Office
na : Not released as on August 01, 2014
Notes: 1.Estimates for the years 2004-05 to 2012-13 have been discussed by CSO with the state DES
2.State Estimates have not yet been compiled on 2011-12 base
3. * Projected figure

Economic Survey Mizoram 2014-15 ~ 183 ~ Per Capita Net State Domestic Product
Economic Survey Mizoram 2014-15
Annexure VIII Per Capita Net State Domestic Product at Current Prices (2004-05 Series)
As on 01.08.2014
(Rs.)
Sl. No. State\UT 2004-05 2005-06 2006-07 2007-08 2008-09 2009-10 2010-11 2011-12 2012-13 2013-14
1 2 3 4 5 6 7 8 9 10 11 12
1 Andhra Pradesh (undivided) 25321 28539 33135 39727 46345 51114 62148 69742 78958 88876
2 Arunachal Pradesh 26721 28171 30132 34466 39726 51068 60935 68667 76218 84869
3 Assam 16782 18396 19737 21290 24099 28383 33087 36415 40475 46354
4 Bihar 7914 8223 9967 11051 13728 15457 19111 22582 27202 31229
5 Chhattisgarh 18559 20117 24800 29385 34360 34366 41165 48366 52983 58297
6 Goa 76968 84721 94882 108708 135966 149164 168024 211570 200514 na
7 Gujarat 32021 37780 43395 50016 55068 64097 77485 87175 96976 na
8 Haryana 37972 42309 49261 56917 67405 82037 93852 106358 119158 132089
9 Himachal Pradesh 33348 36949 40393 43966 49903 58402 68297 75185 83899 92300
10 Jammu & Kashmir 21734 23240 25059 27448 30212 33650 40089 46734 52250 58593
11 Jharkhand 18510 18326 19789 24789 25046 28223 34721 36554 40238 46131
12 Karnataka 26882 31239 35981 42419 48084 51364 62251 68053 76578 84709
13 Kerala 31871 36276 40419 45700 53046 60226 67652 78387 88527 na
14 Madhya Pradesh 15442 16631 19028 20935 25278 28651 32453 37979 44989 54030
15 Maharashtra 36077 41965 49831 57760 62234 69765 84858 93748 103991 114392
16 Manipur 18640 20395 21423 23090 24764 27093 28931 34518 36937 na
17 Meghalaya 24086 26284 30952 34229 40583 43142 49261 50316 52090 58522
18 Mizoram 24662 26698 28764 32488 38582 42715 50956 53624 63413 76120*
19 Nagaland 30441 33792 36568 39985 46207 50263 55582 63781 70274 77529
20 Odisha 17650 18846 22237 27735 31416 33029 39537 41876 49241 54241
21 Punjab 33103 36199 41883 49380 55315 61805 69582 76895 84526 92638
22 Rajasthan 18565 20275 24055 26882 31279 35254 44644 52735 59097 65098
23 Sikkim 26690 30252 32199 36448 46983 90749 108972 130127 151395 176491
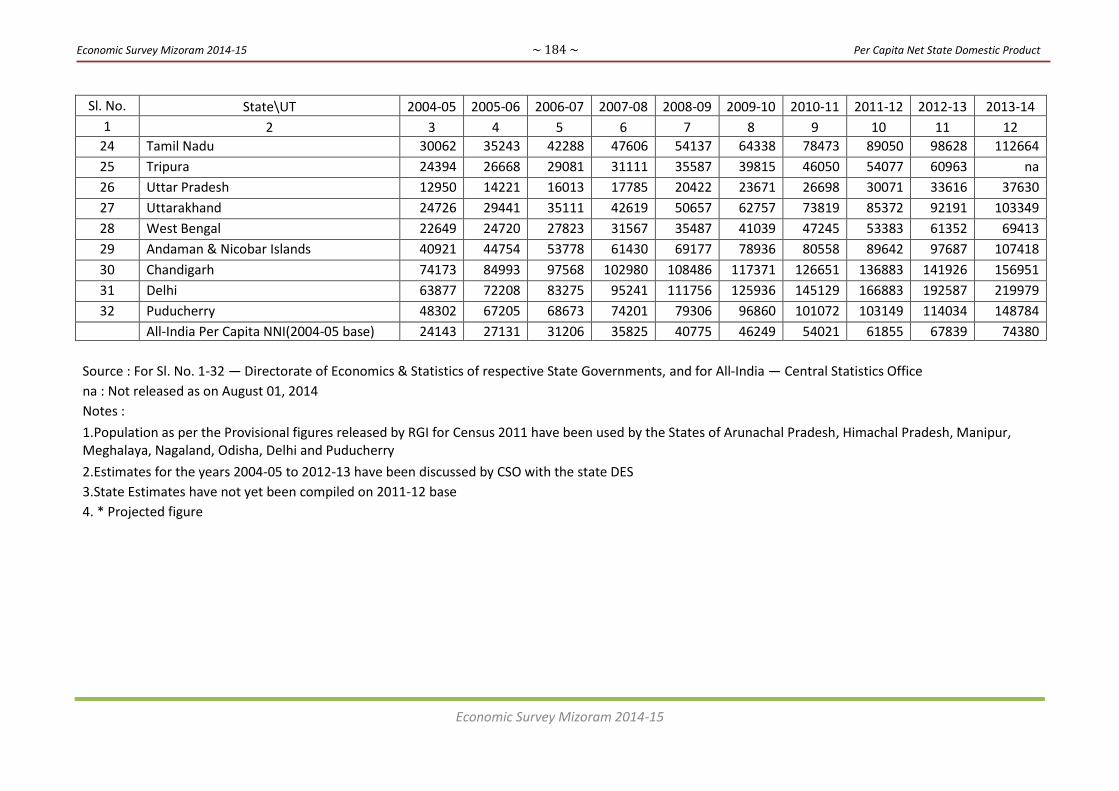
Economic Survey Mizoram 2014-15 ~ 184 ~ Per Capita Net State Domestic Product
Economic Survey Mizoram 2014-15
Sl. No. State\UT 2004-05 2005-06 2006-07 2007-08 2008-09 2009-10 2010-11 2011-12 2012-13 2013-14
1 2 3 4 5 6 7 8 9 10 11 12
24 Tamil Nadu 30062 35243 42288 47606 54137 64338 78473 89050 98628 112664
25 Tripura 24394 26668 29081 31111 35587 39815 46050 54077 60963 na
26 Uttar Pradesh 12950 14221 16013 17785 20422 23671 26698 30071 33616 37630
27 Uttarakhand 24726 29441 35111 42619 50657 62757 73819 85372 92191 103349
28 West Bengal 22649 24720 27823 31567 35487 41039 47245 53383 61352 69413
29 Andaman & Nicobar Islands 40921 44754 53778 61430 69177 78936 80558 89642 97687 107418
30 Chandigarh 74173 84993 97568 102980 108486 117371 126651 136883 141926 156951
31 Delhi 63877 72208 83275 95241 111756 125936 145129 166883 192587 219979
32 Puducherry 48302 67205 68673 74201 79306 96860 101072 103149 114034 148784
All-India Per Capita NNI(2004-05 base) 24143 27131 31206 35825 40775 46249 54021 61855 67839 74380
Source : For Sl. No. 1-32 — Directorate of Economics & Statistics of respective State Governments, and for All-India — Central Statistics Office
na : Not released as on August 01, 2014
Notes :
1.Population as per the Provisional figures released by RGI for Census 2011 have been used by the States of Arunachal Pradesh, Himachal Pradesh, Manipur, Meghalaya, Nagaland, Odisha, Delhi and Puducherry
2.Estimates for the years 2004-05 to 2012-13 have been discussed by CSO with the state DES
3.State Estimates have not yet been compiled on 2011-12 base
4. * Projected figure
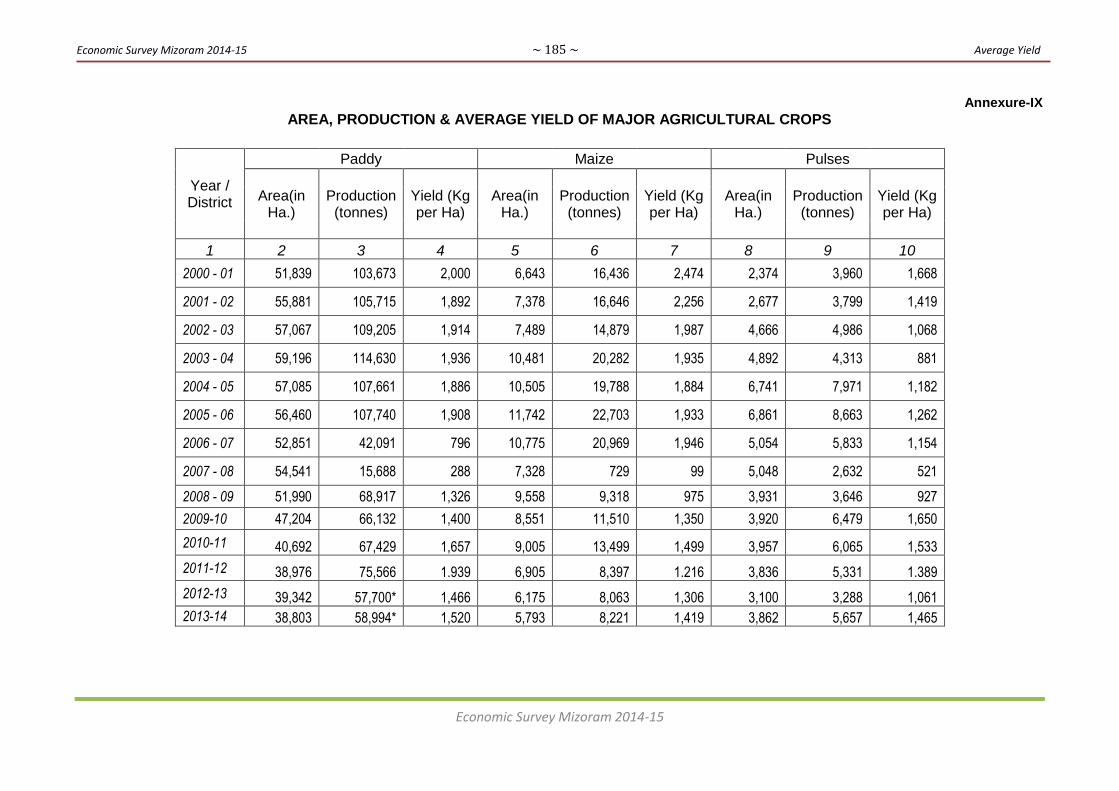
Economic Survey Mizoram 2014-15 ~ 185 ~ Average Yield
Economic Survey Mizoram 2014-15
Annexure-IX
AREA, PRODUCTION & AVERAGE YIELD OF MAJOR AGRICULTURAL CROPS
Year / District
Paddy Maize Pulses
Area(in Ha.)
Production (tonnes)
Yield (Kg per Ha)
Area(in Ha.)
Production (tonnes)
Yield (Kg per Ha)
Area(in Ha.)
Production (tonnes)
Yield (Kg per Ha)
1 2 3 4 5 6 7 8 9 10
2000 - 01 51,839 103,673 2,000 6,643 16,436 2,474 2,374 3,960 1,668
2001 - 02 55,881 105,715 1,892 7,378 16,646 2,256 2,677 3,799 1,419
2002 - 03 57,067 109,205 1,914 7,489 14,879 1,987 4,666 4,986 1,068
2003 - 04 59,196 114,630 1,936 10,481 20,282 1,935 4,892 4,313 881
2004 - 05 57,085 107,661 1,886 10,505 19,788 1,884 6,741 7,971 1,182
2005 - 06 56,460 107,740 1,908 11,742 22,703 1,933 6,861 8,663 1,262
2006 - 07 52,851 42,091 796 10,775 20,969 1,946 5,054 5,833 1,154
2007 - 08 54,541 15,688 288 7,328 729 99 5,048 2,632 521
2008 - 09 51,990 68,917 1,326 9,558 9,318 975 3,931 3,646 927
2009-10 47,204 66,132 1,400 8,551 11,510 1,350 3,920 6,479 1,650
2010-11 40,692 67,429 1,657 9,005 13,499 1,499 3,957 6,065 1,533
2011-12 38,976 75,566 1.939 6,905 8,397 1.216 3,836 5,331 1.389
2012-13 39,342 57,700* 1,466 6,175 8,063 1,306 3,100 3,288 1,061
2013-14 38,803 58,994* 1,520 5,793 8,221 1,419 3,862 5,657 1,465
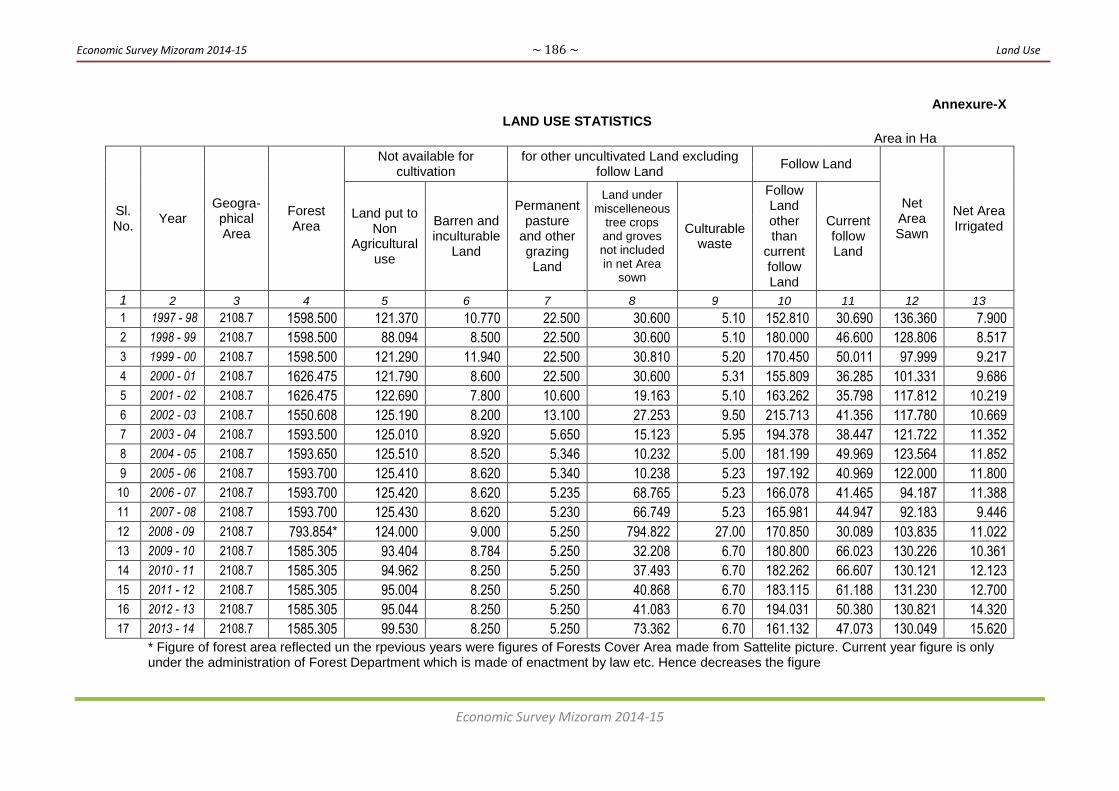
Economic Survey Mizoram 2014-15 ~ 186 ~ Land Use
Economic Survey Mizoram 2014-15
Annexure-X
LAND USE STATISTICS
Area in Ha
Sl. No.
Year Geogra- phical Area
Forest Area
Not available for cultivation
for other uncultivated Land excluding follow Land
Follow Land
Net Area Sawn
Net Area Irrigated
Land put to Non
Agricultural use
Barren and inculturable
Land
Permanent pasture
and other grazing Land
Land under miscelleneous
tree crops and groves not included in net Area
sown
Culturable waste
Follow Land other than
current follow Land
Current follow Land
1 2 3 4 5 6 7 8 9 10 11 12 13
1 1997 - 98 2108.7 1598.500 121.370 10.770 22.500 30.600 5.10 152.810 30.690 136.360 7.900
2 1998 - 99 2108.7 1598.500 88.094 8.500 22.500 30.600 5.10 180.000 46.600 128.806 8.517
3 1999 - 00 2108.7 1598.500 121.290 11.940 22.500 30.810 5.20 170.450 50.011 97.999 9.217
4 2000 - 01 2108.7 1626.475 121.790 8.600 22.500 30.600 5.31 155.809 36.285 101.331 9.686
5 2001 - 02 2108.7 1626.475 122.690 7.800 10.600 19.163 5.10 163.262 35.798 117.812 10.219
6 2002 - 03 2108.7 1550.608 125.190 8.200 13.100 27.253 9.50 215.713 41.356 117.780 10.669
7 2003 - 04 2108.7 1593.500 125.010 8.920 5.650 15.123 5.95 194.378 38.447 121.722 11.352
8 2004 - 05 2108.7 1593.650 125.510 8.520 5.346 10.232 5.00 181.199 49.969 123.564 11.852
9 2005 - 06 2108.7 1593.700 125.410 8.620 5.340 10.238 5.23 197.192 40.969 122.000 11.800
10 2006 - 07 2108.7 1593.700 125.420 8.620 5.235 68.765 5.23 166.078 41.465 94.187 11.388
11 2007 - 08 2108.7 1593.700 125.430 8.620 5.230 66.749 5.23 165.981 44.947 92.183 9.446
12 2008 - 09 2108.7 793.854* 124.000 9.000 5.250 794.822 27.00 170.850 30.089 103.835 11.022
13 2009 - 10 2108.7 1585.305 93.404 8.784 5.250 32.208 6.70 180.800 66.023 130.226 10.361
14 2010 - 11 2108.7 1585.305 94.962 8.250 5.250 37.493 6.70 182.262 66.607 130.121 12.123
15 2011 - 12 2108.7 1585.305 95.004 8.250 5.250 40.868 6.70 183.115 61.188 131.230 12.700
16 2012 - 13 2108.7 1585.305 95.044 8.250 5.250 41.083 6.70 194.031 50.380 130.821 14.320
17 2013 - 14 2108.7 1585.305 99.530 8.250 5.250 73.362 6.70 161.132 47.073 130.049 15.620
* Figure of forest area reflected un the rpevious years were figures of Forests Cover Area made from Sattelite picture. Current year figure is only under the administration of Forest Department which is made of enactment by law etc. Hence decreases the figure
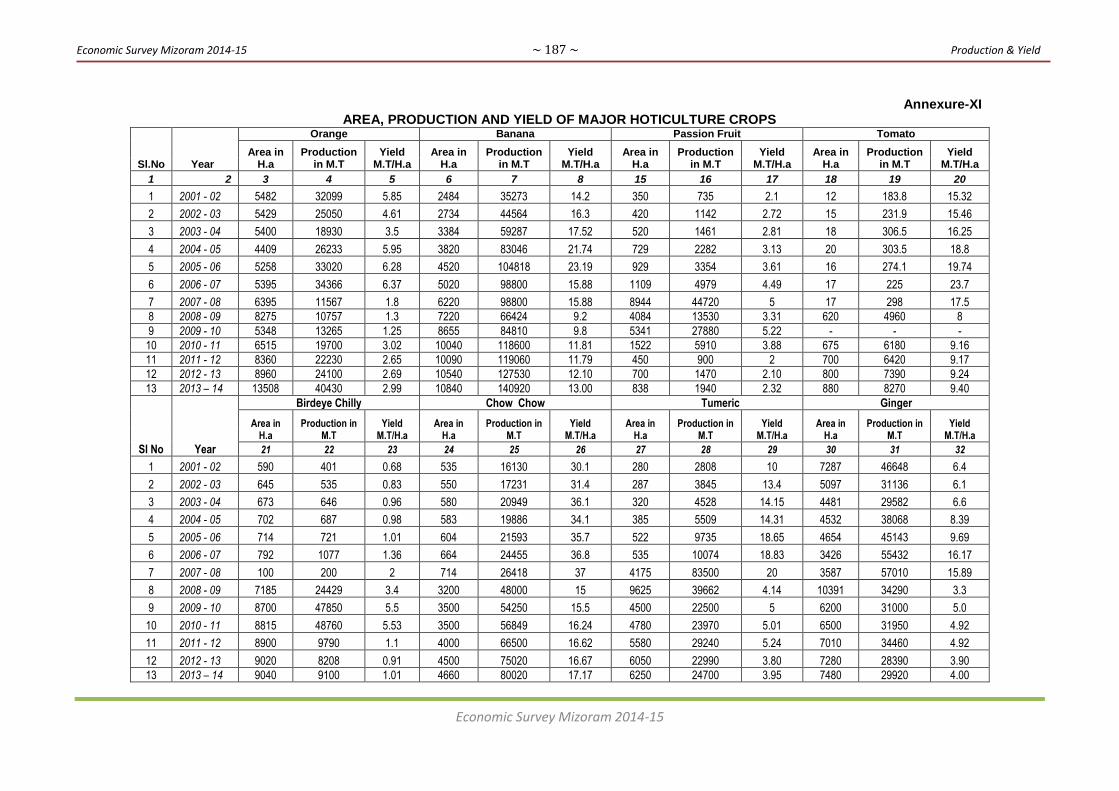
Economic Survey Mizoram 2014-15 ~ 187 ~ Production & Yield
Economic Survey Mizoram 2014-15
Annexure-XI AREA, PRODUCTION AND YIELD OF MAJOR HOTICULTURE CROPS
Sl.No Year
Orange Banana Passion Fruit Tomato
Area in H.a
Production in M.T
Yield M.T/H.a
Area in H.a
Production in M.T
Yield M.T/H.a
Area in H.a
Production in M.T
Yield M.T/H.a
Area in H.a
Production in M.T
Yield M.T/H.a
1 2 3 4 5 6 7 8 15 16 17 18 19 20
1 2001 - 02 5482 32099 5.85 2484 35273 14.2 350 735 2.1 12 183.8 15.32
2 2002 - 03 5429 25050 4.61 2734 44564 16.3 420 1142 2.72 15 231.9 15.46
3 2003 - 04 5400 18930 3.5 3384 59287 17.52 520 1461 2.81 18 306.5 16.25
4 2004 - 05 4409 26233 5.95 3820 83046 21.74 729 2282 3.13 20 303.5 18.8
5 2005 - 06 5258 33020 6.28 4520 104818 23.19 929 3354 3.61 16 274.1 19.74
6 2006 - 07 5395 34366 6.37 5020 98800 15.88 1109 4979 4.49 17 225 23.7
7 2007 - 08 6395 11567 1.8 6220 98800 15.88 8944 44720 5 17 298 17.5
8 2008 - 09 8275 10757 1.3 7220 66424 9.2 4084 13530 3.31 620 4960 8
9 2009 - 10 5348 13265 1.25 8655 84810 9.8 5341 27880 5.22 - - -
10 2010 - 11 6515 19700 3.02 10040 118600 11.81 1522 5910 3.88 675 6180 9.16
11 2011 - 12 8360 22230 2.65 10090 119060 11.79 450 900 2 700 6420 9.17
12 2012 - 13 8960 24100 2.69 10540 127530 12.10 700 1470 2.10 800 7390 9.24
13 2013 – 14 13508 40430 2.99 10840 140920 13.00 838 1940 2.32 880 8270 9.40
Sl No Year
Birdeye Chilly Chow Chow Tumeric Ginger
Area in H.a
Production in M.T
Yield M.T/H.a
Area in H.a
Production in M.T
Yield M.T/H.a
Area in H.a
Production in M.T
Yield M.T/H.a
Area in H.a
Production in M.T
Yield M.T/H.a
21 22 23 24 25 26 27 28 29 30 31 32
1 2001 - 02 590 401 0.68 535 16130 30.1 280 2808 10 7287 46648 6.4
2 2002 - 03 645 535 0.83 550 17231 31.4 287 3845 13.4 5097 31136 6.1
3 2003 - 04 673 646 0.96 580 20949 36.1 320 4528 14.15 4481 29582 6.6
4 2004 - 05 702 687 0.98 583 19886 34.1 385 5509 14.31 4532 38068 8.39
5 2005 - 06 714 721 1.01 604 21593 35.7 522 9735 18.65 4654 45143 9.69
6 2006 - 07 792 1077 1.36 664 24455 36.8 535 10074 18.83 3426 55432 16.17
7 2007 - 08 100 200 2 714 26418 37 4175 83500 20 3587 57010 15.89
8 2008 - 09 7185 24429 3.4 3200 48000 15 9625 39662 4.14 10391 34290 3.3
9 2009 - 10 8700 47850 5.5 3500 54250 15.5 4500 22500 5 6200 31000 5.0
10 2010 - 11 8815 48760 5.53 3500 56849 16.24 4780 23970 5.01 6500 31950 4.92
11 2011 - 12 8900 9790 1.1 4000 66500 16.62 5580 29240 5.24 7010 34460 4.92
12 2012 - 13 9020 8208 0.91 4500 75020 16.67 6050 22990 3.80 7280 28390 3.90
13 2013 – 14 9040 9100 1.01 4660 80020 17.17 6250 24700 3.95 7480 29920 4.00

Economic Survey Mizoram 2014-15 ~ 188 ~ No. of Vehicles
Economic Survey Mizoram 2014-15
Annexure-XII
1998-
1999
1999-
2000
2000-
2001
2001-
2002
2002-
2003
2003-
2004
2004-
2005
2005-
2006
2006-
2007
2007-
2008
2008-
2009
2009-
2010
2010-
2011
2011-
2012
2012-
2013
2013-
2014
1 2 3 4 5 6 7 8 9 10 11 12 13 14 15 15 16 17
1 Two wheeler 9926 11267 12945 14499 16267 18786 21132 23993 26350 29571 34396 41939 49962 59360 69509 79737
2 Auto
Rickshaw[Passenger
53 216 450 623 863 1148 1336 1534 1736 1941 2103 2217 2475 2955 3552 4303
3 Auto
Rickshaw[Goods]
5 17 38 47 65 65 70 113 118
4 Motor cab 1737 2012 2480 2728 2952 3301 3593 4110 4722 4436 4697 5050 5594 6237 6954 7755
5 Maxi cab 45 110 264 333 407 550 723 878 1022 1137 1297 1416 1653 1946 2270 2650
6 Motor cars 2020 2494 2923 3476 3896 4741 5311 6014 6702 8753 9697 10721 11896 13577 15283 16841
7 Jeep 1796 1858 2027 2127 2238 2316 2406 2524 2665 6257 6908 7456 8197 9090 10107 11563
8 Gypsy 1203 1712 1799 1863 1928 2019 2106 2204 2197 2692 2739 2766 2807 2829 2853 2867
9 Stage carriage
[Buses]
414 442 493 524 551 575 672 704 744 728 760 786 807 850 886 900
10 Ambulance 1 1 1 4 5 10 16 19
11 Fire fighter 1 1 1 1
12 Recovery van 2 8 8 9 10 13 13 14
13 Truck & Lorries 2210 2377 2586 2787 3012 3498 3966 4317 4659 2688 2901 3047 3379 3812 4145 4490
14 Tractor 147 146 158 169 175 178 196 205 214 181 187 194 218 238 249 273
15 Trailer 83 83 85 91 95 93 103 107 112 72 73 77 79 79 79 80
16 Excavator 3 29 54 95 158 217 349 405 470 573 709 808 956
17 Mac Crane / Road
Roller
1 5 2 3 7 9 709 16 16
18 Others 37 46 48 48 13 49 56
19 TOTAL (PRIVATE) 19634 22717 26210 29223 32413 37259 41639 46754 51365 58891 66268 76272 87778 101782 116903 132639
20 GOVERNMENT
VEHICLE (All type) 3994 2084 2287 2495 2672 2613 2552 2733 2823 3441 3609 3911 4144 4270 4427 4586
21 GRAND TOTAL 23628 24801 28497 31718 35085 39872 44191 49487 54188 62332 69877 80183 91922 106052 121330 137225
Sl.
No.
PRIVATE
Category
NUMBER OF VEHICLES ON ROAD UPTO 31ST MARCH 2014
Y E A R S
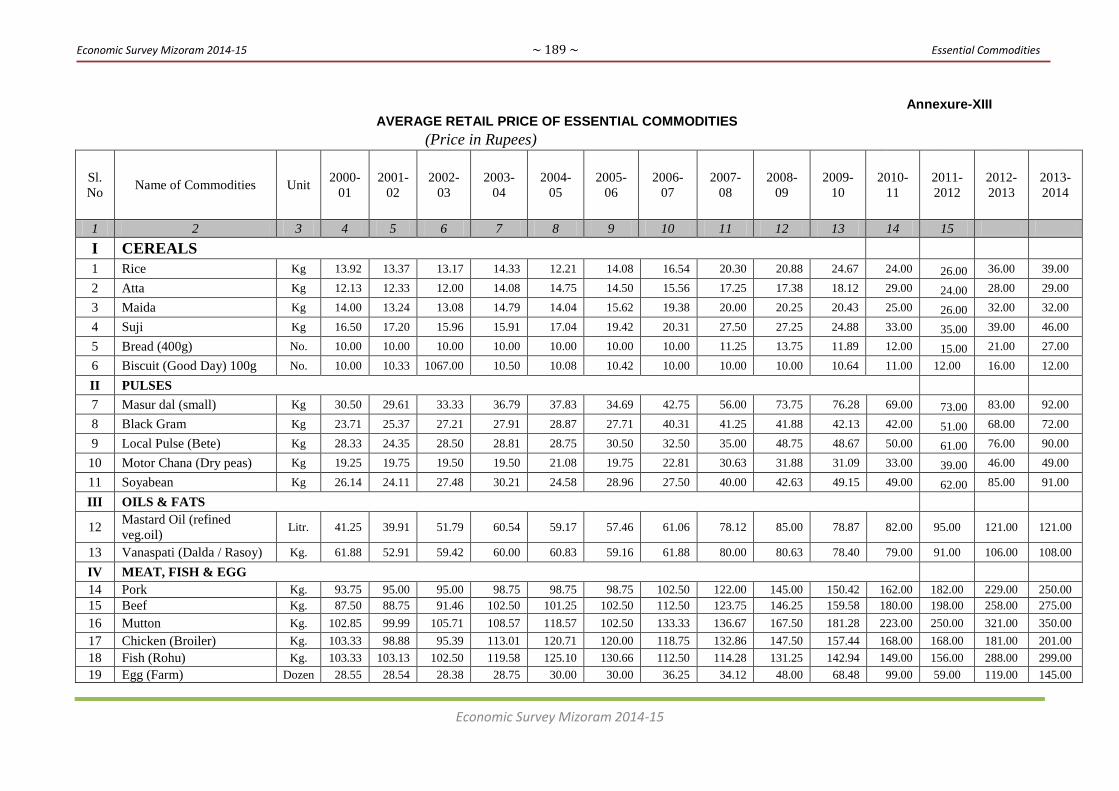
Economic Survey Mizoram 2014-15 ~ 189 ~ Essential Commodities
Economic Survey Mizoram 2014-15
Annexure-XIII
AVERAGE RETAIL PRICE OF ESSENTIAL COMMODITIES
(Price in Rupees)
Sl.
No Name of Commodities Unit
2000-
01
2001-
02
2002-
03
2003-
04
2004-
05
2005-
06
2006-
07
2007-
08
2008-
09
2009-
10
2010-
11
2011-
2012
2012-
2013
2013-
2014
1 2 3 4 5 6 7 8 9 10 11 12 13 14 15
I CEREALS
1 Rice Kg 13.92 13.37 13.17 14.33 12.21 14.08 16.54 20.30 20.88 24.67 24.00 26.00 36.00 39.00
2 Atta Kg 12.13 12.33 12.00 14.08 14.75 14.50 15.56 17.25 17.38 18.12 29.00 24.00 28.00 29.00
3 Maida Kg 14.00 13.24 13.08 14.79 14.04 15.62 19.38 20.00 20.25 20.43 25.00 26.00 32.00 32.00
4 Suji Kg 16.50 17.20 15.96 15.91 17.04 19.42 20.31 27.50 27.25 24.88 33.00 35.00 39.00 46.00
5 Bread (400g) No. 10.00 10.00 10.00 10.00 10.00 10.00 10.00 11.25 13.75 11.89 12.00 15.00 21.00 27.00
6 Biscuit (Good Day) 100g No. 10.00 10.33 1067.00 10.50 10.08 10.42 10.00 10.00 10.00 10.64 11.00 12.00 16.00 12.00
II PULSES
7 Masur dal (small) Kg 30.50 29.61 33.33 36.79 37.83 34.69 42.75 56.00 73.75 76.28 69.00 73.00 83.00 92.00
8 Black Gram Kg 23.71 25.37 27.21 27.91 28.87 27.71 40.31 41.25 41.88 42.13 42.00 51.00 68.00 72.00
9 Local Pulse (Bete) Kg 28.33 24.35 28.50 28.81 28.75 30.50 32.50 35.00 48.75 48.67 50.00 61.00 76.00 90.00
10 Motor Chana (Dry peas) Kg 19.25 19.75 19.50 19.50 21.08 19.75 22.81 30.63 31.88 31.09 33.00 39.00 46.00 49.00
11 Soyabean Kg 26.14 24.11 27.48 30.21 24.58 28.96 27.50 40.00 42.63 49.15 49.00 62.00 85.00 91.00
III OILS & FATS
12 Mastard Oil (refined
veg.oil) Litr. 41.25 39.91 51.79 60.54 59.17 57.46 61.06 78.12 85.00 78.87 82.00 95.00 121.00 121.00
13 Vanaspati (Dalda / Rasoy) Kg. 61.88 52.91 59.42 60.00 60.83 59.16 61.88 80.00 80.63 78.40 79.00 91.00 106.00 108.00
IV MEAT, FISH & EGG
14 Pork Kg. 93.75 95.00 95.00 98.75 98.75 98.75 102.50 122.00 145.00 150.42 162.00 182.00 229.00 250.00
15 Beef Kg. 87.50 88.75 91.46 102.50 101.25 102.50 112.50 123.75 146.25 159.58 180.00 198.00 258.00 275.00
16 Mutton Kg. 102.85 99.99 105.71 108.57 118.57 102.50 133.33 136.67 167.50 181.28 223.00 250.00 321.00 350.00
17 Chicken (Broiler) Kg. 103.33 98.88 95.39 113.01 120.71 120.00 118.75 132.86 147.50 157.44 168.00 168.00 181.00 201.00
18 Fish (Rohu) Kg. 103.33 103.13 102.50 119.58 125.10 130.66 112.50 114.28 131.25 142.94 149.00 156.00 288.00 299.00
19 Egg (Farm) Dozen 28.55 28.54 28.38 28.75 30.00 30.00 36.25 34.12 48.00 68.48 99.00 59.00 119.00 145.00

Economic Survey Mizoram 2014-15 ~ 190 ~ Essential Commodities
Economic Survey Mizoram 2014-15
V MILK & ITS PRODUCTION
20 Milk (Private) Lit. 23.00 23.33 23.87 24.58 26.87 28.87 28.87 27.62 30.63 32.73 39.00 42.00 50.00 53.00
21 Everyday (milk powder) Kg 69.12 69.21 68.83 69.50 74.62 77.08 88.75 101.87 110.88 111.66 134.00 160.00 180.00 179.00
22 Amul Butter (100g.) No. 15.75 15.04 14.92 15.16 15.04 16.17 16.25 19.25 19.75 20.63 27.00 30.00 34.00 39.00
VI CONDIMENTS & SPICES
23 Salt (Tata) Kg 7.87 7.96 9 8.5 9.17 9.25 9.88 10 11.25 11.72 14.00 15.00 19.00 19.00
24 Turmeric (100g) Gram 9.37 9.38 10 10 10.12 9.79 10.66 9.37 10.88 11.09 20.00 22.00 24.00 23.00
25 Garlic Kg 38.12 61 54.75 57.7 50.41 57.29 82.5 69.28 68.75 87.51 172.00 140.00 141.00 143.00
26 Ginger Kg 13.25 13.66 10.79 10.54 16.29 16.25 12.5 12.12 21.88 21.25 30.00 30.00 49.00 74.00
27 Chilly Powder (100g.) Gram 9.5 10.66 12.29 8 9.83 9.42 10.63 20 20.25 17.56 18.00 22.00 28.00 24.00
VII VEGETABLES
28 Potato Kg 10.7 13.04 12.77 10.8 11.83 13.54 12.69 12.5 14.5 22.42 18.00 22.00 31.00 44.00
29 Onion Kg 16.25 16.91 15.92 21.37 19.41 22.83 22.83 19.37 27.5 30.58 45.00 24.00 79.00 53.00
30 Brinjal Kg 12 14.53 15.46 15.1 13.79 16.44 20 24.14 30.59 26.58 38.00 41.00 48.00 48.00
31 Tomato Kg 20.48 33.2 31.4 27.64 26.45 27.75 30.62 30.62 33.35 49.48 43.00 67.00 69.00 70.00
32 French Bean Kg 24.28 26.35 25.42 22.12 25.21 24.58 29.69 26.87 39.38 40.48 49.00 62.00 69.00 76.00
33 Bitter Guard Kg 27.25 26.25 30.38 29.68 30 27.22 32.5 37.5 39.38 40.93 36.00 60.00 71.00 62.00
34 Chilly Green Kg 46.66 41.59 37.2 26.56 37.38 32.91 45 66.25 94.38 93.49 69.00 99.00 119.00 124.00
35 Squash Kg 20 11.87 12.14 11.8 12.67 12.98 17.5 20 19.17 16.82 21.00 24.00 27.00 28.00
36 Mustard Leaf Kg 20.71 21.5 22 23.75 23.96 18.54 21.56 20 27.5 26.14 45.00 49.00 43.00
37 Pumpkin Leaf Kg 21.5 22.5 23 24 24 24 24 21.25 28.75 26.76 36.00 45.00 51.00 50.00
38 Cowpea Leaf (Behlawi) Kg 24 23 22 22 23 24 24 30 25 27.23 35.00 42.00 53.00 53.00
VIII FRUITS
39 Banana Dozen 27 26.4 23.52 23.16 26.52 30 27 24 29.28 25.88 36.00 48.00 72.00 96.00
40 Pineapple Kg 12.5 10 15 8.25 10 12 12 15 18.75 15.48 30.00 29.00 31.00 37.00
IX BEVERAGE
41 Sugar Kg 20.06 20 20.17 20 23.12 24.71 25 23.62 27.25 34.43 43.00 44.00 51.00 48.00
42 Tea Leaf (Uphaar Red)
250g. Gram 40 41 42 39.04 42.33 42.33 53.13 51.25 55.6 60.21 61.00 66.00 98.00 101.00
43 Gur Kg 21.67 21.91 21.9 21.87 26.56 24.37 26.25 30 30.94 36.5 46.00 60.00 84.00 93.00

Economic Survey Mizoram 2014-15 ~ 191 ~ Essential Commodities
Economic Survey Mizoram 2014-15
X INTOXICATES
44 Finished Pan No. 1.00 1.00 1.00 1.00 1.00 1.00 1.00 1.00 1.00 1.00 1.00 2.00 2.00 2.00
45 Tobacco Leaf Kg 112.50 122.58 118.75 110.00 117.91 152.08 138.75 147.50 178.75 182.20 223.00 240.00 379.00 375.00
46 Mizo zial (10 Sticks) No. 2.00 1.97 2.00 2.00 2.06 2.75 3.15 3.00 3.60 2.83 3.00 3.00 8.00 8.00
47 Wills Navy Cut (10 Sticks) No. 19.75 25.79 13.73 14.37 14.87 15.00 24.88 28.60 35.38 37.63 42.00 45.00 56.00 71.00
XI FUEL & LIGHTING
48 L.P.G. Gas (14.20 Kg) Cylin
der 243.00 254.00 250.25 260.27 305.60 305.40 305.63 305.63 325.00 320.44 361.00 416.00 419.00 413.00
49 Electricity (Below 50w) Unit 1.31 1.31 1.31 1.31 1.31 1.31 1.31 1.45 1.45 1.45 1.40 1.70 1.70 1.70
XII SOAP
50 Washing Soap (Ball) Per
Ball 10.00 10.38 10.25 11.25 11.67 11.75 12.00 13.75 15.50 15.58 18.00
20.00 25.00 26.00
51 Cinthol (Bathing Soap) No. 12.50 13.21 12.08 12.46 12.83 18.13 19.50 20.00 23.10 23.23 25.00 27.00 35.00 35.00
XIII EDUCATION
52 School Uniform Shoe
(Intac) Pair 246.00 287.50 288.75 362.50 358.50 399.84 406.40 411.00 449.00 573.00 579.00
53 School Tution Fee (Pvt.) Mont
h 153.75 154.17 161.66 200.00 200.00 200.00 200.00 212.50 240.00 242.08 294.00 372.00 469.00 525.00
XIV MEDICAL CARE
54 Doctor Consultation Fee Per
Visit 50.00 66.66 79.58 93.75 93.33 100.00 100.00 100.00 100.00 100.00 122.00 137.00 200.00 200.00
55 Paracetamol Per
Strip 4.88 5.21 5.00 5.00 5.00 5.88 5.50 5.83 6.00 6.46 7.00 8.00 12.00 12.00
XV BEDDING & CLOTHING
56 Secondhand Shirt No. 60.00 70.00 75.00 80.00 90.00 95.00 100.00 100.00 103.13 139.17 164.00 160.00 236.00 250.00
57 Secondhand Pant No. 150.00 140.00 160.00 180.00 190.00 200.00 200.00 210.00 178.75 188.45 199.00 217.00 243.00 281.00
58 Mattress – 3 Kgs Cotton No. 351.25 393.29 360.42 294.58 373.33 343.75 417.14 407.14 457.50 451.08 584.00 638.00 839.00 856.00
59 Rizai – 2Kgs Cotton No. 281.25 289.16 286.16 298.75 297.92 281.25 330.00 347.14 387.50 387.97 500.00 459.00 731.00 756.00
60 Mosquito Net (Double) No. 340.00 350.00 360.00 350.00 360.00 380.00 450.00 380.00 393.75 419.47 352.00 544.00 813.00 888.00
61 Mosquito Net (Single) No. 270.00 290.00 300.00 240.95 250.00 300.00 350.00 310.00 320.00 310.42 462.00 393.00 408.00 481.00

Economic Survey Mizoram 2014-15 ~ 192 ~ Essential Commodities
Economic Survey Mizoram 2014-15
Annexure-XIV
WHOLESALE PRICE OF SELECTED ESSENTIAL COMMODITIES
Sl.
No. Name of Commodities Unit 2003-04 2004-05 2005-06 2006-07 2007-08 2008-09 2009-10 2010-11 2011-2012 2012-2013 2013-2014
1 2 3 4 5 6 7 8 9 10 11 12
I CEREALS
1 Rice (Local) Qtls. 1230.00 1220.00 1158.00 1387.00 1825.00 1800.00 2125.00 3050.00 3101.00 3786.00 4286.00
2 Atta Qtls. 979.00 988.00 1282.00 1367.00 1280.00 1380.00 1340.00 1490.00 2017.00 2587.00 2584.00
3 Maida Qtls. 1153.00 1418.00 1379.00 1635.00 1775.00 1840.00 1604.00 1773.00 2255.00 2778.00 2776.00
II PULSES
4 Masur Dal (Small) Qtls. 3399.00 3270.00 3280.00 3334.00 5256.00 6837.00 7090.00 6517.00 6057.00 7366.00 7591.00
5 Local Pulses (Bete) Qtls. 2400.00 2600.00 2800.00 3200.00 2920.00 3700.00 3303.00 4525.00 4464.00 6083.00 7000.00
III BEAVERAGE
6 Sugar Qtls. 1745.00 2123.00 2261.00 2272.00 2139.00 2456.00 3053.00 3956.00 3779.00 4700.00 4263.00
IV CONDIMENTS & SPICES
7 Salt 50 Kg. 589.00 280.00 279.00 327.00 339.00 350.00 395.00 543.00 389.00 473.00 542.00
8 Turmeric Qtls. 3500.00 5000.00 5200.00 5200.00 600.00 775.00 860.00 3517.00 4982.00 2917.00 3267.00
9 Garlic Qtls. 4087.00 4000.00 4300.00 1000.00 6100.00 5250.00 6832.00 14792.00 10483.00 10700.00 12563.00
10 Ginger Qtls. 750.00 780.00 780.00 800.00 950.00 1687.00 1771.00 2376.00 2160.00 3080.00 5663.00
11 Dry Chilli (bird eye
chillies) Qtls. 4200.00 6000.00 6200.00 6200.00 8000.00 12571.00 12850.00 12500.00 15805.00 15833.00 13875.00
V MEAT
12 Pork Qtls. 8500.00 8000.00 8200.00 8200.00 12250.00 14000.00 14333.00 18000.00 18000.00 22400.00 25000.00
13 Beef Qtls. 8000.00 8000.00 8500.00 8500.00 13500.00 13800.00 14833.00 18000.00 19000.00 25800.00 27500.00
14 Chicken (Broiler) Qtls. 7500.00 6000.00 6500.00 7200.00 10000.00 14500.00 14500.00 17000.00 16000.00 18100.00 20100.00
15 Fish Qtls. 7600.00 7800.00 8000.00 8000.00 10000.00 10000.00 11000.00 12000.00 12500.00 28800.00 29900.00
VI VEGETABLES
16 Potato Qtls. 802.00 852.00 972.00 1008.00 900.00 1126.00 1979.00 663.00 1567.00 2572.00 2508.00
17 Onion Qtls. 1,226.00 1,334.00 1,266.00 1,468.00 1,200.00 2,175.00 2,393.00 1,743.00 2344.00 6486.00 3112.00
18 Brinjal Qtls. 1,000.00 1,000.00 1,100.00 1,300.00 2,000.00 2,437.00 1,917.00 3,384.00 2595.00 3625.00 3500.00
VII FRUITS
19 Banana Qtls. 650.00 650.00 700.00 800.00 900.00 1100.00 1078.00 900.00 993.00 2275.00 3925.00

Economic Survey Mizoram 2014-15 ~ 193 ~ Status of Workers
Economic Survey Mizoram 2014-15
Annexure-XV
Percentage Distribution of Total Workers, Marginal Workers & Main workers by broad industrial categories
Sl No.
Year / District
Total wor-kers (% to
total population)
Marginal workers (% to
total population)
Main wor-kers (% to
total population)
% to total main workers
Cultivators Agricultural labourers
Household Industry worker)
Other workers
1 2 3 4 5 6 7 8 9 10
1 1971
Rural 47.41 - 47.41 86.67 0.23 0.15 12.92
Urban 31.59 - 31.59 13.77 1.86 2.22 49.21
Combine 45.61 - 45.61 83.53 0.37 0.32 12.44
2 1981
Rural 36.66 3.12 33.54 82.86 1.31 0.43 15.38
Urban 8.77 0.58 8.18 20.53 7.25 2.55 69.64
Combine 45.44 3.71 41.73 70.63 2.48 0.85 26.03
3 1991
Rural 51.2 5.7 45.5 82 1.65 0.4 16.42
Urban 46.2 8.2 38.1 33 5.56 1.87 59.43
Combine 48.9 6.8 42.1 61 3.28 1.02 34.35
4 2001
Rural 28.82 6.13 22.69 81.66 2 0.73 15.59
Urban 23.75 5.66 18.1 23.77 4.22 1.8 70.2
Combine 52.57 11.78 40.79 62.14 3.32 1.33 44.22
5 2011
Rural 23.00 3.15 19.85 46.31 4.60 0.60 9.30
Urban 21.36 3.38 17.97 9.01 5.47 1.29 40.69
Combine 44.36 6.53 37.83 55.32 10.07 1.89 49.99
District-wise (2011)
1 Mamit 3.59 0.29 3.30 6.91 0.62 0.06 1.89
2 Kolasib 3.34 0.64 2.71 4.34 1.43 0.14 2.93
3 Aizawl 15.92 2.12 13.80 9.46 2.75 0.81 29.05
4 Champhai 5.50 0.66 4.84 9.24 1.40 0.24 3.66
5 Serchhip 2.95 0.23 2.72 5.25 0.31 0.22 2.02
6 Lunglei 7.14 1.48 5.65 10.95 2.57 0.20 5.15
7 Lawngtlai 4.15 0.68 3.47 7.03 0.76 0.15 3.04
8 Saiha 1.77 0.43 1.34 2.15 0.23 0.08 2.24

Economic Survey Mizoram 2014-15 ~ 194 ~ School Enrolment
Economic Survey Mizoram 2014-15
Annexure-XVI
NUMBER OF PRIMARY, MIDDLE, HIGH & HIGHER SECONDARY AND ENROLMENT THERE IN MIZORAM
Year
PRIMARY (CL I - IV) MIDDLE (CL V - VII) HIGH SCHOOL (CL VII - X) HIGHER SECONDARY (CL XI - XII)
No. of School
Total Enrolment
No. of Girls
Student
No. of School
Total Enrolment
No. of Girls
Student
No. of School
Total Enrolment
No. of Girls
Student
No. of School
Total Enrolment
No. of Girls Student
1 2 3 4 5 6 7 8 9 10 11 12 13
1989 1084 98023 46042 522 42925 20693 192 23166 11466
1990 1109 103686 49130 545 44138 21436 202 27287 13550
1991 1118 96602 45694 546 42278 20075 227 27944 14032
1992 1066 98771 47346 553 42028 19380 273 31828 15848
1993 1082 97740 46562 609 44969 20858 281 27834 13915
1994 1145 97993 46477 656 48177 23747 289 2916 14820
1995 1254 99730 47130 694 47408 22950 313 30983 15428
1996 1263 106167 49842 702 48676 23873 300 33833 16863 16 22312 957
1997 1318 115652 53992 733 51746 25131 302 36864 18157 18 4836 2089
1998 1244 115845 54914 726 50457 24401 339 36231 18026 18 6174 2798
1999 1226 106165 50152 748 50971 24585 352 37690 19102 20 9344 4358
2000 1209 103269 98713 676 48793 23602 386 37197 18769 30 9671 4712
2001 1377 116226 56276 851 53130 26309 370 43030 23157 33 9076 4421
2002 1504 116303 55683 911 56490 27215 409 39875 20093 47 12555 6213
2003 1504 120217 57817 908 58623 27958 443 45200 22873 69 16890 8295
2004 1481 102807 48827 939 56038 27124 445 43161 21658 70 10283 5004
2005 1688 132046 63950 1121 88044 43090 484 41610 20787 76 10555 5068
2006 1700 130342 63050 1081 58533 28460 500 44322 21885 80 11762 5664
2007 1752 134656 64159 1090 57399 27733 508 43675 21725 82 12816 6161
2008 1783 151899 72907 1253 64887 31024 502 44576 21943 86 14649 7167
2009 1782 156396 74615 1313 66776 31796 521 48811 24263 95 17049 8388
2010 1821 166152 79832 1353 69318 33110 538 50252 25069 98 18437 9163
2011 1855 161514 77049 1383 87726 41965 543 48741 24277 113 20250 10056
2012 1831 161581 77608 1381 89755 43242 584 38870 19270 118 21472 10621
2013 1873 165051 80516 1408 94354 45557 612 41945 20674 127 22087 10935
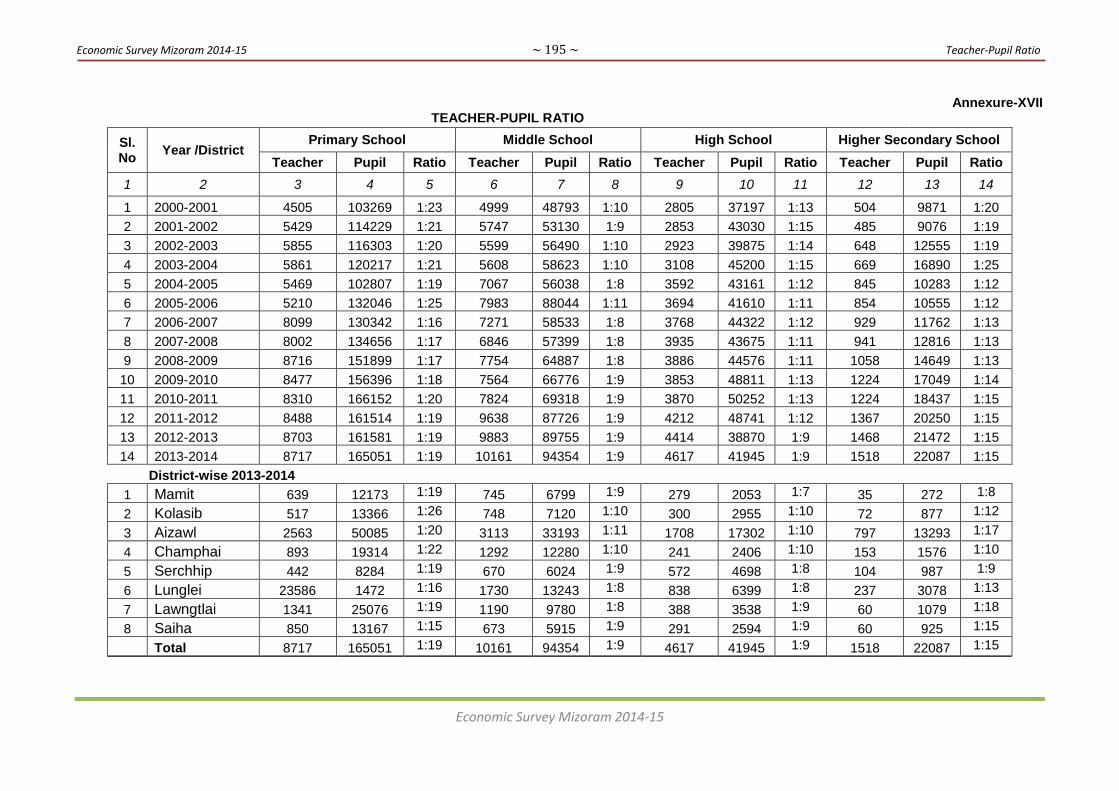
Economic Survey Mizoram 2014-15 ~ 195 ~ Teacher-Pupil Ratio
Economic Survey Mizoram 2014-15
Annexure-XVII TEACHER-PUPIL RATIO
Sl. No
Year /District Primary School Middle School High School Higher Secondary School
Teacher Pupil Ratio Teacher Pupil Ratio Teacher Pupil Ratio Teacher Pupil Ratio
1 2 3 4 5 6 7 8 9 10 11 12 13 14
1 2000-2001 4505 103269 1:23 4999 48793 1:10 2805 37197 1:13 504 9871 1:20
2 2001-2002 5429 114229 1:21 5747 53130 1:9 2853 43030 1:15 485 9076 1:19
3 2002-2003 5855 116303 1:20 5599 56490 1:10 2923 39875 1:14 648 12555 1:19
4 2003-2004 5861 120217 1:21 5608 58623 1:10 3108 45200 1:15 669 16890 1:25
5 2004-2005 5469 102807 1:19 7067 56038 1:8 3592 43161 1:12 845 10283 1:12
6 2005-2006 5210 132046 1:25 7983 88044 1:11 3694 41610 1:11 854 10555 1:12
7 2006-2007 8099 130342 1:16 7271 58533 1:8 3768 44322 1:12 929 11762 1:13
8 2007-2008 8002 134656 1:17 6846 57399 1:8 3935 43675 1:11 941 12816 1:13
9 2008-2009 8716 151899 1:17 7754 64887 1:8 3886 44576 1:11 1058 14649 1:13
10 2009-2010 8477 156396 1:18 7564 66776 1:9 3853 48811 1:13 1224 17049 1:14
11 2010-2011 8310 166152 1:20 7824 69318 1:9 3870 50252 1:13 1224 18437 1:15
12 2011-2012 8488 161514 1:19 9638 87726 1:9 4212 48741 1:12 1367 20250 1:15
13 2012-2013 8703 161581 1:19 9883 89755 1:9 4414 38870 1:9 1468 21472 1:15
14 2013-2014 8717 165051 1:19 10161 94354 1:9 4617 41945 1:9 1518 22087 1:15
District-wise 2013-2014
1 Mamit 639 12173 1:19 745 6799 1:9 279 2053 1:7 35 272 1:8
2 Kolasib 517 13366 1:26 748 7120 1:10 300 2955 1:10 72 877 1:12
3 Aizawl 2563 50085 1:20 3113 33193 1:11 1708 17302 1:10 797 13293 1:17
4 Champhai 893 19314 1:22 1292 12280 1:10 241 2406 1:10 153 1576 1:10
5 Serchhip 442 8284 1:19 670 6024 1:9 572 4698 1:8 104 987 1:9
6 Lunglei 23586 1472 1:16 1730 13243 1:8 838 6399 1:8 237 3078 1:13
7 Lawngtlai 1341 25076 1:19 1190 9780 1:8 388 3538 1:9 60 1079 1:18
8 Saiha 850 13167 1:15 673 5915 1:9 291 2594 1:9 60 925 1:15
Total 8717 165051 1:19 10161 94354 1:9 4617 41945 1:9 1518 22087 1:15
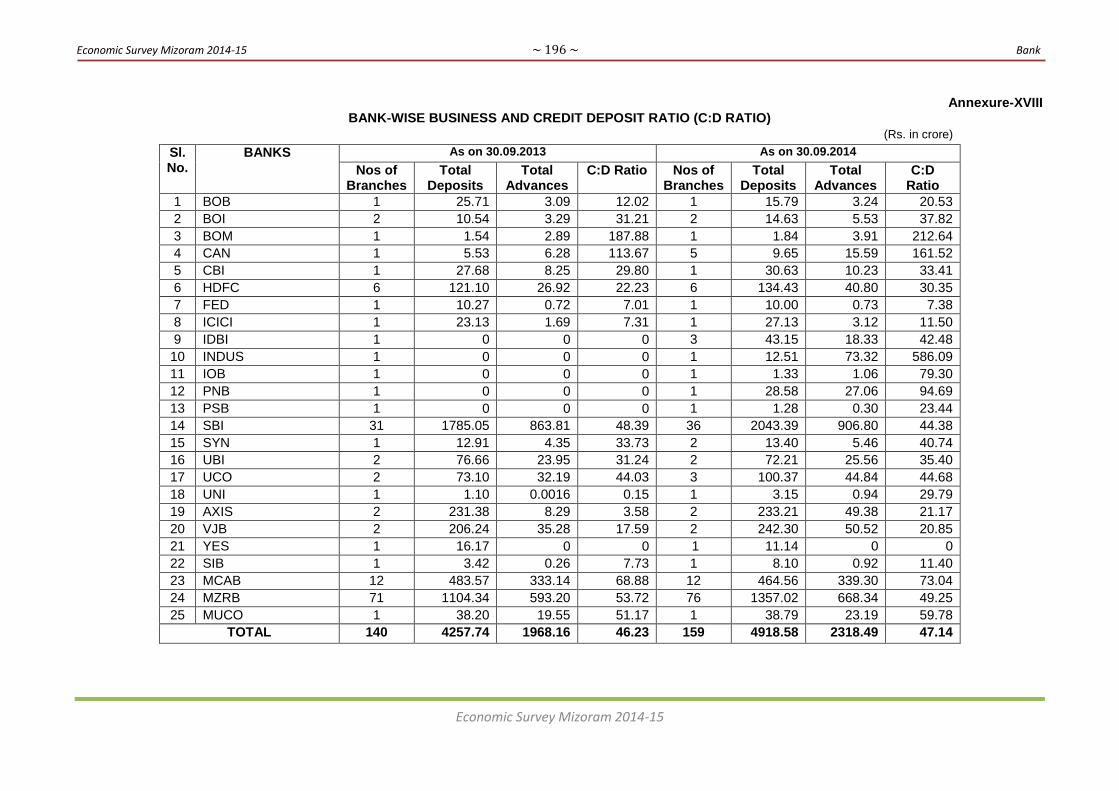
Economic Survey Mizoram 2014-15 ~ 196 ~ Bank
Economic Survey Mizoram 2014-15
Annexure-XVIII BANK-WISE BUSINESS AND CREDIT DEPOSIT RATIO (C:D RATIO)
(Rs. in crore)
Sl. No.
BANKS As on 30.09.2013 As on 30.09.2014
Nos of Branches
Total Deposits
Total Advances
C:D Ratio Nos of Branches
Total Deposits
Total Advances
C:D Ratio
1 BOB 1 25.71 3.09 12.02 1 15.79 3.24 20.53
2 BOI 2 10.54 3.29 31.21 2 14.63 5.53 37.82
3 BOM 1 1.54 2.89 187.88 1 1.84 3.91 212.64
4 CAN 1 5.53 6.28 113.67 5 9.65 15.59 161.52
5 CBI 1 27.68 8.25 29.80 1 30.63 10.23 33.41
6 HDFC 6 121.10 26.92 22.23 6 134.43 40.80 30.35
7 FED 1 10.27 0.72 7.01 1 10.00 0.73 7.38
8 ICICI 1 23.13 1.69 7.31 1 27.13 3.12 11.50
9 IDBI 1 0 0 0 3 43.15 18.33 42.48
10 INDUS 1 0 0 0 1 12.51 73.32 586.09
11 IOB 1 0 0 0 1 1.33 1.06 79.30
12 PNB 1 0 0 0 1 28.58 27.06 94.69
13 PSB 1 0 0 0 1 1.28 0.30 23.44
14 SBI 31 1785.05 863.81 48.39 36 2043.39 906.80 44.38
15 SYN 1 12.91 4.35 33.73 2 13.40 5.46 40.74
16 UBI 2 76.66 23.95 31.24 2 72.21 25.56 35.40
17 UCO 2 73.10 32.19 44.03 3 100.37 44.84 44.68
18 UNI 1 1.10 0.0016 0.15 1 3.15 0.94 29.79
19 AXIS 2 231.38 8.29 3.58 2 233.21 49.38 21.17
20 VJB 2 206.24 35.28 17.59 2 242.30 50.52 20.85
21 YES 1 16.17 0 0 1 11.14 0 0
22 SIB 1 3.42 0.26 7.73 1 8.10 0.92 11.40
23 MCAB 12 483.57 333.14 68.88 12 464.56 339.30 73.04
24 MZRB 71 1104.34 593.20 53.72 76 1357.02 668.34 49.25
25 MUCO 1 38.20 19.55 51.17 1 38.79 23.19 59.78
TOTAL 140 4257.74 1968.16 46.23 159 4918.58 2318.49 47.14
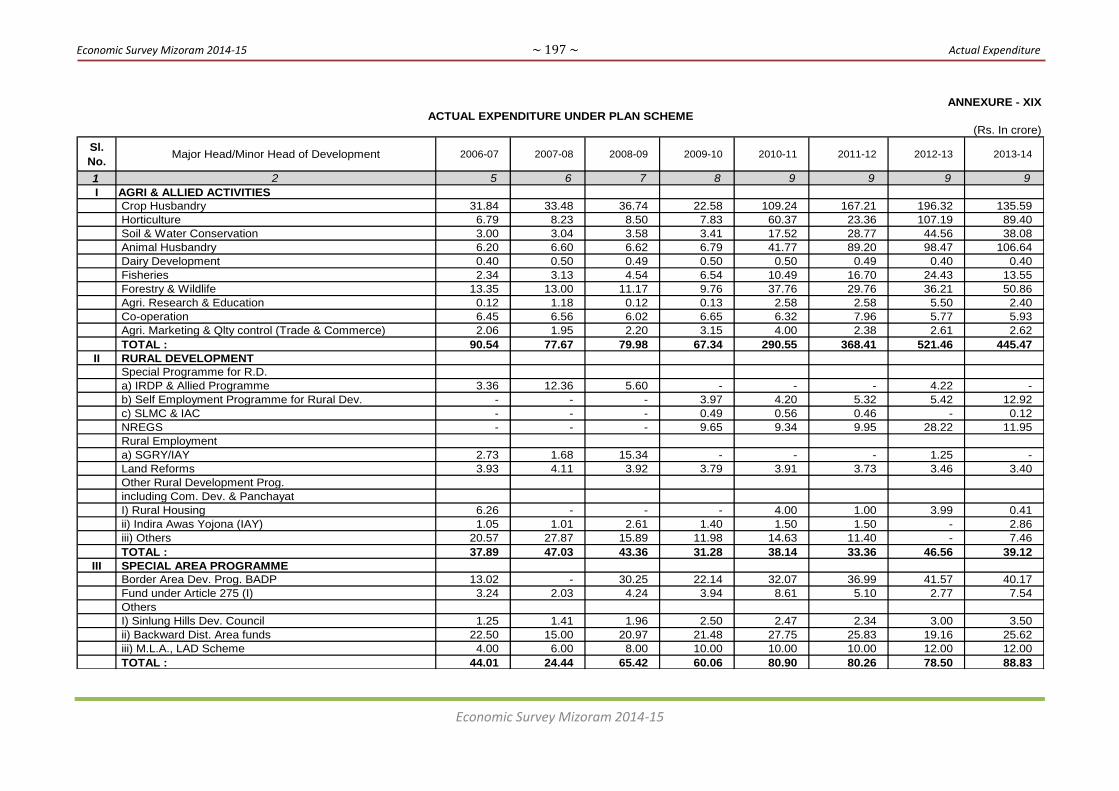
Economic Survey Mizoram 2014-15 ~ 197 ~ Actual Expenditure
Economic Survey Mizoram 2014-15
Sl.
No.Major Head/Minor Head of Development 2006-07 2007-08 2008-09 2009-10 2010-11 2011-12 2012-13 2013-14
1 2 5 6 7 8 9 9 9 9
I AGRI & ALLIED ACTIVITIES
Crop Husbandry 31.84 33.48 36.74 22.58 109.24 167.21 196.32 135.59
Horticulture 6.79 8.23 8.50 7.83 60.37 23.36 107.19 89.40
Soil & Water Conservation 3.00 3.04 3.58 3.41 17.52 28.77 44.56 38.08
Animal Husbandry 6.20 6.60 6.62 6.79 41.77 89.20 98.47 106.64
Dairy Development 0.40 0.50 0.49 0.50 0.50 0.49 0.40 0.40
Fisheries 2.34 3.13 4.54 6.54 10.49 16.70 24.43 13.55
Forestry & Wildlife 13.35 13.00 11.17 9.76 37.76 29.76 36.21 50.86
Agri. Research & Education 0.12 1.18 0.12 0.13 2.58 2.58 5.50 2.40
Co-operation 6.45 6.56 6.02 6.65 6.32 7.96 5.77 5.93
Agri. Marketing & Qlty control (Trade & Commerce) 2.06 1.95 2.20 3.15 4.00 2.38 2.61 2.62
TOTAL : 90.54 77.67 79.98 67.34 290.55 368.41 521.46 445.47
II RURAL DEVELOPMENT
Special Programme for R.D.
a) IRDP & Allied Programme 3.36 12.36 5.60 - - - 4.22 -
b) Self Employment Programme for Rural Dev. - - - 3.97 4.20 5.32 5.42 12.92
c) SLMC & IAC - - - 0.49 0.56 0.46 - 0.12
NREGS - - - 9.65 9.34 9.95 28.22 11.95
Rural Employment
a) SGRY/IAY 2.73 1.68 15.34 - - - 1.25 -
Land Reforms 3.93 4.11 3.92 3.79 3.91 3.73 3.46 3.40
Other Rural Development Prog.
including Com. Dev. & Panchayat
I) Rural Housing 6.26 - - - 4.00 1.00 3.99 0.41
ii) Indira Awas Yojona (IAY) 1.05 1.01 2.61 1.40 1.50 1.50 - 2.86
iii) Others 20.57 27.87 15.89 11.98 14.63 11.40 - 7.46
TOTAL : 37.89 47.03 43.36 31.28 38.14 33.36 46.56 39.12
III SPECIAL AREA PROGRAMME
Border Area Dev. Prog. BADP 13.02 - 30.25 22.14 32.07 36.99 41.57 40.17
Fund under Article 275 (I) 3.24 2.03 4.24 3.94 8.61 5.10 2.77 7.54
Others
I) Sinlung Hills Dev. Council 1.25 1.41 1.96 2.50 2.47 2.34 3.00 3.50
ii) Backward Dist. Area funds 22.50 15.00 20.97 21.48 27.75 25.83 19.16 25.62
iii) M.L.A., LAD Scheme 4.00 6.00 8.00 10.00 10.00 10.00 12.00 12.00
TOTAL : 44.01 24.44 65.42 60.06 80.90 80.26 78.50 88.83
(Rs. In crore)
ANNEXURE - XIX
ACTUAL EXPENDITURE UNDER PLAN SCHEME

Economic Survey Mizoram 2014-15 ~ 198 ~ Actual Expenditure
Economic Survey Mizoram 2014-15
IV IRRIGATION AND FLOOD CONTROL
Major & Medium Irrigation 0.01 0.01 0.10 0.01 0.01 0.01 0.01 0.01
Minor Irrigation 31.53 33.10 66.43 48.01 59.41 53.59 5.04 5.40
Command Area Development 0.15 0.18 0.15 0.15 0.15 0.15 0.10 0.10
TOTAL 31.69 33.29 66.68 48.17 59.57 53.75 5.15 5.51
V ENERGY
Power 68.34 67.00 50.40 101.62 73.59 90.25 97.80 98.80
Non-Conventional Sources 0.50 0.45 0.50 - - 0.50 0.40 0.40
Integrated Rural Energy Prog.IREP 0.11 0.10 0.11 - - 0.11 0.11 0.11
TOTAL 68.95 67.55 51.01 101.62 73.59 90.86 98.31 99.31
VI INDUSTRY & MINERALS
Village & Small Industries
I) Industry 20.35 14.86 23.35 13.88 33.72 21.36 77.85 78.71
2) Sericulture 3.55 3.84 3.91 3.97 10.87 5.28 17.73 9.05
Industries (other than V & SI) 1.20 1.44 0.10 0.10 0.10 0.10 0.10 0.10
Mines & Minerals 1.01 1.08 0.65 0.62 0.70 0.99 0.90 0.86
TOTAL 26.11 21.22 28.01 18.57 45.39 27.73 96.58 88.72
VII TRANSPORT
Aviation 0.29 0.82 2.27 0.67 1.25 0.86 1.43 3.71
Roads and Bridges 112.61 138.62 47.26 66.49 125.34 85.85 70.00 78.38
Road Transport 4.95 4.30 3.97 6.01 5.00 4.99 4.33 4.64
Inland Water Transport 0.32 0.04 0.04 0.05 0.04 0.05 0.05 0.05
M.V. Wing 1.01 1.15 1.01 0.93 1.06 1.09 0.84 1.01
TOTAL 119.18 144.93 54.55 74.15 132.69 92.84 76.65 87.79
VIII COMMUNICATION
Other Communication
Capacity Building under National E. Governance Action Plan 0.73 - 4.49 2.67 2.65 2.19 5.99 6.70
TOTAL 0.73 - 4.49 2.67 2.65 2.19 5.99 6.70
IX SCIENCE, TECH & ENVIRONMENT
Scientific Research (inc S&T) 1.51 2.09 1.98 2.00 2.00 1.97 1.60 1.98
Ecology & Environment 0.04 0.04 0.04 - 0.40 0.04 0.04 0.04
TOTAL 1.55 2.13 2.02 2.00 2.40 2.01 1.64 2.02

Economic Survey Mizoram 2014-15 ~ 199 ~ Actual Expenditure
Economic Survey Mizoram 2014-15
X GENERAL ECONOMIC SERVICES
Secretariat Economic Service 3.13 2.17 5.18 8.54 8.69 9.56 9.52 9.67
Tourism 3.04 3.31 3.32 4.09 4.25 3.33 3.75 3.76
Economic & Statitics 1.55 1.37 1.54 1.90 2.42 2.35 1.99 2.18
Civil Supplies 4.10 31.87 3.11 2.82 3.45 3.46 1.65 2.10
Other General Economic Service
i) Weights & Measures 0.80 0.95 1.00 0.90 1.06 1.11 0.98 1.01
ii) Others : District Council
a) LADC 8.75 9.07 9.96 15.57 23.27 23.41 35.72 34.57
b) MADC 7.46 7.78 8.29 14.50 17.82 21.93 31.88 27.49
c) CADC 5.45 5.77 6.72 16.98 17.78 14.79 26.71 23.17
iii) Law & Judicial 0.80 0.95 0.82 0.96 1.18 1.26 2.11 1.05
TOTAL 35.07 63.24 39.94 66.26 79.92 81.20 114.31 105.00
XI SOCIAL SERVICES
General Education
a) School Education 76.78 88.11 103.42 123.28 129.13 173.66 213.50 236.46
SCERT - - - 3.19 5.81 5.73 6.12 3.37
b) Higher Education 15.38 18.50 19.60 22.57 25.60 38.86 54.73 64.10
Technical Education 5.84 3.38 3.28 3.03 3.20 3.76 5.23 4.79
Mizoram Scholarship Board - - - - - 0.38 4.22 6.49
Sport & Youth Services (excluding Physical Education) 8.90 9.47 27.34 53.06 16.43 22.73 29.99 16.27
Art & Culture 4.05 2.38 2.48 3.38 1.91 4.40 4.98 3.17
Medical & Public Health 40.93 42.75 28.19 29.20 25.85 44.70 42.67 44.65
Hospital & Medical Education 77.54 145.73 35.48 42.56 40.49 49.37
Water Supply & Sanitation 72.04 68.20 64.98 72.26 70.16 73.22 83.51 78.14
Housing incl. Police Housing
a) Govt. Housing (PWD) 3.42 3.55 2.55 7.60 7.59 26.77 17.78 21.38
b) Housing (LAD) 6.04 10.87 9.31 7.54 7.50 9.97 4.57 4.40
c) Police Housing 4.61 3.68 3.30 4.11 7.00 8.43 8.68 0.40
URBAN DEV. (State Capital Project)
a) Urban Development (SCP) 1.56 1.42 1.23 1.20 1.20 1.22 2.22 -
b) LAD (incl. NSDP) 9.03 5.79 4.16 6.83 9.25 6.91 3.18 3.34
c) Town & Country Planning 1.40 1.31 1.20 1.23 1.25 1.20 1.00 1.04
d) Urban Dev. & Poverty Alleviation 14.00 63.48 55.37 43.03 90.10 86.14
Information & Publicity 2.39 2.37 2.55 2.75 2.91 2.95 1.85 3.23
Labour & Labour Welfare 1.56 1.72 2.01 2.30 2.80 2.73 2.97 3.26
Social Welfare 7.53 7.45 8.25 10.01 14.52 20.19 15.46 21.20
Nutrition PMGY 7.63 7.13 7.35 4.83 5.00 6.35 8.89 9.85
TOTAL 269.09 278.08 382.74 567.58 427.96 539.75 642.14 661.05

Economic Survey Mizoram 2014-15 ~ 200 ~ Actual Expenditure
Economic Survey Mizoram 2014-15
XII GENERAL SERVICES
Jails 2.88 2.73 2.82 3.11 2.70 7.34 1.78 9.68
Stationery & Printing 1.80 1.41 1.91 1.50 1.65 1.78 1.49 1.49
Public Work 14.82 12.36 12.60 18.27 8.49 14.68 38.22 53.38
Other Administration Services
i) Training (ATI) 0.96 0.95 0.66 1.32 0.97 0.94 0.77 0.88
ii) Other (Forensic Science) 0.04 0.10 0.10 0.15 0.25 0.35 0.25 0.35
iii) Fire Service Organisation - - - 1.72 1.86 1.70 7.57 4.78
iv) GAD - - - 1.38 2.25 5.77 4.37 8.30
v) Finance Department (incl. A&T & IFSL) - - - 85.60 36.76 129.90 - 48.47
vi) Disaster Management - - - - - - - 5.55
vii) Taxation - - - - - - - 0.23
TOTAL 20.50 17.55 18.09 113.05 54.93 162.46 54.45 133.10
GRAND TOTAL 745.32 777.13 836.29 1,152.75 1,288.69 1,534.82 1,741.74 1,762.62
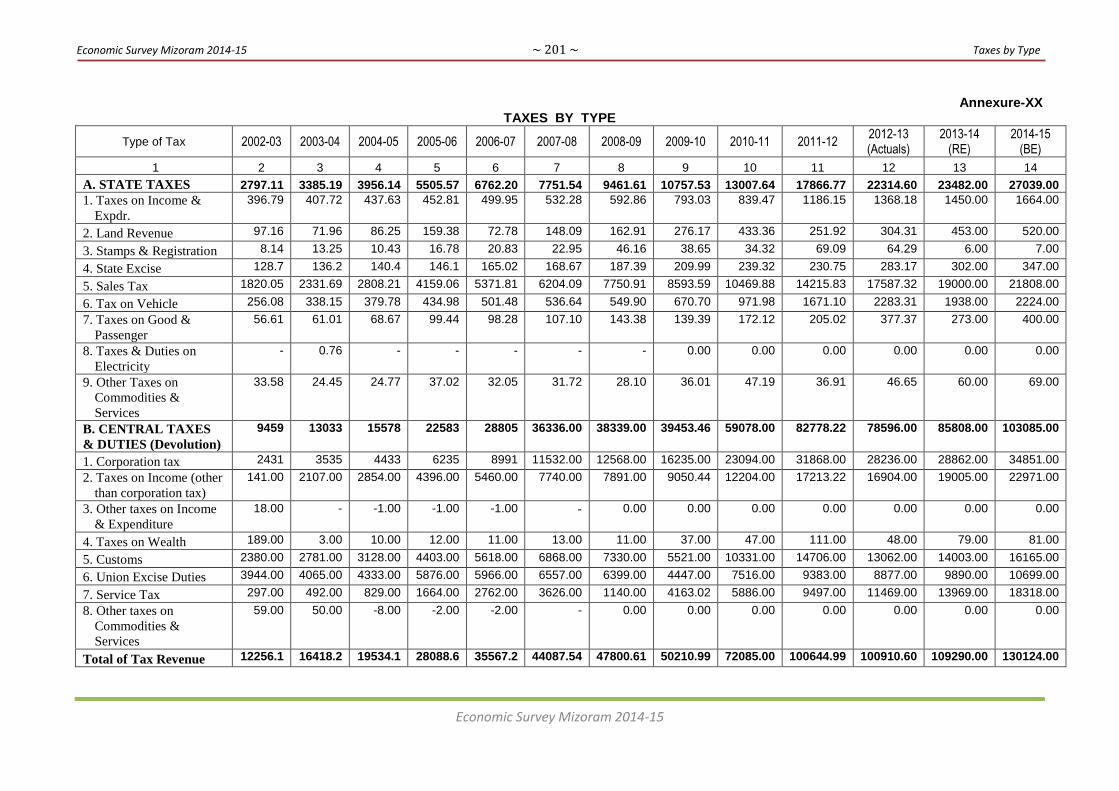
Economic Survey Mizoram 2014-15 ~ 201 ~ Taxes by Type
Economic Survey Mizoram 2014-15
Annexure-XX TAXES BY TYPE
Type of Tax 2002-03 2003-04 2004-05 2005-06 2006-07 2007-08 2008-09 2009-10 2010-11 2011-12 2012-13 (Actuals)
2013-14 (RE)
2014-15 (BE)
1 2 3 4 5 6 7 8 9 10 11 12 13 14
A. STATE TAXES 2797.11 3385.19 3956.14 5505.57 6762.20 7751.54 9461.61 10757.53 13007.64 17866.77 22314.60 23482.00 27039.00
1. Taxes on Income &
Expdr.
396.79 407.72 437.63 452.81 499.95 532.28 592.86 793.03 839.47 1186.15 1368.18 1450.00 1664.00
2. Land Revenue 97.16 71.96 86.25 159.38 72.78 148.09 162.91 276.17 433.36 251.92 304.31 453.00 520.00
3. Stamps & Registration 8.14 13.25 10.43 16.78 20.83 22.95 46.16 38.65 34.32 69.09 64.29 6.00 7.00
4. State Excise 128.7 136.2 140.4 146.1 165.02 168.67 187.39 209.99 239.32 230.75 283.17 302.00 347.00
5. Sales Tax 1820.05 2331.69 2808.21 4159.06 5371.81 6204.09 7750.91 8593.59 10469.88 14215.83 17587.32 19000.00 21808.00
6. Tax on Vehicle 256.08 338.15 379.78 434.98 501.48 536.64 549.90 670.70 971.98 1671.10 2283.31 1938.00 2224.00
7. Taxes on Good &
Passenger
56.61 61.01 68.67 99.44 98.28 107.10 143.38 139.39 172.12 205.02 377.37 273.00 400.00
8. Taxes & Duties on
Electricity
- 0.76 - - - - - 0.00 0.00 0.00 0.00 0.00 0.00
9. Other Taxes on
Commodities &
Services
33.58 24.45 24.77 37.02 32.05 31.72 28.10 36.01 47.19 36.91 46.65 60.00 69.00
B. CENTRAL TAXES
& DUTIES (Devolution)
9459 13033 15578 22583 28805 36336.00 38339.00 39453.46 59078.00 82778.22 78596.00 85808.00 103085.00
1. Corporation tax 2431 3535 4433 6235 8991 11532.00 12568.00 16235.00 23094.00 31868.00 28236.00 28862.00 34851.00
2. Taxes on Income (other
than corporation tax)
141.00 2107.00 2854.00 4396.00 5460.00 7740.00 7891.00 9050.44 12204.00 17213.22 16904.00 19005.00 22971.00
3. Other taxes on Income
& Expenditure
18.00 - -1.00 -1.00 -1.00 - 0.00 0.00 0.00 0.00 0.00 0.00 0.00
4. Taxes on Wealth 189.00 3.00 10.00 12.00 11.00 13.00 11.00 37.00 47.00 111.00 48.00 79.00 81.00
5. Customs 2380.00 2781.00 3128.00 4403.00 5618.00 6868.00 7330.00 5521.00 10331.00 14706.00 13062.00 14003.00 16165.00
6. Union Excise Duties 3944.00 4065.00 4333.00 5876.00 5966.00 6557.00 6399.00 4447.00 7516.00 9383.00 8877.00 9890.00 10699.00
7. Service Tax 297.00 492.00 829.00 1664.00 2762.00 3626.00 1140.00 4163.02 5886.00 9497.00 11469.00 13969.00 18318.00
8. Other taxes on
Commodities &
Services
59.00 50.00 -8.00 -2.00 -2.00 - 0.00 0.00 0.00 0.00 0.00 0.00 0.00
Total of Tax Revenue 12256.1 16418.2 19534.1 28088.6 35567.2 44087.54 47800.61 50210.99 72085.00 100644.99 100910.60 109290.00 130124.00