mn dept of human services policy briefing four: private and public savings plans friday, june 4,...
TRANSCRIPT

MN Dept of Human ServicesPolicy Briefing Four: Private and Public
Savings PlansFriday, June 4, 2004
Topics Covered: Basics of personal
financial planning: saving to self-insure for long-term care
Panel of consumer and industry representatives
Hawaii's public savings plan for universal coverage of LTC
Also, please make sure to pick up an evaluation & fill it out. Thanks!

Funding Long-Term Care Into Retirement Presented by:
Dave Bergstrom
Minnesota State Retirement System
June 4, 2004
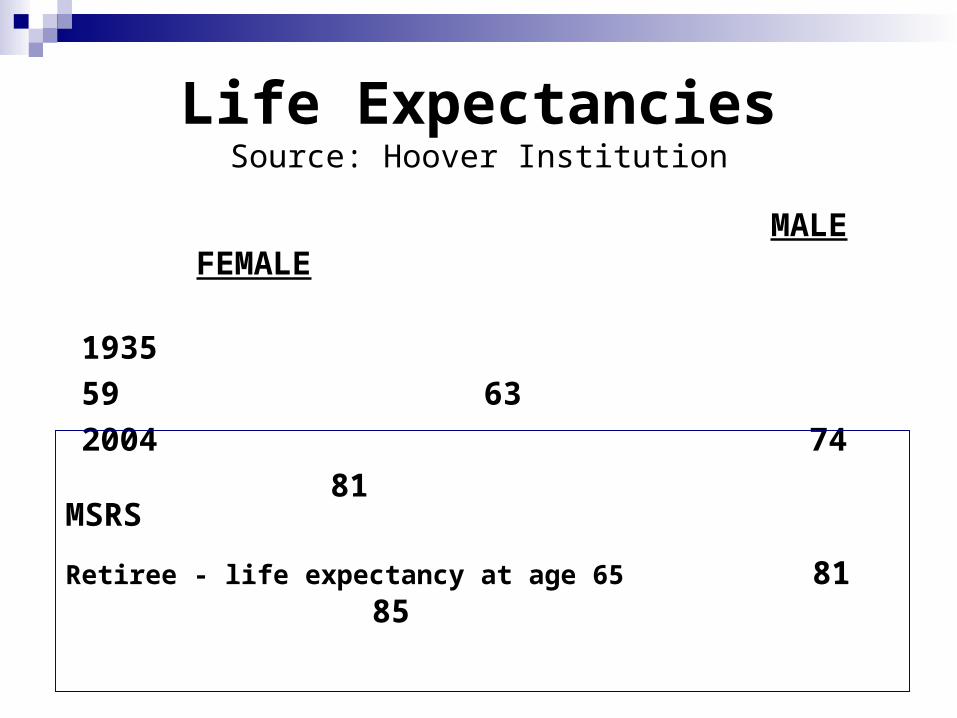
Life ExpectanciesSource: Hoover Institution
MALE FEMALE
1935 59 63
2004 74 81
MSRS
Retiree - life expectancy at age 65 81 85
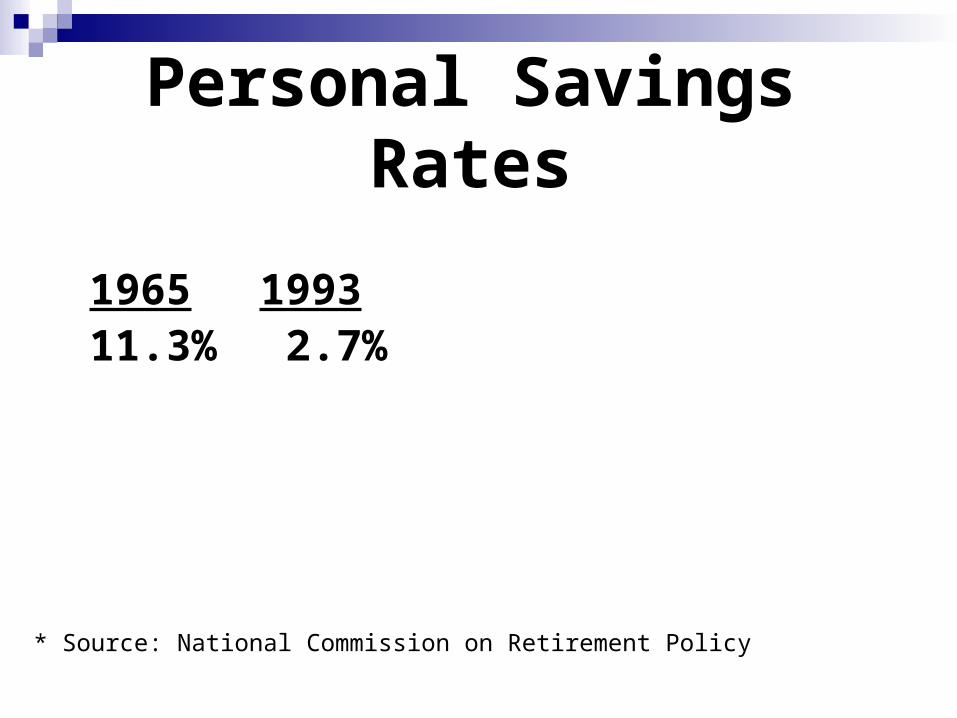
Personal Savings Rates
1965 199311.3% 2.7%
* Source: National Commission on Retirement Policy
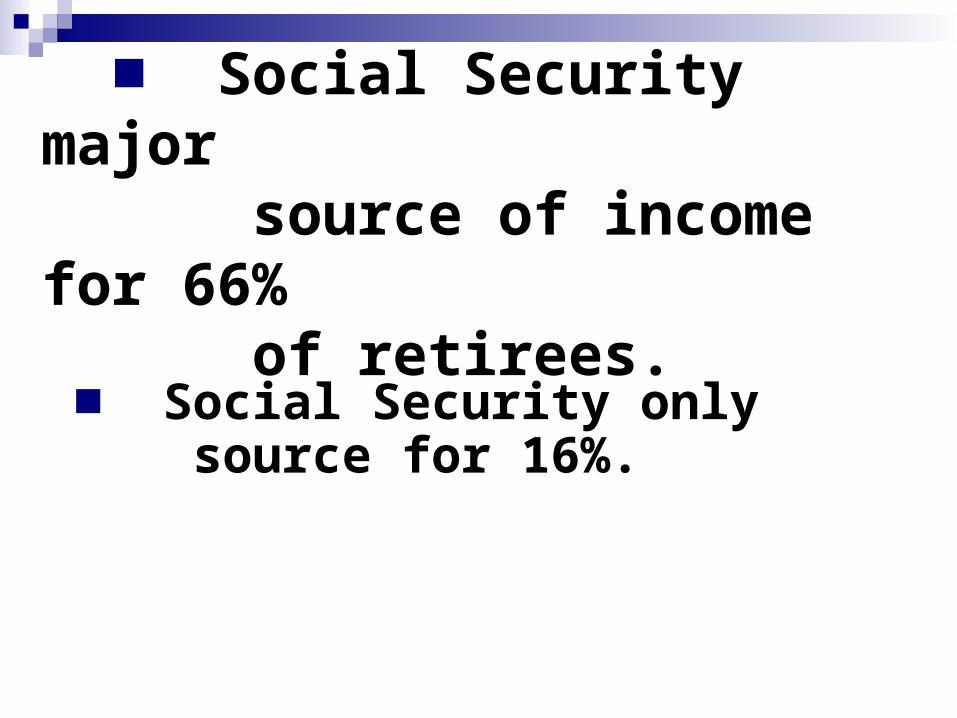
■ Social Security major source of income for 66% of retirees.
■ Social Security only source for 16%.
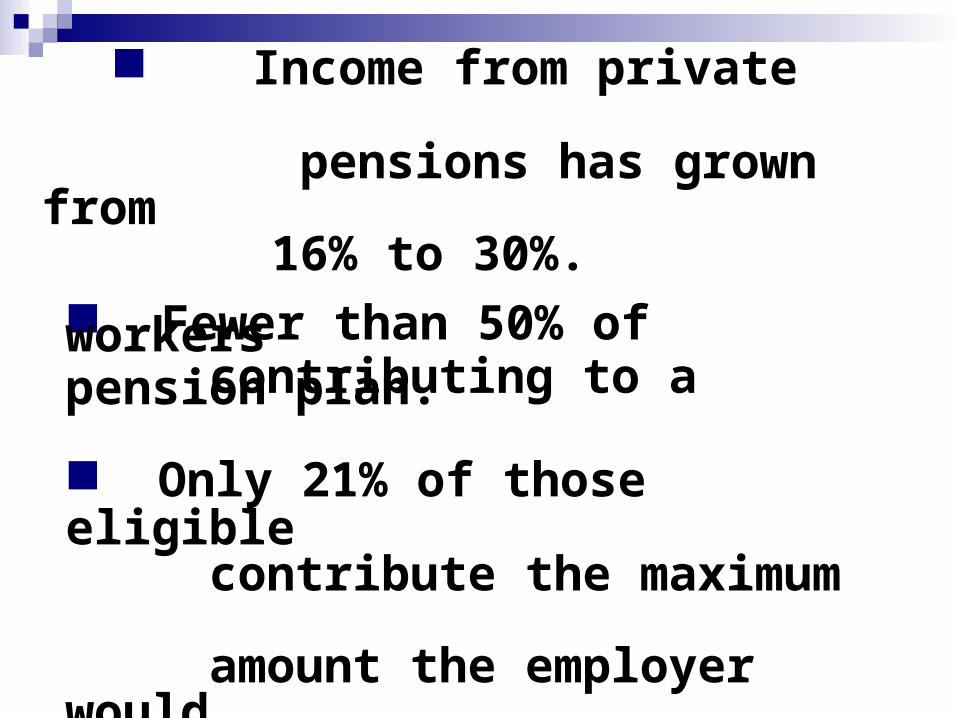
■ Income from private pensions has grown from 16% to 30%.
■ Fewer than 50% of workers contributing to a pension plan.
■ Only 21% of those eligible contribute the maximum amount the employer would match.

RULE OF 72
■ To determine how long it takes to double money divide 72 by earnings
rate.
■ Example: 72 divided by 8% return = 9 years to double money.
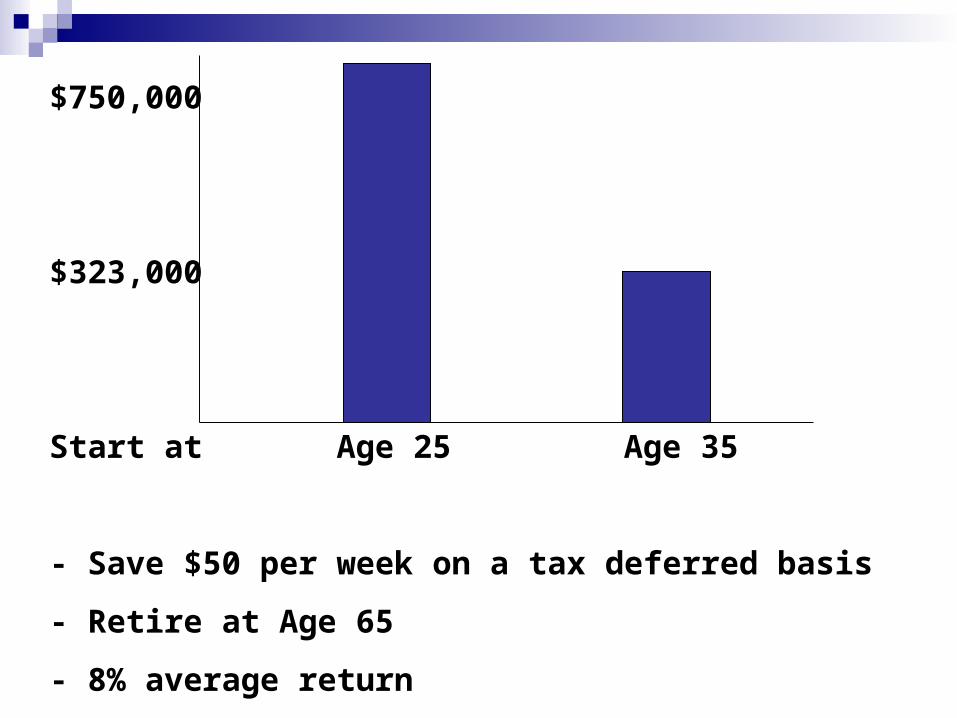
$750,000
$323,000
Start at Age 25 Age 35
- Save $50 per week on a tax deferred basis
- Retire at Age 65
- 8% average return
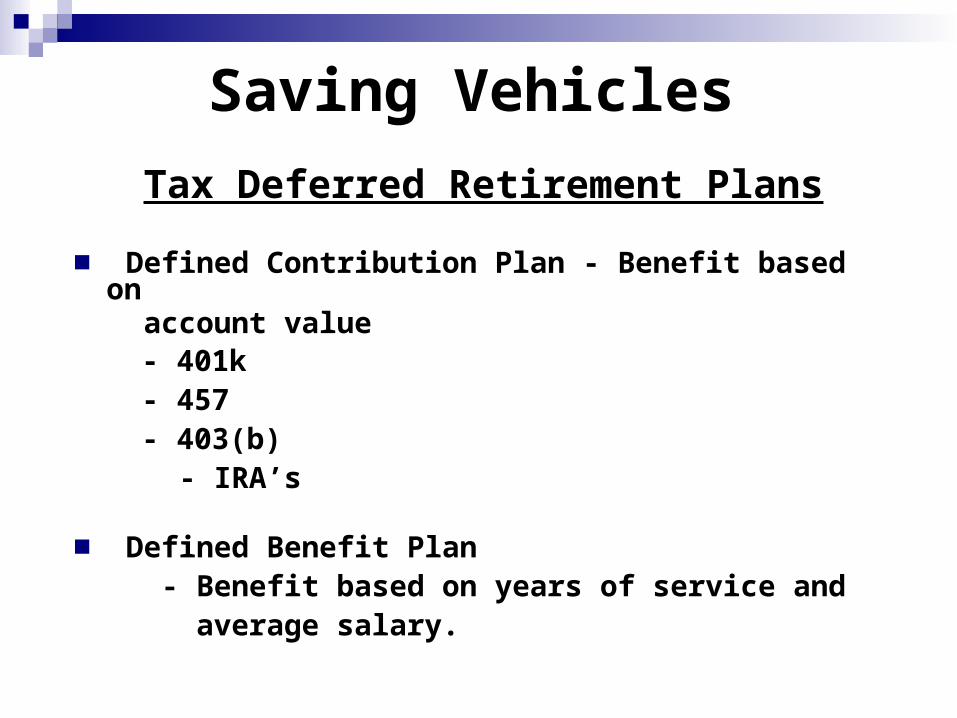
Saving Vehicles
Tax Deferred Retirement Plans
■ Defined Contribution Plan - Benefit based on account value
- 401k - 457 - 403(b)
- IRA’s
■ Defined Benefit Plan - Benefit based on years of service and average salary.

Saving Vehicles (cont.)
Tax free at payout
- Roth IRA’s
- President’s $7,500 savings proposal
* Contributions are made with after tax dollars.

Saving Vehicles (cont.)
Tax Free Savings Accounts
■ Voluntary Employee’s Beneficiary
Association (VEBA)
■ Health Care Savings Accounts
■ Health Care Reimbursement
Accounts

Post-EmploymentHealth Care Savings Plan
■ Employees can build a tax-free savings account.
- Tax free going in - Tax free going out
■ Account dollars can be used to offset employees and/or dependent medical expenses into retirement.
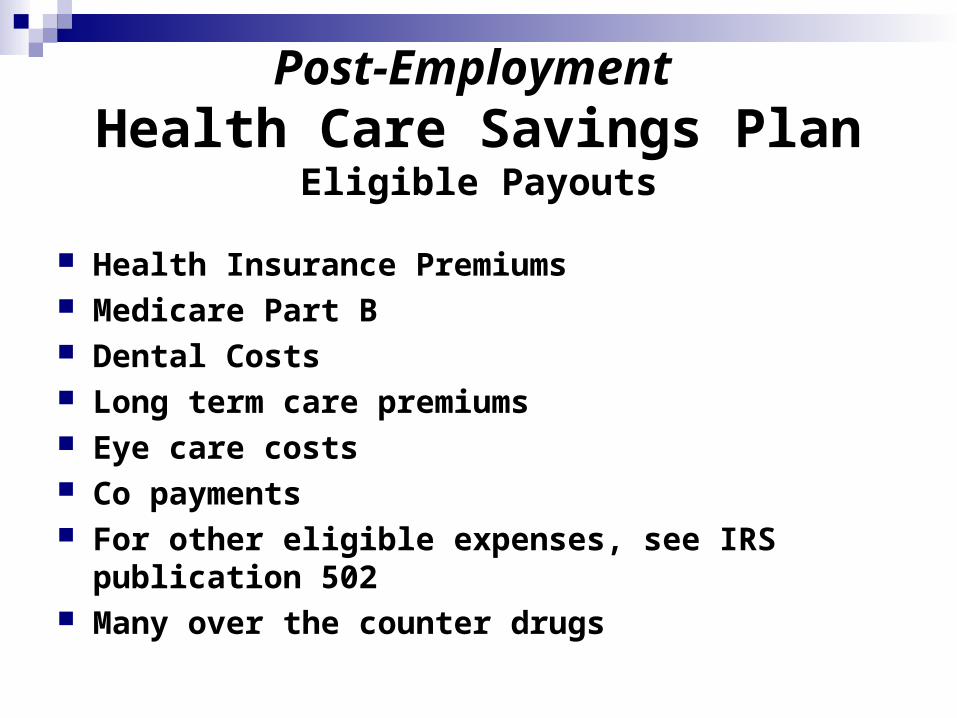
Post-Employment Health Care Savings Plan
Eligible Payouts
Health Insurance Premiums Medicare Part B Dental Costs Long term care premiums Eye care costs Co payments For other eligible expenses, see IRS publication 502 Many over the counter drugs

Defined Benefit Plan Health Insurance Proposal for State Employees
■ Employer contribution of ½ of 1% Participants’ years until retirement Monthly Benefit
3 $35 4 $35 5 $40 6 $46 7 $53 8 $61 9 $70 10 $80 11 $91 12 $103 13 $126 14 $140 15 or more $155
■ Benefits increase at inflation up to 5% per year payable to employees with 15 years of service.

Solutions
■ Increase retirement savings
■ More flexible Health Care Savings Accounts and incentives for Long-Term Care.
■ Control Health and Long-Term Care costs
■ Work longer to pay for Health and Long-Term Care
Insurance.

Panel Discussion
Laurie Laner, President, Financial Designs, Inc.
Hal Freshley, PhD, Director of Policy, Minnesota Board on Aging

Long Term CareNeeds
Financial Designs, Inc.
Laurie I. Laner, CFP

Financial Goals and ObjectivesRetirement: Design a retirement illustration that will ensure sufficient income throughout your
retirement years that will include the effects of inflation, taxes, investment return, long term care, gifting, etc.
Review different scenarios re: retirement age, lifestyle, continued work, funding levels, etc.
Ascertain required rate of return for investment portfolio to satisfy income need Coordinate retirement funding needs with investment strategy and estate planning Estate Planning: Organize important financial documents for easier administration of your affair Conserve estate for heirs Minimize multiple income and estate taxes Diagram current estate scenario and compare with possible scenarios assuming
different planning options Review drafted documents for suitability with current estate tax law and estate
planning needs Evaluate advantages/disadvantages of wills vs. revocable living trusts Evaluate whether several trust estate planning tools apply in your situation and how
best to use them such as Marital and Family Trusts, QTIP trusts, Irrevocable Life Insurance Trusts
Provide for asset and health care management in case of mental or physical incapacity
Review whether or not long term care insurance is appropriate Ensure that all asset titling and beneficiary designations are in sync with estate plan Tax Planning: Reduce, eliminate, and/or defer your current income tax liability

Financial Goals and ObjectivesCash Flow Management: Maintain a large emergency fund to provide cash cushion Establish guidelines and system for savings needs Catastrophic Protection: Provide adequate income for the surviving spouse - ascertain desired lifestyle for
survivor Provide for orderly distribution of income for surviving spouse and family Review cost effectiveness as well as coverage levels of all insurance programs Assess where current life insurance programs are at and how to best utilize the
policies for retirement as well as estate planning Investments: Develop an asset allocation/investment strategy to meet your retirement income goals Coordinate your investment strategy for retirement income with your income tax and
estate plan Develop a strategy for your daughter’s (Nancy) college education – assume
adequate funding for a private college Design a diversified, growth oriented portfolio based on your financial objectives and
risk tolerance Evaluate appropriate mix of investment assets Simplify and streamline the management of your investments Employee Benefit Plan Review Maximize use of your respective plans
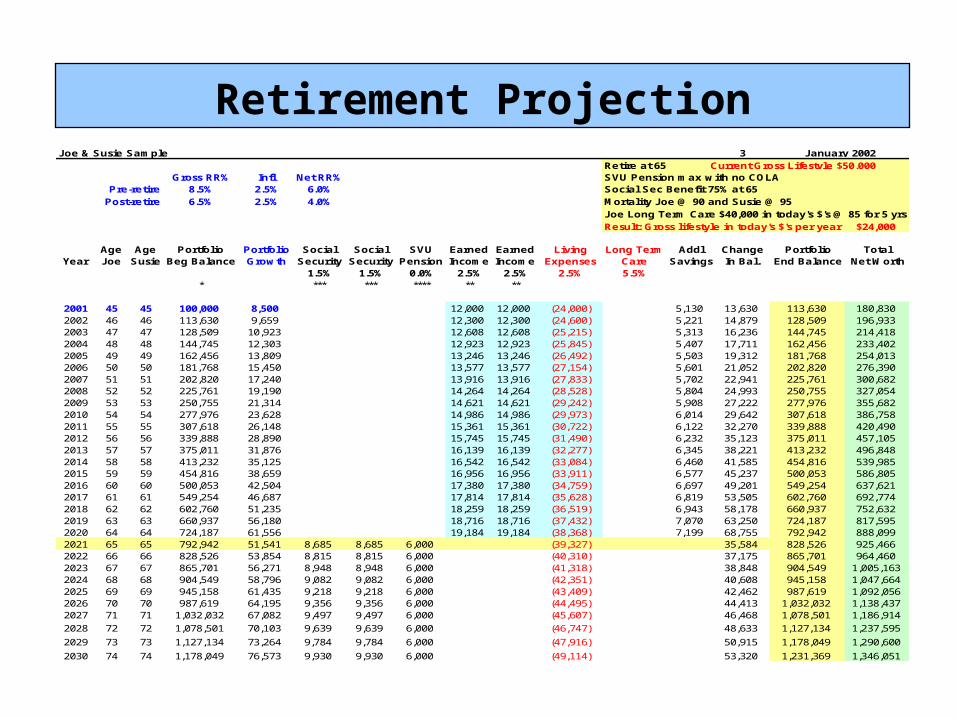
Retirement ProjectionJoe & Susie Sample 3 Retire at 65 Current Gross Lifestyle $50,000
Gross RR% Infl Net RR% SVU Pension max with no COLA8.5% 2.5% 6.0% Social Sec Benefit 75% at 656.5% 2.5% 4.0% Mortality Joe @ 90 and Susie @ 95
Joe Long Term Care $40,000 in today's $'s @ 85 for 5 yrs Result: Gross lifestyle in today's $'s per year $24,000
Age Age Portfolio Portfolio Social Social SVU Earned Earned Living Long Term Addl Change Portfolio TotalYear Joe Susie Beg Balance Growth Security Security Pension Income Income Expenses Care Savings In Bal. End Balance Net Worth
1.5% 1.5% 0.0% 2.5% 2.5% 2.5% 5.5% * *** *** **** ** **
2001 45 45 100,000 8,500 12,000 12,000 (24,000) 5,130 13,630 113,630 180,8302002 46 46 113,630 9,659 12,300 12,300 (24,600) 5,221 14,879 128,509 196,9332003 47 47 128,509 10,923 12,608 12,608 (25,215) 5,313 16,236 144,745 214,4182004 48 48 144,745 12,303 12,923 12,923 (25,845) 5,407 17,711 162,456 233,4022005 49 49 162,456 13,809 13,246 13,246 (26,492) 5,503 19,312 181,768 254,0132006 50 50 181,768 15,450 13,577 13,577 (27,154) 5,601 21,052 202,820 276,3902007 51 51 202,820 17,240 13,916 13,916 (27,833) 5,702 22,941 225,761 300,6822008 52 52 225,761 19,190 14,264 14,264 (28,528) 5,804 24,993 250,755 327,0542009 53 53 250,755 21,314 14,621 14,621 (29,242) 5,908 27,222 277,976 355,6822010 54 54 277,976 23,628 14,986 14,986 (29,973) 6,014 29,642 307,618 386,7582011 55 55 307,618 26,148 15,361 15,361 (30,722) 6,122 32,270 339,888 420,4902012 56 56 339,888 28,890 15,745 15,745 (31,490) 6,232 35,123 375,011 457,1052013 57 57 375,011 31,876 16,139 16,139 (32,277) 6,345 38,221 413,232 496,8482014 58 58 413,232 35,125 16,542 16,542 (33,084) 6,460 41,585 454,816 539,9852015 59 59 454,816 38,659 16,956 16,956 (33,911) 6,577 45,237 500,053 586,8052016 60 60 500,053 42,504 17,380 17,380 (34,759) 6,697 49,201 549,254 637,6212017 61 61 549,254 46,687 17,814 17,814 (35,628) 6,819 53,505 602,760 692,7742018 62 62 602,760 51,235 18,259 18,259 (36,519) 6,943 58,178 660,937 752,6322019 63 63 660,937 56,180 18,716 18,716 (37,432) 7,070 63,250 724,187 817,5952020 64 64 724,187 61,556 19,184 19,184 (38,368) 7,199 68,755 792,942 888,0992021 65 65 792,942 51,541 8,685 8,685 6,000 (39,327) 35,584 828,526 925,4662022 66 66 828,526 53,854 8,815 8,815 6,000 (40,310) 37,175 865,701 964,4602023 67 67 865,701 56,271 8,948 8,948 6,000 (41,318) 38,848 904,549 1,005,1632024 68 68 904,549 58,796 9,082 9,082 6,000 (42,351) 40,608 945,158 1,047,6642025 69 69 945,158 61,435 9,218 9,218 6,000 (43,409) 42,462 987,619 1,092,0562026 70 70 987,619 64,195 9,356 9,356 6,000 (44,495) 44,413 1,032,032 1,138,4372027 71 71 1,032,032 67,082 9,497 9,497 6,000 (45,607) 46,468 1,078,501 1,186,914
2028 72 72 1,078,501 70,103 9,639 9,639 6,000 (46,747) 48,633 1,127,134 1,237,595
2029 73 73 1,127,134 73,264 9,784 9,784 6,000 (47,916) 50,915 1,178,049 1,290,600
2030 74 74 1,178,049 76,573 9,930 9,930 6,000 (49,114) 53,320 1,231,369 1,346,051
January 2002
Pre-retirePost-retire
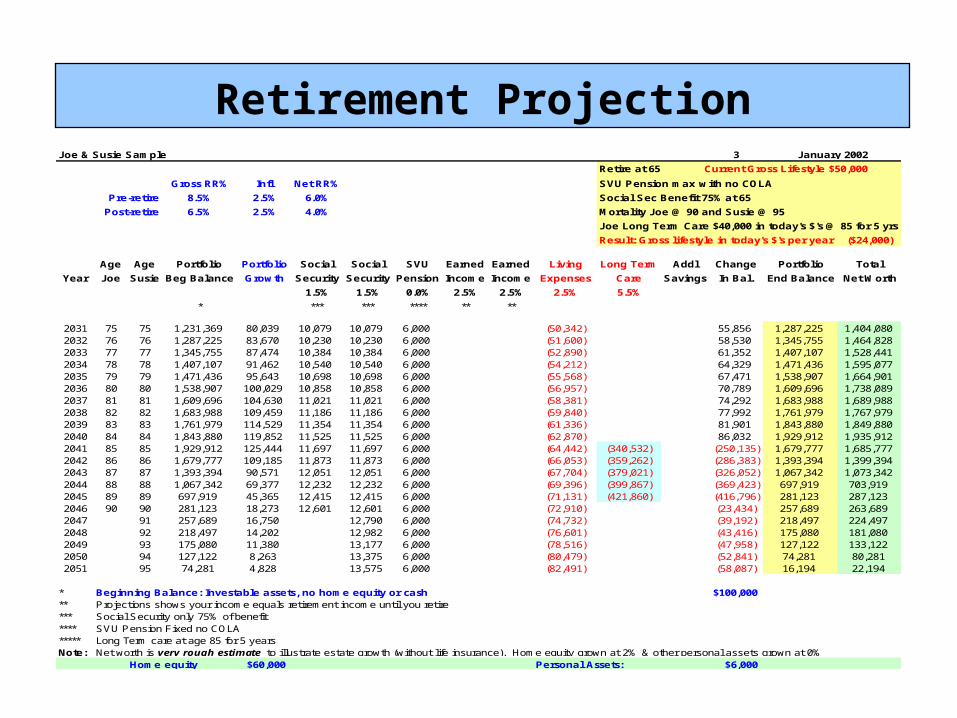
Retirement ProjectionJoe & Susie Sample 3
Retire at 65 Current Gross Lifestyle $50,000
Gross RR% Infl Net RR% SVU Pension max with no COLA
8.5% 2.5% 6.0% Social Sec Benefit 75% at 65
6.5% 2.5% 4.0% Mortality Joe @ 90 and Susie @ 95
Joe Long Term Care $40,000 in today's $'s @ 85 for 5 yrs
Result: Gross lifestyle in today's $'s per year ($24,000)
Age Age Portfolio Portfolio Social Social SVU Earned Earned Living Long Term Addl Change Portfolio Total
Year Joe Susie Beg Balance Growth Security Security Pension Income Income Expenses Care Savings In Bal. End Balance Net Worth
1.5% 1.5% 0.0% 2.5% 2.5% 2.5% 5.5%
* *** *** **** ** **
2031 75 75 1,231,369 80,039 10,079 10,079 6,000 (50,342) 55,856 1,287,225 1,404,0802032 76 76 1,287,225 83,670 10,230 10,230 6,000 (51,600) 58,530 1,345,755 1,464,8282033 77 77 1,345,755 87,474 10,384 10,384 6,000 (52,890) 61,352 1,407,107 1,528,4412034 78 78 1,407,107 91,462 10,540 10,540 6,000 (54,212) 64,329 1,471,436 1,595,0772035 79 79 1,471,436 95,643 10,698 10,698 6,000 (55,568) 67,471 1,538,907 1,664,9012036 80 80 1,538,907 100,029 10,858 10,858 6,000 (56,957) 70,789 1,609,696 1,738,0892037 81 81 1,609,696 104,630 11,021 11,021 6,000 (58,381) 74,292 1,683,988 1,689,9882038 82 82 1,683,988 109,459 11,186 11,186 6,000 (59,840) 77,992 1,761,979 1,767,9792039 83 83 1,761,979 114,529 11,354 11,354 6,000 (61,336) 81,901 1,843,880 1,849,8802040 84 84 1,843,880 119,852 11,525 11,525 6,000 (62,870) 86,032 1,929,912 1,935,9122041 85 85 1,929,912 125,444 11,697 11,697 6,000 (64,442) (340,532) (250,135) 1,679,777 1,685,7772042 86 86 1,679,777 109,185 11,873 11,873 6,000 (66,053) (359,262) (286,383) 1,393,394 1,399,3942043 87 87 1,393,394 90,571 12,051 12,051 6,000 (67,704) (379,021) (326,052) 1,067,342 1,073,3422044 88 88 1,067,342 69,377 12,232 12,232 6,000 (69,396) (399,867) (369,423) 697,919 703,9192045 89 89 697,919 45,365 12,415 12,415 6,000 (71,131) (421,860) (416,796) 281,123 287,1232046 90 90 281,123 18,273 12,601 12,601 6,000 (72,910) (23,434) 257,689 263,6892047 91 257,689 16,750 12,790 6,000 (74,732) (39,192) 218,497 224,4972048 92 218,497 14,202 12,982 6,000 (76,601) (43,416) 175,080 181,0802049 93 175,080 11,380 13,177 6,000 (78,516) (47,958) 127,122 133,1222050 94 127,122 8,263 13,375 6,000 (80,479) (52,841) 74,281 80,2812051 95 74,281 4,828 13,575 6,000 (82,491) (58,087) 16,194 22,194
* Beginning Balance: Investable assets, no home equity or cash $100,000** Projections shows your income equals retirement income until you retire*** Social Security only 75% of benefit**** SVU Pension Fixed no COLA***** Long Term care at age 85 for 5 yearsNote: Net worth is very rough estimate to illustrate estate growth (without life insurance). Home equity grown at 2% & other personal assets grown at 0%
Home equity $60,000 Personal Assets: $6,000
January 2002
Pre-retire
Post-retire

• In 1990, 1 in 8 Minnesotans was 65 years of age or older.
• In 2030, 1 in 4 Minnesotans will be 65 years of age or older.
Age Shift in Minnesota
Newman Financial Services: Aging initiative: Project 2030 Final Report, December 1998

Number of Workers per Retiree Trend
HCFA Office of Research & Demonstrations, 1994
Number of Workers per Retiree
0
5
10
15
20
25
30
35
40
45
Year 1935 Year 1950 Year 1990 Year 2020

Long Term Care Buy or Invest?Daily Benefit $150Cost of Living Adjustment 5%Benefit Duration in Years 5Elimination Period in Days 60Age 50
Age Daily Annual Benefit For Annual CumulativeBenefit Benefit 5 Yr. Claim Premium Premium 6% 8% 10% 12%
50 $150 $54,750 $273,750 $1,274 $1,274 $1,351 $1,376 $1,402 $1,42751 $158 $57,488 $287,438 $1,274 $2,548 $2,782 $2,862 $2,943 $3,02552 $165 $60,362 $301,809 $1,274 $3,823 $4,300 $4,467 $4,639 $4,81653 $174 $63,380 $316,900 $1,274 $5,097 $5,908 $6,201 $6,505 $6,82054 $182 $66,549 $332,745 $1,274 $6,371 $7,614 $8,073 $8,557 $9,06655 $191 $69,876 $349,382 $1,274 $7,645 $9,421 $10,095 $10,814 $11,58156 $201 $73,370 $366,851 $1,274 $8,919 $11,337 $12,279 $13,297 $14,39857 $211 $77,039 $385,194 $1,274 $10,193 $13,368 $14,637 $16,029 $17,55358 $222 $80,891 $404,453 $1,274 $11,468 $15,521 $17,184 $19,033 $21,08659 $233 $84,935 $424,676 $1,274 $12,742 $17,802 $19,935 $22,338 $25,04360 $244 $89,182 $445,910 $1,274 $14,016 $20,221 $22,906 $25,973 $29,47661 $257 $93,641 $468,205 $1,274 $15,290 $22,785 $26,115 $29,972 $34,44062 $269 $98,323 $491,616 $1,274 $16,564 $25,503 $29,580 $34,371 $40,00063 $283 $103,239 $516,196 $1,274 $17,839 $28,384 $33,323 $39,210 $46,22764 $297 $108,401 $542,006 $1,274 $19,113 $31,437 $37,364 $44,532 $53,20165 $312 $113,821 $569,107 $1,274 $20,387 $34,674 $41,730 $50,387 $61,01266 $327 $119,512 $597,562 $1,274 $21,661 $38,105 $46,444 $56,827 $69,76167 $344 $125,488 $627,440 $1,274 $22,935 $41,742 $51,536 $63,912 $79,55968 $361 $131,762 $658,812 $1,274 $24,209 $45,597 $57,035 $71,704 $90,53469 $379 $138,351 $691,753 $1,274 $25,484 $49,684 $62,974 $80,277 $102,82570 $398 $145,268 $726,340 $1,274 $26,758 $54,015 $69,388 $89,706 $116,59171 $418 $152,531 $762,657 $1,274 $28,032 $58,607 $76,315 $100,078 $132,00972 $439 $160,158 $800,790 $1,274 $29,306 $63,474 $83,796 $111,487 $149,277
Cumulative Premium Invested @

Long Term Care Buy or Invest?Daily Benefit $150Cost of Living Adjustment 5%Benefit Duration in Years 5Elimination Period in Days 60Age 50
Age Daily Annual Benefit For Annual CumulativeBenefit Benefit 5 Yr. Claim Premium Premium 6% 8% 10% 12%
73 $461 $168,166 $840,830 $1,274 $30,580 $68,633 $91,876 $124,038 $168,61774 $484 $176,574 $882,871 $1,274 $31,855 $74,102 $100,602 $137,843 $190,27875 $508 $185,403 $927,015 $1,274 $33,129 $79,898 $110,026 $153,029 $214,53976 $533 $194,673 $973,365 $1,274 $34,403 $86,043 $120,205 $169,733 $241,71177 $560 $204,407 $1,022,034 $1,274 $35,677 $92,556 $131,197 $188,108 $272,14378 $588 $214,627 $1,073,135 $1,274 $36,951 $99,460 $143,069 $208,321 $306,22779 $617 $225,358 $1,126,792 $1,274 $38,225 $106,778 $155,891 $230,554 $344,40180 $648 $236,626 $1,183,132 $1,274 $39,500 $114,536 $169,738 $255,012 $387,15781 $681 $248,458 $1,242,288 $1,274 $40,774 $122,759 $184,693 $281,914 $435,04382 $715 $260,881 $1,304,403 $1,274 $42,048 $131,475 $200,845 $311,507 $488,67583 $750 $273,925 $1,369,623 $1,274 $43,322 $140,714 $218,288 $344,060 $548,74384 $788 $287,621 $1,438,104 $1,274 $44,596 $150,507 $237,128 $379,867 $616,01985 $827 $302,002 $1,510,009 $1,274 $45,870 $160,888 $257,474 $419,256 $691,36886 $869 $317,102 $1,585,510 $1,274 $47,145 $171,892 $279,448 $462,583 $775,76087 $912 $332,957 $1,664,785 $1,274 $48,419 $183,556 $303,180 $510,243 $870,27888 $958 $349,605 $1,748,024 $1,274 $49,693 $195,920 $328,810 $562,668 $976,13889 $1,006 $367,085 $1,835,426 $1,274 $50,967 $209,026 $356,491 $620,337 $1,094,70290 $1,056 $385,439 $1,927,197 $1,274 $52,241 $222,918 $386,387 $683,772 $1,227,49391 $1,109 $404,711 $2,023,557 $1,274 $53,516 $237,644 $418,674 $753,551 $1,376,22092 $1,164 $424,947 $2,124,735 $1,274 $54,790 $253,254 $453,544 $830,308 $1,542,79393 $1,222 $446,194 $2,230,971 $1,274 $56,064 $269,799 $491,204 $914,740 $1,729,35594 $1,284 $468,504 $2,342,520 $1,274 $57,338 $287,338 $531,876 $1,007,616 $1,938,30595 $1,348 $491,929 $2,459,646 $1,274 $58,612 $305,929 $575,802 $1,109,779 $2,172,329
Cumulative Premium Invested @

Long Term Care InsuranceCost to Wait?
Daily Benefit $200Cost of Living Adjustment 5%Benefit Duration In Years LifetimeElimination Period In Days 60Cash Benefit Option (100% Home Health) IncludedAges 50 thru 70
Daily Annual Annual Total Benefit Benefit Increase Increase
Year Age 5% 5% Premium In Premium In Premium
1 50 $200 $73,000 $3,2492 51 $210 $76,650 $3,611 11% 11%3 52 $220 $80,300 $4,006 11% 23%4 53 $230 $83,950 $4,435 11% 36%5 54 $240 $87,600 $4,899 10% 51%6 55 $250 $91,250 $5,403 10% 66%
7 56 $260 $94,900 $5,950 10% 83%8 57 $270 $98,550 $6,542 10% 101%9 58 $280 $102,200 $7,183 10% 121%10 59 $290 $105,850 $7,877 10% 142%11 60 $300 $109,500 $8,300 5% 155%
12 61 $310 $113,150 $9,021 9% 178%13 62 $320 $116,800 $9,795 9% 202%14 63 $330 $120,450 $10,625 8% 227%15 64 $340 $124,100 $11,516 8% 254%16 65 $350 $127,750 $12,470 8% 284%
17 66 $360 $131,400 $13,717 10% 322%18 67 $370 $135,050 $15,089 10% 364%19 68 $380 $138,700 $16,597 10% 411%20 69 $400 $146,000 $18,257 10% 462%21 70 $410 $149,650 $20,083 10% 518%

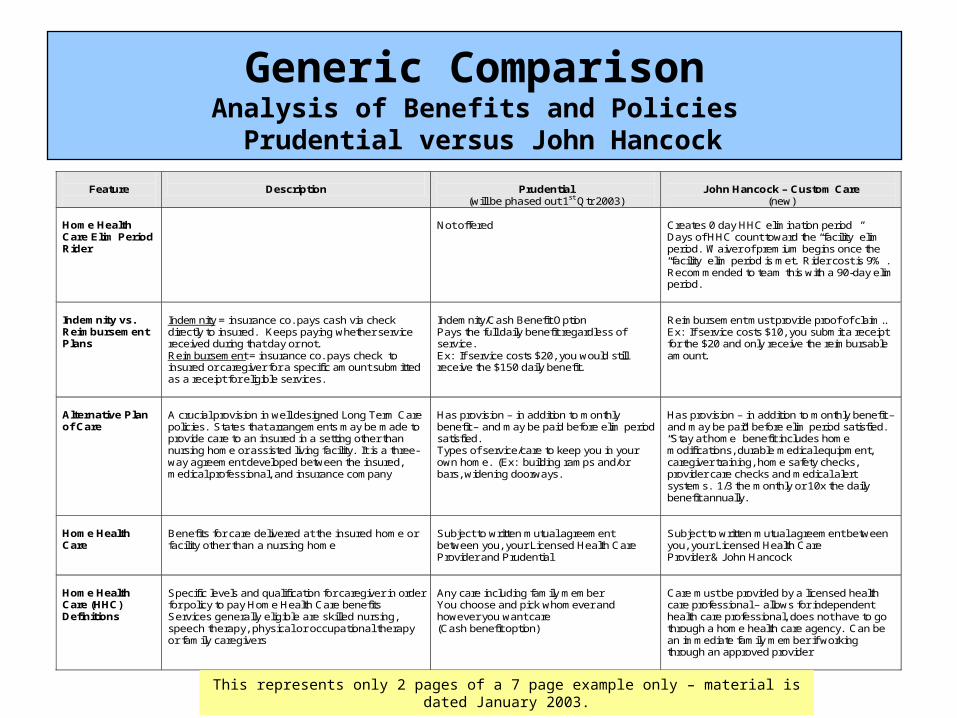
Generic ComparisonAnalysis of Benefits and Policies Prudential versus John Hancock
This represents only 2 pages of a 7 page example only – material is dated January 2003.
Feature
Description
Prudential
(will be phased out 1st Qtr 2003)
John Hancock – Custom Care
(new) Daily Benefit
Amount of money paid by the insurance company to insured or insured’s caregiver Amount available ranges from $50 to $350 per day. For lifetime max, the annual max controls how much can be given each year
$150/day or $54,750/year
$150/day or $54,750/year Purchase in either monthly benefit of $1,500 to $15,000 (in $100 increments) or daily benefit $50 to $500 (in $10 increments) Daily benefit is 6% less
Benefit Period
Multiplier for benefit amount Referred to as insured “pool of money” or “bucket”
If 5 year, bucket is $273,750 2 yrs 3 yrs 5 yrs Lifetime
If 5 year, bucket is $273,750 2 yrs (730 days) 3 yrs (1,095 days) 4 yrs (1,460 days) 5 yrs (1,825 days) 6 yrs (2,190 days) 10 yrs (3,650 days) Lifetime (unlimited days)
Inflation Options
This feature will automatically increase the daily benefit without proof of insurability on an annual basis even while the insured is on claim
5% compound interest
5% compound interest
Elimination or Waiting Period 60 Days used for Analysis
Time insured must private pay before insurance company benefits are received A longer waiting period results in lower premium
Day of diagnosis by a doctor becomes the start date for elimination period. The doctor states you can’t perform 2 of the ADL’s, then 60 days later Pru will pay benefit, even if you don’t have service. (Ex: If your family took care of you until the 90 days was up, and then you hire a nurse.)
1 day of service counts as 7 days of service. (Ex: If you receive care only 1 time per week it will satisfy up to 7 days of the elimination period.) Once the elimination period is satisfied, it never needs to be satisfied again, regardless of type of care. 60 days is 10% > than 30 days 90 days is 10% > than 60 days NFS recommends 90 days and add HHC rider which adds 6% to premium (saves 4% over 60 day wait)
Generic ComparisonAnalysis of Benefits and Policies Prudential versus John Hancock
Feature
Description
Prudential
(will be phased out 1st Qtr 2003)
John Hancock – Custom Care
(new) Home Health Care Elim Period Rider
Not offered
Creates 0 day HHC elimination period Days of HHC count toward the “facility” elim period. Waiver of premium begins once the “facility” elim period is met. Rider cost is 9% . Recommended to team this with a 90-day elim period.
Indemnity vs. Reimbursement Plans
Indemnity = insurance co. pays cash via check directly to insured. Keeps paying whether service received during that day or not. Reimbursement = insurance co. pays check to insured or caregiver for a specific amount submitted as a receipt for eligible services.
Indemnity/Cash Benefit Option Pays the full daily benefit regardless of service. Ex: If service costs $20, you would still receive the $150 daily benefit.
Reimbursement must provide proof of claim.. Ex: If service costs $10, you submit a receipt for the $20 and only receive the reimbursable amount.
Alternative Plan of Care
A crucial provision in well designed Long Term Care policies. States that arrangements may be made to provide care to an insured in a setting other than nursing home or assisted living facility. It is a three-way agreement developed between the insured, medical professional, and insurance company
Has provision – in addition to monthly benefit – and may be paid before elim period satisfied. Types of service/care to keep you in your own home. (Ex: building ramps and/or bars, widening doorways.
Has provision – in addition to monthly benefit – and may be paid before elim period satisfied. “Stay at home” benefit includes home modifications, durable medical equipment, caregiver training, home safety checks, provider care checks and medical alert systems. 1/3 the monthly or 10x the daily benefit annually.
Home Health Care
Benefits for care delivered at the insured home or facility other than a nursing home
Subject to written mutual agreement between you, your Licensed Health Care Provider and Prudential
Subject to written mutual agreement between you, your Licensed Health Care Provider & John Hancock
Home Health Care (HHC) Definitions
Specific levels and qualification for caregiver in order for policy to pay Home Health Care benefits Services generally eligible are skilled nursing, speech therapy, physical or occupational therapy or family caregivers
Any care including family member You choose and pick whomever and however you want care (Cash benefit option)
Care must be provided by a licensed health care professional – allows for independent health care professional, does not have to go through a home health care agency. Can be an immediate family member if working through an approved provider
This represents only 2 pages of a 7 page example only – material is dated January 2003.

5 Minutes for Small Group Discussion Please discuss the presenters’ material Each site should pick the “best” question or
two, and be prepared to present it to the group
Sites will be called upon in alphabetical order (with St. Paul last)
Either the facilitator or the person with the question should be prepared to ask it

5 MINUTE BREAK

Marilyn Seely, former Director of the Executive Office on Aging, State of Hawaii

Next Briefing: August 6th 9am - Noon
Topic: Housing strategiesSpecific topics covered:
Using housing equity Reverse mortgages House-sharing or modifications
In Closing...
Marlene Stum, PhD, of the University of Minnesota, Extension Service. Her web site:
http://fsos.che.umn.edu/stum/financingltc/intro.html