mn sfp final report letter
TRANSCRIPT


Minnesota
Statewide Freight Plan
Minnesota Department of Transportation Office of Freight and Commercial Vehicle Operations
Plan Development Consultants:
Cambridge Systematics, Inc. SRF Consulting Group, Inc.
May 2005


Minnesota Statewide Freight Plan May 2005
Table of Contents
Table of Contents
1.0 Introduction ................................................................................. 1-1 1.1 Overview...................................................................................................... 1-1 1.2 Background.................................................................................................. 1-2 1.3 Freight Definition.......................................................................................... 1-2 1.4 Plan Organization ........................................................................................ 1-2
2.0 Infrastructure ............................................................................. 2-1 2.1 Roadways .................................................................................................... 2-1
2.1.1 The Interstate/NHS and STRAHNET ................................................ 2-1 2.1.2 The National Truck Network and Minnesota Twin Trailer Network ... 2-2 2.1.3 The Interregional Corridor System .................................................... 2-2 2.1.4 The 10-ton Network – “Last Mile Connection”................................... 2-6 2.1.5 Ancillary Roadway Facilities.............................................................. 2-6
2.2 Railroads...................................................................................................... 2-8 2.2.1 Railroads by Class ............................................................................ 2-8 2.2.2 Service (Trains Per Day)................................................................... 2-9
2.3 Ports and Waterways................................................................................... 2-11 2.3.1 The Mississippi River System ........................................................... 2-11 2.3.2 The Great Lakes System .................................................................. 2-13
2.4 Air Cargo...................................................................................................... 2-14 2.5 Intermodal Terminals ................................................................................... 2-14
2.5.1 Rail Container Facilities Served by Highway .................................... 2-15 2.5.2 Port Facilities Served by Highway and Rail ...................................... 2-15 2.5.3 Other Bulk Facilities Served by Highway .......................................... 2-15 2.5.4 Intermodal Connectors...................................................................... 2-15
2.6 The Minnesota Border-Crossing Network.................................................... 2-17
3.0 Freight Flows .......................................................... 3-1 3.1 Directional Flows ......................................................................................... 3-1 3.2 Freight Origins and Destinations ................................................................. 3-3 3.3 Commodities Shipped.................................................................................. 3-5 3.4 Modes .......................................................................................................... 3-7 3.5 Subregional Analysis ................................................................................... 3-10 3.6 Routes ......................................................................................................... 3-13
3.6.1 Trucking............................................................................................. 3-13 3.6.2 Rail .................................................................................................... 3-16 3.6.3 Water ................................................................................................. 3-16
4.0 System Analysis ..................................................... 4-1 4.1 Highways ..................................................................................................... 4-1

Minnesota Statewide Freight Plan May 2005
Table of Contents
4.2 Railroads...................................................................................................... 4-6 4.3 Ports and Waterways................................................................................... 4-7 4.4 Air Cargo...................................................................................................... 4-8 4.5 Intermodal Terminals ................................................................................... 4-9
5.0 Mn/DOT Programs ................................................... 5-1 5.1 Freight Programs ......................................................................................... 5-1
5.1.1 Commercial Vehicle Operations........................................................ 5-1 5.1.2 Rail Safety – Grade Crossing Safety Improvement Program............ 5-2 5.1.3 Rail Rehabilitation – Minnesota Rail Service Improvement Program 5-3 5.1.4 Port Development ............................................................................. 5-4 5.1.5 Air Cargo ........................................................................................... 5-5 5.1.6 Planning and Research..................................................................... 5-6
5.2 Integration of Freight Programs with Other Transportation Planning and Investment Activities .................................................................................... 5-7
5.3 Partnerships with the Private Sector............................................................ 5-8
6.0 Freight Trends ........................................................ 6-1 6.1 Economic Trends......................................................................................... 6-1
6.1.1 Population and Employment Trends ................................................. 6-1 6.1.2 Industry Trends.................................................................................. 6-3 6.1.3 Export and Import Trends.................................................................. 6-4
6.2 Transportation/Logistics............................................................................... 6-6 6.3 Policy Trends ............................................................................................... 6-7
6.3.1 Federal Policies ................................................................................. 6-7 6.3.2 Minnesota State, Regional and Local Policies .................................. 6-8
7.0 Performance Measures........................................... 7-1 7.1 Statewide Transportation Plan Performance Framework ............................ 7-1 7.2 Existing Freight Performance Measures...................................................... 7-3
7.2.1 Freight Measures by Mode ............................................................... 7-3 7.3 New Freight Performance Measures and Indicators ................................... 7-4
7.3.1 Freight Performance Measures......................................................... 7-5 7.3.2 Freight Performance Indicators......................................................... 7-5
7.4 Targets for Freight Performance Measures................................................. 7-6
8.0 Recommendations .................................................. 8-1 8.1 Freight Policy ............................................................................................... 8-1 8.2 Policy Directions and Strategies .................................................................. 8-1
9.0 Public Involvement ................................................. 9-1 9.1 Overview of Plan Development ................................................................... 9-1 9.2 General Themes .......................................................................................... 9-2 9.2.1 Investment and Funding ..................................................................... 9-2 9.2.2 Freight Movement & Infrastructure on a Small Scale ......................... 9-3 9.2.3 Prioritization ........................................................................................ 9-3 9.2.4 Data .................................................................................................... 9-4

Minnesota Statewide Freight Plan May 2005
Table of Contents
9.3 Audience Differences and Similarities ......................................................... 9-4 9.4 Summary of Comments ............................................................................... 9-5
10.0 Next Steps ............................................................10-1
Acronyms...................................................................... A-1
List of Figures 2.1 NHS and STRAHNET......................................................................................... 2-3
2.2 Designated Truck Networks................................................................................ 2-4
2.3 IRCs.................................................................................................................... 2-5
2.4 Safety Rest Stations and Weigh/Inspection Stations.......................................... 2-7
2.5 Minnesota Rail Classes and STRACNET........................................................... 2-10
2.6 Ports, Locks, and Dams (River and Lake) .......................................................... 2-12
2.7 Minnesota Airports.............................................................................................. 2-16
2.8 Minnesota’s Border Crossing Network ............................................................... 2-18
3.1 Directional Flows by Weight—Annual Tons (in Millions), 2001........................... 3-2
3.2 Directional Flows by Value—Annual Dollars (in Billions), 2001.......................... 3-2
3.3 Regional Trading Partners.................................................................................. 3-3
3.4 Commodity Weight Annual Tons (in Millions), 2001 ........................................... 3-6
3.5 Commodity Value Annual Dollars (in Billions), 2001 .......................................... 3-7
3.6 Freight Subregions ............................................................................................. 3-10
3.7 High-Tonnage Truck Corridors, 2001 ................................................................. 3-14
3.8 High-Value Truck Corridors, 2001 ...................................................................... 3-15
4.1 IRCs and Rail Conflicts, 2004............................................................................. 4-3
4.2 Below Performance Corridors by Speed, 2004 .................................................. 4-4
4.3 Below Performance Corridors by Speed, 2030 .................................................. 4-5
Minnesota Statewide Freight Plan May 2005
Table of Contents
6.1 Percent Population Increase by County, 2000 to 2020 ...................................... 6-2
6.2 Gross State Product for Minnesota All Industries, 1986 to 2001 ........................ 6-3
6.3 Gross State Product for Minnesota Manufacturing Industries, 1986 to 2001 ..... 6-4
8.1 Freight Policy and Policy Directions ................................................................... 8-2
List of Tables 3.1 Shipments between Minnesota and Major Trading Partners by Weight and
Value, 2001......................................................................................................... 3-4
3.2 Shipments between Minnesota and Major Trading Partners by Weight and Value, 2020......................................................................................................... 3-5
3.3 Mode by Trip Type (Annual Tons in Millions), 2001 ........................................... 3-8
3.4 Mode by Trip Type (Annual Dollars in Billions), 2001......................................... 3-8
3.5 Mode by Trip Type (Annual Tons in Millions), 2020 ........................................... 3-9
3.6 Mode by Trip Type (Annual Dollars in Billions), 2020......................................... 3-9
3.7 Top Subregional Freight Flows by Weight, 2001................................................ 3-11
3.8 Top Subregional Freight Flows by Value, 2001................................................. 3-12

Minnesota Statewide Freight Plan May 2005
Introduction 1-1
1.0 Introduction
1.1 Overview
An efficient freight system is an essential ingredient for enhancing the state’s economic competitiveness in the national and global marketplace. In 2001, more than 636 million tons of freight moved in and through Minnesota with a value of $562 billion1, an amount equivalent to 129 tons and $114,000 per resident. This is projected to grow to 1,019 million tons (60 percent increase) and $1,171 billion value (108 percent increase) by 20202. Freight movement is essential for Minnesota’s 9,000 manufacturers, 28,000 retail stores, 15,000 wholesale trade companies, and 3,000 agricultural businesses. These industries together employ nearly 50 percent of the state’s workers. Preserving and enhancing the freight system is critical to maintaining a high quality of life expected by Minnesota’s residents.
The Minnesota Department of Transportation’s planning and programming process is governed by its “Strategic Plan,” which identifies three strategic directions, and by the Minnesota Statewide Transportation Plan, which includes ten policies to implement those strategic directions. The Minnesota Statewide Freight Plan adapts those strategic directions and policies to freight transportation, and defines performance measures specifically for freight within these directions and policies. The Minnesota Statewide Freight Plan further recognizes the importance of clearly articulating the position of Mn/DOT with respect to freight transportation and introduces the following freight specific policy:
Provide an integrated system of freight transportation in Minnesota – highway, rail, water, air cargo, and intermodal terminals – that offers safe, reliable, and competitive access to statewide, national, and international markets.
This freight policy recognizes the importance of all modes for a balanced freight transportation system, the need for connections between modes and, finally, that efficient access to expanding markets is increasingly significant to Minnesota businesses operating in a global economy.
1 Reebie Associates, “2001 TRANSEARCH® Commodity Flow” Data. (“1997 Community Flow Survey”
data used.) 2 Federal Highway Administration, “Freight Analysis Framework,” 2004.

Minnesota Statewide Freight Plan May 2005
1-2 Introduction
1.2 Background
Before the 1990s, state departments of transportation tended to focus on passenger transportation facilities. Freight transportation was traditionally privately owned and operated, subject to varying degrees of government regulatory oversight. Under the impetus of federal transportation legislation [Intermodal Surface Transportation Efficiency Act of 1991 (ISTEA) and Transportation Equity Act for the 21st Century (TEA-21)], and with a policy commitment to freight demonstrated in Mn/DOT’s Minnesota Statewide Transportation Plan (2003), Mn/DOT has developed this first-ever Minnesota Statewide Freight Plan.
The Minnesota Statewide Freight Plan is a multimodal plan that identifies significant freight system trends, needs, and issues. The Plan presents a framework that includes the freight policy, policy directions with strategies and performance measures and indicators that will guide investment decision-making. The Plan will help guide follow-on actions for improving the freight transportation system and suggests appropriate roles for Mn/DOT and stakeholders.
1.3 Freight Definition
For the purposes of this Plan, freight is defined as the transportation of commodities/cargo, raw or finished. This is a long-range plan for statewide freight transportation by trucks on the roadways, by trains on the railways, by ships and barges on the waterways and by airplanes in the skies. Additionally, significant attention has been paid to intermodal movements of freight, where goods move from one mode to another.
Pipelines, an important system for carrying petroleum and natural gas in the state, are not mentioned in the report due to security concerns precluding identification of specific facilities.
1.4 Plan Organization
The findings of the Plan that support this policy are documented, and organized as follows:
Chapter 2 documents the inventory of the existing freight system in Minnesota. This freight system is multimodal in nature and includes highway (commercial vehicle operations), rail, waterway, intermodal and air cargo transportation.
Chapter 3 documents existing and future freight flows in Minnesota. Existing freight flows were developed from a freight database acquired by Mn/DOT. The 2020 forecasts were developed by applying the national forecasts developed for the Federal Highway
Minnesota Statewide Freight Plan May 2005
Introduction 1-3
Administration’s “Freight Analysis Framework” to the counties and external regions in the Minnesota database.
Chapter 4 documents “bottlenecks” in the freight system. These bottlenecks result from deficiencies in design, condition, connectivity and operation of the system.
Chapter 5 documents Mn/DOT’s existing freight programs, the linking of freight programs with other activities and the development of public/private partnerships.
Chapter 6 documents economic, logistic and policy trends that will influence the shipment of freight.
Chapter 7 documents the existing performance measurement framework, lists existing freight performance measures and introduces new freight performance measures.
Chapter 8 documents the proposed freight policy, policy directions and strategic recommendations to improve freight transportation.
Chapter 9 documents the public and stakeholder participation process and includes a summary of comments received.
Chapter 10 documents the next step in the planning process.


Minnesota Statewide Freight Plan May 2005
Infrastructure 2-1
2.0 Infrastructure
This chapter describes Minnesota’s primary freight transportation infrastructure, which is defined as follows:
• Roadways,
• Railroads,
• Ports and waterways,
• Air cargo facilities,
• Intermodal facilities and
• Border crossings.
2.1 Roadways
Trucks are an important mode for moving high-value goods in Minnesota and nationally, and use designated roadway networks. In addition to the roadways designated by the state and federal governments, local roadways serve as important connectors between freight generating and receiving facilities (farms, processing plants, manufacturing centers, and distribution centers) and the primary roadway network.1 The following sections describe the components of the highway system.
2.1.1 The Interstate/NHS and STRAHNET
The National Highway System was developed by the United States Department of Transportation in cooperation with states, municipalities and metropolitan planning organizations. The NHS includes interstate roadways, the Strategic Highway Network, which is the system of public highways that provide access, continuity and emergency transportation of military personnel and equipment, some of the roadways designated as principal arterials,
1 SRF Consulting Group, Inc., Adequacy of Freight Connectors to Interregional Corridors and Major
Highways, Minnesota Department of Transportation, June 2003.

Minnesota Statewide Freight Plan May 2005
2-2 Infrastructure
STRAHNET connectors and intermodal connectors.2 The NHS system in Minnesota is approximately 3,924 miles long and includes two intermodal connectors—one at the Port of Duluth and one at Minneapolis-St. Paul International Airport. Figure 2.1 shows the NHS and STRAHNET.
2.1.2 The National Truck Network and Minnesota Twin Trailer Network
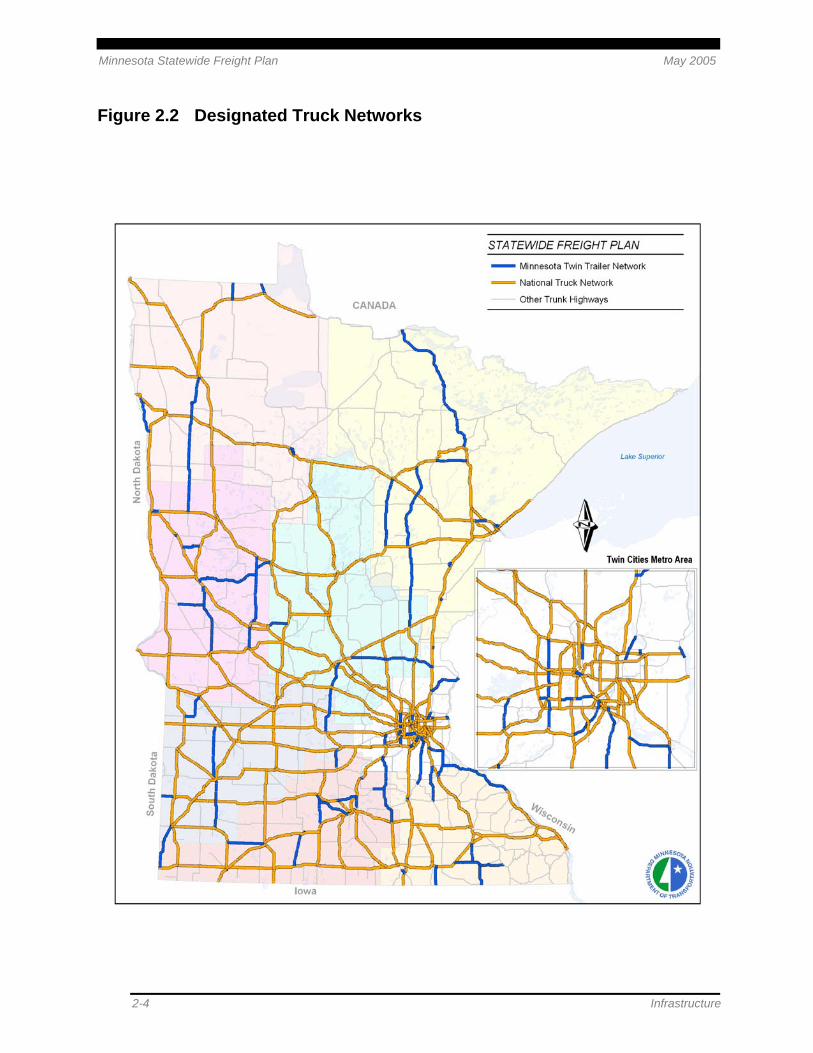
The National Truck Network consists of designated roadways throughout the United States that allow long combination vehicles, semi-trailer trucks with two trailers and single-trailer trucks with an extra-long trailer. In Minnesota, 4,904 miles of roadway are part of the National Truck Network. The NTN is supplemented by Minnesota’s Twin Trailer Network, a system of other trunk and local highways on which LCVs may also operate. Figure 2.2 shows these systems.
2.1.3 The Interregional Corridor System
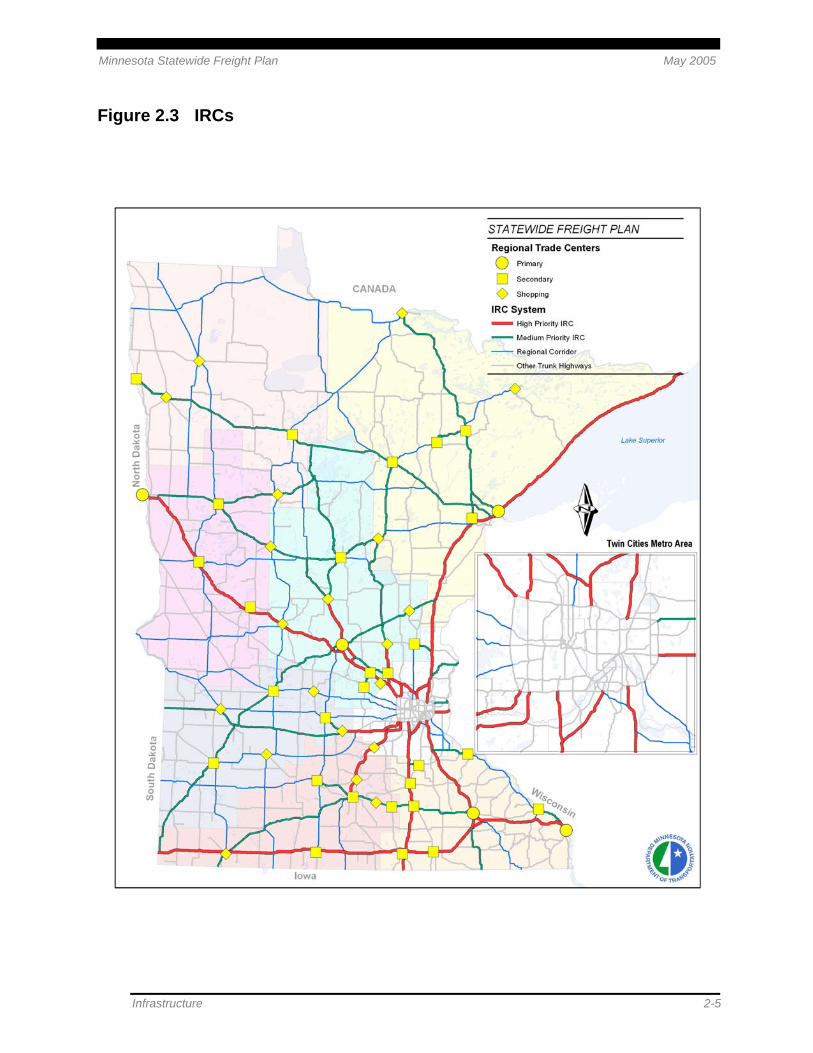
A statewide, 2,926-mile Interregional Corridor System was officially designated by Mn/DOT in 1999. The goal of the IRC system is to enhance the economic vitality of the state by providing safe, timely and efficient movement of goods and people. As shown in Figure 2.3, the IRC system is made up of roadways from the state’s trunk highway system.
The IRC system is divided into two primary categories:3
1. High-priority IRCs – These routes connect the Twin Cities Metropolitan Area trade center with primary trade centers (e.g., Duluth, Rochester, St. Cloud). This category consists of 1,157 miles of roadway.
2. Medium-priority IRCs – These routes connect the secondary trade centers (e.g., Brainerd, Marshall, Owatonna) to each other and to the TCMA and primary trade centers. This category consists of 1,769 miles of roadway.
2 Federal Highway Administration, “What is the National Highway System?”,
http://www.fhwa.dot.gov/hep10/nhs. 3 Minnesota Department of Transportation, Statewide Interregional Corridor Study, 2003.

Minnesota Statewide Freight Plan May 2005
Infrastructure 2-3
Figure 2.1 The NHS and STRAHNET
Minnesota Statewide Freight Plan May 2005
2-4 Infrastructure
Figure 2.2 Designated Truck Networks
Minnesota Statewide Freight Plan May 2005
Infrastructure 2-5
Figure 2.3 IRCs

Minnesota Statewide Freight Plan May 2005
2-6 Infrastructure
2.1.4 The 10-ton Network – “Last Mile Connection”
In addition to the federal- and state-designated routes, local system roadways play an important role in freight movement. City and county routes that receive state aid funding generally connect freight generating/receiving facilities to the state and federal systems. These roadways are often referred to as the “last mile” of the system. Mn/DOT is currently assisting county efforts in developing a 10-ton network of roads that are capable of withstanding heavy trucks; these 10-ton roads provide important connections between intermodal freight facilities/major freight generators and the IRC System.
2.1.5 Ancillary Roadway Facilities
Truck Weigh and Inspection Stations
Truck weigh and inspection stations, owned by Mn/DOT and operated by the Minnesota Department of Public Safety’s State Patrol unit, are located at entry points into Minnesota on the interstate highway system. Enforcement at these stations is intended to ensure that trucks do not exceed the prescribed legal size and weight limits. Weigh and inspection stations also ensure that commercial vehicles are in safe operating condition, and that drivers are complying with regulations such as hours of service and driver credentials. In addition to the permanent facilities shown in Figure 2.4, Minnesota State Patrol operates portable scales and conducts inspections at numerous temporary locations.
Safety Rest Areas
Another important category of highway support facilities is rest areas suitable for commercial vehicles. An adequate system of rest areas is critical to highway safety. Due to the safety concerns identified by the USDOT and other agencies, regulations and rules regarding driver hours of operation have been recently strengthened. The new regulations underscore the importance of having enough high-capacity truck rest areas for long-haul freight carriers. Figure 2.4 also shows the locations of Mn/DOT’s 42 safety rest areas that can accommodate commercial vehicles.

Minnesota Statewide Freight Plan May 2005
Infrastructure 2-7
Figure 2.4 Safety Rest Stations and Weigh/Inspection Stations

Minnesota Statewide Freight Plan May 2005
2-8 Infrastructure
2.2 Railroads
The rail network in Minnesota is important for moving heavy bulk goods and a variety of commodities. Twenty-three railroad companies and three private industries haul rail freight in Minnesota on approximately 4,526 miles of track. The rail companies are divided into three classes, established by the federal Surface Transportation Board. These classes are based upon the railroad company’s gross operating revenues and generally reflect the type of service provided: long haul, regional and local. Smaller railroads frequently interchange with larger railroads for the exchange of carload traffic destined for longer distances.
2.2.1 Railroads by Class
Carriers known as Class I have annual gross operating revenues over $261.9 million. In general, they are considered long-haul carriers. The Class I companies operate 3,250 miles of rail lines in Minnesota and include:
• Burlington Northern Santa Fe Railway (BNSF) (1,641 miles),
• Canadian National Railway (CN) (451 miles),
• Canadian Pacific Railway (CPR) (651 miles) and
• Union Pacific Railroad (UP) (507 miles).
Class II railroads, also referred to as regional railroads, operate a total of 473 miles of rail lines in Minnesota and have gross operating revenues between $21 million and $261.9 million. Class II railroads in the state include:
• Dakota, Minnesota & Eastern Railroad (DME) (277 miles) and
• Iowa, Chicago & Eastern Railroad (ICE) (196 miles).
Class III carriers, also referred to as local railroads or shortline railroads, operate approximately 734 miles of line in Minnesota and have annual gross operating revenues of less than $21 million.4 Class III railroads in the state include:
• Cloquet Terminal Railroad (CTRR) (4 miles),
• Minnesota Commercial Railway Company (MNNR) (35 miles),
• Minnesota Northern Railroad, Inc. (MNN) (175 miles),
• Minnesota Prairie Line (MPLI) (94 miles),
4 Minnesota Statewide Transportation Plan, pp. 3-10.
Minnesota Statewide Freight Plan May 2005
Infrastructure 2-9
• Minnesota Southern Railway (MSWY) (41 miles),
• Minnesota, Dakota and Western Railway (MDW) (4 miles),
• Northern Plains Railroad (NPR) (44 miles),
• North Shore Scenic on SLLX (NSSR) (25 miles),
• Otter Tail Valley Railroad (OTVR) (75 miles),
• Progressive Rail Inc. (PGR) (53 miles),
• Red River Valley and Western (RRVW) (2 miles),
• St. Croix Valley Railroad Company (SCXY) (37 miles) and
• Twin Cities & Western Railroad Company (TCWR) (145 miles).
2.2.2 Service (Trains Per Day)
The railway system in Minnesota operates service on a variety of schedules. In general, the higher the rail class, the more daily trains and the greater tonnage. Figure 2.5 identifies the number of trains operating per day by rail corridor, and also the Strategic Railroad Network, the railroad equivalent of the STRAHNET.

Minnesota Statewide Freight Plan May 2005
2-10 Infrastructure
Figure 2.5 Minnesota Rail Classes and STRACNET

Minnesota Statewide Freight Plan May 2005
Infrastructure 2-11
2.3 Ports and Waterways
Minnesota is served by two waterway systems: the Mississippi River and the Great Lakes/St. Lawrence Seaway. These bodies of water provide a low-cost, effective means of transporting bulk products over long distances. Figure 2.6 shows the location of ports, locks and dams on the Mississippi River and Great Lakes systems serving Minnesota and Wisconsin.
2.3.1 The Mississippi River System
The Mississippi River system, which also includes 23 navigable miles of the St. Croix River and 14.7 navigable miles of the Minnesota River, connects Minnesota with the international port at New Orleans. Within Minnesota, the system is 222 miles long and encompasses five port areas (Savage, Minneapolis, St. Paul, Red Wing and Winona) and a series of 11 locks and dams. The U.S. Army Corps of Engineers dredges a channel to accommodate a nine-foot draft, and operates all locks and dams on the Mississippi River system from Minneapolis to St. Louis, Missouri.5 Local authorities and private companies act as local port authorities. In the ports of St. Paul, Red Wing and Winona, local port authorities own facilities that ship and receive products via the Mississippi River. The City of Minneapolis acts as a port authority, contracts out the management of the city-owned facility and keeps the profits or assumes the losses generated by the facility.6 In Savage, all of the terminals are owned and operated by private companies.
Barges are used to haul freight up and down the Mississippi River between the Twin Cities and New Orleans.7 The Mississippi River system in Minnesota remains in operation for approximately eight months of the year, from the middle of March through November, when it closes in anticipation of ice.
5 “River Transportation in Minnesota,” Minnesota Department of Transportation, Ports and Waterways
Section, 2001, pp. 10, 43. 6 “River Transportation in Minnesota,” Minnesota Department of Transportation, Ports and Waterways
Section, 2001, pp. 10, 43. 7 “River Transportation in Minnesota,” Minnesota Department of Transportation, Ports and Waterway
Section, 2001, p. 22.

Minnesota Statewide Freight Plan May 2005
2-12 Infrastructure
Figure 2.6 Ports, Locks, and Dams (River and Lake)

Minnesota Statewide Freight Plan May 2005
Infrastructure 2-13
2.3.2 The Great Lakes System
Minnesota has four ports on Lake Superior: Duluth, Two Harbors, Silver Bay and Taconite Harbor. In 2002, these ports handled a total of 63.7 million tons of freight. The taconite industry in Minnesota accounts for a major part of freight transported on Lake Superior.8 The U.S. Corps of Engineers and the Canadian government operate the locks on the Great Lakes/St. Lawrence Seaway system and maintain a 29-foot-deep navigational channel.9
In the port of Duluth, the Seaway Port Authority of Duluth owns some of the facilities that ship and receive products via Lake Superior. The remaining Duluth Port facilities are privately owned and operated. In the three other Lake Superior ports, the facilities are owned and operated by private companies.
A wide variety of ships are used to haul freight from Lake Superior to international desti-nations. Ocean bulk freighters and ocean cargo vessels are used to carry dry bulk, general cargo, break bulk, specialty bulk commodities, bulk grain and processed agricultural products from the Great Lakes to destinations around the world. Ocean bulk freighters and ocean cargo vessels are limited in size by the length and width of locks on the seaway portion of the system.10 Lake bulk carriers, also known as lakers, are the most common large commercial ship operating on the Great Lakes. Lakers carry dry bulk commodities such as grain, limestone, coal, iron ore and taconite pellets. The lakers are up to 1,000 feet long and can carry up to 66,000 tons of cargo. The large bulk lakers stay within the upper four Great Lakes (Superior, Huron, Michigan and Erie) because they are too large to enter the Welland Canal portion of the seaway system that will give them access to Lake Ontario. In addition to the dry bulk lakers, lake tanker vessels carry liquid cargo such as petroleum, chemicals or industrial molasses. Lake tanker vessels can carry up to 19,000 tons or about 5.7 million gallons.11
The lake port system in Minnesota is typically open for service nine months of the year, from March 25 to January 15, when it closes due to ice.
8 “Great Lakes Transportation in Minnesota,” Minnesota Department of Transportation, Ports and
Waterways Section, 1994, p. 3. 9 “Great Lakes Transportation in Minnesota,” Minnesota Department of Transportation, Ports and
Waterways Section, 1994, p. 3. 10“Great Lakes Transportation in Minnesota,” Minnesota Department of Transportation, Ports and
Waterways Section, 1994, pp. 4, 21. 11“Great Lakes Transportation in Minnesota,” Minnesota Department of Transportation, Ports and
Waterways Section, 1994, pp. 4, 21.

Minnesota Statewide Freight Plan May 2005
2-14 Infrastructure
2.4 Air Cargo
Airports in Minnesota provide a direct link to economic hubs and metropolitan areas throughout the United States and the world. The aviation system in Minnesota is the preferred mode for moving high-value or time-sensitive goods over long distances. Firms in Minnesota are limited in their ability to connect with international destinations. Because more frequent international service is available in Chicago, air cargo is often shipped there via truck and then sent by air to international destinations.
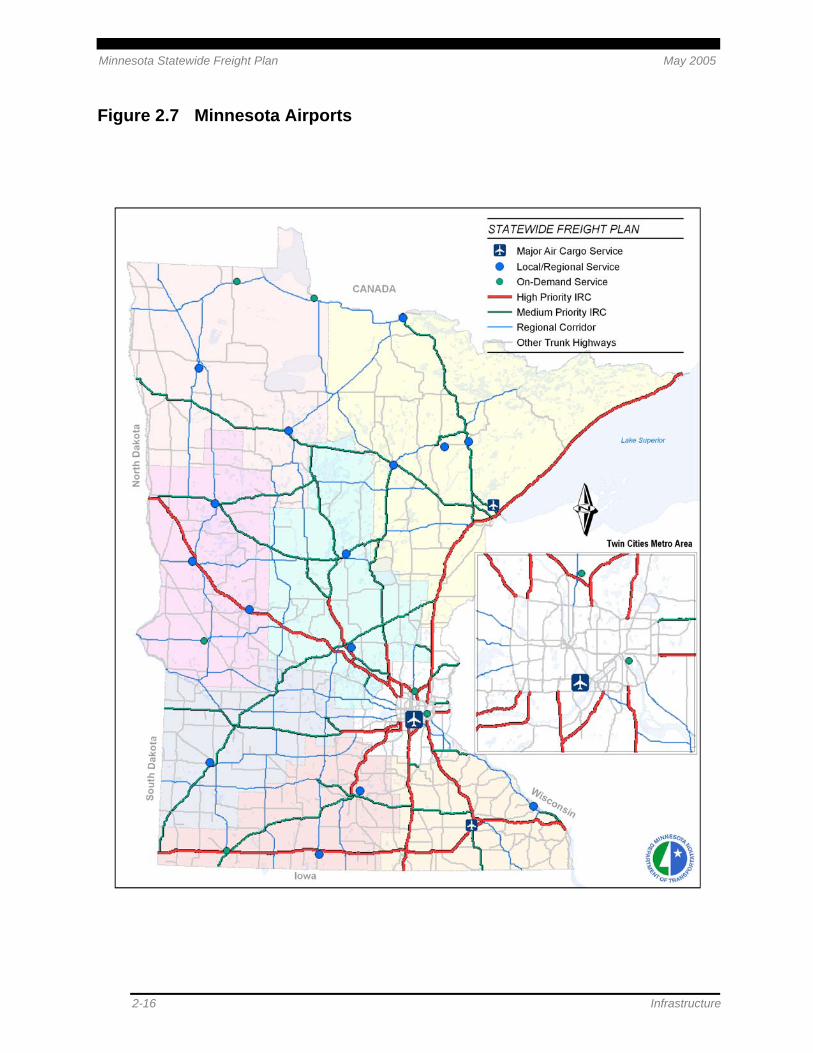
Minnesota has 143 public-use airports dispersed throughout the state. A majority of these facilities are used for general aviation. As shown in Figure 2.7, there are only 24 airports in the state with measurable air cargo activity. Of the 24, nine are capable of providing dedicated air cargo services.12 The freight airports in Minnesota fall into three categories: major, local/regional and on-demand air cargo service airports. Major airports have scheduled air cargo service with jet aircraft. MSP, Duluth International and Rochester International airports belong to this category.13 Ninety percent of the air cargo moving into and out of the state goes through MSP, while Duluth and Rochester account for seven percent. The remaining three percent moves through other local and on-demand airports.
2.5 Intermodal Terminals
“Intermodal” refers to the transfer of freight from one mode of transportation to another. Intermodal freight facilities include container cargo transfer facilities, elevators, terminals, vehicle ramps and other fixed locations where freight is transferred between modes or systems (truck, rail, water and air). USDOT in 2002 identified the 67 intermodal facilities in Minnesota described below. Many of the intermodal facilities are located near major rivers and lake terminal areas in cities such as Duluth, Minneapolis, St. Paul, Red Wing and Winona. Apart from the 67 facilities identified by USDOT, there are numerous smaller facilities with local significance.
12 “Great Lakes Transportation in Minnesota,” Minnesota Department of Transportation, Ports and
Waterways Section, 1994, pp. 3-7. 13 Minnesota Statewide Air Cargo Study, Minnesota Department of Transportation, Office of Aeronautics,
1999, p. 14.

Minnesota Statewide Freight Plan May 2005
Infrastructure 2-15
2.5.1 Rail Container Facilities Served by Highway
Container transfer facilities handle rail-to-truck and truck-to-rail transfers in sealed units (trailers on flat car/containers on flat car). There are four container transfer facilities in Minnesota, two of which are in the Twin Cities.
One facility is located in northeast Minneapolis and is operated by the Canadian Pacific Rail System. This terminal handles approximately 30 percent of the regional container traffic. The second facility is in St. Paul and is operated by Burlington Northern Santa Fe. This terminal handles 70 percent of containerized traffic in the region.14 Other container facilities are located in the Greater Minnesota cities of Dilworth and International Falls. No data is presently available on the amount of container traffic at these locations; however, the number is small when compared to the Twin Cities.
2.5.2 Port Facilities Served by Highway and Rail
According to USDOT, 28 intermodal terminals in Minnesota transfer bulk materials between port facilities and highways. Four of these port facilities are at the Lake Superior Port of Duluth (three of these are Lake Superior bulk port facilities with railroad connections for shipping metallic ores). Twenty-four are on the Mississippi or Minnesota rivers.
2.5.3 Other Bulk Facilities Served by Highway
Thirty-three of the intermodal terminals in Minnesota are bulk rail facilities with highway connections by USDOT standards. Eleven of these facilities are served by the Canadian Pacific Railroad, 10 are served by Union Pacific Railroad, eight are served by Burlington Northern Santa Fe Railroad and four are served by the Minnesota Commercial Railroad.
2.5.4 NHS Intermodal Connectors
Intermodal connectors are the public roads leading to major intermodal terminals that have a critical bearing on the efficient operation of that facility.15 Minnesota presently has two intermodal connectors identified by USDOT. These connectors link the highway system to MSP and the Duluth seaport. 14 Percent is based on the number of lifts at these two locations. The other three locations in Minnesota
have minimal activity when compared to these facilities. Also, the Twin Cities operations are considered small when compared to the amount of container activity moved through Chicago.
15 “The Role of the National Highway System Connectors: Industry Context and Issues,” USDOT FHWA, 1999, p. 4.
Minnesota Statewide Freight Plan May 2005
2-16 Infrastructure
Figure 2.7 Minnesota Airports
Minnesota Statewide Freight Plan May 2005
Infrastructure 2-17
2.6 The Minnesota Border-Crossing Network
Minnesota’s border with Canada has eight crossings that accommodate truck and/or rail transportation. These border crossings account for 1.6 percent of total loaded truck containers and 18.7 percent of total loaded train containers moved by truck or train from Canada into the United States. Freight movement occurs at seven of these crossings: Baudette, Grand Portage, International Falls (including the Ranier railroad crossing), Noyes, Pinecreek, Roseau and Warroad.16 The crossing at Lancaster, Minnesota, has no recorded data associated with freight movements. Figure 2.8 shows the Minnesota-Canada border crossings at Minnesota, including Lancaster.
In addition to the crossings on the Minnesota-Canada border, the crossing at Pembina, North Dakota, also serves freight flows into the state. Many trucks from Canada enter at Pembina and use Interstate 29 until it connects to Interstate 94, which travels through Minnesota.
16 Border crossing/entry data from the U.S. Department of Transportation, Bureau of Transportation
Statistics, available at http://www.bts.gov/programs/international/border_crossing_entry_data; data from U.S. Customs Service, Mission Support Services, Office of Field Operations, Operations Management Database.

Minnesota Statewide Freight Plan May 2005
2-18 Infrastructure
Figure 2.8 Minnesota’s Border Crossing Network

Minnesota Statewide Freight Plan May 2005
Freight Flows 3-1
3.0 Freight Flows
Understanding the flow of freight by weight provides insights into the infrastructure needs in Minnesota (e.g., pavement, tracks, capacity). Understanding the flow of freight by value provides insights into the economic impact of freight (e.g., cost of shipping, economic development, location of markets). In order to provide this understanding, Mn/DOT acquired the commercial 2001 TRANSEARCH® freight database from Reebie Associates. While it does not include retail and urban freight shipments, it does include the intrastate and interstate freight flows that constitute most of the freight moved on the system described in Chapter 21. Data from this source was used in all tables showing 2001 data.
The forecast of freight flows to 2020 was based on the state-to-state forecasts developed for the FHWA’s Freight Analysis Framework project. The FAF used an economic model of the United States to forecast commodity shipments. The projected rates of change in those shipments were applied to the 2001 Minnesota data. Data from this source was used in all tables showing 2020 data.
3.1 Directional Flows
An analysis of the 2001 data showed 636 million tons of freight – 4 percent of the U.S. total – moving annually on the transportation system in Minnesota. The freight was valued at $560 billion, or 6 percent of the U.S. total, and was fairly evenly distributed by direction (inbound, outbound, intrastate, through) as shown in Figures 3.1 and 3.2.
1 While the TRANSEARCH® database is the accepted standard for freight flows and is widely used in
state and federal studies, it is based on expansions of surveys of freight shippers and carriers of manufactured products, commodities used as raw materials, and agricultural and mining. . As a survey, it may not be a complete representation of all movements.

Minnesota Statewide Freight Plan May 2005
3-2 Freight Flows
Figure 3.1 Directional Flows by Weight – Annual Tons (in Millions)
Intrastate208.4 M
33%
Outbound152.4 M
24%
Inbound132.8 M
21%
Through142.0 M
22%
Figure 3.2 Directional Flows by Value – Annual Dollars (in Billions)
Inbound121.022%
Through159.228%
Outbound115.721%
Intrastate166.429%
By 2020, the weight of freight shipped in, out, within and through Minnesota is expected to reach 1,019 billion tons, an increase of 60 percent over 2001. This will significantly increase freight transportation demand on the state’s infrastructure. While intrastate flows are expected to grow slightly more than other trip types, the relative balance shown in Figure 3.1 is forecast to remain nearly unchanged. The value of Minnesota’s freight flows is forecast to increase from

Minnesota Statewide Freight Plan May 2005
Freight Flows 3-3
$562 billion to $1.171 trillion between 2001 and 2020, more than doubling the current value of shipments. The growth rate in value is significantly higher than the growth rate for tons. This indicates that in 2020 the shipment of high-value goods will increase relative to 2001, while the shipment of low-value goods will decrease. The distribution of value among each of the trip types will remain largely unchanged from that shown in Figure 3.2.
As shown in Figures 3.1 and 3.2, nearly 22 percent of the freight tonnage and 28 percent of the value moving on the transportation system in Minnesota has neither an origin nor destination in the state, but rather serves the national economy. The vast majority of the freight traveling through Minnesota is generated by the Midwest, Plains and Mountain states, which are also major trading partners for Minnesota. In addition, Minnesota serves as a major gateway for freight shipped to and from Canada. Overall, the freight shipped through Minnesota is split almost equally between rail and truck. The commodities moving through Minnesota are primarily bulk freight such as farm and food products, coal, chemicals and lumber.
3.2 Freight Origins and Destinations
Minnesota’s trading partners (defined and shown in Figure 3.3) provide markets for its producing industries and serve as suppliers to Minnesota’s consuming industries. Table 3.1 shows in detail the inbound and outbound shipments of the trading partners. Minnesota’s outbound freight is principally destined for the Midwest states, which receive 51 percent of its outbound shipments by tonnage and over 35 percent of its outbound shipments by value.
Figure 3.3 Regional Trading Partners

Minnesota Statewide Freight Plan May 2005
3-4 Freight Flows
Minnesota’s inbound freight comes mainly from the Plains states, which are the origin of 38 percent of its inbound shipments by tonnage and nearly 35 percent of its inbound shipments by value. Other major trading partners by weight are the Mountain, South and West/Southwestern states. Other major trading partners by value are the South and West/Southwestern states.
Table 3.1 Shipments Between Minnesota and Major Trading Partners
by Weight and Value, 2001
Millions of Tons Billions of Dollars From MN To MN From MN To MN Region Tons Percent Tons Percent Dollars Percent Dollars Percent
Midwest 78.3 51.2% 30.8 23.2% $41.1 35.5% $38.6 31.9% Plains 21.1 13.8% 50.0 37.6% $24.0 20.7% $41.9 34.6% Mountain 3.3 2.2% 28.2 21.2% $3.3 2.9% $2.0 1.7% West/Southwest 20.3 13.3% 6.3 4.7% $18.8 16.2% $13.5 11.2% South 17.4 11.4% 9.2 6.9% $13.2 11.4% $15.1 12.5% Canada 8.2 5.4% 6.5 4.9% $7.1 6.1% $4.9 4.0% Mid-Atlantic 3.1 2.0% 1.5 1.1% $6.4 5.5% $3.5 2.9% New England 0.6 0.4% 0.3 0.2% $1.5 1.3% $1.2 1.0% Mexico 0.1 0.3% 0.1 0.1% $0.4 0.3% $0.4 0.3% Total 152.4 100.0% 132.8 100.0% $115.8 100.0% $121.1 100.0%
Minnesota’s principal trading partners in 2020 are projected to be the same as those in 2001. The largest amount of Minnesota’s outbound freight is still forecast to be destined to the Midwest states, but its share will decline from 51 to 43 percent by tonnage while the share of the shipments by value will increase from 35 to 36 percent. The largest amount of Minnesota’s inbound freight is still forecast to be from the Plains states, whose share of the shipments by tonnage will remain at 38 percent and of value will remain at 35 percent. As shown in Table 3.2, other major trading partners by weight are the Mountain, South and West/Southwestern states, which are all forecast to have above average growth rates. Other major trading partners by value will be the South and West/Southwestern states. While the growth of shipments by value to the South is forecast to have below average growth, the West is expected to have growth rates significantly above average.

Minnesota Statewide Freight Plan May 2005
Freight Flows 3-5
Table 3.2 Shipments Between Minnesota and Major Trading Partners by Weight and Value, 2020
Millions of Tons Billions of Dollars From MN To MN From MN To MN Region Tons Percent Tons Percent Dollars Percent Dollars Percent
Midwest 96.5 43.3% 47.6 23.6% $83.10 36.1% $68.10 30.2% Plains 36.8 16.5% 74.7 37.4% $50.60 22.0% $79.50 35.3% Mountain 5.9 2.6% 41.8 20.9% $6.40 2.8% $3.50 1.6% West/Southwest 34.0 15.3% 12.2 6.1% $37.20 16.2% $29.60 13.1% South 25.9 11.7% 10.4 5.2% $20.80 9.0% $23.80 10.6% Canada 34.0 15.3% 9.5 4.8% $16.80 7.3% $10.20 4.5% Mid-Atlantic 5.7 2.5% 2.6 1.3% $12.20 5.3% $6.90 3.1% New England 0.8 0.4% 0.5 0.3% $2.00 0.9% $2.10 0.9% Mexico 1.2 0.5% 0.3 0.2% $1.20 0.5% $1.60 0.7% Total 222.7 100.0% 199.7 100.0% $230.3 100.0% $225.3 100.0%
3.3 Commodities Shipped
The importance of certain commodities in Minnesota, as determined by their share of freight, is quite different when ranked by weight or value. Modes that carry the largest share of weight place the most demand on the freight infrastructure. The commodities that these modes carry tend to be high-density and low-value, require low shipping costs and are not time-sensitive. The distribution of commodities by weight is shown in Figure 3.4. The top five freight commodities moving in Minnesota by tonnage are high-weight, low-value bulk shipments: farm products, non-metallic minerals, food products, metallic ores and coal.

Minnesota Statewide Freight Plan May 2005
3-6 Freight Flows
Figure 3.4 Commodity Weight in Annual Tons (Millions), 2001
0
20
40
60
80
100
120
140
Farm P
roduc
ts
Nonmeta
llic M
ineral
s
Food P
roduc
ts
Metallic
Ores Coa
l
Distrib
ution
Flows
Lumbe
r or W
ood P
roduc
ts
Chemica
ls or
Allied P
roduc
ts
Clay, C
oncre
te, G
lass,
or Ston
e Prod
ucts
Petrole
um or
Coa
l Prod
ucts
All Othe
r Com
moditie
s
As shown in Figure 3.5, the top five freight commodities overall moving in Minnesota by value are warehousing2, farm products, food products, transportation equipment and electrical machinery.
2 Warehousing, often called secondary flow, is truck freight flow to and from distribution centers and drayage flows of intermodal containers where the commodity is not specified and may be of mixed commodities. Secondary flows are goods that originate in warehouses and distribution centers and are generally destined for commercial and manufacturing locations for final delivery. Secondary flows generally represent goods that have been through their final stage of processing and manufacturing.

Minnesota Statewide Freight Plan May 2005
Freight Flows 3-7
Figure 3.5 Commodity Value in Annual Dollars (Billions), 2001
0
20
40
60
80
100
120
140
160
180
Ware
hous
ing
Farm P
roduc
ts
Food P
roduc
ts
Transp
ortati
on E
quipm
ent
Electric
al Mac
hinery
Machin
ery (N
on-E
lectric
al)
Precisi
on In
strum
ents
Chemica
ls or
Allied P
roduc
ts
Miscell
aneo
us M
ixed S
hipmen
ts
Pulp or
Pap
er Prod
ucts
All Othe
r Com
moditie
s
The top three commodities in 2020 by weight are expected to be the same top three com-modities as in 2001: farm products, non-metallic minerals and food products. The shipments of these combined commodities are expected to increase by 56 percent. By 2020 the tonnage shipped of warehousing flows, lumber or wood products, and clay, concrete, glass or stone products is forecast to more than double.
The largest increase in value by 2020 is expected to be of warehousing flows. Other large increases are expected for the value of electrical equipment, a growth of 169 percent. Farm products are forecast to grow in value by 20 percent by 2020, but to decline from the second largest commodity to the fifth largest commodity.
3.4 Modes
Overall, trucks carry the largest proportion of freight in Minnesota. However, Minnesota generally has a relatively high percentage of freight moved by rail and water compared to the rest of the country. This is evident in each of the four trip types as shown in Table 3.3. Notably, intermodal rail is significantly higher for through movements relative to the other trip types. Air cargo accounts for a negligible percentage of tons for Minnesota freight movement.

Minnesota Statewide Freight Plan May 2005
3-8 Freight Flows
Mode Intrastate Outbound Inbound Through Total Total Percent Truck 179.2 54.1 81.9 58.5 373.7 58.8% Carload Rail 26.4 57.3 42.5 70.1 196.3 30.9% Water 2.8 38.9 6.5 4.8 53.0 8.3% Intermodal Rail 0.0 2.0 1.7 8.2 12.0 1.9% Air 0.0 0.2 0.3 n/a 0.9 0.1% Total 208.4 152.4 132.9 142.0 635.8 100.0% Total Percent 32.8% 24.0% 20.9% 22.3% 100.0%
Goods carried by the trucks tend to have higher value-weight ratios than both rail and water. Therefore, the trucking carries a higher percentage of the value of the goods shipped in the state than it does the percentage of tonnage shipped. Table 3.4 shows that the truck mode carries 79 percent of the total value of all shipments, compared to 59 percent of all shipments in terms of tons. Air cargo transports goods with the highest value-weight ratio of all modes. Air cargo represents 0.1 percent of the goods in terms of tons, but 6 percent of the goods in terms of value. Intermodal rail represents 2 percent of the total tons shipped in Minnesota, but 4 percent of the total value of goods shipped in the State.
Mode Intrastate Outbound Inbound Through Total Percent of Total
Average Value-
Weight Ratio ($/Ton)
Truck 162.8 85.2 97.2 99.8 444.9 79% 1,191 Carload Rail 3.1 13.7 9.9 27.0 53.7 10% 274 Water 0.4 4.6 0.6 0.5 6.0 1% 113 Intermodal Rail 0.0 4.3 3.4 16.7 24.4 4% 2,033 Air 0.1 7.9 9.9 15.4 33.3 6% 37,000
Total 166.4 115.7 121.0 159.2 562.3 100% 884 Total Percent 30.0% 21.0% 22.0% 28.0% 100.0% Truck tonnage is expected to carry 670 million tons of freight in 2020, an increase of 79 percent (Table 3.5). Intrastate shipments are forecast to be roughly half of the truck tonnage total, far surpassing the truck tons from the other three trip types. Carload rail shipments are forecast to increase by 34 percent. Rail through movements are the largest through trip type with 101 million tons. Through rail movements are also expected to be the largest through movement of all modes in 2020. Air cargo is forecast to more than double between 2001 and 2020 to more than two million tons carried.
Table 3.4 Mode by Trip Type (Annual Dollars in Billions), 2001
Table 3.3 Mode by Trip Type (Annual Tons in Millions), 2001

Minnesota Statewide Freight Plan May 2005
Freight Flows 3-9
Table 3.5 Mode by Trip Type (Annual Tons in Millions), 2020
Mode Intrastate Outbound Inbound Through Total Percent of
Total
Percent Growth
2001-2020 Truck 345 98.8 129.6 96.8 670.3 66% 79% Carload Rail 22.7 74.5 64.4 101.2 262.7 26% 34% Water 4.5 45.8 8.3 6.1 64.8 6% 22% Intermodal Rail 0 3.7 3.2 13.1 20 2% 67% Air 0 0.4 0.7 n/a 2.1 0% 133% Total 372.3 223.2 206.3 218 1,019.8 100% 60% Percent of Total 37% 22% 20% 21% 100%
Percent Growth 2001-2020 79% 46% 55% 54% 60%
In terms of value, as shown in Table 3.6, trucks will continue to be the dominant mode of transport for Minnesota, carrying $957 billion worth of goods in 2020, an increase of 115 percent. Air cargo will undergo the fastest growth in this time period increasing by 142 percent. This will make air cargo in Minnesota roughly equivalent to carload rail in terms of overall value of shipments for the state. The value of intermodal rail shipments is forecast to grow to $42 billion, an increase of 74 percent over 2001. The value of water shipments will decline slightly, despite a 22 percent growth in the tonnage of shipments between 2001 and 2020.
Mode Intrastate Through Inbound Outbound Total Percent of Total
Percent Change 2001-2020
Truck 386.3 201.9 193.1 175.5 956.8 82% 115% Carload Rail 3.4 46.8 14.4 20.5 85.2 7% 59% Air 0.4 34.6 24.8 20.8 80.6 7% 142% Intermodal Rail 0.0 27.5 6.7 8.2 42.4 4% 74% Water 0.0 2.7 1.6 1.5 5.8 0% -3% Total 390.2 313.4 240.7 226.5 1,170.8 100% 108% Percent of Total 33% 27% 21% 19% 100%
Percent Change 2001-2020 135% 97% 99% 96% 108%
Table 3.6 Mode by Trip Type (Annual Dollars in Billions), 2020

Minnesota Statewide Freight Plan May 2005
3-10 Freight Flows
3.5 Subregional Analysis
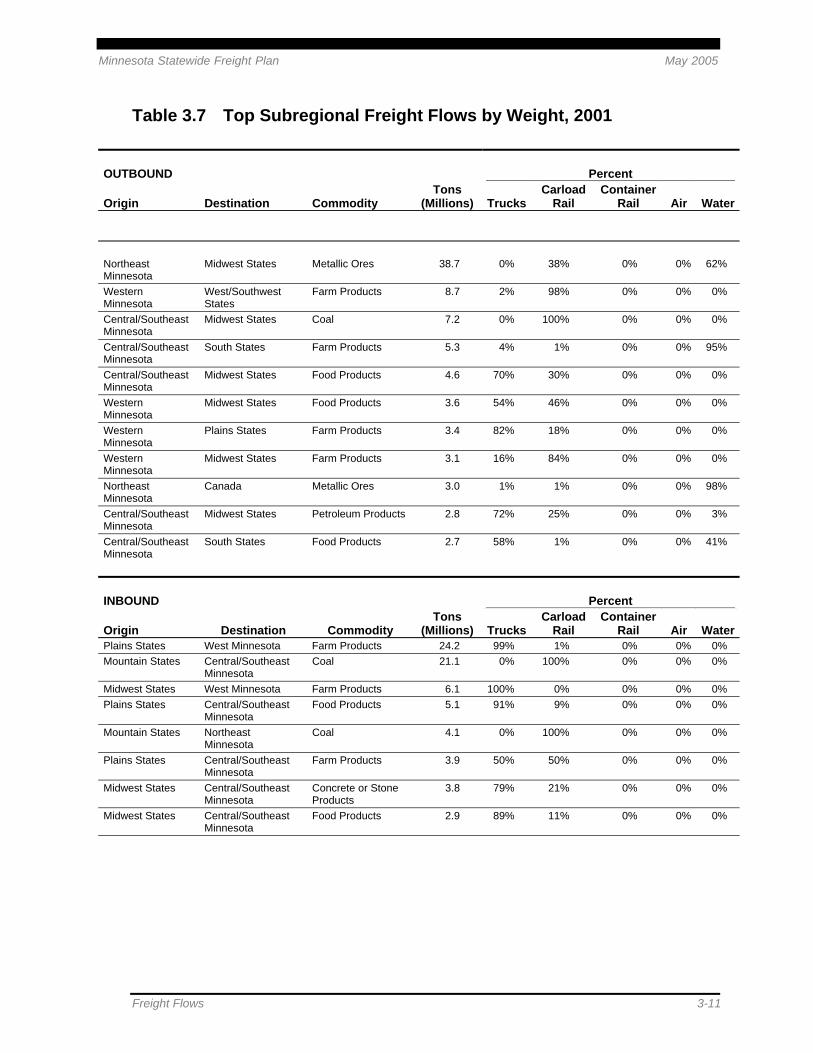
Distinct freight subregions within Minnesota were observed based on the similarities of the commodities produced and consumed, the modes used and the inbound and outbound trading partners. These subregions are Northeast Minnesota, defined as Area Transportation Partnership 1; Western Minnesota, defined as ATPs 2, 4, 7 and 8; and Central/Southeast Minnesota, defined as ATPs 3, 6 and Metro. The top exchanges of freight from these subregions to Minnesota trading partners by commodity and mode for 2001 are shown by tonnage in Table 3.7 and by value in Table 3.8.
Northeast Minnesota is the center of Minnesota’s mining industry. Freight from the Northeast subregion consists primarily of metallic ore (taconite) shipped to the Midwest states and Canadian provinces. Railroads and Great Lakes water ports are the principal modes carrying this bulk freight. The Lake Superior ports also ship substantial tonnages of coal arriving by rail from the Mountain states.
Western Minnesota’s principal industries are farming and food processing. Freight from the Western subregion consists primarily of farm and food products shipped to the Midwest, South and West/Southwestern states. This freight moves primarily by railroads. The railroad terminals in the Western subregion also ship large amounts of farm products that arrive by truck from the Plains states. The subregion’s freight also includes a substantial amount of warehousing freight shipped to and from the Plains states.
Central/Southeast Minnesota’s urban areas are the centers of Minnesota’s manufacturing and service industries. Among the most valuable freight shipped from this subregion is electrical machinery shipped to the Midwest, by truck and air. Much of the freight supporting urban populations in Central/Southeast subregion include: coal from the Mountain states received by rail; food products from the Midwest and Plains states received by rail and truck; concrete and stone from the Midwest states received by truck; and transportation products from the Midwest states received by truck and rail. Central/Southeast Minnesota is an important distribution center for shipping and receiving warehousing freight by truck to and from the Midwest and Plains states. The Mississippi River ports in this subregion receive large shipments of coal by rail from the Mountain states that is then shipped out by water to the Midwest states. The Central/Southeast subregion also receives farm products from the Plains states by truck and rail, which is then shipped out by water to the Southern states.
Figure 3.6 Freight subregions
Minnesota Statewide Freight Plan May 2005
Freight Flows 3-11
Table 3.7 Top Subregional Freight Flows by Weight, 2001
OUTBOUND Percent
Origin Destination Commodity Tons
(Millions) TrucksCarload
Rail Container
Rail Air Water
Northeast Minnesota
Midwest States Metallic Ores 38.7 0% 38% 0% 0% 62%
Western Minnesota
West/Southwest States
Farm Products 8.7 2% 98% 0% 0% 0%
Central/Southeast Minnesota
Midwest States Coal 7.2 0% 100% 0% 0% 0%
Central/Southeast Minnesota
South States Farm Products 5.3 4% 1% 0% 0% 95%
Central/Southeast Minnesota
Midwest States Food Products 4.6 70% 30% 0% 0% 0%
Western Minnesota
Midwest States Food Products 3.6 54% 46% 0% 0% 0%
Western Minnesota
Plains States Farm Products 3.4 82% 18% 0% 0% 0%
Western Minnesota
Midwest States Farm Products 3.1 16% 84% 0% 0% 0%
Northeast Minnesota
Canada Metallic Ores 3.0 1% 1% 0% 0% 98%
Central/Southeast Minnesota
Midwest States Petroleum Products 2.8 72% 25% 0% 0% 3%
Central/Southeast Minnesota
South States Food Products 2.7 58% 1% 0% 0% 41%
INBOUND Percent
Origin Destination Commodity Tons
(Millions) TrucksCarload
Rail Container
Rail Air WaterPlains States West Minnesota Farm Products 24.2 99% 1% 0% 0% 0% Mountain States Central/Southeast
Minnesota Coal 21.1 0% 100% 0% 0% 0%
Midwest States West Minnesota Farm Products 6.1 100% 0% 0% 0% 0% Plains States Central/Southeast
Minnesota Food Products 5.1 91% 9% 0% 0% 0%
Mountain States Northeast Minnesota
Coal 4.1 0% 100% 0% 0% 0%
Plains States Central/Southeast Minnesota
Farm Products 3.9 50% 50% 0% 0% 0%
Midwest States Central/Southeast Minnesota
Concrete or Stone Products
3.8 79% 21% 0% 0% 0%
Midwest States Central/Southeast Minnesota
Food Products 2.9 89% 11% 0% 0% 0%

Minnesota Statewide Freight Plan May 2005
3-12 Freight Flows
Table 3.8 Top Subregional Freight Flows by Value, 2001
OUTBOUND Percent
Origin Destination Commodity $
(Billions) TrucksCarload
Rail Container
Rail Air Water Central/Southeast Minnesota
Midwest States Warehousing $9.3 100% 0% 0% 0% 0%
Central/Southeast Minnesota
Plains States Warehousing $7.9 100% 0% 0% 0% 0%
Central/Southeast Minnesota
Midwest States Food Products $3.5 84% 16% 0% 0% 0%
Western Minnesota Midwest States Warehousing $3.2 100% 0% 0% 0% 0% Western Minnesota Plains States Warehousing $2.8 100% 0% 0% 0% 0% Northeast Minnesota
Midwest States Metallic Ores $2.6 0% 44% 0% 0% 56%
Central/Southeast Minnesota
Midwest States Electrical Machinery
$2.6 84% 0% 2% 13% 0%
Western Minnesota West/Southwest States
Farm Products $2.6 3% 96% 0% 0% 0%
Western Minnesota Midwest States Food Products $2.5 73% 27% 0% 0% 0%
INBOUND Percent
Origin Destination Commodity $
(Billions) TrucksCarload
Rail Container
Rail Air Water
Plains States Western Minnesota Farm Products $14.4 100% 0% 0% 0% 0% Plains States Central/Southeast
Minnesota Warehousing $9.9 100% 0% 0% 0% 0%
Midwest States Central/Southeast Minnesota
Warehousing $8.2 100% 0% 0% 0% 0%
Midwest States Central/Southeast Minnesota
Transportation Equipment
$6.9 48% 50% 0% 1% 0%
Plains States Central/Southeast Minnesota
Food Products $4.4 96% 4% 0% 0% 0%
Midwest States Western Minnesota Farm Products $3.6 100% 0% 0% 0% 0% West/Southwest States
Central/Southeast Minnesota
Electrical Machinery
$3.0 86% 0% 0% 14% 0%
Plains States Western Minnesota Warehousing $2.7 100% 0% 0% 0% 0% Midwest States Central/Southeast
Minnesota Food Products $2.5 95% 5% 0% 0% 0%
Midwest States Central/Southeast Minnesota
Farm Products $2.2 99% 1% 0% 0% 0%
West/Southwest States
Central/Southeast Minnesota
Electrical Machinery
$2.2 63% 0% 0% 37% 0%

Minnesota Statewide Freight Plan May 2005
Freight Flows 3-13
3.6 Routes
3.6.1 Trucking
As shown in Figure 3.7, most truck freight moves primarily on Minnesota’s Interstate Highway System and major IRCs. The highest truck-ton volumes are on the highways that emanate from the TCMA. In particular, I-94 to St. Cloud; I-94 to the Minnesota-Wisconsin state line; I-35 to Owatonna; and the western arc of I-494, each carry between 40 million and 80 million tons of truck annually. Other highways carry between 20 million tons and 40 million tons annually, including: I-94 from St. Cloud to Moorhead; I-35 between Owatonna and the Iowa state line; U.S. 169 from the TCMA to St. Peter; portions of Interstate highways in the TCMA; and nearly all of I-90 in Minnesota. These corridors can be considered the current high-tonnage truck corridors in the state.
By 2020 the truck traffic on all of these routes is expected to increase proportionally. While no new major highways are planned, capacity increases on existing highways are included in the Minnesota Statewide Transportation Plan.
For freight value, the results are very similar to the freight tonnage findings both inside the TCMA beltway and on IRCs. As shown in Figure 3.8, the high-value corridors emanate from the TCMA I-494/694 beltway: I-94 to St. Cloud; I-94 to the Wisconsin border; I-35W/I-35 to the Iowa border; and US 169 to Shakopee. I-90 from South Dakota to Wisconsin is also a high-value corridor. By 2020, the value on all of these congested routes is expected to increase.

Minnesota Statewide Freight Plan May 2005
3-14 Freight Flows
Figure 3.7 High-Tonnage Truck Corridors, 2001

Minnesota Statewide Freight Plan May 2005
Freight Flows 3-15
Figure 3.8 High-Value Truck Corridors, 2001

Minnesota Statewide Freight Plan May 2005
3-16 Freight Flows
3.6.2 Rail
Minnesota’s high-tonnage rail lines include the Burlington Northern Santa Fe lines serving the Port of Duluth-Superior and the line between the southwest corner of the state and the Wayzata branch. Each carries more than 20 million tons per year. The Burlington Northern Santa Fe main line running through the entire state between La Crosse, Wisconsin, and Fargo, North Dakota carries the most shipments in terms of value, worth more than $15 billion annually.
3.6.3 Water
There are significant freight flows from each of the ports along Lake Superior. Freight to and from Minnesota that is transported on the Great Lakes totals more than 36 million tons annually. The combined flows from these ports are greater than the freight flow along the Mississippi River. The tonnage on the Mississippi River totals over 10 million tons per year.

Minnesota Statewide Freight Plan May 2005
System Analysis 4-1
4.0 System Analysis
This chapter identifies key deficiencies in the freight transportation system in Minnesota, including capacity, infrastructure condition, levels of service and utilization, access to markets, intermodal needs, cost of service, security, operations and regulations.
A freight flow constraints analysis reviewed system-level impediments to the flow of freight. For highways, the analysis was developed primarily from the following sources: review of existing highway plans, studies, and programs; existing highway data; and discussions with Mn/DOT staff and other highway and truck experts.
Because railroads, water carriers and air carriers are privately owned, less information on their operations is publicly available. Thus, the constraint analysis for rail, water and air cargo is largely qualitative and was primarily derived from a series of telephone interviews with carriers, shippers, governmental agencies and facility operators. Because of the limited quantifiable data on the physical impediments for the non-highway modes, experts in these areas were also asked to identify issues that impact freight flow.
4.1 Highways
The constraint analysis for highways focused on four specific types of impediments to truck-based freight flows:
1. Geometric impediments – The geometric impediments analysis identified low-clearance and other restricted bridges that impact heavy commercial vehicles. A total of 22 bridges on the TH system have a height restriction of less than 14.5 feet, which is the minimum clearance necessary to accommodate large semi-trailer vehicles. One is located on a high priority IRC, and three are located on medium priority IRCs. Three of the bridges are located on other major highways in the TCMA.
Other bridge restrictions are weight-related, and include a variety of requirements (e.g., vehicles must travel in the center of the bridge, vehicles must reduce their speeds to a maximum of five miles per hour). A total of nine bridges on the TH system have a weight restriction, of which two are located on medium priority IRCs.

Minnesota Statewide Freight Plan May 2005
4-2 System Analysis
Figure 4.1 identifies highway-rail grade crossings on IRCs. There are six crossings at high priority IRCs and twenty-one crossings at medium priority IRCs. All highway-rail grade crossings at IRCs create potential safety hazards, and result in truck freight traffic delays when a train is present. These safety hazards and delays can be eliminated by reconstructing the highway-rail grade crossings to grade-separated crossings or through the consolidation/closing of crossings along a corridor or by improving advance-warning devices.
2. Infrastructure condition impediments – These refer to roadways with weight limits less than 10 tons per axle and/or 80,000 pounds of total weight. All medium and high priority IRCs and metro area highways are designed and designated as 10-ton roads. In addition, most of the remaining THs in the TCMA and statewide are designed to accommodate 10-ton loads. Several THs (mostly outstate) cannot accommodate 10-ton loads.
3. Operational impediments – These are defined as routes where operating speeds are at or below adopted speed performance targets: 60 miles per hour for high priority IRCs, 55 mph for medium priority IRCs and 50 mph for high priority regional corridors. They also refer to metro area urban freeways that experience peak-period speeds below 45 mph.
Figures 4.2 and 4.3 show below-performance corridors on IRCs, high priority regional corridors and TCMA freeways for 2002 and a forecast for 2030. For the most part, congested corridors are located in and radiating from the Metro District. The only exceptions are TH 210, TH 23 and U.S. 14. Mn/DOT is assessing a policy of providing new lanes on the I-494/I-694 beltway in the TCMA and is constructing a new lane in each direction on some sections today. Mn/DOT is also actively considering toll lanes through its MnPASS Program as a means to provide additional capacity.
4. Connectivity impediments – These refer to gaps in the roadway or truck network. The IRC system and other roadway systems discussed in Chapter 2 cover the entire state from a geographic perspective.
In 2003, Mn/DOT undertook a study to identify and evaluate the roadways that connect freight generating facilities to the IRC system. The Adequacy of Freight Connectors to Interregional Corridors and Major Roadways study concluded that, based on a survey of freight facility owner/operators in Greater Minnesota, only six of the 134 freight generators had connections to the IRCs or other THs considered inadequate. Therefore, access and connectivity from major freight generators to the major roadways do not appear to be a major issue at this time. Most of the concerns associated with system connectivity come from agricultural producers that have difficulty moving products from the farm to local processing plants. (This issue will be addressed in a follow-up study evaluating the 10-ton local roadway network.)

Minnesota Statewide Freight Plan May 2005
System Analysis 4-3
Figure 4.1 IRCs and Rail Conflicts, 2004

Minnesota Statewide Freight Plan May 2005
4-4 System Analysis
Figure 4.2 Below Performance Corridors by Speed, 2004

Minnesota Statewide Freight Plan May 2005
System Analysis 4-5
Figure 4.3 Below Performance Corridors by Speed, 2030

Minnesota Statewide Freight Plan May 2005
4-6 System Analysis
4.2 Railroads
Minnesota has a comprehensive rail network of more than 4,500 miles offering service to nearly every county in the state. This rail network was developed to support the metallic ore and grain businesses, along with non-metallic minerals, food products, paper and other key Minnesota industries.
The overall consent from discussions with selected stakeholders is that the Minnesota rail system currently suffers no capacity problems and generally provides adequate service. However, there are several issues and some specific physical problems. The top three concerns identified by the interviewees were:
1. Class I shift to 100+ car shuttle trains and focus on long-haul grain business. Just as the railroads are using heavier railcars to reduce costs, the Class I railroads are making greater use of shuttle trains to improve equipment usage and reduce costs. Shuttle trains (i.e., unit trains) are dedicated to one commodity that can be efficiently loaded and unloaded, and the equipment can quickly be cycled for the next load.
In the past, grain moved in blocks of 26 railcars, then 54 and then 75. The shuttle trains move grain in 100+ car trains. While this improves efficiency, it puts additional pressure on the rail network to accommodate loading and unloading of these long trains and to provide longer sidings for trains to wait while others pass.
The shuttle trains provide an efficient service for the Class I railroads and for large grain farmers located near the shuttle loaders, but it has created problems for some of the regional and short-line railroads and other shippers. Farmers wishing to take advantage of the lower shuttle train rates are forced to truck their grain 75 to 100 miles to the nearest shuttle loader.
From the viewpoint of some of the regional and short-line railroads, the Class I railroads seem to be phasing out smaller shipments in favor of shuttle trains and longer lengths of haul. A common concern is that the Class I railroads will offer discounted shuttle rates to shippers, but will not offer the same lower rates to short lines so they can solicit 100+ cars from multiple shippers. Another concern is that the shuttle trains receive priority during car shortages, exacerbating the problem for shippers without shuttle-loader access. Finally, the shuttle trains focus on the more profitable long-haul service to the Pacific Northwest and the Gulf of Mexico, which has led to reduced rail service at water ports and increased truck activity.
Minnesota Statewide Freight Plan May 2005
System Analysis 4-7
2. Residential encroachment impeding expansion of rail facilities. A common problem for railroads nationwide is the encroachment of communities adjacent to rail right-of-way. Some communities are willing to work with the railroads to resolve the problems, but other communities block any expansion and force expensive court battles.
3. Rail congestion in Chicago. A serious impediment to rail freight movement to and from Minnesota lies approximately 400 miles to the southeast. Chicago is regarded as the primary hub for freight rail traffic in the United States. Served by all of the major railroads, and many smaller ones, it is the primary interchange location between the eastern and western railroads. Minnesota has direct rail service to the Pacific Northwest and parts of Canada, but most other shipments must go through Chicago. This includes shipments to the east coast, southern California and even Texas and the Gulf States.
Despite its status as the United States’ rail hub, connections between railroads around Chicago are poor and often made via cross-town truck drayage. In addition, there are numerous highway-rail grade crossings and aging infrastructure. To help combat these problems, the state, city, and railroads have initiated the $1.5 billion Chicago Regional Environmental and Transportation Efficiency project (CREATE), which remains largely unfunded.
4.3 Ports and Waterways
Minnesota takes advantage of river and lake access for transporting taconite, grains and other bulk commodities. This network provides low-cost transportation to cities along the Great Lakes, the Mississippi River system and access via the St. Lawrence Seaway and the Gulf of Mexico to foreign ports of call.
Impediments in the port and waterway system can take three forms: landside access, port capacity and waterside access. Access issues for both land and water were identified as impediments, while port capacity was not.
The top three impediments to the flow of freight on the port and waterway system are:
1. Antiquated locks (both river and lake). There are 29 locks on the upper Mississippi River between Minneapolis and St. Louis. The upper three locks are 400 feet long and 56 feet wide. Of the remaining 26 locks, 23 are 600 feet long and 110 feet wide. The three remaining locks, all of which are located outside of Minnesota, are of modern size at 1,200 feet long and 110 feet wide. An in-depth study was completed by the U.S. Army Corps of Engineers to modernize and lengthen between seven and 12 of the 600-foot locks to a length of 1,200 feet. This would likely reduce transit time on the system significantly. A recommendation from the above study went to Congress this year (2005).

Minnesota Statewide Freight Plan May 2005
4-8 System Analysis
Some locks on the Great Lakes also are too small to accommodate modern ships. Two of the most serious problems are at the St. Lawrence Seaway locks and the Welland Canal locks connecting Lake Erie and Lake Ontario. The St. Lawrence Seaway locks are 766 long by 80 feet wide. The Welland Canal locks are 859 feet long by 80 feet wide and can accommodate ships hauling approximately 27,000 tons. By one estimate, 75 percent of international ships are too large to navigate these locks. This impedes international trade, and the inability of container ships to enter the Great Lakes is a primary reason why Minnesota ports cannot compete for intermodal traffic.
2. Landside access (truck and rail issues). Landside access is a concern at the Port of Savage. In the mid-1990s, the Chicago and Northwestern Railroad hauled 75 percent of the grain into the Port of Savage, while trucks hauled 25 percent. Today, trucks haul 85 to 90 percent of the grain. Reduced rail service has strained the roadway system, TH 13 in particular. Similar issues are beginning to emerge at the Port of Winona due to a shift in train/truck shipments.
3. Competing river uses. Recreational uses, environmental concerns, and municipal rede-velopment all compete for use of the river and lake system. Waterside properties are very desirable for both commercial and residential development, which tends to drive up the cost of the land and make it less attractive for large freight operations. Growing recreational uses of the river and lakes reduce the capacity of these systems and create safety concerns. New development and growing recreational activities increase roadway use near the water, leading to more congestion for trucks serving the ports.
4.4 Air Cargo
Domestic air cargo services at Minnesota airports are adequate for shipper needs. Both Federal Express and United Postal Service have facilities at MSP and also serve other airports throughout the state. MSP is the primary air cargo airport, enplaning and deplaning 90 percent of Minnesota’s air cargo. Duluth and Rochester combined account for 7 percent, leaving 3 percent for the remaining 21 cargo airports in Minnesota.
MSP handled nearly all of the international air cargo arriving in the bellies of passenger planes. The overall consensus from discussions with key stakeholders is that domestic air cargo service is

Minnesota Statewide Freight Plan May 2005
System Analysis 4-9
acceptable, but dedicated freighters providing international air cargo service are needed. The lack of international service is viewed as the major drawback to Minnesota’s air cargo system and has been cited as an obstacle to attract and retain high-tech companies in the state. Presently, international air cargo is primarily trucked to Chicago and then forwarded to international destinations. The extra time required to get air cargo to Chicago means that it takes approximately 72 hours to get products from the point of origin to their final destination.
A key strategy being considered to attract direct international freighter service to MSP is the development of a regional freight distribution center. The distribution center would create a central facility within 60 miles of MSP to expedite the shipment of international cargo. The facility would be designed to:
• Consolidate forwarders into a single location, promoting better communication and coordination of shipment;
• Consolidate truck loads, reducing the number of trucks entering and exiting MSP; and
• House air cargo security clearances away from the airport.
Studies are currently underway to identify the feasibility of developing an international RDSC in the state. A public-private partnership is pursuing this initiative including design and location analysis as well as necessary financial incentives.
4.5 Intermodal Terminals
As discussed in Chapter 2.0, the number of intermodal terminals in Minnesota is limited. Impediments to freight movement in and around these terminals have already been identified in the previous sections (i.e., landside access at the Ports of Savage, lack of international air cargo service, infringement of residential development near rail terminals, etc.). To help improve access to intermodal terminals and reduce demands on roadways to these facilities, the FHWA program provides a special status as “intermodal connectors” for the primary access roads between large intermodal terminals and the NHS. Roadways designated as intermodal connectors are eligible for certain highway improvement funding programs. The FHWA has provided guidance for establishing these intermodal connectors based on the volume of trucks serving the intermodal terminal.
Presently only two roadways in Minnesota are designated as intermodal connectors: TH 5 between MSP and I-494; and Garfield Avenue to
Minnesota Statewide Freight Plan May 2005
4-10 System Analysis
Railroad Street between I-35 and the Port of Duluth. The following terminals meet the FHWA program eligibility requirements for NHS funding to improve access:
• Port of St. Paul;
• Ports of Savage;
• The Burlington Northern Santa Fe St. Paul Midway TOFC/COFC Terminal; and
• The Canadian Pacific Minneapolis Shoreham TOFC/COFC Terminal.

Minnesota Statewide Freight Plan May 2005
Mn/DOT Freight Programs and Planning 5-1
5.0 Mn/DOT Freight Programs and Planning
This chapter highlights Mn/DOT’s various freight programs for non-roadway investments and regulatory enforcement. In addition, this chapter reviews the ways in which funding and projects for freight investments can be integrated into other transportation planning and investment activities, including public-private partnerships.
5.1 Freight Programs
The following sections review core activities, program funding history, current funding status, project eligibility criteria, other funding sources, and program effectiveness for Mn/DOT’s freight programs.
5.1.1 Commercial Vehicle Operations
Commercial Vehicle Operations oversees truck regulatory and administrative programs. There are four primary focus areas within CVO: safety, conformity, efficiency, and mobility. The core activities that reside under these focus areas include, but are not limited to, the following:
• Conduct vehicle safety inspections; issue permits for vehicles that are oversize or over-weight;
• Provide truck size and weight policy and coordinate maintenance of all weigh scales facilities;
• Provide technical assistance at hazardous materials transportation incidents; review and audit carrier operating records;
• Conduct training classes; and
• Provide outreach on technical topics related to driver qualifications, vehicle safety, carrier operating requirements and transportation regulations for hazardous materials.

Minnesota Statewide Freight Plan May 2005
5-2 Mn/DOT Freight Programs and Planning
In general, the CVO area is directed toward improving transportation safety operations of motor vehicles and compliance with laws, rules, and statutes related to those operations, rather than to specific freight system enhancement.
Funding for CVO comes from the state and the federal government. Federal funding is directed at the Federal Motor Carrier Safety Assistance Program, the Commercial Vehicle Information Systems and Networks program and other intelligent transportation system activities.
5.1.2 Rail Safety – Grade Crossing Safety Improvement Program
The purpose of the Minnesota Railroad Grade Crossing Safety Improvement Program is to promote and enhance safety at highway-rail grade crossings in the state. Typical projects include installation of signals, signal upgrades, signage, pavement markings, lighting, crossing surface improvements, crossing closures and roadway relocations, improved sight conditions, improved crossing alignments, and grade separations.
Since the passage of the ISTEA in 1991, 10 percent of Minnesota’s federal Surface Transportation Program funds are set aside for safety activities. Of this amount, approximately $4 million annually has been provided for highway-rail grade crossing safety improvements. Opportunities may also exist to partner with some of the private rail companies as they upgrade their tracks or make other improvements. Additional funding also is available through the federal government for crossings on high-speed rail corridors.
Mn/DOT develops an annual list of proposed grade crossing safety improvement projects and forwards it to the appropriate ATP for prioritization with other transportation related projects. The appropriate road authorities are notified and asked to commit matching funds to leverage the federal transportation funds being sought for inclusion in the State Transportation Improvement Program.
While there is no specific criterion for identifying projects that are selected for funding under this program, consideration is given to the number of crashes and fatalities, sight distance, train speeds, the number of trains and the amount of vehicular traffic crossing the tracks.
The effectiveness of the grade crossing safety program is evidenced by the fact that, over the past 10 years, the number of crashes has continued to decline. Annual crash and fatality rates at highway-rail grade crossings has been a generally decreasing trend. In 1970, 392 crashes and 36 fatalities occurred. By 1990, 115 crashes and 14 fatalities occurred. This trend has continued into 2004, when only 67 crashes and 11 fatalities occurred.

Minnesota Statewide Freight Plan May 2005
Mn/DOT Freight Programs and Planning 5-3
5.1.3 Rail Rehabilitation – Minnesota Rail Service Improvement Program
The Minnesota Rail Service Improvement Program was established in 1976 to prevent the loss of rail service on lines subject to abandonment. The five subprograms that fall under the broader MRSI program are presented below.
Rail Line Rehabilitation Program
This program provides low- or no-interest loans to rehabilitate and preserve rail lines. Upon completion of the rail rehabilitation project, the railroad repays the state on a negotiated per-car basis or at a predetermined fixed rate.
Rail Purchase Assistance Program
This program helps regional rail authorities purchase rail lines if a financial analysis shows that the line can operate at a profit, that purchase cost and necessary rehabilitation will not exceed benefits and that the regional railroad authority is capable of operating the rail line or can contract with an operator to do so.
Rail User and Rail Carrier Loan Guarantee Program
This program helps shippers and carriers to obtain loans for rail rehabilitation and capital improvements. The program guarantees up to 90 percent of the loan.
Capital Improvement Loans
This program lends rail users up to $200,000 or up to 100 percent of the project, whichever is less, to improve rail facilities. Capital improvement loans are available to improve rail service through construction or improvements to rail line segments (i.e., side track and team track connections); and to construct or improve facilities used to load, unload, store and transfer freight and commodities. Loans are repaid on a quarterly basis or a lump sum within 10 years.
Rail Bank Program
This program is used to acquire and preserve abandoned rail lines for future state, public and commercial transportation; and for transmission needs (transit, trails, pipelines, etc.).
Since 1976, the MRSI program has received $9.6 million in state general funds and $25.5 million in general obligation bonds. There is no ongoing or regularly allocated federal funding. However, over $21.7 million in federal funding has been targeted to specific projects,

Minnesota Statewide Freight Plan May 2005
5-4 Mn/DOT Freight Programs and Planning
some of which have been used to improve rail corridors. Funding at the state level depends on legislative appropriations. Historically, funding has been irregular and subject to general fund availability and bonding allocations.
Mn/DOT uses the capital improvement portion of the MRSI program on a regular basis. Other program areas (rail line rehabilitation, rail purchase assistance, rail bank and rail user and rail carrier loan guarantee) are used on an as-needed basis. It is difficult to evaluate the effectiveness of program areas that Mn/DOT does fund regularly (capital improvement loans and rail bank). Tracking projects following completion of capital improvement loans is limited to verifying repayment of the loan based on the quarterly repayment.
5.1.4 Port Development
The Port Development Assistance Program is designed to assist public port authorities that have commercial navigation facilities with access to the Great Lakes or Mississippi River systems in Minnesota. The program provides funds to modernize physical infrastructure. The program will grant up to 80 percent of funds for specific projects, and the port authority is responsible for the balance. Most of the funding is allocated to facility repair. Projects have included improvements to piers, rehabilitation of a termi-nal drive, installation of sprinkler systems, dredging, installation of bollards along dock walls and other building improvements. Currently, the program only funds projects for public ports. There is some interest in a state constitutional amendment that would expand the program to private port facilities.
The Port Development Assistance Program has been funded since 1996. Over this nine-year period, $12.5 million have been allocated. Allocations of funding vary from year to year because funding depends on legislative allocations. Federal funding and programs for ports and waterways are primarily directed at security assistance, lock infrastructure and navigation and dredging. The Transportation Security Administration provides federal grants to address security issues at ports. The discretionary programs supported $104 million nationally in fiscal year 2003. To date, Minnesota has received $813,100 for surveillance, protective fencing and lighting improvements at the Port of Duluth and several St. Paul area terminals.
In addition to the funding mentioned above, the Transportation Infrastructure Finance and Innovation Act could be used to provide loans and loan guarantees for up to one-third of project costs at attractive rates and terms. The program is used to fund large, innovative intermodal transportation projects. It may be a useful tool for port projects and road/rail improvements to serve ports or intermodal port terminals.

Minnesota Statewide Freight Plan May 2005
Mn/DOT Freight Programs and Planning 5-5
Mn/DOT does not have specific criteria for project selection for the Port Development Assistance Program. However, it does require the port authority to fill out an application that describes the need for the project and identifies potential economic impacts (new jobs, job retention). In addition, Mn/DOT works with the ports to prioritize the list of all submitted projects. Together, they identify the highest-priority projects and develop a funding proposal to submit to the legislature. Because there is neither benefit/cost analyses, nor follow-up to studies once projects are selected, it is difficult to ascertain the program’s effectiveness.
5.1.5 Air Cargo
Mn/DOT’s Office of Aeronautics administers three state programs used to develop airport facili-ties within Minnesota and acts as the intermediary for a federal program for airport improvements. The state programs are available to 143 publicly owned airports in the state airport system and are not exclusive to freight. In order to be eligible for the state grant programs, an airport must be:
• Owned by a municipality;
• Licensed for public use;
• In the state airport system; and
• Zoned or in the process of being zoned.
The state’s primary air cargo facility, the MSP, is under the jurisdiction of the Metropolitan Airports Commission.
Minnesota Construction Grant Program
This program funds most capital improvements at state system airports based on a deter-mination that the improvement is a justifiable benefit. Grants are issued for planning land acquisition and improvements such as constructing or extending runways, taxiways, aprons, hangar areas, vehicle parking areas, entrance roads, terminal buildings, arrival/departure buildings, maintenance buildings, utilities, drainage facilities, aviation fuel facilities and airfield lighting systems. This program also funds airport maintenance, equipment, pavement maintenance and rehabilitation projects.
Minnesota Airport Maintenance and Operation Program
This program provides two-thirds state reimbursement to the state system airports for their documented, routine maintenance expenses. The day-to-day labor, material, equipment and utility expense of maintaining airport pavements, airport grounds, lighting systems, buildings and maintenance equipment are eligible costs.
Minnesota Statewide Freight Plan May 2005
5-6 Mn/DOT Freight Programs and Planning
Minnesota Hangar Loan Revolving Account Program
This program provides an 80 percent interest-free loan to state system airports for building new hangars.
Minnesota Statutes, Chapter 360, established the State Airports Fund. The revenues in the fund are derived from aviation user taxes. The user taxes and investment income have historically provided enough funding for the above three programs. The federal Airport Improvement Program provides grant-in-aid for planning, land acquisition and capital improvement projects at airports in the National Plan of Integrated Airport Systems. AIP funding is administered on a priority system that directs funding to capacity-enhancement projects first. Most air-side improvements are eligible.
In addition to the AIP, TIFIA can be used to help fund large, innovative and intermodal transportation projects. Under TIFIA, an approved project may receive loans and loan guarantees for up to one-third of project cost at attractive rates and terms. TIFIA funds have been used for airport-related projects such as Miami Airport’s intermodal center.
5.1.6 Freight Planning and Research
The Mn/DOT Office of Freight and Commercial Vehicle Operations is responsible for supporting the freight-related elements of the Minnesota Statewide Transportation Plan. Its mission is to support other Mn/DOT offices and state and local agencies with respect to freight and commercial vehicle operations. OFCVO helps to identify and provide a better under-standing of complex freight issues, so that they can be considered in investment, planning, policy and regulatory decisions. Core activities include planning and scoping studies, development of freight-enhancing systems and projects, freight performance measure and information system development and reporting, information exchange and outreach and research of innovative concepts and technologies.
In addition to the above activities, OFCVO’s Freight Planning and Development area manages the following activities: support of Mn/DOT districts in freight planning; support of the districts and Minnesota State Patrol in weight enforcement planning and fixed-scale maintenance; support of heavy truck safety initiatives; participation in truck size and weight policy development; and facilitation of the Minnesota Freight Advisory Committee activities.
Major freight planning and research studies are funded through Mn/DOT’s consultant budget, the FHWA’s State Planning and Research Program (which includes pooled fund studies with other states) through Mn/DOT’s research program with the University of Minnesota and other universities and through Mn/DOT’s Guidestar ITS program.

Minnesota Statewide Freight Plan May 2005
Mn/DOT Freight Programs and Planning 5-7
5.2 Integration of Freight Programs with Other Transportation Planning and Investment Activities
The economic importance of freight compels Minnesota to find ways to more explicitly incorporate freight issues and needs into the development, prioritization and implementation of transportation projects, and to modify non-highway, freight-related programs to increase the effectiveness of non-highway freight modes.
The following actions, if taken, would more fully integrate freight issues and factors into highway planning, programming and implementation processes:
1. Mn/DOT is only one of many public agencies that aim to promote the state’s economic development by improving freight infrastructure and services. Coordination with other agencies, such as the U.S. Department of Agriculture and the Minnesota Department of Employment and Economic Development, would reveal areas where investment programs intersect, yielding complementary funding for specific improvements. Forming public-public partnerships would help these agencies to better meet freight-enhancing objectives.
2. The private sector continues to make substantial investments in freight infrastructure facilities and services in the state. Opportunities for public-private partnerships between Mn/DOT and the private-sector freight industry should be found as a way to leverage funds for project-specific improvements. A forum for these discussions is available through MFAC.
3. The federal funding application process, as administered by the Metropolitan Council of the Twin Cities Area, should assign additional points for roadways that have major freight generators, are extensions of the IRC system or serve as freight connectors to IRCs or TCMA freeways. In Greater Minnesota, the ATP process should include similar criteria for ranking projects identified by the partners. Finally, district plans should prioritize improvements by incorporating a measure of freight flows such as high tonnage and value.
4. To ensure that freight factors are considered in a more consistent and timely manner, a process should be established that allows OFCVO the opportunity to provide input on major investment studies, on system plans where freight is a major element and on corridor studies where heavy commercial vehicles exceed certain thresholds (for example, more than four percent of daily traffic or more than 1,500 trucks per day). This would ensure that freight issues are more adequately and systematically addressed. Freight connectors, as defined by the federal government, should be targeted for federal funding as these opportunities arise.
5. Mn/DOT should examine whether a freight interest is represented on major guidance and decision-making committees. When needed, OFCVO should provide assistance to

Minnesota Statewide Freight Plan May 2005
5-8 Mn/DOT Freight Programs and Planning
organizations, for example, ATPs and Mn/DOT committees (e.g. funding distribution formula evaluation, IRC updating).
6. In order to more realistically account for the impact of trucks on levels of congestion on IRCs and major TCMA highways, the forecasting and analysis process should broaden the use of passenger car equivalents. Because of length and acceleration/deceleration characteristics, each semi-trailer is equivalent to three or more passenger cars. By incorporating PCEs in the calculation of volume-to-capacity ratios, levels of service and speed, roadways with heavier truck volumes will show more realistic v/c ratios. Relating high-truck volume routes with higher v/c ratios by using PCEs could help these truck routes receive higher priority in the project selection process. In order to calculate PCEs, the collection of truck count data should be broadened and improved.
7. When safety analyses are undertaken, efforts should be made to identify crash locations involving heavy commercial vehicles. Mn/DOT will look for opportunities to implement the heavy vehicle strategies at locations where heavy vehicle crashes are over represented.
8. When updating the IRC system (every three to five years), Mn/DOT should consider whether the roadway is a high-tonnage or high-value truck facility (current or future). Currently, the process only includes daily volumes of heavy commercial vehicles.
5.3 Partnerships with the Private Sector
As Minnesota’s population and economy continue to grow, demand on the transportation infra-structure will increase. At the same time, infrastructure improvement needs for all modes will continue to outpace available funding. Partnerships with the private sector may be one way to help bride the gap between needs and funding.
Many of the non-highway modal programs currently undertaken by Mn/DOT involve, in part, the private sector. For example, rail programs involve regional railroad authorities or individual rail lines. Rail lines are run by the private sector, which has little or no state oversight. In addition, loan programs already involve carriers and shippers in order to generate support for state investments in private sector facilities.
Eligibility for the Port Development Assistance Program, which currently is limited to public water port facilities, should be extended to include private water port facilities.
The airport development and maintenance programs already indirectly involve the private sector. Grants and loans go to the municipality for improvements to runways, taxiways, aprons, lighting and instrumentation. These improvements may be needed to keep or bring commercial air service to larger state airports.

Minnesota Statewide Freight Plan May 2005
Mn/DOT Freight Programs and Planning 5-9
The efforts of the non-highway freight programs demonstrate a model for cooperation between the public and private sectors when it comes to investments in transportation for freight-related purposes. The different units within OFCVO should continue to explore ways to partner with the private sector as a way to leverage available funds.


Minnesota Statewide Freight Plan May 2005
Freight Trends 6-1
6.0 Freight Trends
National, state and local economic trends have resulted in major changes in freight trans-portation in Minnesota. Many of these trends can be expected to continue into the future and will have a major impact on the state. This chapter identifies the economic trends and forecasts that will affect freight, including the national forecasts of freight, forecasts of Minnesota’s employment and output by industries and changes in population. It also examines logistics trends by industry and mode and trends in public policy.
6.1 Economic Trends
6.1.1 Population and Employment Trends
The 2020 population in Minnesota is forecast to follow existing patterns of growth in the metro region, Duluth, Rochester and Saint Cloud. As shown in Figure 6.1, population increases elsewhere in Minnesota are forecast to be along the interstate highway system, which reinforces the employment, industry and freight tonnage projections.
Historical employment trends provided by DEED confirm that Minnesota is moving toward a service-oriented economy1. Service industries typically consume rather than produce freight. Minnesota is projected to experience the greatest increases in employment in the service industries. Projections by the Minnesota State Demographic Center show the highest growth in the labor force in those counties shown in Figure 6.1 to also have high population growth—a band stretching generally from Cass County southeast through the TCMA to Olmsted County (Rochester)2. Manufacturing employment in 2010 is projected to be primarily located in the TCMA and southern Minnesota. Wholesale/warehousing employment is projected to be primarily in the TCMA and central regions.
1 DEED. Labor Market Information. “Employment Outlook Tool.” http://www.deed.state.mn.us/lmi/tools
/projections.htm. 2 Minnesota State Demographic Center. “Minnesota Labor Force Projections: 2000-2030.”
http://www.demography.state.mn.us/Laborforceproj/LaborForceProjections.pdf

Minnesota Statewide Freight Plan May 2005
6-2 Freight Trends
Figure 6.1 Percent Population Increase by County, 2000-2020

Minnesota Statewide Freight Plan May 2005
Freight Trends 6-3
6.1.2 Industry Trends
Minnesota’s gross state product has increased by 69 percent in real dollars from 1986 to 2001. During the same period, the U.S. gross domestic product has increased by 60 percent in real dollars. Minnesota shifted from primarily a manufacturing economy toward more of a service economy during this period. The percentage of the U.S. economy in the service sectors in 1986 is similar to the levels that were not reached in Minnesota until 2001. Growth in manufacturing in Minnesota has not kept pace with growth of the overall economy. While the value of durable manufactured goods doubled between 1986 and 2001, the value of non-durable goods declined slightly, as shown in Figure 6.2. The U.S., like Minnesota, had a percentage growth for all manufacturing industries less than that of the overall economy, and this has consisted of a larger increase in the value of durable manufacturing and virtually no increase in the value of non-durable manufacturing. This is significant for freight because durable goods, as non-perishable items, are more likely to be exported and are shipped longer distances, including a higher fraction of international shipments.
Among the manufacturing industries in Minnesota, the high-technology electronic equipment and industrial equipment sectors have grown most rapidly as shown in Figure 6.3. For the U.S.,
Figure 6.2 Gross State Product for Minnesota, All Industries, 1986 to 2001
0 5 10 15 20 25 30 35 40
Services
F.I.R.E.
Manufacturing
Durable Goods
Retail Trade
Government
Wholesale Trade
Transportation and Utilities
Nondurable Goods
Construction
Agriculture, Forestry, Fish
Mining 1986
2001
1996 Dollars (in Millions)

Minnesota Statewide Freight Plan May 2005
6-4 Freight Trends
these same high-technology electronic equipment and industrial equipment sectors show the most growth among the manufacturing industries. These sectors tend to ship high-value, low-weight goods using premium transportation services. In addition, these sectors tend to transport smaller-sized shipments that require more vehicles per ton than other sectors. There has also been significant growth in many durable manufacturing sectors such as rubber and plastics and transportation equipment both in Minnesota and the U.S.
6.1.3 Export and Import Trends
The FHWA has prepared a national forecast of freight flows as part of its FAF. Inbound shipments to Minnesota by weight are forecast to grow at a rate of 92 percent between 1998 and 2020, much higher than the growth of outbound tonnage of 52 percent over the same period. This reflects a change in Minnesota to a service-oriented, consumption economy, an
Figure 6.3 Gross State Product for Minnesota Manufacturing Industries, 1986 to 2001
0 1 2 3 4 5 6 7
Industrial machinery
Electronic equipment
Food & kindred products
Fabricated metals
Paper products
Printing & publishing
Instruments and related
Motor vehicles
Lumber & w ood
Rubber & plastics
Chemicals
Stone, clay, glass
Primary metals
Misc. manufacturing
Other transport. equip.
Furniture and f ixtures
Petroleum products
Apparel & textile
Leather products
Textile mill products
Tobacco products 1986
2001
1996 Dollars (in Millions)

Minnesota Statewide Freight Plan May 2005
Freight Trends 6-5
increase in the manufacture of high-value, low-weight goods and to a decline in resource industries and shipments. For the most part, inbound and outbound shipping patterns will follow similar trends as discussed below.
The FAF forecasts indicate that states in the Midwest will remain Minnesota’s largest trading partners in the future. However, even freight shipments to and from the Midwest are forecast to grow more slowly than the average national growth rate. This is the case even after excluding shipments of ore, which, while currently dominant in terms of tonnage, will decline in absolute terms. Due to the importance of trade with these states, preservation and enhancement of primary rail and highway corridors such as I-94 is important.
International shipments to and from Canada and Mexico are forecast to have among the highest growth rates. However, in terms of absolute tonnage, the numbers remain low compared to other trading partners. The ability to accommodate shipments under the North American Free Trade Agreement, particularly through Minnesota’s international border with Canada, will be important to Minnesota’s growth.
Shipments to and from the West/Southwest, presumably including the domestic land shipment of freight through the ports of Los Angeles/Long Beach and Seattle, are forecast to grow faster than average. While intermodal container rail service is available directly to the Pacific Northwest, container service to Southern California must first pass through Chicago. The availability of direct intermodal container rail service to Southern California as a competitive option to trucking may be important to accommodate the expected growth.
Shipments to and from the South are forecast to grow faster than the national average. Minnesota currently relies on the barge system of the Mississippi River to accommodate a substantial portion of bulk grain shipments to the South. Preservation and improvement of this system will be important to Minnesota. The FAF forecasts that the South will remain Minnesota’s largest inbound trading partner in the future. Freight shipments from the South will grow at a slightly higher rate than the average for all regions. While the Mississippi River system is important to Minnesota’s outbound shipments to the South, the inbound shipments rely mostly on trucking and rail modes. Shipments by both highway and rail from the South typically are transshipped and/or must pass through the congested Chicago area, making conditions in Chicago important to Minnesota’s economy.
The FAF forecasts that the outbound commodities with the highest tonnage increases and above average growth rates are food processing (125 percent), non-electrical machinery (377 percent), chemicals (98 percent), lumber (131 percent), secondary/warehousing (175 percent) and electrical machinery (277 percent). These commodities exported from Minnesota to the rest of the U.S., and their associated industries, will be able to achieve this growth only if the transportation system can allow them to easily reach their markets. It is notable that the highest growth rates are in high-value goods that traditionally rely on premium transportation modes such as air cargo, trucking and intermodal rail containers.

Minnesota Statewide Freight Plan May 2005
6-6 Freight Trends
The FAF forecasts that the inbound commodities with the highest tonnage increases and above average growth rate of 92 percent are clay, concrete, glass and stone (142 percent), food processing (104 percent), secondary/warehousing (221 percent), non-electrical machinery (323 percent) and electrical machinery (245 percent). These imported commodities are needed to serve Minnesota’s growing population and service industries. The projected growth can only be accommodated if the transportation system can allow the goods to easily reach their markets in Minnesota and the surrounding region. The highest inbound growth rates are in high-value goods that traditionally rely on premium transportation modes such as air cargo, trucking and intermodal rail containers. High growth rates are also forecast for inbound warehousing (secondary distribution) shipments to Minnesota from other states, a function that conceivably could be served by distribution centers located in Minnesota if they were developed.
6.2 Transportation/Logistics
The logistics industry during the final decades of the 20th Century was dominated by economic deregulation. Deregulation resulted in lower transportation costs, which, in turn, reduced total logistics costs for both the U.S. and Minnesota. This has allowed just-in-time deliveries to be substituted for inventory costs, a strategy that requires more reliable transportation service. Deregulation and JIT delivery have resulted in smaller shipments of higher value products, which favors premium freight transportation services such as trucking and air cargo and is consistent with forecasts for Minnesota from the FAF.
The shift from a manufacturing to a service economy has increased the requirement by companies to be sensitive to rapidly changing consumer demands. Many of the “push” logistics systems where the movement of goods was a function of manufacturing activity are gradually being replaced by “pull” logistics systems in which goods are moved based on customer preferences. These trends are complemented by (and in many cases, are the driver of) the shift to JIT delivery systems. While highway congestion across Minnesota is a potential threat to the freight reliability essential to JIT, the TCMA has notable highway congestion on key freight routes.
Deregulation has considerably increased the entry of trucking firms into the marketplace, both in Minnesota and the U.S. This increase was tempered between 2002 and 2004 as higher fuel costs, higher insurance costs and truck driver shortages increased the operating costs of driving over the last five years.
Air cargo limitations are not physical, but principally the result of decisions of carriers to offer passenger service. For example, the decisions by air carriers to offer little international freight service from MSP significantly limits the amount of international air cargo imported and exported from the state.

Minnesota Statewide Freight Plan May 2005
Freight Trends 6-7
Water cargo markets are largely stagnant or declining nationally. Potential national increases in water cargo will be in containerized cargo, which contrasts significantly with the predominantly bulk cargo operations of Minnesota. Minnesota’s increase in agricultural exports could increase its barge tonnage, but coal imports are shifting to western low-sulfur coal shipped by rail. Physical limitations on the Great Lakes/St. Lawrence Seaway and the Mississippi River make the operation of containerized water cargo extremely difficult and limit the ability to offer this service at Minnesota’s ports.
Rail freight has already reaped most of the benefits from deregulation and restructuring. Further cost reductions are not expected in the U.S., although Minnesota’s railroads have shown increases in volume and operating ratios due to operational improvements. Rail has not been able to achieve returns on investment that will attract the capital that private railroads need to expand or improve their infrastructure in Minnesota or the U.S. Much of Minnesota’s rail freight service must move through Chicago, and rail congestion in Chicago is a threat to Minnesota’s rail service.
6.3 Policy Trends
This section discusses the roles that federal, state and local governments have played, and can be expected to play in the regulation of freight.
6.3.1 Federal Policies
As discussed in Section 6.2, transportation was economically deregulated during the last decades of the 20th Century. Future federal regulation of transportation is likely to address environmental, safety or security matters. During deregulation, freight projects were provided with access to traditional sources of highway funding, such as the federal NHS and the Surface Transportation Program categories. Future legislation may provide dedicated funding sources for freight projects, such as special loan programs.
Public data on freight flows is becoming more widely available, most notably through the FHWA’s FAF and the efforts of the Bureau of Transportation Statistics. Information that has been collected from private freight carriers is being consolidated and made more available electronically for use in transportation planning and investment decisions. The federal transportation legislation, most notably ISTEA and TEA-21, has encouraged freight stakeholders to be included in the transportation planning process. In Minnesota, this has been accomplished through the formation of MFAC.

Minnesota Statewide Freight Plan May 2005
6-8 Freight Trends
6.3.2 Minnesota State, Regional and Local Policies
Mn/DOT, through its “Strategic Plan,” has established policies to implement its strategic directions: Safeguard what exists; Make the transportation network operate better; and Make Mn/DOT work better. Minnesota has also promoted investments in and attention to freight-related issues. The activities initiated under these strategic directions include the development of and improvements on the IRC system, investments to expand “key” airports, investments to reduce congestion within the TCMA, development of this Minnesota Statewide Freight Plan, and development and implementation of performance measures and targets.
Regional policies with regard to freight flow within the TCMA are beginning to emerge. The Metropolitan Council has drafted some preliminary policies recognizing the importance of freight to the regional and state economy. The policies are aimed at improving freight flow. Other MPOs and ATPs are expected to take similar actions.
As noted in Chapter 4, county and municipal governments have made land use decisions that may be in conflict with existing freight transportation facilities. This is particularly notable in port locations where new residential and commercial uses are encouraged and displace existing freight facilities.

Minnesota Statewide Freight Plan May 2005
Performance Measures 7-1
7.0 Performance Measures
With the adoption of the Minnesota Statewide Transportation Plan in 2003, Mn/DOT began implementing a performance-based planning approach in its investment decision-making proc-ess. To this end, Mn/DOT will monitor, evaluate and consider performance-based transportation system needs when making investment decisions. This approach is expected to more clearly communicate both current transportation trends and desired outcomes. The goal is to direct investments to address identified transportation performance problems that provide benefits to Mn/DOT’s customers.
Performance measures support tradeoff analysis in the policy, planning and programming context. They help to set appropriate targets for a policy or system plan where tradeoffs involve different system elements (e.g., highway versus ports and waterways); or different objectives (e.g., mobility versus safety), given varying assumptions about resources available in a given timeframe.
7.1 Minnesota Statewide Transportation Plan Performance Framework
The 2003 Minnesota Statewide Freight Plan developed a clear set of policies linked to Mn/DOT’s previously formulated strategic directions. From these policies emanated a comprehensive set of multimodal performance measures contained within a framework that linked performance measures to policies and provided a means for matching performance measures across relevant modes, including freight transportation, defined in the STP as motor carriers, railroads, waterways and aeronautics.
A framework was developed for identifying critical linkages between the Minnesota Statewide Freight Plan and the adopted Minnesota Statewide Transportation Plan. In addition, strategies have been developed to address how the Minnesota Statewide Freight Plan is to meet STP policies and performance measures and how to use the STP policies and measures to enhance freight performance measures. Additional freight measures are described, as well as data availability and how this availability affects the ability to set performance targets.
The Minnesota Statewide Transportation Plan describes Mn/DOT’s three strategic directions and defines associated policies as follows. Transportation Plan Policies 1 through 7 address all modes, system infrastructure, and services, as well as geographic areas.

Minnesota Statewide Freight Plan May 2005
7-2 Performance Measures
Strategic Direction: Safeguard What Exists
The Minnesota Statewide Transportation Plan identifies the following policies:
• Policy 1 – Preserve essential elements of existing transportation systems;
• Policy 2 – Support land use decisions that preserve mobility and enhance the safety of transportation systems; and
• Policy 3 – Effectively manage the operation of existing transportation systems to provide maximum service to customers.
Strategic Direction: Make the Network Operate Better
The Minnesota Statewide Transportation Plan identifies the following policies:
• Policy 4 – Provide cost-effective transportation options for people and freight;
• Policy 5 – Enhance mobility in IRCs linking Regional Trade Centers;
• Policy 6 – Enhance mobility within Regional Trade Centers; and
• Policy 7 – Increase the safety and security of transportation systems and their users.
Strategic Direction: Make Mn/DOT Work Better
The Minnesota Statewide Transportation Plan identifies the following policies:
• Policy 8 – Continually improve Mn/DOT’s internal management and program delivery;
• Policy 9 – Inform, involve, and educate all potentially affected stakeholders in transportation plans and investment decisions processes; and
• Policy 10 – Protect the environment and respect community values.
In developing these policies, Mn/DOT understands that it does not have the ability to fully control many of the outcomes implied by these policies. For example, the privately owned airline and railroad industries and the influence that regional, domestic and international competitive market forces exert on these industries are the primary drivers of decisions made by airline and rail companies. However, Mn/DOT has articulated these policies because it believes that it can indirectly affect outcomes through funding participation, technical assistance, partnership formation and outreach and involvement activities.

Minnesota Statewide Freight Plan May 2005
Performance Measures 7-3
7.2 Existing Freight Performance Measures
The Minnesota Statewide Transportation Plan developed performance measures to monitor Minnesota’s transportation system. Many of these measures, particularly those for highway and bridges, are directly relevant to freight transportation because of the important role of highways in statewide freight movement. Measures are listed below by mode.
7.2.1 Freight Measures by Mode
Trucking
1.1T Percent of miles of highway that meet “good” and “poor” ride quality targets (from STP measure 1.1H).
2.1T Percent of townships, counties, and municipalities along IRCs whose adopted local plans and ordinances support IRC Management Plans and Partnership studies (from STP measure 2.1H).
2.2T Percent of IRC and bottleneck removal projects identified in the 10-Year Program for which right-of-way needs have been protected (from STP measure 2.2H).
3.1T1 Clearance time for incidents, crashes, or hazmats (metro) (from STP measure 3.1H1).
3.1T2 Snow and ice removal clearance time (from STP measure 3.1H2).
3.2T Percent of miles of Principal Arterial corridors in RTCs 0 and 1 that are managed (from STP measure 3.2H).
4.3T Percent of major generators with appropriate roadway access to IRCs and major highways (from STP measure 4.3F).
5.1T Percent of IRC miles meeting speed targets (from STP measure 5.1H).
5.2T Peak-period travel time reliability on IRCs and other high-use truck roadways (modified from STP measure 5.2H).
6.1T Ratio of peak to off-peak travel time – Travel Rate Index (metro) (from STP Measure 6.1H).
6.2T Peak-period travel time reliability on TCMA highways (modified from STP measure 6.2H).
6.3T Miles of peak-period congestion per day (RTCs 0 and 1) (from STP Measure 6.3H).
7.1T Heavy truck crash rate (three-year average) (modified from STP measure 7.1).

Minnesota Statewide Freight Plan May 2005
7-4 Performance Measures
7.2T Number of heavy truck-related fatalities (three-year average) (modified from STP measure 7.2).
Rail
4.3R Percent of major generators with appropriate rail access (modified from STP measure 4.3F).
7.1R1 Total crashes at at-grade rail crossings (three-year average) (from STP measure 7.1F).
7.2R Number of truck-related fatalities at at-grade rail crossings (three-year average) (modified from STP measure 7.2).
Waterways
There are no existing measures for the waterways mode.
Air Cargo
1.2A Percent of airport runways that meet good and poor pavement condition targets (from STP measure 1.2A).
4.3A Percent of air cargo facilities with appropriate roadway and rail access (modified from STP measure 4.3F).
Intermodal Facilities
4.3I Percent of intermodal facilities (ports/terminals) with appropriate roadway and rail access (modified from STP measure 4.3F).
7.3 New Freight Performance Measures and Indicators
The Minnesota Statewide Freight Plan identifies additional performance measures and indicators for all modes of freight transportation. The measures and targets will be further defined through follow-up action. Performance indicators were added to the Plan. Indicators of freight activity and characteristics are used primarily to track/detect trends and fluctuations over time, and are useful for alerting stakeholders and policy-makers of ongoing and anticipated changes in the freight market.
The Minnesota Statewide Freight Plan performance measures and indicators are described below.

Minnesota Statewide Freight Plan May 2005
Performance Measures 7-5
7.3.1 Freight Performance Measures
Trucking
1.2T Benefit of truck weight enforcement on pavement service life.
Rail
1.2R1 Percent of rail track-miles with track speeds >25 mph.
1.2R2 Percent of rail track-miles with 286,000-pound railcar capacity rating.
Waterways
3.2W Average delay time at river locks.
Air Cargo
4.1A Availability of direct international air cargo freighter service.
Intermodal Facilities
1.2I Percent of intermodal facilities whose infrastructure condition is adequate.
4.1I Availability of container-handling capability and/or bulk transfer capability.
7.3.2 Freight Performance Indicators
The following indicators have been identified by MFAC for tracking and monitoring freight activity:
− Shipment rates for selected commodities, modes and regional and national markets;
− Mode share (tonnage and value)– Amount of freight carried by each freight mode, by major commodity groups; and
− Geographic market share – Tonnage and value of shipments to/from the state, by major commodity groups, to major trading partners.
− Travel time for selected commodities, modes and regional and national markets.

Minnesota Statewide Freight Plan May 2005
7-6 Performance Measures
7.4 Targets for Freight Performance Measures
Performance targets allow Mn/DOT to track system performance and to know whether it is achieving its performance objectives. Targets should be realistic. Setting targets too high can lead to over-investment or non-attainment. Setting targets too low can lead to under-investment and a system that does not meet customer expectations. The Minnesota Statewide Transportation Plan focused on three target horizon years: six years, ten years and 20 years. The six-year target corresponds to three (two-year) business plan cycles; the 10-year target corresponds to Mn/DOT’s 10-Year Work Plan; and the 20-Year target corresponds to the planning horizon of both the Minnesota Statewide Transportation Plan and the Minnesota Statewide Freight Plan.
The ability to set freight performance targets depends on the availability of both historical and forecasted data. If the data is not available, but the performance measure is highly desirable, then a commitment would have to be made to collect the data necessary to set targets at a later date. These would be considered “developmental” measures. If the data is available, but the performance measures and targets have not been defined previously, these are referred to as “emerging measures.” If the data and targets already exist, these are referred to as “mature measures.”
Following is a description of data availability and directions for setting targets for the proposed freight measures. This plan does not set targets. Additional data must be collected and analyzed before targets can be set.
1.2T Benefit of truck weight enforcement on pavement service life.
While data is available on the effect of truck weight and overweight trucks on pavement life, sufficient data is not available at present that links level of enforcement to incidence of overweight violations and, therefore, to its effect on pavement service life. Thus, this measure is considered “developmental.” This means that a process for collecting this data must be developed. Once the data is analyzed, predictive tools can be developed and mid- and long-term targets set.
1.2R1 Percent of rail track-miles with track speeds > 25 mph.
Data is generally available for this measure from the rail companies (and perhaps the Federal Railroad Administration), but no targets have been set previously. Therefore, this is considered an “emerging” measure. This data must be compiled and analyzed, at which time targets can be set.
Minnesota Statewide Freight Plan May 2005
Performance Measures 7-7
1.2R2 Percent of rail track-miles with 286,000-pound railcar capacity rating.
Data for this measure is available from the rail carriers and FRA, but no targets have been set previously. This is considered an “emerging” measure. Data must be compiled and analyzed and targets set.
1.2I Percent of intermodal facilities whose infrastructure condition is adequate.
Data for this measure is generally available, but must be compiled and no targets have been previously set. This is an “emerging” measure. Once the data is compiled and analyzed, a definition of “adequate” condition can be made and targets set.
3.2W Average delay time at river locks.
This measure aims to look at the waterway system between Minneapolis and St Louis. This data is available, but must be compiled, and no targets have been set. This is an “emerging” measure. Once the data is compiled and analyzed, targets can be set.
4.1A Availability of direct international air cargo freighter service.
Data for this measure is available, but no targets exist. It is an “emerging” measure. Once data is compiled and analyzed, targets can be set.
4.1I Availability of container-handling capability and/or bulk transfer capability.
Data for this measure needs to be compiled. This is a “developmental” measure. Once data is collected and analyzed, targets can be set.
4.3T Percent of major generators with appropriate roadway access to IRCs and major highways.
This measure was developed in the STP, but has been modified to reflect access not only to IRCs, but to other major highways as well. This refinement is based on a study of highway connections in Greater Minnesota, conducted by Mn/DOT, which concluded that many of the relevant connections are between generators and non-IRC highways. The study, which examined approximately 130 major freight generators statewide (but outside of the TCMA), found that about three percent of the connections identified were considered inadequate by the owners/managers of the facilities. The study also found that local jurisdictions often address problems by either improving the connection or by removing the restrictions that render the connection inadequate (e.g., lifting weight restrictions).
A cleaner definition of “appropriate” connections needs to be made – the connection study relied on managers/owners of facilities to define adequacy based on their individual experiences. A more formal definition would use some of the factors already in use for identifying NHS connectors. Once this is done, and the relevant data is collected, targets can be set.
Minnesota Statewide Freight Plan May 2005
7-8 Performance Measures
The study of connections to major generators also examined connections in the TCMA, since the STP measure did not consider the area inside the I-494/I-694 loop. The study concluded that a new approach for determining adequacy of connections was needed because of the great number of generators in the TCMA and because the high density of roads provides, as a rule, multiple access points between generators and the TCMA highway system.
The study proposed that generators be aggregated into logical “clusters” based primarily on type of land use and geographic proximity. The cluster approach yields a number of advantages: 1) while individual generators can go out of business or move from the area, clusters – because of the land use basis used in defining them – are stable; 2) the cluster approach obviates the need to identify individual connections to each generator; instead, one or two connections can be defined for each cluster (which may contain multiple generators); and 3) connections to clusters could be laid out to more efficiently serve all generators within the cluster. In this sense, the cluster approach is not too dissimilar to the concept of “freight villages,” which uses a subdivision approach and a sharing of facilities in the way the village is laid out.
The next steps for the TCMA analysis of connectors are to refine the clusters themselves; identify the main (one or two) connectors that best serve each cluster; define the factors that should be considered when defining adequacy; inventory the connections to determine their level of adequacy; and set mid- and long-term targets.
An effort currently underway relevant to the issue of freight connections is an attempt by Mn/DOT to define County State Aid Highways to be consistent with the 10-ton network currently being designated. Since many of the “last-mile” connectors to generators are CSAHs, this network, when superimposed on the IRC system and other THs (almost all of which are 10-ton roads), will yield a complete statewide 10-ton system. This system is of great interest to shippers and truckers who have identified weight-restricted local roads as an impediment to freight movement. By mapping major generators onto this 10-ton system, gaps can be readily identified and the information used to help determine connection adequacy.
4.3R Percent of major generators with appropriate rail access.
Data for this measure must be compiled and analyzed and targets defined. This is a “developmental” measure. As part of this effort, the term “appropriate” needs to be defined. To the extent possible, the definition of appropriateness and the level of target setting should be consistent with those for trucking measure 4.3T.
4.3A Percent of air cargo facilities with appropriate roadway and rail access.
This measure is a corollary to trucking measure 4.3T and is “developmental.” However, since there are so few air cargo airports in the state, the data and targets could be established in a short timeframe.

Minnesota Statewide Freight Plan May 2005
Performance Measures 7-9
4.3I Percent of intermodal facilities (ports/terminals) with appropriate roadway and rail access.
This measure for ports/terminals is a corollary of trucking measure 4.3T, rail measure 4.3R and air cargo measure 4.3A and is a “developmental” measure.
5.2T Peak period travel time reliability on IRCs and other high-use truck roadways.
This is an STP measure and is considered “developmental.” Data is available, but targets have not been set. High-use, non-IRC truck roadways have been identified in this Plan.
6.2T Peak period travel time reliability on metro area highways.
This is an STP measure and is considered “emerging.” Data is not available nor have targets been set.
7.1T Heavy truck crash rate (three-year average).
Historic data for this measure is readily available, as are truck volume forecasts. Furthermore, the STP has established a crash rates performance measure for all vehicles, which provides a basis for developing truck crash rate targets. Therefore, this measure could be placed somewhere between an “emerging” and a “mature” measure and targets could be developed relatively quickly.
7.1R1 Total crashes at at-grade rail crossings (three-year average).
This is an STP measure and is considered a “mature” measure.
7.1R2 Percent of at-grade rail crossings meeting grade-separation guidelines.
Data for this measure is not available at present nor have targets been set. This is a “developmental” measure. Once data is collected and analyzed, targets can be set, provided the grade separation guidelines are well defined.
7.2T Number of heavy truck-related fatalities (three-year average).
Historic data for this measure is available, as are truck forecasts. Furthermore, the STP has established a total fatalities performance measure for all vehicles, which provides a basis for developing truck-related fatality targets. Therefore, this measure can be placed somewhere between a “developmental” and an “emerging” measure and targets could be developed relatively quickly.
7.2R Number of truck-related fatalities at at-grade rail crossings (three-year average).
This information is a subset of performance measure 7.1R and requires quantification of truck-related fatalities. This can be considered a “mature” measure.

Minnesota Statewide Freight Plan May 2005
Freight Policy Framework 8-1
8.0 Freight Policy Framework
The previous chapters identify freight infrastructure, describe freight flows, analyze the freight system, review the Mn/DOT freight programs, describe the trends affecting freight and introduce new performance measures and indicators. A new freight policy was developed as a response to the findings of these chapters. This policy will be implemented through a set of strategies and progress will be monitored with performance measures and indicators.
8.1 Freight Policy
The freight policy recognizes the importance of all modes for a balanced freight transportation system, the need for connections between modes and, finally, that efficient access to expanding markets is increasingly significant to Minnesota businesses operating in a global economy. The policy is consistent with and built on the overall policies of the Minnesota Statewide Transportation Plan, and is a more developed expression of Mn/DOT’s commitment to improving the freight transportation system:
Provide an integrated system of freight transportation in Minnesota – highway, rail, water, air cargo, and intermodal terminals – that offers safe, reliable, and competitive access to statewide, national, and international markets.
The freight policy was developed to reaffirm the freight commitment for Mn/DOT and our transportation partners. It is further defined into six policy directions, each of which in turn is supported by a set of more specific strategies.
8.2 Policy Directions and Strategies
As shown in Figure 8.1, the policy is further articulated through six policy directions. The policy directions are more specific and group the 34 strategies.
The freight performance measures and indicators developed through the Minnesota Statewide Freight Plan are also grouped by policy direction. These measures and indicators are currently under development and will be used to monitor progress towards the policy directions.

Minnesota Statewide Freight Plan May 2005
8-2 Freight Policy Framework
Figure 8.1 Freight Policy and Policy Directions
Improve The Condition, Connectivity, And Capacity
Of Statewide Freight Infrastructure
Enhance Integration Of Freight Into Regional And
State Transportation Planning And Investment
Decisions
Strengthen Partnerships To Address Significant
Freight Issues
Improve The Condition, Connectivity, And Capacity
Of National And International Freight
Infrastructure Serving Minnesota
Streamline And Improve The Effectiveness Of Motor
Carrier Regulatory Activities
Enhance The Operational Performance And Safety Of Statewide
Freight Systems
PROVIDE ANINTEGRATED SYSTEM OF FREIGHT
TRANSPORTATION IN MINNESOTA –HIGHWAY, RAIL, WATER, AIR CARGO,
AND INTERMODAL TERMINALS -THAT OFFERS SAFE,
RELIABLE, AND COMPETITIVE ACCESSTO STATEWIDE, NATIONAL AND
INTERNATIONAL MARKETS.
Policy Direction 1 – Improve the Condition, Connectivity, and Capacity of Statewide Freight Infrastructure
Improvements are needed to the physical condition of the freight system in Minnesota due to age, wear, and inadequate design. Mn/DOT operates freight programs, such as the Minnesota Rail Service Improvement Program and the Port Development Assistance Program, which were established to preserve and modernize basic freight infrastructure. While these programs have succeeded in improving facility infrastructure, additional understanding of the impacts of these programs on improving freight mobility is needed.
Efficient connections are needed between trade centers, to and from freight generating facilities, and between modes. This includes the “last-mile” roadway connections between these facilities and the major highway systems. These connections must be designed, including weight limits, to accommodate heavy trucks.
Sufficient capacity is required to meet current and future demand for shipping goods. This includes not only the main line highway, railroads and waterways, but also the intermodal terminals, which provide for the transfer of freight between two or more modes and which allow

Minnesota Statewide Freight Plan May 2005
Freight Policy Framework 8-3
for optimizing freight movements over longer distances. Bulk intermodal terminals allow for the transfer of high-tonnage, low-value commodities, such as taconite, coal and grain. Intermodal container terminals provide for transfer of manufactured products between truck and rail.
Strategies
1. Support improvements needed on roadways with significant truck volumes, in particular, bridge and pavement deficiencies affecting trucks. The highway system provides statewide access for freight movements (59 percent of total tonnage and 79 percent of total value are carried by truck). Significant unmet state trunk highway performance needs have been identified through Mn/DOT’s long-range planning process. Efforts should be made to preserve, maintain and improve the highway infrastructure critical for freight, in particular bridge clearances and weight deficiencies on the Interregional Corridor system and major TCMA highways.
2. Structure Mn/DOT’s freight assistance programs to achieve performance targets and assess benefits and costs. Mn/DOT operates several programs (e.g., MRSI, Port Development Assistance Program) that provide funding to railroads and water ports for the rehabilitation of infrastructure. There is a need to refine programs based upon changing industry trends and conditions. Changes to project eligibility criteria may be needed, as well as a greater focus on cost/benefit analysis and tracking of impacts over time.
3. Improve the efficiency, condition, and capacity of intermodal terminals (ports, truck-rail terminals). Intermodal terminals provide for the transfer of freight between modes, including containers and bulk shipments. Many of these terminals have aging infrastructure and are facing capacity constraints. Mn/DOT will work with others to improve these facilities, thereby preserving multimodal options for shippers and improving access to markets. Innovative intermodal or bimodal services using new technologies or new partnerships should also be encouraged.
4. Support efforts to develop a statewide interconnected 10-ton roadway system to serve major freight facilities. Local and regional roadways provide important connections to freight generators and intermodal facilities. Many of these roadways are not designed for heavy trucks. A statewide interconnected system of roads built to a 10-ton standard would eliminate gaps in the freight network. Mn/DOT will work with the counties to identify roads that should be included in this system.
5. Pursue National Highway System Intermodal Connector designation for significant
connectors.

Minnesota Statewide Freight Plan May 2005
8-4 Freight Policy Framework
Intermodal Connectors provide roadway access between major intermodal facilities and the NHS. Designation may provide eligibility for federal funding to address roadway deficiencies. Mn/DOT will pursue designation for all qualifying connector roadways.
6. Evaluate railroad shuttle train trends to determine impacts on shippers and railroads; structure rail assistance and road system strategies to respond, as appropriate. Class I railroads have developed grain shuttle train service to increase shipping efficiencies. The terminals (i.e., grain elevators) accommodating these shuttles are attracting grain shipments, primarily by truck, from Minnesota and the Plains states. Shuttle trains are also moving coal from Mountain states to and through Minnesota. Mn/DOT will further evaluate these trends and their impacts on the local and trunk highway system, local grain elevators and Class II and III railroads, and respond appropriately.
Policy Direction 1 Performance Measures and Indicators
Seven new performance measures have been identified for Policy Direction 1 through the Minnesota Statewide Freight Plan. These measures will be developed as a follow-on activity to this Plan; targets will be set, and progress for each measure and its accompanying policy direction will be measured. The seven new performance measures are listed below.
Benefit of truck weight enforcement on pavement service life. Percent of rail track-miles with track speeds >25 mph. Percent of rail track-miles with 286,000-pound railcar capacity rating. Average delay time at river locks. Availability of direct international air cargo freighter service. Percent of intermodal facilities whose infrastructure condition is adequate. Availability of container-handling capability and/or bulk transfer capability.
Existing measures from the Minnesota Statewide Transportation Plan will also be used to measure Policy Direction 1.
Policy Direction 2 – Improve the Condition, Connectivity, and Capacity of National and International Freight Infrastructure Serving Minnesota
Minnesota’s freight system includes nationally significant freight corridors that carry freight beyond the state’s borders. The ability of Minnesota’s industries to connect to national and international markets served by these corridors is critical to the health of the state’s economy. To reach markets outside the state’s borders, Minnesota’s freight travels on infrastructure (i.e., highways, railroads, waterways) within other states. Time-sensitive, premium transportation services will be increasingly critical for trade with more distant markets. Increased time for

Minnesota Statewide Freight Plan May 2005
Freight Policy Framework 8-5
freight shipments relates to increases in costs for products. The condition, connectivity and capacity of these corridors must be maintained and enhanced. Mn/DOT’s role in addressing transportation needs outside its borders is limited but important.
In some cases, the preservation and expansion of existing infrastructure and the elimination of bottlenecks are necessary. In other cases, the introduction of new freight services and infrastructure may be needed.
Strategies
1. Eliminate bottlenecks and improve national trade highways that serve Minnesota.
Minnesota’s major trading partners for freight are the Midwest and Plains states, and major growth in trade is expected with Southern and Western states. Important national trade highways (e.g., I-94, I-35) must be maintained/improved through coordination with other states to identify and address current and future needs.
2. Eliminate bottlenecks on national rail corridors serving Minnesota.
Much of the state’s rail freight travels through major rail hubs outside of Minnesota, particularly in Chicago. Bottlenecks at these hubs include deficiencies such as inefficient transfers between railroads, aging infrastructure and rail congestion. Mn/DOT will continue to participate in multi-state efforts to address these bottlenecks.
3. Improve intermodal container service to accommodate long haul movements.
The availability of intermodal container rail service is important to the growth of Minnesota industries. In order to provide more accessible, timely and economically competitive intermodal service, Mn/DOT will support the evaluation and development of intermodal terminal facilities located closer to the demand centers for this service in the state. It will encourage and explore incentives for the establishment by railroads of direct intermodal rail service between Minnesota and intermodal ports in southern California and the Pacific Northwest. Much of this service is currently handled through Chicago. Mn/DOT also supports the concept of utilization of river barge transport for container movements between Minnesota ports and the Gulf of Mexico.
4. Establish an international air cargo regional distribution center to support direct
international service.
Freight containers in the belly of passenger planes scheduled through Minneapolis-St. Paul International Airport provide 20 percent of Minnesota’s air cargo service. There are no dedicated cargo-only direct flights from MSP to international destinations, and as a result, passenger airlines offer the only air cargo service with limited direct international flights.

Minnesota Statewide Freight Plan May 2005
8-6 Freight Policy Framework
The shipment of Minnesota’s high-value, time-sensitive, international bound freight is accomplished by trucking goods to Chicago where international additional flights with cargo capacity are available. Air cargo trucked to Chicago, and from there shipped internationally by air, accounts for 80 percent of Minnesota’s air cargo service. Minnesota’s economy would benefit from cost and reliability improvements of dedicated freighter flights providing direct international air cargo service from MSP. In order to attract this additional service, an international air cargo regional distribution center is being proposed. Mn/DOT will support these proposal efforts.
5. Support increased capacity at Upper Mississippi River locks and the Great Lakes’ Sault Ste. Marie lock.
The waterway system on the Mississippi River and Great Lakes handles sizable tonnages of agricultural and mining freight shipments. The Upper Mississippi River system must be improved to accommodate large barge tows through the locks. Improvements have also been recommended at the Sault Ste. Marie lock. Mn/DOT will support planning efforts to make these capacity improvements.
6. Support a study of the St. Lawrence Seaway and Welland Canal locks for accommodating large international ships.
Much of the growth in international waterborne commerce is expected to be carried in larger ships. These ships are too large to be accommodated by the St. Lawrence Seaway locks, as well as the Welland Canal locks, which connect Lake Erie and Lake Ontario and provide access around Niagara Falls. In order to accommodate larger vessels and provide Minnesota with access to this freight service, Mn/DOT will support the efforts by the U.S. and Canadian governments to study improvements to the Great Lakes/St. Lawrence Seaway system.
Policy Direction 2 Performance Measures and Indicators
Four new performance indicators have been identified for Policy Direction 2 through the Minnesota Statewide Freight Plan. These indicators are currently being developed as a follow-on activity to this Plan. Due to the national/international nature of this policy direction, it is best tracked by performance indicators rather than measures. The four new performance indicators are listed below.
Shipment rates for selected commodities, modes and regional and national markets. Mode share - amount of freight carried by each mode, by major commodity groups. Geographic market share - tonnage and value of shipments to/from the state, by major
commodity groups, to major trading partners. Travel time for selected commodities, modes and regional and national markets.
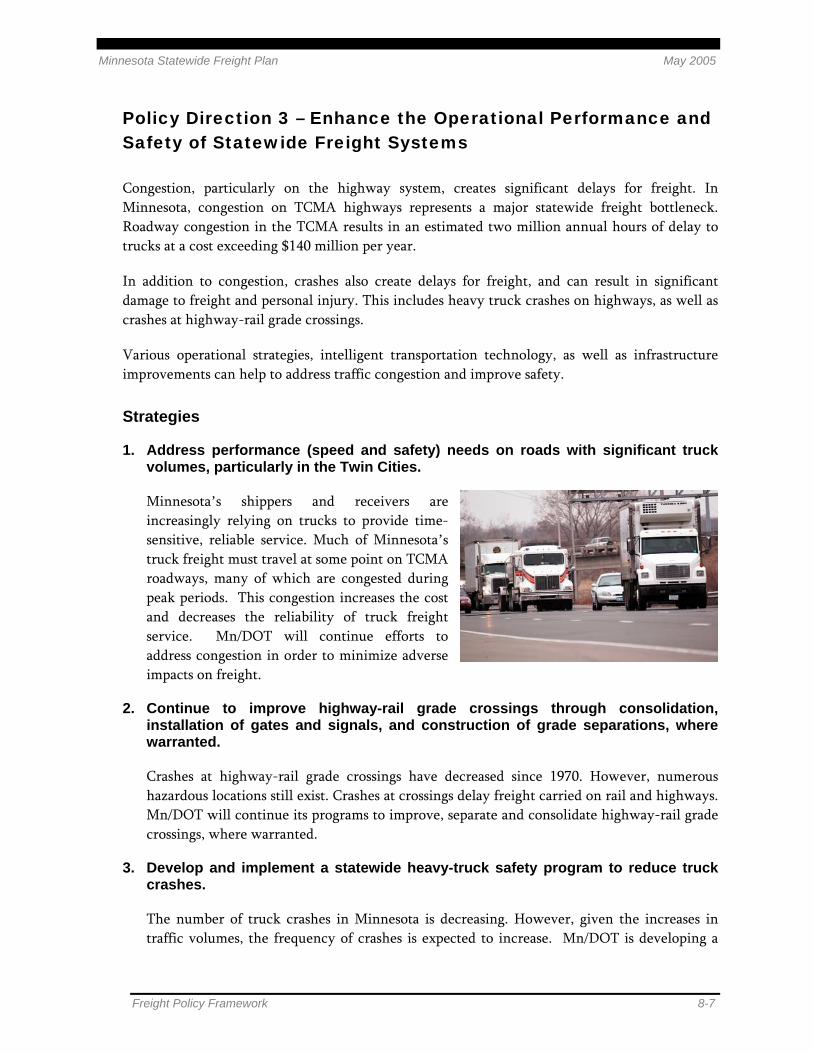
Minnesota Statewide Freight Plan May 2005
Freight Policy Framework 8-7
Policy Direction 3 – Enhance the Operational Performance and Safety of Statewide Freight Systems
Congestion, particularly on the highway system, creates significant delays for freight. In Minnesota, congestion on TCMA highways represents a major statewide freight bottleneck. Roadway congestion in the TCMA results in an estimated two million annual hours of delay to trucks at a cost exceeding $140 million per year.
In addition to congestion, crashes also create delays for freight, and can result in significant damage to freight and personal injury. This includes heavy truck crashes on highways, as well as crashes at highway-rail grade crossings.
Various operational strategies, intelligent transportation technology, as well as infrastructure improvements can help to address traffic congestion and improve safety.
Strategies
1. Address performance (speed and safety) needs on roads with significant truck volumes, particularly in the Twin Cities.
Minnesota’s shippers and receivers are increasingly relying on trucks to provide time-sensitive, reliable service. Much of Minnesota’s truck freight must travel at some point on TCMA roadways, many of which are congested during peak periods. This congestion increases the cost and decreases the reliability of truck freight service. Mn/DOT will continue efforts to address congestion in order to minimize adverse impacts on freight.
2. Continue to improve highway-rail grade crossings through consolidation, installation of gates and signals, and construction of grade separations, where warranted.
Crashes at highway-rail grade crossings have decreased since 1970. However, numerous hazardous locations still exist. Crashes at crossings delay freight carried on rail and highways. Mn/DOT will continue its programs to improve, separate and consolidate highway-rail grade crossings, where warranted.
3. Develop and implement a statewide heavy-truck safety program to reduce truck crashes.
The number of truck crashes in Minnesota is decreasing. However, given the increases in traffic volumes, the frequency of crashes is expected to increase. Mn/DOT is developing a

Minnesota Statewide Freight Plan May 2005
8-8 Freight Policy Framework
statewide heavy truck safety program that will include vehicle and driver-based strategies along with enforcement to address truck crash rates.
4. Implement intelligent transportation systems and operational strategies to improve the movement of freight.
Technological improvements to the transportation system, often referred to as intelligent transportation systems, have the potential to increase throughput on the transportation system. These technologies have many applications for freight transportation, including freight traffic prioritization strategies, lower cost highway-rail crossing warning devices, and improved traveler information for truckers regarding road/weather conditions and directions to destinations. New technologies are also important for speeding border security clearances for truck and rail at international borders. Mn/DOT will continue to pursue and support ITS applications for freight transportation.
5. Assess and improve the availability of parking for commercial vehicles along major highway corridors.
To ensure their safety and the safety of others, long-distance truck drivers are required to take regular rest periods. Mn/DOT provides for short term parking at safety rest areas. Private truck stops provide the primary parking for commercial vehicles. The demand for this parking will change as the regulations governing truck drivers’ “hours-of-service” and the volumes of trucking change. Mn/DOT will work with both the public sector and private sector to better understand the supply and demand for truck parking and to jointly develop innovative solutions.
Policy Direction 3 Performance Measures & Indicators
New performance measures for Policy Direction 3 will be developed as a follow-on activity to this Plan; targets for new measures will be set, and progress for this policy direction will be measured. Existing measures from the Minnesota Statewide Transportation Plan will also be used to measure Policy Direction 3.

Minnesota Statewide Freight Plan May 2005
Freight Policy Framework 8-9
Policy Direction 4 – Enhance Integration of Freight into Regional and State Transportation Planning and Investment Decisions
Freight transportation needs should be explicitly considered in transportation investment decisions. The decision-making processes for project selection frequently do not include specific freight criteria; if included, they normally receive minimal weight.
The ability to monitor the performance of the freight system is an important factor in guiding these investment decisions. Mn/DOT is implementing a recommended set of freight-specific measures, indicators and targets to assess performance.
Freight planning is needed at the regional and local level to better capture local needs. Industries in specific geographic regions may have unique freight transportation requirements that should be separately identified and evaluated.
Strategies
1. Develop and monitor key freight system performance measures and indicators; set targets, as appropriate.
Mn/DOT has developed performance measures and indicators as part of the Minnesota Statewide Transportation Plan. While many of these performance measures are important to freight (e.g., IRC performance), additional performance measures specific to freight are needed. This Plan has proposed a number of those measures. Mn/DOT will pursue the development and monitoring of those measures in order to assess the conditions for freight and to guide investment decisions.
2. Strengthen freight consideration in project planning and investment decision-making by planning organizations.
Investment decisions by transportation planning organizations can be improved by better considering freight. Mn/DOT, metropolitan planning organizations, area transportation partnerships, regional development commissions, cities and counties should use more specific freight criteria for planning and project selection. Fully accounting for freight needs may shift the priorities of proposed programs and projects. Mn/DOT will support the efforts to specifically identify and use freight criteria in planning and programming. There is also a need for further evaluation of the costs of congestion for freight, particularly in the TCMA.
3. Provide technical and other assistance to transportation planning organizations to improve freight planning.
Better data collection and analysis is needed to properly understand and address freight needs. Mn/DOT will take a leadership role in collecting and distributing freight data. Additional funding may be necessary to support these freight data initiatives. Mn/DOT will

Minnesota Statewide Freight Plan May 2005
8-10 Freight Policy Framework
also provide guidance for conducting freight studies and research and developing regional freight plans.
4. Continue coordination with the Federal Highway Administration on strategies for improving freight transportation.
Mn/DOT will respond to the changing federal requirements for freight planning. Federal planning guidelines are being developed to address freight on a national and international level. Mn/DOT will also respond to opportunities for federal funding and partnerships with multistate and national organizations.
5. Maintain an effective program of research to identify industry issues and innovative solutions to freight problems.
Mn/DOT maintains a comprehensive transportation research program in cooperation with the University of Minnesota and other universities in the Upper Midwest. This research program includes freight transportation, much of which focuses on the needs of shippers and carriers and innovative solutions to industry issues. Mn/DOT will continue this program in consultation with the private sector.
Policy Direction 4 Performance Measures & Indicators
New performance measures for Policy Direction 4 will be developed as a follow-on activity to this Plan; targets for new measures will be set, and progress for this policy direction will be measured. Existing measures from the Minnesota Statewide Transportation Plan will also be used to measure Policy Direction 4.
Policy Direction 5 – Strengthen Partnerships to Address Significant Freight Issues
A variety of stakeholders, both public and private, are currently involved in the planning, development, and operation of freight transportation in Minnesota. Improved communication and coordination and formalized partnerships offer the potential to more successfully address freight issues. These partnerships can operate on a programmatic level, as on-going dialogues, or to address ad hoc industry needs or to advance individual projects/initiatives. Public/private partnerships are essential for exploring broader economic development, environmental and other issues. Partnerships may include public agencies from the federal, state, regional and local levels, along with a wide range of private-sector organizations.
Strategies
1. Strengthen public sector partnerships to advance freight policies, strategies (e.g., economic development), and tools.
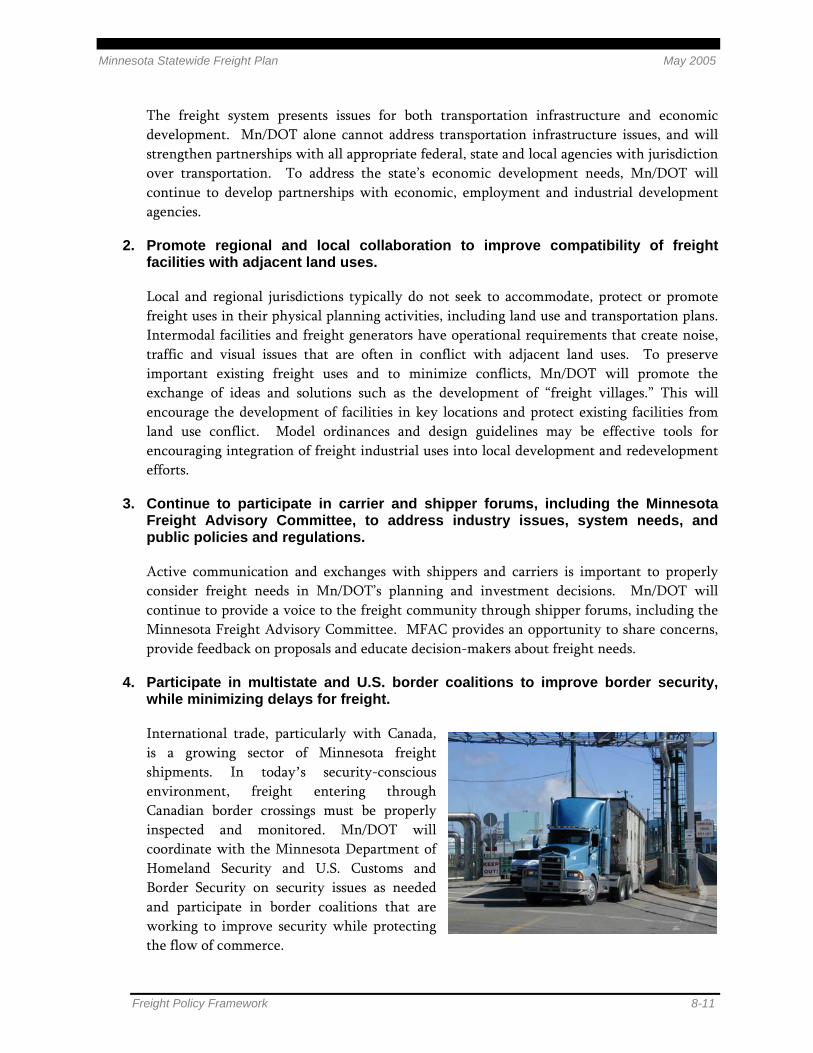
Minnesota Statewide Freight Plan May 2005
Freight Policy Framework 8-11
The freight system presents issues for both transportation infrastructure and economic development. Mn/DOT alone cannot address transportation infrastructure issues, and will strengthen partnerships with all appropriate federal, state and local agencies with jurisdiction over transportation. To address the state’s economic development needs, Mn/DOT will continue to develop partnerships with economic, employment and industrial development agencies.
2. Promote regional and local collaboration to improve compatibility of freight facilities with adjacent land uses.
Local and regional jurisdictions typically do not seek to accommodate, protect or promote freight uses in their physical planning activities, including land use and transportation plans. Intermodal facilities and freight generators have operational requirements that create noise, traffic and visual issues that are often in conflict with adjacent land uses. To preserve important existing freight uses and to minimize conflicts, Mn/DOT will promote the exchange of ideas and solutions such as the development of “freight villages.” This will encourage the development of facilities in key locations and protect existing facilities from land use conflict. Model ordinances and design guidelines may be effective tools for encouraging integration of freight industrial uses into local development and redevelopment efforts.
3. Continue to participate in carrier and shipper forums, including the Minnesota Freight Advisory Committee, to address industry issues, system needs, and public policies and regulations.
Active communication and exchanges with shippers and carriers is important to properly consider freight needs in Mn/DOT’s planning and investment decisions. Mn/DOT will continue to provide a voice to the freight community through shipper forums, including the Minnesota Freight Advisory Committee. MFAC provides an opportunity to share concerns, provide feedback on proposals and educate decision-makers about freight needs.
4. Participate in multistate and U.S. border coalitions to improve border security, while minimizing delays for freight.
International trade, particularly with Canada, is a growing sector of Minnesota freight shipments. In today’s security-conscious environment, freight entering through Canadian border crossings must be properly inspected and monitored. Mn/DOT will coordinate with the Minnesota Department of Homeland Security and U.S. Customs and Border Security on security issues as needed and participate in border coalitions that are working to improve security while protecting the flow of commerce.

Minnesota Statewide Freight Plan May 2005
8-12 Freight Policy Framework
5. Participate in multistate coalitions to develop regional approaches to freight system improvement.
The majority of freight moving in Minnesota at some point also travels outside of the state’s borders. Coalitions have been formed to address individual corridor and/or regional freight needs, in some cases on a multimodal basis. Mn/DOT will continue to work with coalitions to address freight issues outside of the state’s borders.
6. Seek public-private partnerships for innovative project financing and implementation.
Much of the freight transportation system is operated and/or owned by the private sector. The private sector is a major investor in and beneficiary of improvements to the freight system. However, resources from the private sector may not be sufficient to implement all of the required freight improvements. Public/private partnerships will be explored to implement and finance appropriate freight transportation projects.
Policy Direction 5 Performance Measures & Indicators
New performance measures for Policy Direction 5 will be developed as a follow-on activity to this Plan; targets for new measures will be set, and progress for this policy direction will be measured. Existing measures from the Minnesota Statewide Transportation Plan will also be used to measure Policy Direction 5.
Policy Direction 6 – Streamline and Improve the Effectiveness of Motor Carrier Regulatory Activities
Trucks carry the largest share of freight in Minnesota. Owing to their size and weight, commercial vehicles have a significant impact on the physical and operational condition of the transportation roadway infrastructure. Certain motor carrier operations are regulated by Mn/DOT and the Minnesota Department of Public Safety. In order to serve the public interest, Mn/DOT should periodically review its motor carrier regulations, particularly those concerning size and weight limits, to stay current with changing trends and to minimize unnecessary impact to the industry.
Many of the commercial vehicles that travel on Minnesota’s highways also travel in other states. While regulation of these vehicles needs to serve Minnesota’s interest, the coordination of regulations (i.e., weight, size and speed limits) with surrounding states will ensure safer and more effective operations. In some instances, federal regulations preempt state requirements.
Technological improvements are making it easier for the state to maintain records of motor carrier operations, and to interact with commercial vehicle operators. These technologies should be fully considered to provide the most efficient and effective business transactions and informational outreach to industry.

Minnesota Statewide Freight Plan May 2005
Freight Policy Framework 8-13
Strategies
1. Develop and implement a statewide Strategic Commercial Vehicle Weight Enforcement Program.
The weight of trucks carrying freight significantly impacts the lifespan of roads and bridges in Minnesota. Improving compliance with motor vehicle weight regulations helps protect and preserve investments in infrastructure. A more strategic approach to enforcement will be based on improved knowledge of truck volumes and weights in Minnesota and analytical techniques for estimating the impacts of weight enforcement activity on pavement life and attendant costs.
2. Identify and deploy new technologies and practices that improve operator compliance with commercial vehicle weight laws.
Technological advances allow for more focused and efficient detection of overweight vehicles. Mn/DOT will actively explore the wider application of these technologies.
3. Examine costs and benefits of proposed changes to truck size and weight regulations to facilitate policy decisions.
Truck size and weight regulations are designed to protect Minnesota’s roads. The compliance with these size and weight regulations also impacts the cost to motor carriers who serve Minnesota’s industries. Mn/DOT will examine the costs and benefits of its regulations to properly consider the tradeoffs between the benefits to the public and the costs to the motor carrier industry.
4. Identify and evaluate differences in truck size and weight laws between Minnesota and surrounding jurisdictions and pursue changes, as warranted.
Commercial vehicles are governed by the size and weight regulations of the jurisdictions (i.e., states, provinces) in which they operate. Mn/DOT will identify the differences that exist in these regulations and consider changes that will protect Minnesota’s roads while ensuring consistency with surrounding jurisdictions. Consistencies among jurisdictions ensure more effective and efficient freight transportation.
5. Promote initiatives and technologies that expedite business transactions and educational outreach between motor carriers and regulatory agencies.
Commercial vehicle operators are subject to specific credentialing and permitting requirements. Much of this could be done electronically on-line, which would help reduce costs and increase efficiency. Educational information offered by Mn/DOT to its customers could be provided more effectively by using electronic correspondence. Mn/DOT will maximize the use of innovative technologies in its transactions with customers.

Minnesota Statewide Freight Plan May 2005
8-14 Freight Policy Framework
6. Structure motor carrier safety programs to achieve performance targets, assess cost/benefits, and coordinate efficiently among jurisdictions.
Reductions in heavy truck crash rates and heavy truck related fatality rates are recommended in this Plan as performance measures. Motor carrier safety programs are an important component in achieving these reductions. These safety programs should be considered when establishing and meeting performance targets.
Policy Direction 6 Performance Measures & Indicators
New performance measures for Policy Direction 6 will be developed as a follow-on activity to this Plan; targets for new measures will be set, and progress for this policy direction will be measured. Existing measures from the Minnesota Statewide Transportation Plan will also be used to measure Policy Direction 6.

Minnesota Statewide Freight Plan May 2005
Public Involvement 9-1
9.0 Public Involvement
This chapter highlights the public and stakeholder involvement process for development of this plan. It begins with an overview of the involvement and outreach processes and summarizes the comments received on the draft report.
9.1 Overview of Plan Development
Critical to the development of the plan was stakeholder involvement. Over 120 individual comments were received from 15 stakeholder groups. The “Minnesota Statewide Freight Plan” planning process was led by individuals in Mn/DOT’s Office of Freight and Commercial Vehicle Operations and developed in consultation with key experts within the office, including: Ports and Waterways; Rail Planning and Program Development; and Commercial Vehicle Operations. In addition to internal consultation, OFCVO sought external input and review from groups and individuals in Minnesota that are key stakeholders.
A Statewide Freight Plan Steering Committee was developed to provide oversight of the planning process. This committee included individuals within transportation planning organizations including Metropolitan Council, the Twin Cities Metropolitan Planning Organization; DEED; Southwest Minnesota Regional Development Commission; and the FHWA Minnesota Division and FHWA Resource Center. The Steering Committee also included individuals internal to Mn/DOT from the following areas: Program Management Division; Office of Investment Management; Metro District; State Aid; Aeronautics; and District 6.
Status updates were presented to Mn/DOT division directors, Mn/DOT planners, the Minnesota Regional Development Organization, Metropolitan Council, the American Association of State Highway and Transportation Officials, municipal planning organization directors and Minnesota Freight Advisory Committee.
In addition, a Freight Plan Leadership Forum was held on January 25, 2005. Decision makers were invited from Mn/DOT, other public agencies, from academia and from the private sector to participate in a discussion of the draft executive summary, the recommendations and the implementation. Comments and recommendations from these meetings, discussions and presentations were incorporated into the draft report.

Minnesota Statewide Freight Plan May 2005
9-2 Public Involvement
Public notice was given in the State Register, Volume 29, Number 29, published January 18, 2005. This was a request for comments on the DRAFT Executive Summary. Public notice was given in the State Register, Volume 29, Number 37, published March 14, 2005. This was a request for comments on the DRAFT Final Report. A 30-day public comment period was held from March 14, 2005 to April 15, 2005. Comments and recommendations received were incorporated into the final version of the Plan.
Both of these documents were also posted on Mn/DOT’s internal and external Web sites and e-mails were sent to stakeholders asking them to access and review the documents there. A response form was also provided on the Web for easy submission of comments. These comments were also incorporated into the draft report.
All comments have been collected and are available for review.
9.2 General Themes
Input provided during the public involvement process revealed several themes that were consistent throughout Mn/DOT and with Metro area, as well as Greater Minnesota, partners. The comments received have been classified into the four themes: investment and funding; freight movement and infrastructure on a small scale; prioritization; and data.
9.2.1 Investment and Funding
Several comments related to the need for freight investments to be tied to overall Mn/DOT investments. Aligning the plan with the Minnesota Statewide Transportation Plan and district plan horizons is one option to better integrate freight planning. Also, including freight criteria into overall planning and project selection processes would go a long way in funding freight needs.
Other comments suggested that Mn/DOT consider the benefits to freight from operational improvements of the roadway system. For example, congestion mitigation and incident management benefit freight. In addition, freight benefits from existing programming such as highway-rail grade separation guidelines. Continual support is needed of overall transportation investments that benefit freight.
Many comments received recommended that Mn/DOT use performance based planning built on performance measures to guide investment decisions. Performance based planning allows Mn/DOT to set targets for each policy to ensure investments are achieving specific outcomes. It also helps establish a cost-effective framework that provides the best value for the Minnesota taxpayer. Respondents felt that, through this process, the state would likely get the most “bang for its buck.” Measures, it was noted, should also guide the strategies presented in the

Minnesota Statewide Freight Plan May 2005
Public Involvement 9-3
Minnesota Statewide Freight Plan as another way of linking performance of Minnesota’s freight transportation system to investment in this system. Comments also indicated that if freight is included more often in transportation funding decisions, it is likely to lead to the institutionalization of freight into Mn/DOT’s, as well as other transportation planning organizations’, ultimate decisions and activities. Many respondents were also concerned with the equity of funding freight transportation projects. Some were concerned as to how, with limited resources, the state will balance the cost of investments (paid by public or private funds) with the benefits of investments (realized by public or private entities). Actual investments are not covered in the plan. A next step will be to develop investment proposals that take into account the public and private benefit.
9.2.2 Freight Movement & Infrastructure on a Small Scale
Another common concern of respondents was how freight movement and infrastructure are regulated and analyzed in local areas or on smaller scales. For example, the Minnesota Statewide Freight Plan was seen by some as focusing too much on aggregate, commodity-based model movements, rather than on local, practical movements, including those on “last mile” routes. Also on the local scale, comments were received regarding compatibility among freight movements, freight land use and other land uses (residential or business). There were also comments about conflicts between freight movements that affect land use such as those at roadway and railway crossings. Finally, at the local level, some thought the Minnesota Statewide Freight Plan did not fully take into account the extent to which local and regional governments consider freight when making decisions regarding transportation and local land use. Further work will include developing an action plan to prioritize strategies. In Policy Direction #4 Strategy 3, Mn/DOT will be providing guidance for developing regional freight plans that focus on the freight movements and decisions local and regional governments face (e.g. land use).
9.2.3 Prioritization
The most common comment received through the public review process was in regards to the prioritization of policy directions and strategies presented in Chapter 8. The Minnesota Statewide Freight Plan presents policy directions and strategies in a clear manner, but these strategies are not prioritized within the plan.
Several comments pointed out that there are no costs or specific actions associated with any recommendations or strategies in the Minnesota Statewide Freight Plan. Within the document there are no criteria to highlight which strategies would have the greatest impacts on freight, which are of greatest concern to the state, nor is there any cost-benefit analysis included with any recommendation or strategy.

Minnesota Statewide Freight Plan May 2005
9-4 Public Involvement
These actions, as commented on, are to be included in an action plan, which will consist of strategy prioritization and specific actions and costs attributable to each strategy.
9.2.4 Data
Many respondents indicated the need for new ways of measuring more useful and meaningful truck data that more accurately reflects the movement of freight within the state and identifies freight trends. With better data, Mn/DOT could improve planning and programming for freight.
A clear concern for a large number of those who commented is a need for an increase in the funding necessary to acquire more sophisticated data. This issue will be addressed in the action plan. Mn/DOT will work with the Office of Transportation Data and Analysis to assess data needs and determine what data is feasible to collect.
9.3 Audience Differences and Similarities
During the public involvement process, Mn/DOT heard from the general public. However, most comments were from Mn/DOT; the Minnesota Freight Advisory Committee; Metropolitan Council; local governments; regional development commissions; and academia.
Some issues that differed among the various jurisdictions and agencies were:
• Mn/DOT, MFAC and local governments indicated a need for revision of truck size and weight limitations (increase local road load limits to ten tons).
• Mn/DOT’s Central Office and districts asked for more consideration of the effects of freight on the IRC system and roadways that affect the economic vitality of Minnesota.
• RDCs and MFAC thought the plan should recognize the importance of intermodal facilities.
• RDCs and MFAC thought that pipelines should be mentioned or identified in the plan.
• MFAC and academia had a common interest in national freight movement and border crossing issues.

Minnesota Statewide Freight Plan May 2005
Public Involvement 9-5
9.4 Summary of Comments
In general, comments were generally favorable and supportive. The majority of respondents emphasized the importance of considering freight more explicitly in transportation decisions and said the Minnesota Statewide Freight Plan:
• Acknowledges the important role the freight system plays toward enhancing our state’s economic competitiveness.
• Provides a comprehensive overview of the state’s freight system
• Establishes an agency-wide freight-oriented policy for Mn/DOT and six key policy directions for integrating freight consideration into overall department planning and investment decisions.


Minnesota Statewide Freight Plan May 2005
Next Steps 10-1
10.0 Next Steps
The Minnesota Statewide Freight Plan is a multimodal plan that identifies significant freight system trends, needs, and issues. The Plan presents a framework that includes recommended freight policies, strategies, and performance measures that will guide investment decision-making. The Plan will help guide follow-on actions for improving the freight transportation system and suggests appropriate roles for Mn/DOT and stakeholders.
Challenges to the efficiency and effectiveness of Minnesota’s freight transportation system can be addressed through the combined efforts of Mn/DOT and its public and private partners. The public sector’s role in constructing, operating, and maintaining the roadway system is critical for the truck freight system. The public sector also makes key investments, controls land uses, conducts regulatory activities, and initiates other activities that influence the performance of the non-highway freight modes. Public and private (shippers and carriers) sectors can work together to achieve a common vision for freight.
Future work will include development of an Action Plan, which includes prioritizing strategies and further developing performance measures and indicators, to provide direction for Mn/DOT’s freight planning activities. Work has begun on several Freight Plan strategies, for example, the Statewide Heavy Vehicle Safety Plan, a truck size and weight study, Met Council’s Regional Truck Model, and identification/development of data sources for freight performance indicators.


Minnesota Statewide Freight Plan May 2005
Acronyms A-1
Acronyms
AIP Airport Improvement Program ATP Area transportation partnership BTS Bureau of Transportation Statistics COFC Container on flat car CREATE Chicago Regional Environmental and Transportation Efficiency Project CSAH County state aid highway CVO Commercial Vehicle Operations DEED Minnesota Department of Employment and Economic Development FAF Freight Analysis Framework FHWA Federal Highway Administration FRA Federal Railroad Administration IRC Interregional corridor ISTEA Intermodal Surface Transportation Efficiency Act ITS Intelligent transportation systems JIT Just-in-time delivery LCV Long combination vehicles Mn/DOT Minnesota Department of Transportation MPO Metropolitan planning organization MRSI Minnesota Rail Service Improvement Program MSP Minneapolis-St. Paul International Airport NHS National Highway System NTN National Truck Network OFCVO Office of Freight and Commercial Vehicle Operations PCE Passenger car equivalent RTC Regional Trade Center STP Minnesota Statewide Transportation Plan TCMA Twin Cities Metropolitan Area TEA-21 Transportation Equity Act for the 21st Century TOFC Trailer on flat car USDOT United States Department of Transportation


Provide an integrated system of freight transportation in Minnesota – highway, rail,
water, air cargo, and intermodal terminals – that offers safe, reliable, and competitive access to statewide, national, and international markets.

Minnesota Department of Transportation Office of Freight and Commercial Vehicle Operations
May 2005
To view the electronic version of the 2005 Statewide Freight Plan, visit Mn/DOT’s Freight Plan website at: http://www.dot.state.mn.us/ofrw/statewide_plan.htm. If you would like to request a
print version, please contact John Tompkins at (651) 406-4808 or at [email protected].
Minnesota Department of Transportation Office of Freight and Commercial Vehicle Operations 1110 Centre Pointe Curve Mendota Heights, MN 55120