mobile and the path to purchase
TRANSCRIPT
For info about the proprietary technology used in comScore products, refer to http://comscore.com/About_comScore/Patents
Mobile and the Path to Purchase
Gian Fulgoni, Co-Founder & Chairman
comScore, Inc.
April 29, 2014
© comScore, Inc. Proprietary. 2
The Digital Omnivore
Mobile Search & Local Content
Consumers’ Path to Purchase
Key Takeaways
Topics for Today

© comScore, Inc. Proprietary. 3
PERSON-Centric Panel with
WEBSITE-Census Measurement
2 Million Person Panel
360°View of Person Behavior
Data sourced from comScore’s global panel of 2 million
Internet users
Web Visiting &
Search Behavior
Online Advertising Exposure
Demographics, Lifestyles & Attitudes
Media & Video Consumption
Transactions
Online & Offline
Buying
Mobile Internet Usage & Behavior
PANEL
Plus 5 Million TV Set Top Boxes for 3-Screen Measurement
CENSUS
Unified Digital Measurement™ (UDM)
Patent-Pending Methodology
1 Million Domains Participating Adopted by 90% of Top 100 U.S. Media Properties
PANEL
© comScore, Inc. Proprietary. © comScore, Inc. Proprietary. 4
Emergence of the Digital Omnivore
© comScore, Inc. Proprietary. 5
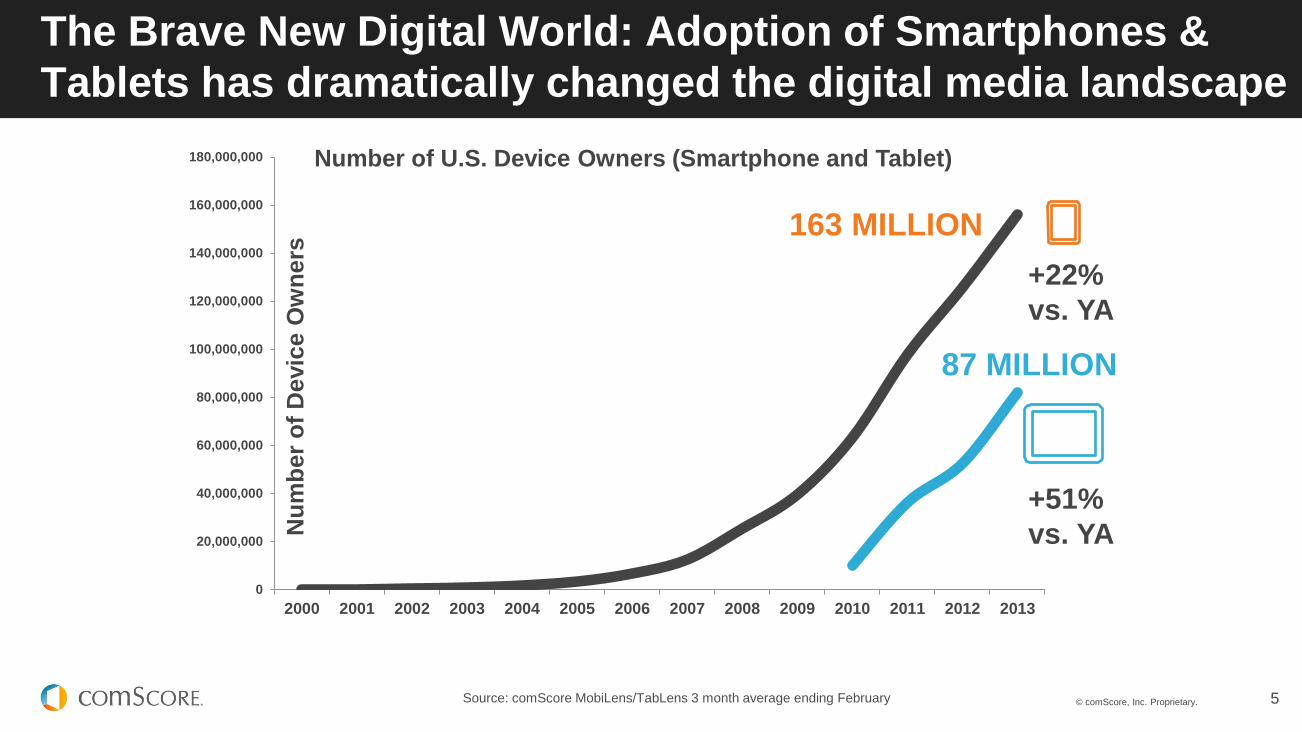
The Brave New Digital World: Adoption of Smartphones &
Tablets has dramatically changed the digital media landscape
0
20,000,000
40,000,000
60,000,000
80,000,000
100,000,000
120,000,000
140,000,000
160,000,000
180,000,000
2000 2001 2002 2003 2004 2005 2006 2007 2008 2009 2010 2011 2012 2013
Nu
mb
er
of
Devic
e O
wn
ers
Number of U.S. Device Owners (Smartphone and Tablet)
163 MILLION
+22%
vs. YA
87 MILLION
+51%
vs. YA
Source: comScore MobiLens/TabLens 3 month average ending February

© comScore, Inc. Proprietary. 6
Millennials have a substantially higher rate of smartphone
penetration than their older counterparts
U.S. Smartphone Penetration of Mobile Phones Within Age Group
comScore MobiLens, U.S., Age 18+, 3 Month Average Ending Nov-2013
81%
68%
40%
Age 18-34
Age 35-54
Age 55+

© comScore, Inc. Proprietary. 7
47%
42%
12%
Desktop
Smartphone
Tablet
The Post-Desktop era begins: More than half of all digital
media time now occurs on mobile platforms
Source: comScore Media Metrix Multi-Platform, December 2013

© comScore, Inc. Proprietary. 8
Millennials are heavier internet users across all devices and spend a full day of
every week online. Mobile engagement outpaces desktop in all age groups
Average Monthly Time Spent in Hours per User by Platform
comScore Media Metrix Multi-Platform, U.S., Age 18+, Nov-2013
96.0
87.0
58.9
49.1 43.6
35.2
65.9 57.2
42.9
Age 18-34 Age 35-54 Age 55+
Total Digital
Desktop
Mobile

© comScore, Inc. Proprietary. 9
Total digital media consumption has nearly doubled in the past three
years, led by massive growth in smartphone engagement
Source: comScore Media Metrix Multi-Platform, June 2013
Note: Jun-2010 Mobile is estimated based on earliest observed comScore smartphone engagement
data calibrated by number of smartphone users at that time
Total U.S. Internet Usage in Minutes (Billions) by Platform Desktop, Smartphone and Tablet
405 419
83
381
106
June 2010 June 2013
906
487
+4%
+86%
+359%
N/A
© comScore, Inc. Proprietary. 10
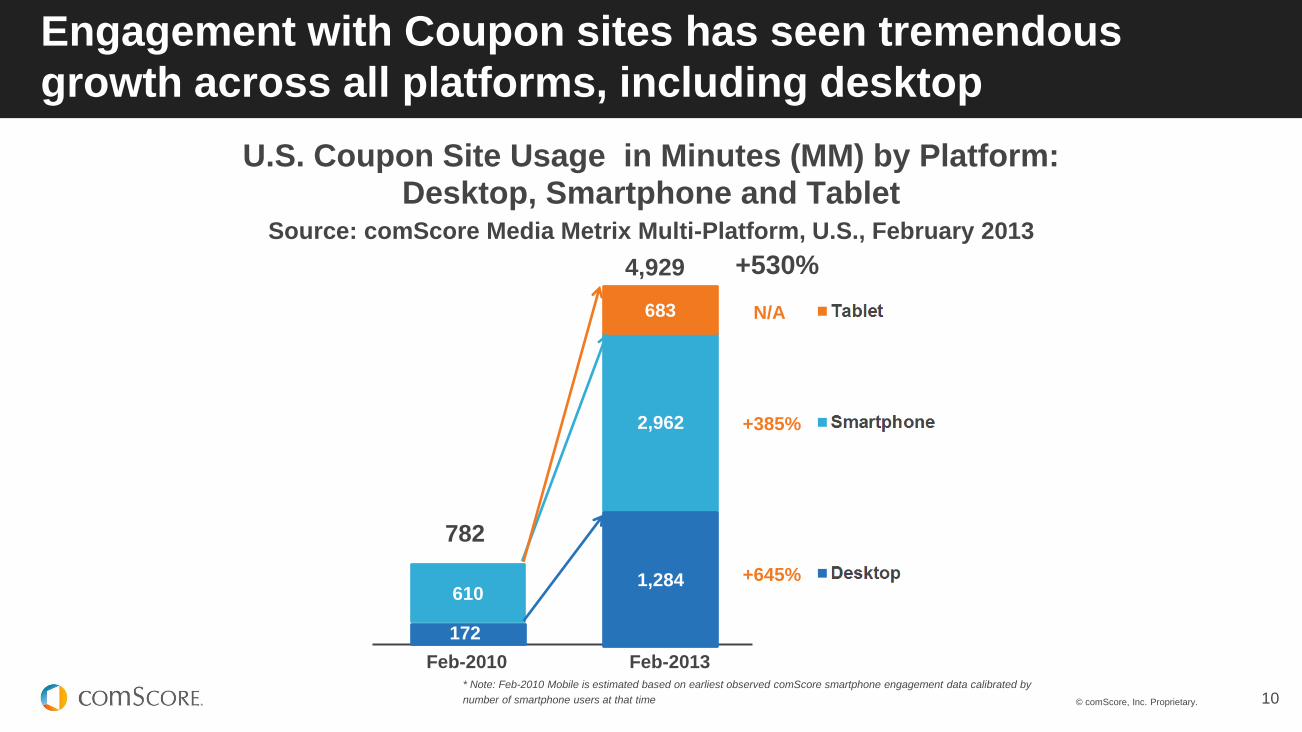
4,929 +530%
Engagement with Coupon sites has seen tremendous
growth across all platforms, including desktop
* Note: Feb-2010 Mobile is estimated based on earliest observed comScore smartphone engagement data calibrated by
number of smartphone users at that time
U.S. Coupon Site Usage in Minutes (MM) by Platform: Desktop, Smartphone and Tablet
Source: comScore Media Metrix Multi-Platform, U.S., February 2013
43
782
+385%
172
610
2,962
683
Feb-2010 Feb-2013
N/A
+645% 1,284
© comScore, Inc. Proprietary. 11
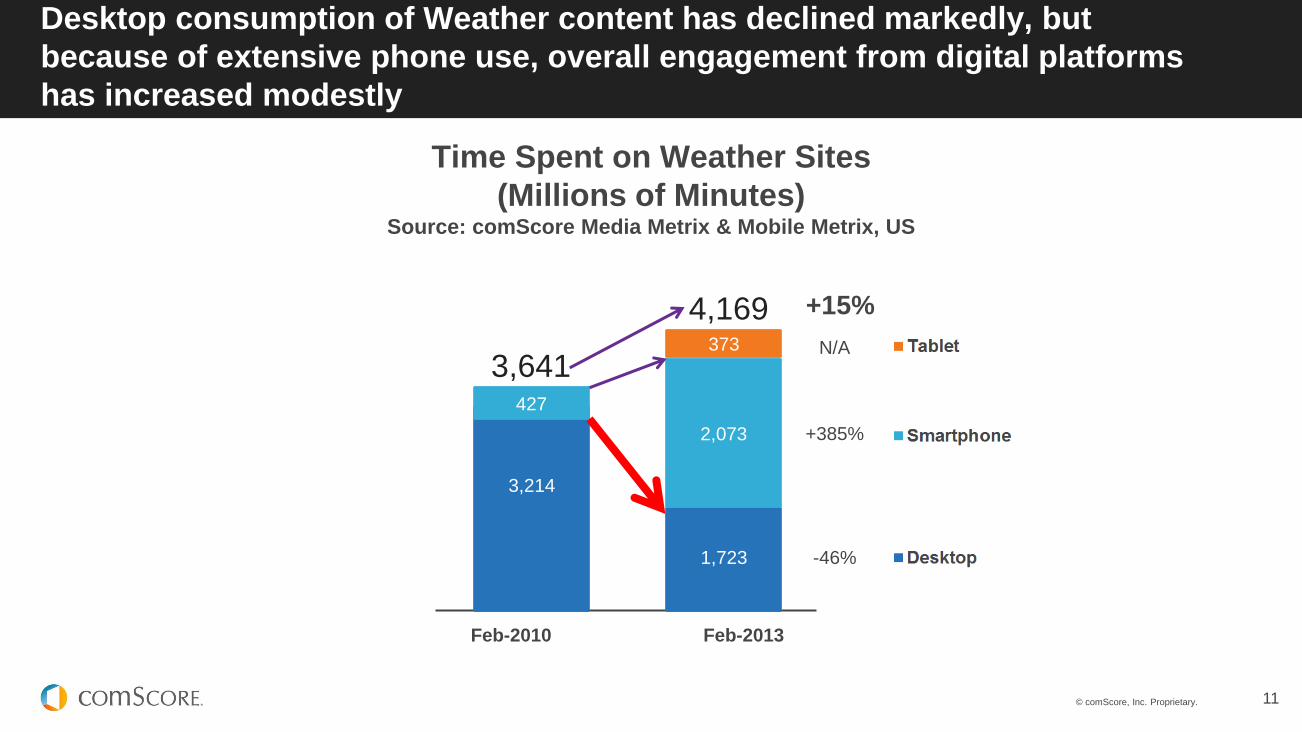
Desktop consumption of Weather content has declined markedly, but
because of extensive phone use, overall engagement from digital platforms
has increased modestly
Time Spent on Weather Sites
(Millions of Minutes) Source: comScore Media Metrix & Mobile Metrix, US
43
Feb-2010 Feb-2013
4,169
3,641
-46%
+15%
+385%
3,214
427
1,723
2,073
373 N/A

© comScore, Inc. Proprietary. 12
Maps have benefitted massively from phone usage but
desktop use has declined
Time Spent on Map Sites
(Millions of Minutes) Source: comScore Media Metrix & Mobile Metrix, US
43
5,811
2,303
-13%
+152%
+386%
1,406
897
1,217
4,355
239
Feb-2010 Feb-2013
N/A

© comScore, Inc. Proprietary. 13
The digital population now spends slightly more time engaging with
retail sites on their smartphone than on their desktop
Total Minutes (MM) Spent in Retail Category by Platform Source: comScore Media Metrix and Mobile Metrix, U.S., Feb-2013 – Dec-2013
0
5,000
10,000
15,000
20,000
25,000
30,000To
tal M
inu
tes (
MM
)
Desktop Smartphone Tablet
49% 40%
37% 43%
14% 17%
0%
10%
20%
30%
40%
50%
60%
70%
80%
90%
100%
Feb-2013 Dec-2013
Desktop
Smartphone
Tablet
© comScore, Inc. Proprietary. 14
37%
31%
74%
50%
100%
92%
99%
90%
61%
98%
63%
69%
26%
50%
0%
8%
1%
14%
39%
2%
Browser App
40%
44%
48%
45%
61%
49%
56%
59%
53%
51%
31%
26%
20%
15%
18%
14%
13%
9%
12%
10%
29%
30%
32%
40%
20%
37%
30%
31%
34%
38%
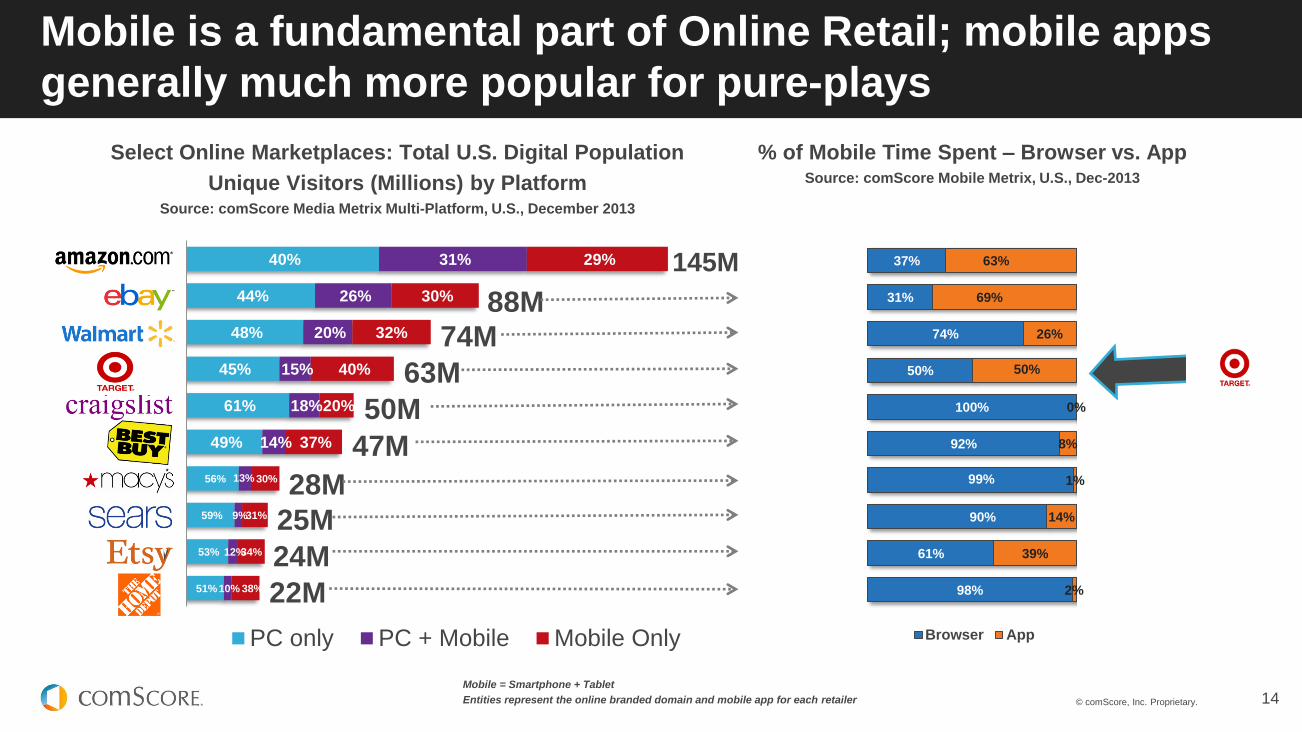
Amazon
eBay
Walmart
Target
Craigslist
BestBuy
Macy's
Sears
Etsy
Home Depot
PC only PC + Mobile Mobile Only
88M
145M
74M
63M
50M
47M
28M
25M
24M
22M
Mobile is a fundamental part of Online Retail; mobile apps
generally much more popular for pure-plays
Mobile = Smartphone + Tablet
Entities represent the online branded domain and mobile app for each retailer
Select Online Marketplaces: Total U.S. Digital Population
Unique Visitors (Millions) by Platform Source: comScore Media Metrix Multi-Platform, U.S., December 2013
% of Mobile Time Spent – Browser vs. App Source: comScore Mobile Metrix, U.S., Dec-2013
© comScore, Inc. Proprietary. 15
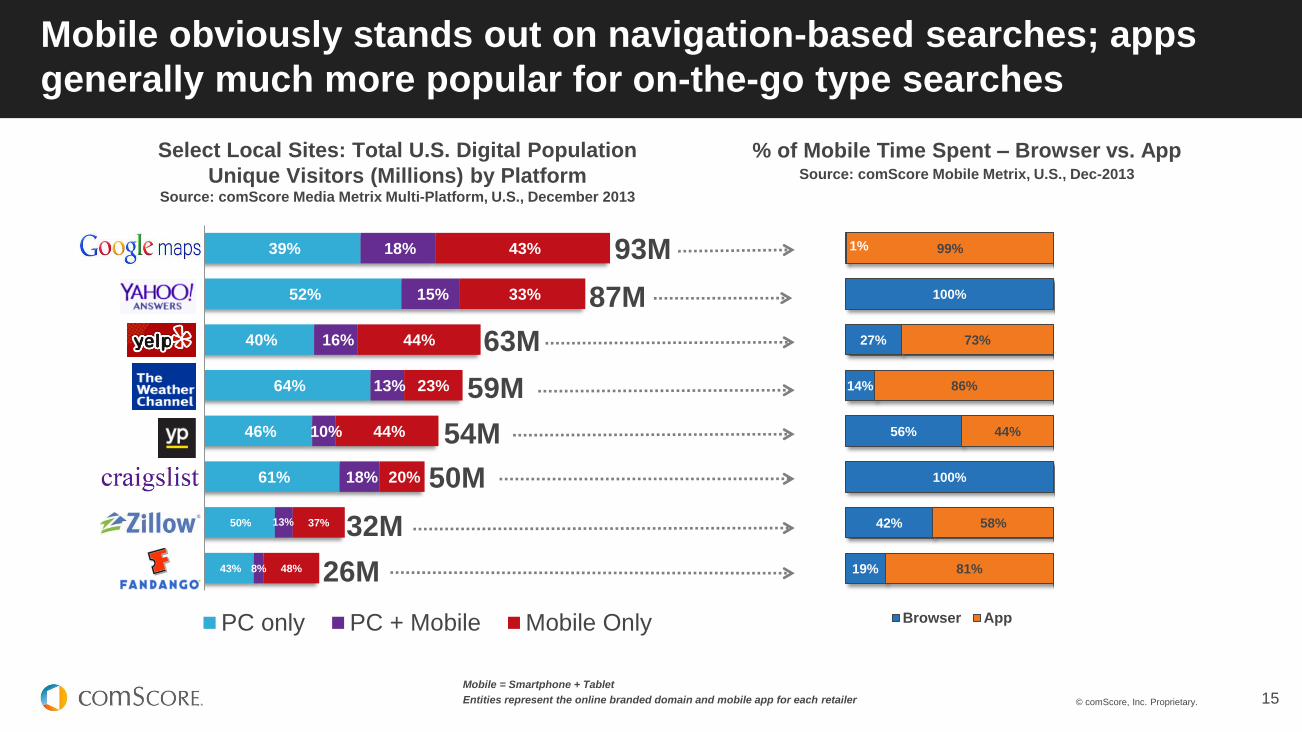
Mobile obviously stands out on navigation-based searches; apps
generally much more popular for on-the-go type searches
39%
52%
40%
64%
46%
61%
50%
43%
18%
15%
16%
13%
10%
18%
13%
8%
43%
33%
44%
23%
44%
20%
37%
48%
Google Maps
Yahoo Answers
YELP.COM
WEATHER
YP
CRAIGS
ZILLOW
Fandango
PC only PC + Mobile Mobile Only
93M
87M
63M
59M
54M
50M
32M
26M
Mobile = Smartphone + Tablet
Entities represent the online branded domain and mobile app for each retailer
1%
100%
27%
14%
56%
100%
42%
19%
99%
73%
86%
44%
58%
81%
Browser App
Select Local Sites: Total U.S. Digital Population
Unique Visitors (Millions) by Platform Source: comScore Media Metrix Multi-Platform, U.S., December 2013
% of Mobile Time Spent – Browser vs. App Source: comScore Mobile Metrix, U.S., Dec-2013

© comScore, Inc. Proprietary. © comScore, Inc. Proprietary. 16
Mobile Search & Local Content
© comScore, Inc. Proprietary. 17
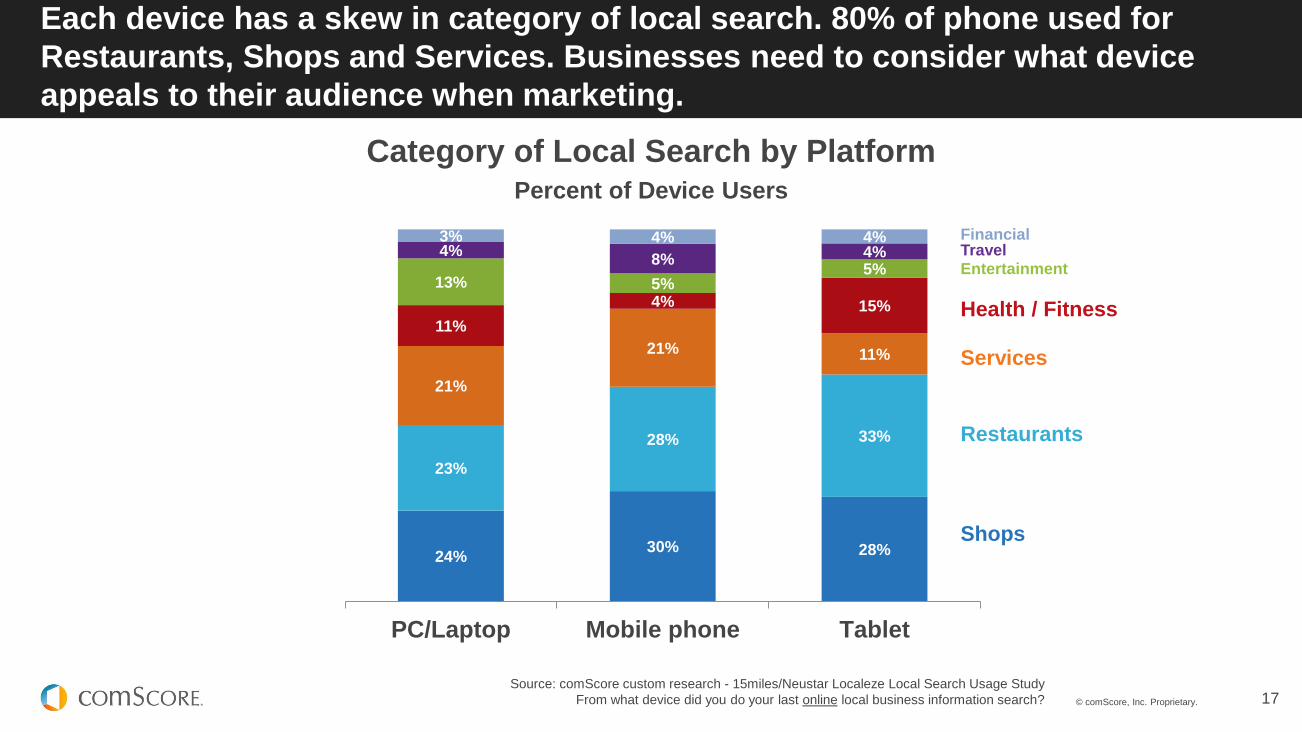
Each device has a skew in category of local search. 80% of phone used for
Restaurants, Shops and Services. Businesses need to consider what device
appeals to their audience when marketing.
Source: comScore custom research - 15miles/Neustar Localeze Local Search Usage Study
From what device did you do your last online local business information search?
Category of Local Search by Platform Percent of Device Users
24% 30% 28%
23%
28% 33%
21%
21% 11%
11%
4% 15%
13% 5% 5%
4% 8% 4%
3% 4% 4%
PC/Laptop Mobile phone Tablet
Restaurants
Shops
Services
Health / Fitness
Entertainment Travel Financial

© comScore, Inc. Proprietary. 18
Compared to other devices, mobile phones have the highest conversion rate.
Nearly 80% of mobile phone searches end in a purchase.
Source: comScore 15Miles Neustar // Localeze 7th annual Local Search Study
Did you make a purchase from the local business?
59%
78% 77%
61%
78%
64%
PC/Laptop MobilePhone
Tablet
2012
2013
% of Searches that Resulted in a Purchase Source: comScore custom research - 15miles/Neustar /Localeze Local Search Usage Study
© comScore, Inc. Proprietary. 19
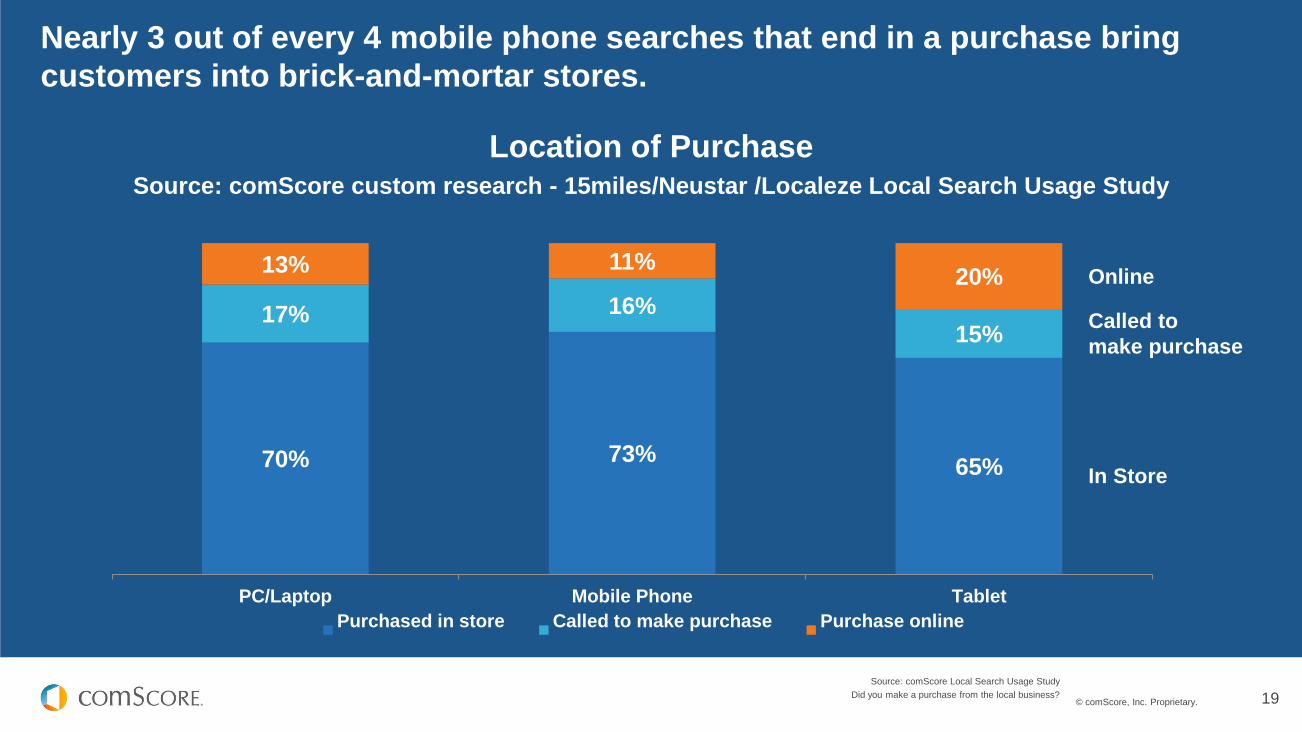
70% 73% 65%
17% 16%
15%
13% 11% 20%
PC/Laptop Mobile Phone Tablet
Purchased in store Called to make purchase Purchase online
Nearly 3 out of every 4 mobile phone searches that end in a purchase bring
customers into brick-and-mortar stores.
Location of Purchase Source: comScore custom research - 15miles/Neustar /Localeze Local Search Usage Study
Source: comScore Local Search Usage Study
Did you make a purchase from the local business?
Online
Called to
make purchase
In Store
© comScore, Inc. Proprietary. 20
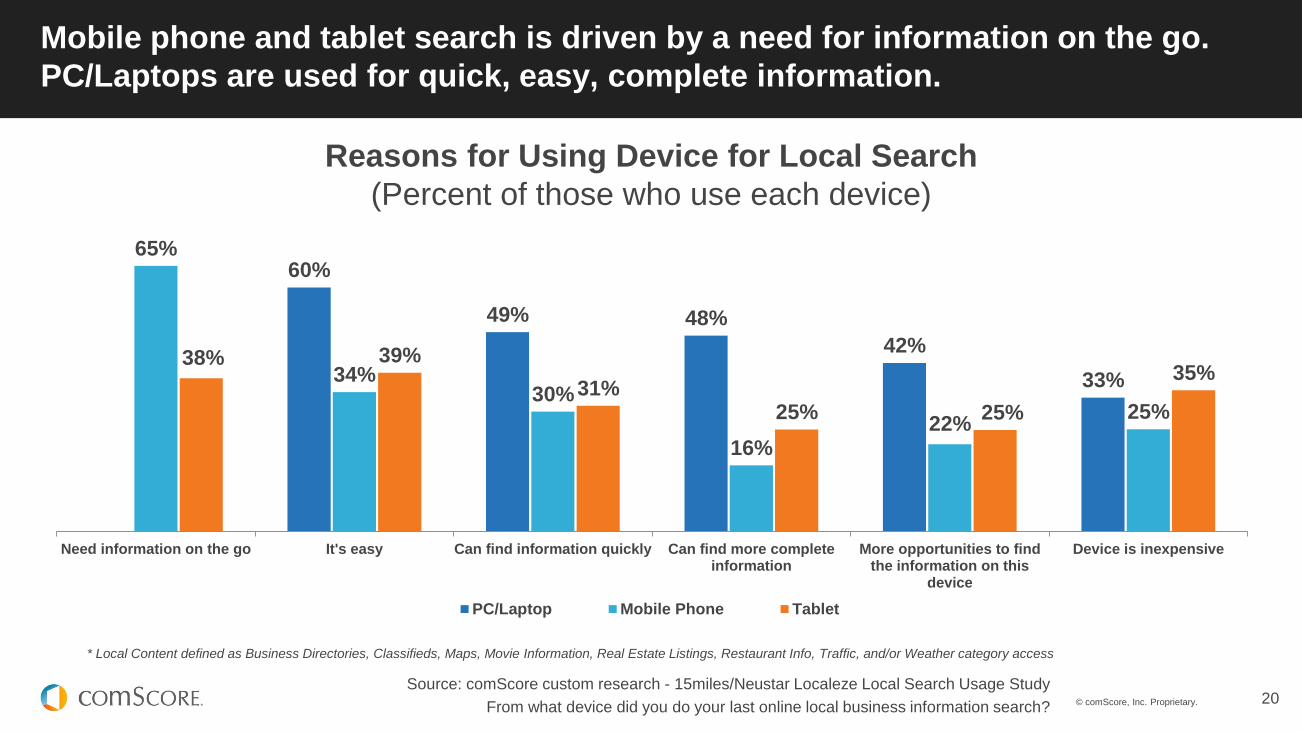
60%
49% 48%
42%
33%
65%
34% 30%
16% 22%
25%
38% 39%
31% 25% 25%
35%
Need information on the go It's easy Can find information quickly Can find more completeinformation
More opportunities to findthe information on this
device
Device is inexpensive
PC/Laptop Mobile Phone Tablet
Mobile phone and tablet search is driven by a need for information on the go.
PC/Laptops are used for quick, easy, complete information.
Source: comScore custom research - 15miles/Neustar Localeze Local Search Usage Study
From what device did you do your last online local business information search?
Reasons for Using Device for Local Search
(Percent of those who use each device)
* Local Content defined as Business Directories, Classifieds, Maps, Movie Information, Real Estate Listings, Restaurant Info, Traffic, and/or Weather category access

© comScore, Inc. Proprietary. 21 Access methods include Browser, Application and SMS
Source: comScore MobiLens U.S, December 2010 - 2013
Local Content Access on Mobile Phones
(Millions of People)
61.4 69.8
20.1
104.0
52.6 45.5
29.0
Any Access Method
85.7
74.5
16.0 13.7 10.5
Browser
50.7 44.2
31.5
Application SMS
54.4
+92%
+95%
+140%
+98%
Dec-13
Dec-12
Dec-11
Dec-10
Access to local content on mobile phones has grown
significantly, with apps seeing the greatest increase.
*Local content defined as searching for information on maps, movies, business directories or restaurants.

© comScore, Inc. Proprietary. 22 Access methods include Browser, Application and SMS
Source: comScore MobiLens U.S, December 2012 - 2013
Every subset of local content saw strong growth over the last year, as
more mobile phone users consumed more types of content.
Mobile Audience Size and Growth
Local Content Categories
(Millions)
+34% +23%
+21%
+38% +25%
+29% +24%
+22%
Real Estate
26 19
+24%
135
Job Listings
30 25
Business
Directories
34 28
Traffic
43
31
Classifieds
44
35
Restaurant
Info.
52
40
Movie Info.
54
44
Maps
89
72
Weather
118
96
Total Local
Content
113
+20%
Dec-13 Dec-12
Au
die
nce
(M
M)
People are using a wider
variety of Local Content,
with subcategory growth
outpacing the total segment.
* Local Content defined as Business Directories, Classifieds, Maps, Movie Information, Real Estate Listings, Restaurant Info, Traffic, and/or Weather category access

© comScore, Inc. Proprietary. 23
Heavy local content users on mobile skew male, more affluent (48%
report income of $75+), and younger (42% aged 18-34).
Access methods include Browser, Application and SMS
Source: comScore MobiLens U.S, December
49% 54%
51% 46%
Total Mobile Heavy LocalSearchers
Females
Males
7% 5%
13% 17%
17%
25%
17%
21% 18%
16% 15%
10% 15%
6%
Total Mobile Heavy LocalSearchers
65+
55-64
45-54
35-44
25-34
18-24
13-17
17% 13%
22%
20%
20%
20%
14%
16%
27% 32%
Total Mobile Heavy LocalSearchers
$100k+
$75k to <$100k
$50k to <$75k
$25k to <$50k
<$25k
*Heavy user defined as mobile user who reported accessing content “almost every day”
** Local Content defined as Business Directories, Classifieds, Maps, Real Estate Listings, Job Listings, Restaurant Info, Traffic, and/or Weather category access
© comScore, Inc. Proprietary. 24
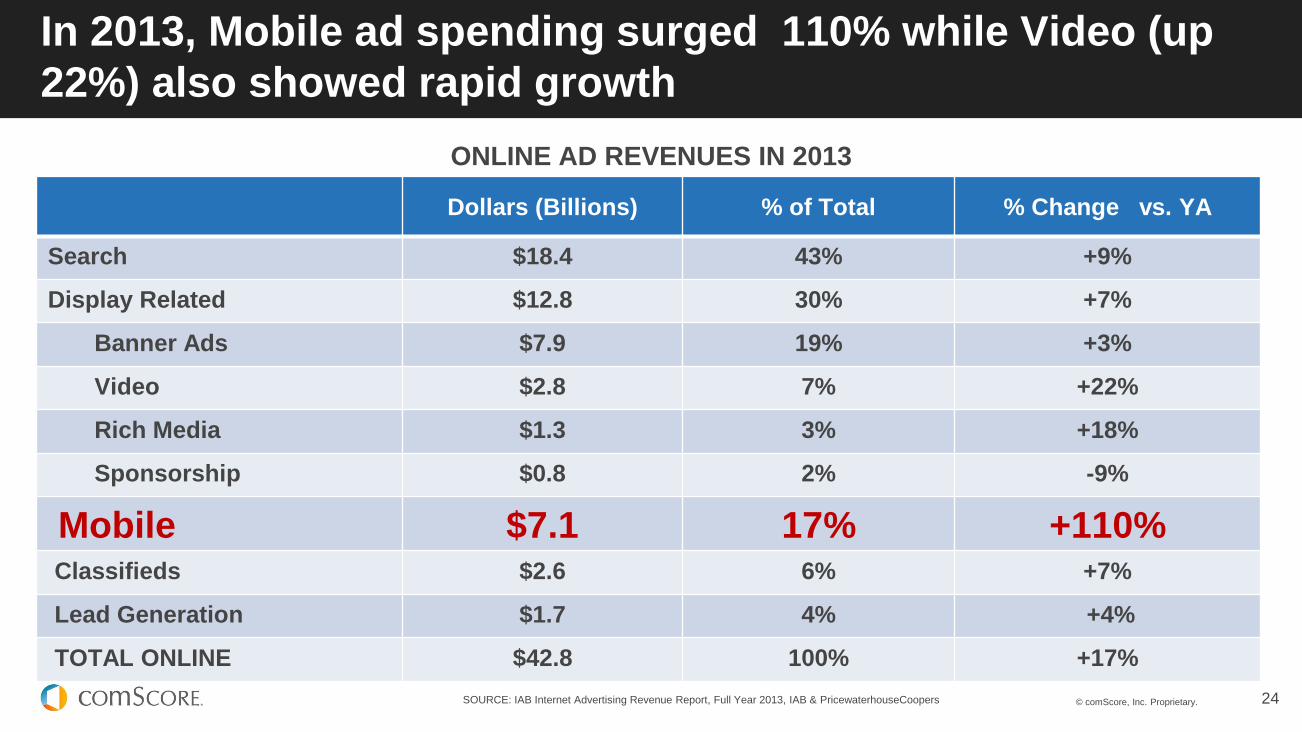
In 2013, Mobile ad spending surged 110% while Video (up
22%) also showed rapid growth
SOURCE: IAB Internet Advertising Revenue Report, Full Year 2013, IAB & PricewaterhouseCoopers
ONLINE AD REVENUES IN 2013
Dollars (Billions) % of Total % Change vs. YA
Search $18.4 43% +9%
Display Related $12.8 30% +7%
Banner Ads $7.9 19% +3%
Video $2.8 7% +22%
Rich Media $1.3 3% +18%
Sponsorship $0.8 2% -9%
Mobile $7.1 17% +110% Classifieds $2.6 6% +7%
Lead Generation $1.7 4% +4%
TOTAL ONLINE $42.8 100% +17%
© comScore, Inc. Proprietary. © comScore, Inc. Proprietary. 25
Consumers’ Multi-Media Path to Purchase
© comScore, Inc. Proprietary. 26
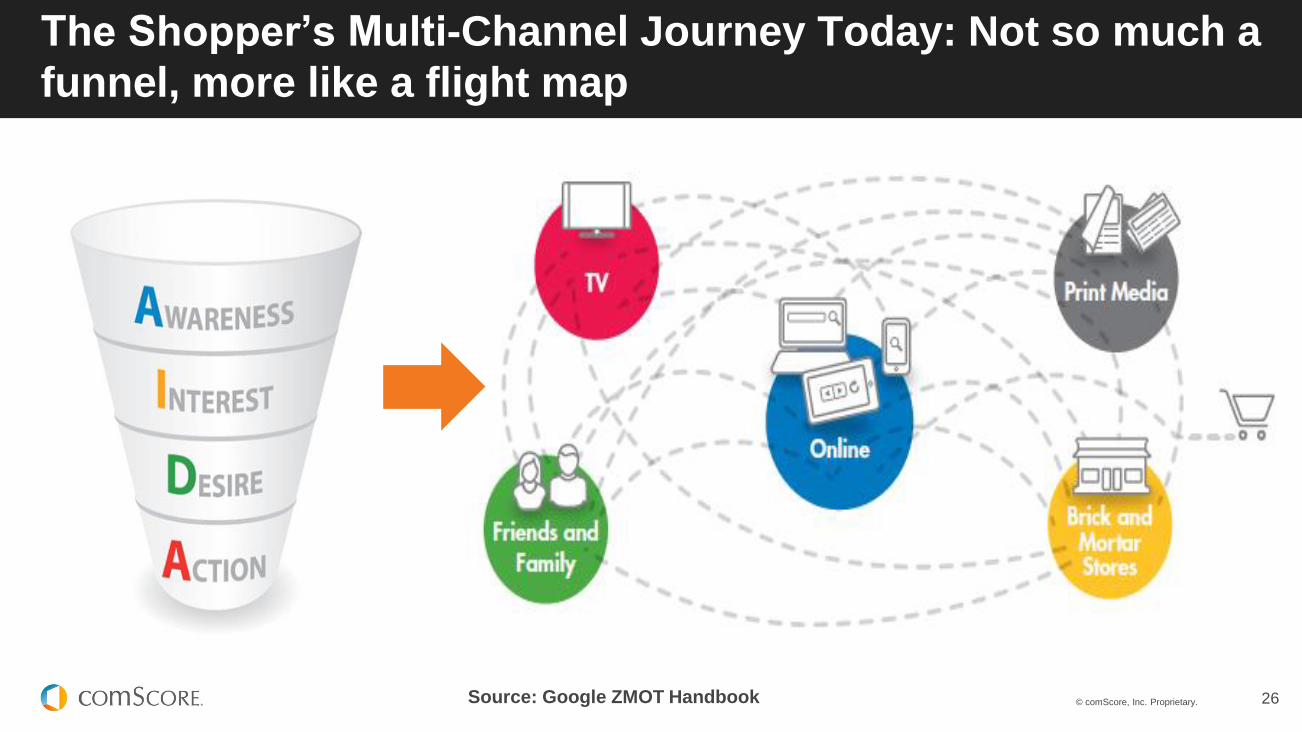
The Shopper’s Multi-Channel Journey Today: Not so much a
funnel, more like a flight map
Source: Google ZMOT Handbook
© comScore, Inc. Proprietary. 27
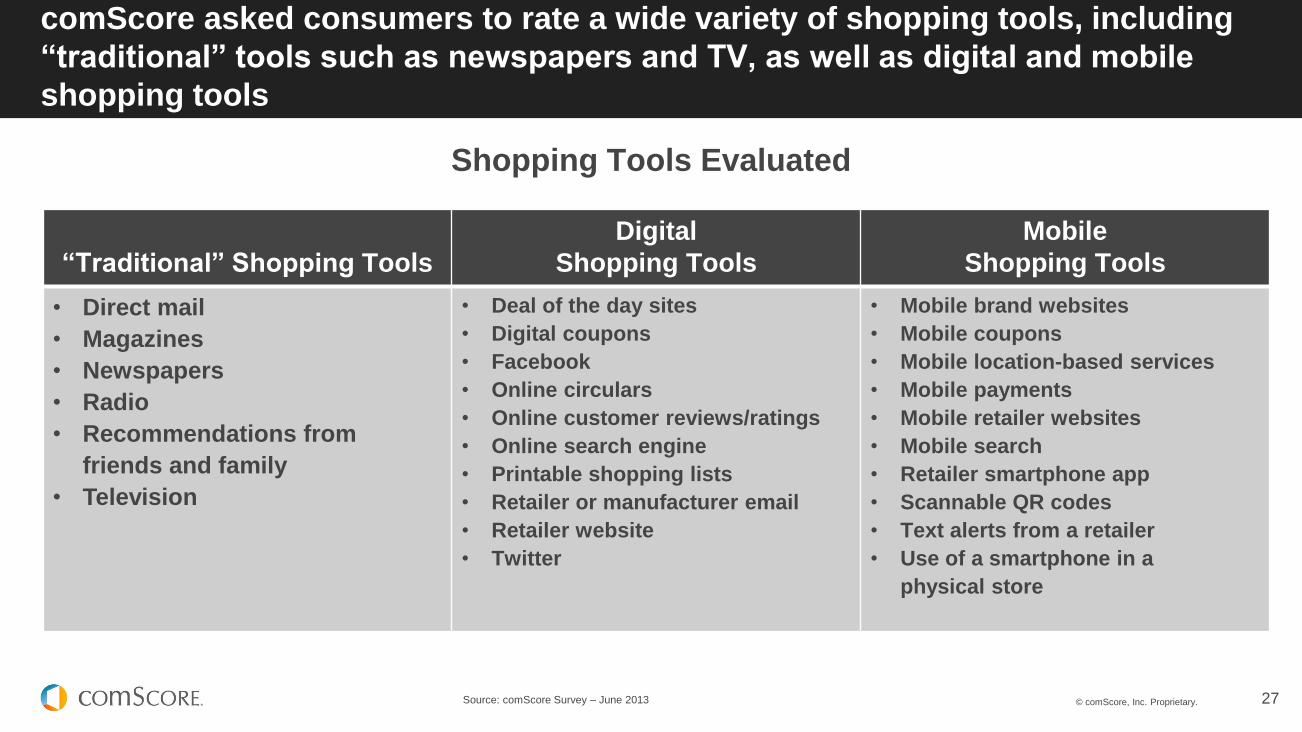
comScore asked consumers to rate a wide variety of shopping tools, including
“traditional” tools such as newspapers and TV, as well as digital and mobile
shopping tools
Source: comScore Survey – June 2013
Shopping Tools Evaluated
“Traditional” Shopping Tools
Digital
Shopping Tools
Mobile
Shopping Tools
• Direct mail
• Magazines
• Newspapers
• Radio
• Recommendations from
friends and family
• Television
• Deal of the day sites
• Digital coupons
• Online circulars
• Online customer reviews/ratings
• Online search engine
• Printable shopping lists
• Retailer or manufacturer email
• Retailer website
• Mobile brand websites
• Mobile coupons
• Mobile location-based services
• Mobile payments
• Mobile retailer websites
• Mobile search
• Retailer smartphone app
• Scannable QR codes
• Text alerts from a retailer
• Use of a smartphone in a
physical store
© comScore, Inc. Proprietary. 28
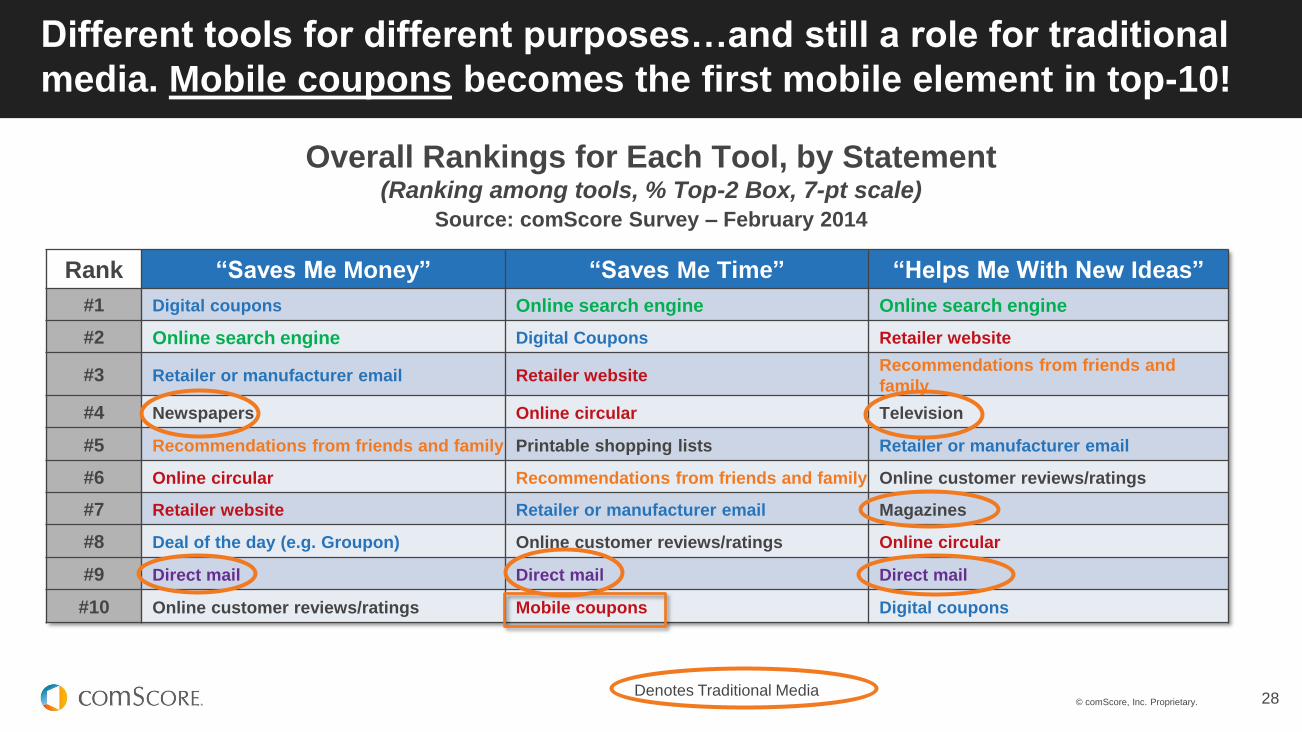
Different tools for different purposes…and still a role for traditional
media. Mobile coupons becomes the first mobile element in top-10!
Overall Rankings for Each Tool, by Statement (Ranking among tools, % Top-2 Box, 7-pt scale)
Source: comScore Survey – February 2014
Rank “Saves Me Money” “Saves Me Time” “Helps Me With New Ideas”
#1 Digital coupons Online search engine Online search engine
#2 Online search engine Digital Coupons Retailer website
#3 Retailer or manufacturer email Retailer website Recommendations from friends and
family
#4 Newspapers Online circular Television
#5 Recommendations from friends and family Printable shopping lists Retailer or manufacturer email
#6 Online circular Recommendations from friends and family Online customer reviews/ratings
#7 Retailer website Retailer or manufacturer email Magazines
#8 Deal of the day (e.g. Groupon) Online customer reviews/ratings Online circular
#9 Direct mail Direct mail Direct mail
#10 Online customer reviews/ratings Mobile coupons Digital coupons
Denotes Traditional Media

© comScore, Inc. Proprietary. 29
Mobile Search Moves up in the Rankings But Has Yet to
Crack Top Ten
Top 2 Box Ranking for Importance of Mobile Search
2013 2014
Saves Me Money #17 #16
Saves Me Time #16 #14
Helps With New Ideas #21 #16
© comScore, Inc. Proprietary. 30 SOURCE: comScore Media Metrix Multi-Platform, US, Dec-2013
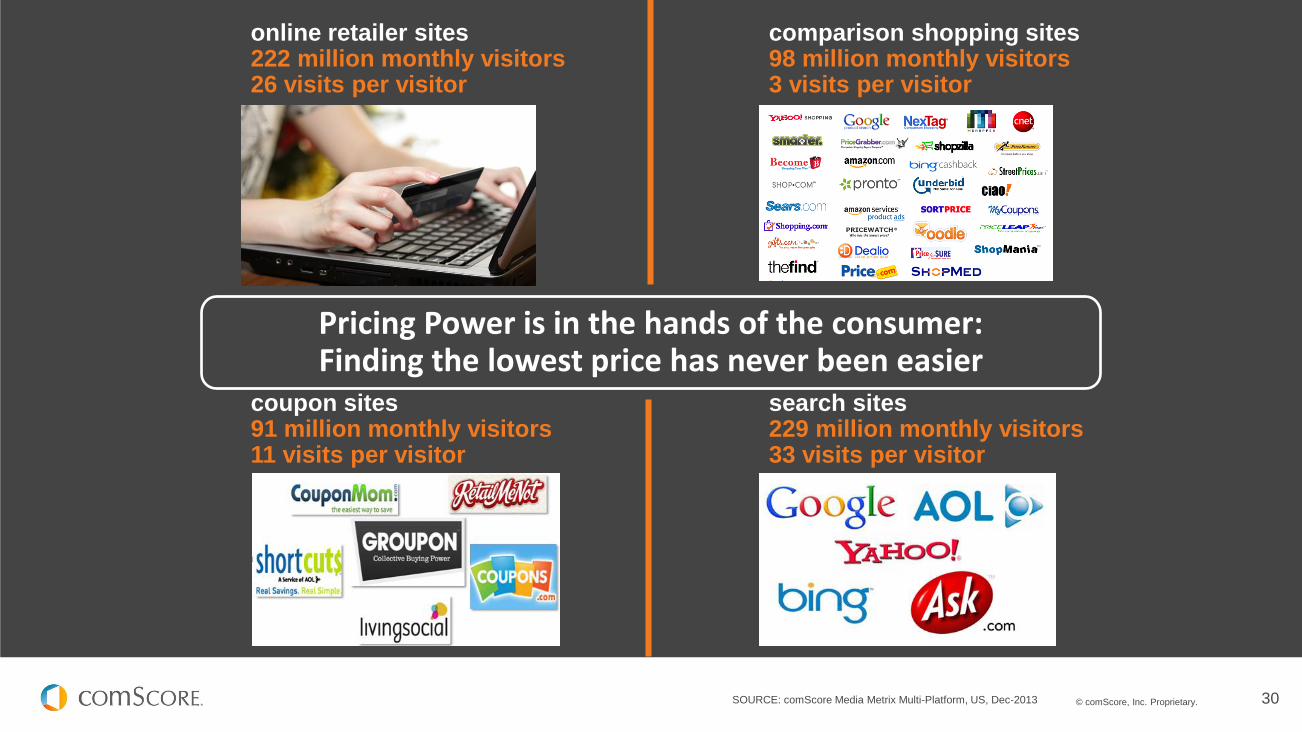
online retailer sites 222 million monthly visitors 26 visits per visitor
comparison shopping sites 98 million monthly visitors 3 visits per visitor
search sites 229 million monthly visitors 33 visits per visitor
coupon sites 91 million monthly visitors 11 visits per visitor
Pricing Power is in the hands of the consumer: Finding the lowest price has never been easier

© comScore, Inc. Proprietary. 31
More than 1 in 3 online
consumers have
showroomed…
However, among these
consumers, most only
showroom ‘sometimes’ or
‘occasionally’
Among smartphone owners,
usage of phones to
showroom has increased
significantly
For most consumers, showrooming remains an ‘occasional’
shopping tactic
Source: comScore Survey – July 2013
34%
% who have ever showroomed
Q. Based on this definition, have you ever done this activity? (seen
an item in-store but instead purchased online) Q. When thinking of your online shopping and the previous
questions, which statement best describes when you use
showrooming?
Q. Have you ever used your mobile device (smartphone / tablet) to
assist in showrooming?
41% 49%
% smartphone owners who have used theirphone to showroom
Q2 2013 Q3 2013
11%
76%
11% Only for majorpurchases
Sometimes /Occasionally
Often
11%
% among showroomers
© comScore, Inc. Proprietary. 32
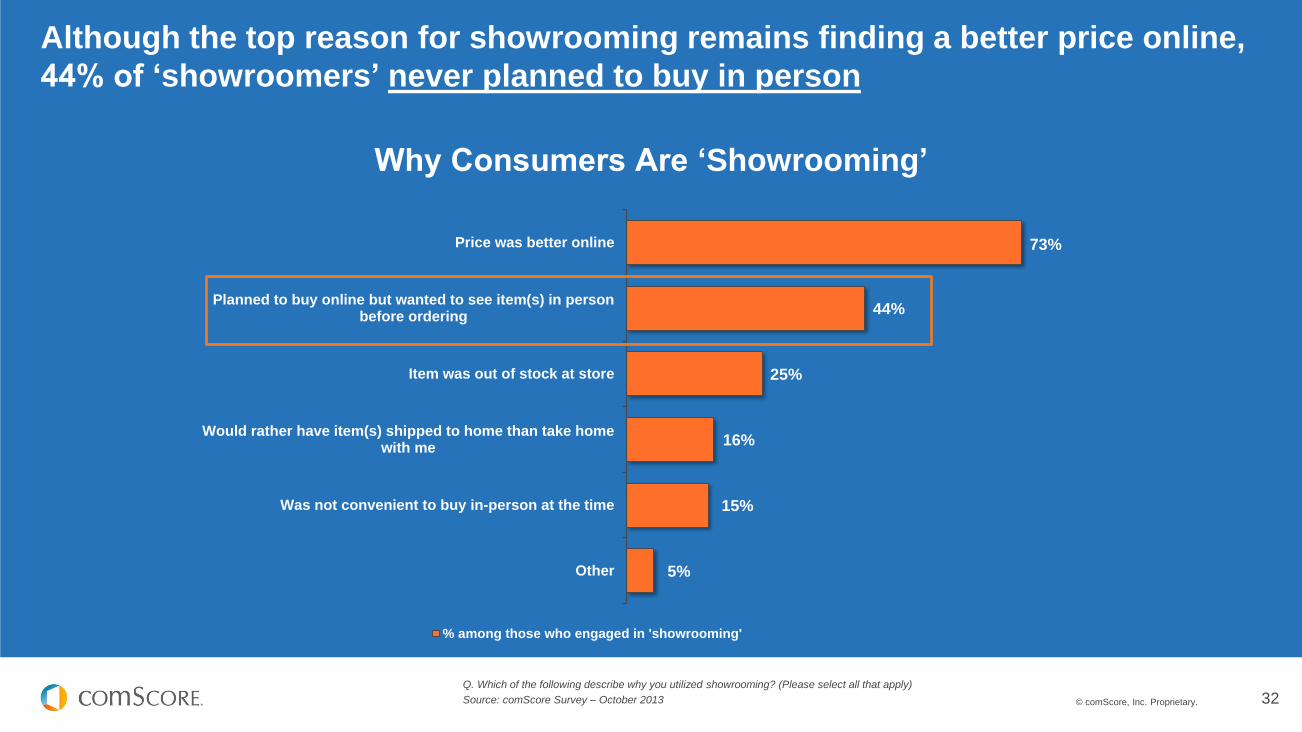
Why Consumers Are ‘Showrooming’
Although the top reason for showrooming remains finding a better price online,
44% of ‘showroomers’ never planned to buy in person
Q. Which of the following describe why you utilized showrooming? (Please select all that apply)
Source: comScore Survey – October 2013
73%
44%
25%
16%
15%
5%
Price was better online
Planned to buy online but wanted to see item(s) in personbefore ordering
Item was out of stock at store
Would rather have item(s) shipped to home than take homewith me
Was not convenient to buy in-person at the time
Other
% among those who engaged in 'showrooming'

© comScore, Inc. Proprietary. 33
$42 $53 $67 $82 $102
$123 $130 $130 $142 $162
$186 $211
$30 $40
$51 $61
$69
$77 $84 $80
$85
$94
$103
$111
2002 2003 2004 2005 2006 2007 2008 2009 2010 2011 2012 2013
Retail Travel
Desktop e-Commerce Dollar Sales ($ Billions) Source: comScore e-Commerce Measurement
U.S. Desktop e-Commerce (retail + travel) reached $322 billion in 2013, up +11%
Y/Y overall and +13% Y/Y for Retail
$72 $93
$117 $143
$171
$200 $214 $209
$228
$289
$256
$322
Bil
lio
ns (
$)
+29%
+26%
+22%
+19%
+17%
+7%
-2%
+9%
+12%
+13%
+26%
+33%
+26%
+28%
+20%
+24% +24%
+13%
+20%
+12%
+6%
+9%
0%
-5%
+10%
+6%
+15%
+9%
+14%
+11%
+11%
+13%
+8%
© comScore, Inc. Proprietary. 34
$0.6 $0.8
$1.6
$2.4 $2.6
$3.5
$4.9 $4.5
$3.8
$4.6
$7.2
$5.9
$4.7
$5.8
$8.3
Q22010
Q32010
Q42010
Q12011
Q22011
Q32011
Q42011
Q12012
Q22012
Q32012
Q42012
Q12013
Q22013
Q32013
Q42013
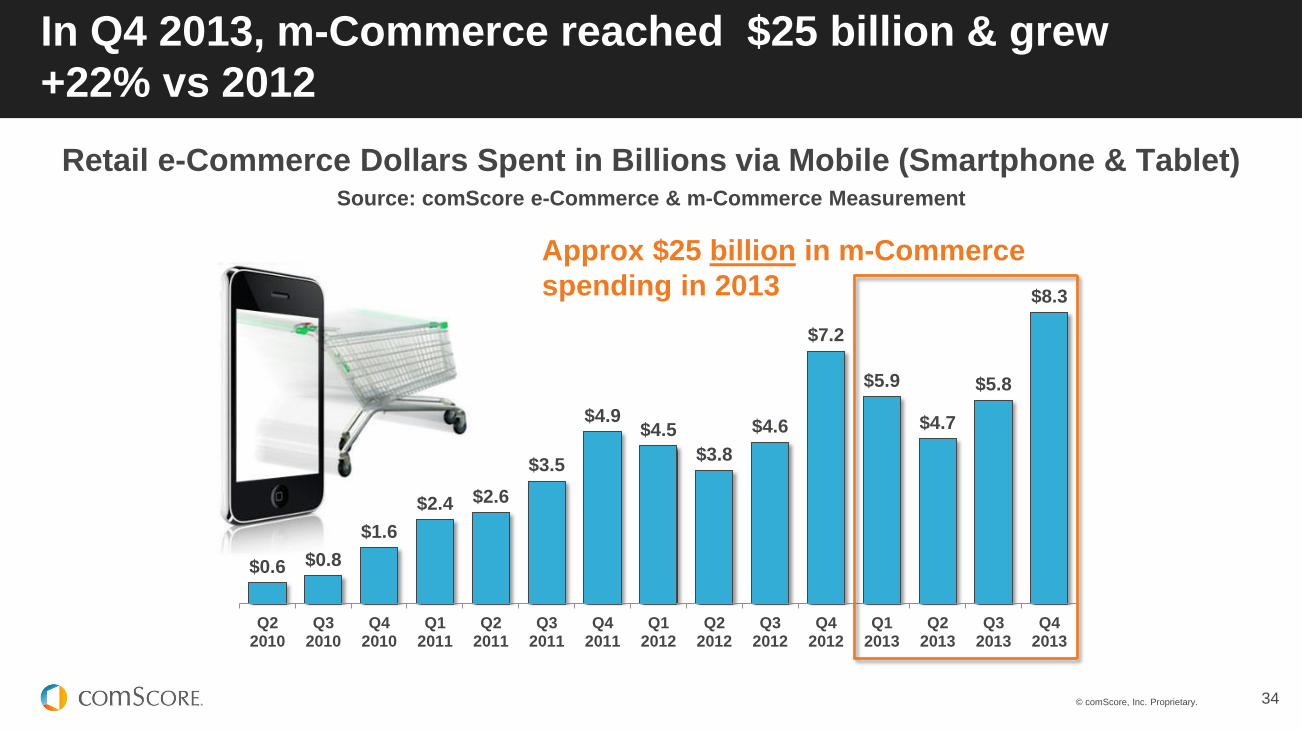
In Q4 2013, m-Commerce reached $25 billion & grew
+22% vs 2012
Retail e-Commerce Dollars Spent in Billions via Mobile (Smartphone & Tablet) Source: comScore e-Commerce & m-Commerce Measurement
Approx $25 billion in m-Commerce
spending in 2013
© comScore, Inc. Proprietary. 35
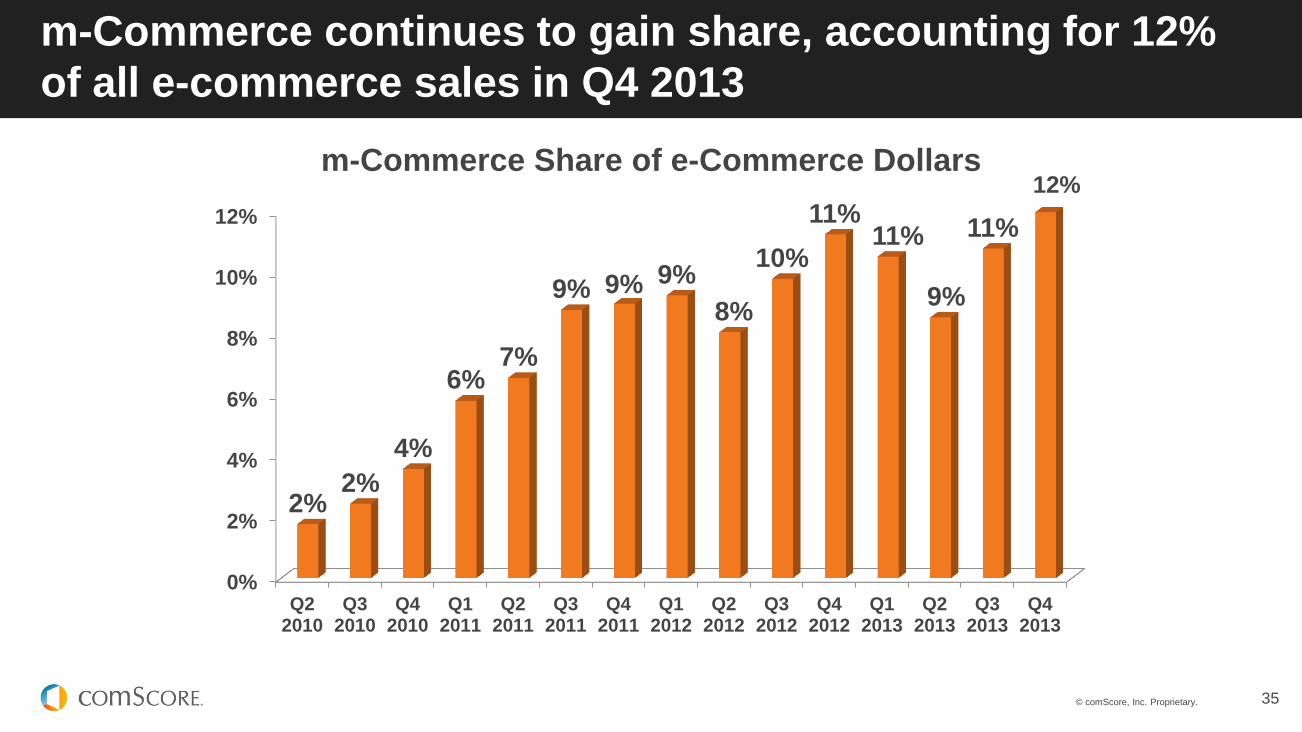
m-Commerce continues to gain share, accounting for 12%
of all e-commerce sales in Q4 2013
m-Commerce Share of e-Commerce Dollars
0%
2%
4%
6%
8%
10%
12%
Q22010
Q32010
Q42010
Q12011
Q22011
Q32011
Q42011
Q12012
Q22012
Q32012
Q42012
Q12013
Q22013
Q32013
Q42013
2% 2%
4%
6% 7%
9% 9% 9%
8%
10%
11% 11%
9%
11%
12%

© comScore, Inc. Proprietary. 36
Desktop users have the highest likelihood of purchase, followed by
tablets, then smartphones – bigger screen, higher conversion
Q4 2013 Buyer Penetration by Platform Source: comScore e-Commerce & m-Commerce Measurement
79%
42%
25%
0%
10%
20%
30%
40%
50%
60%
70%
80%
90%
Desktop Tablet Smartphone
© comScore, Inc. Proprietary. 37
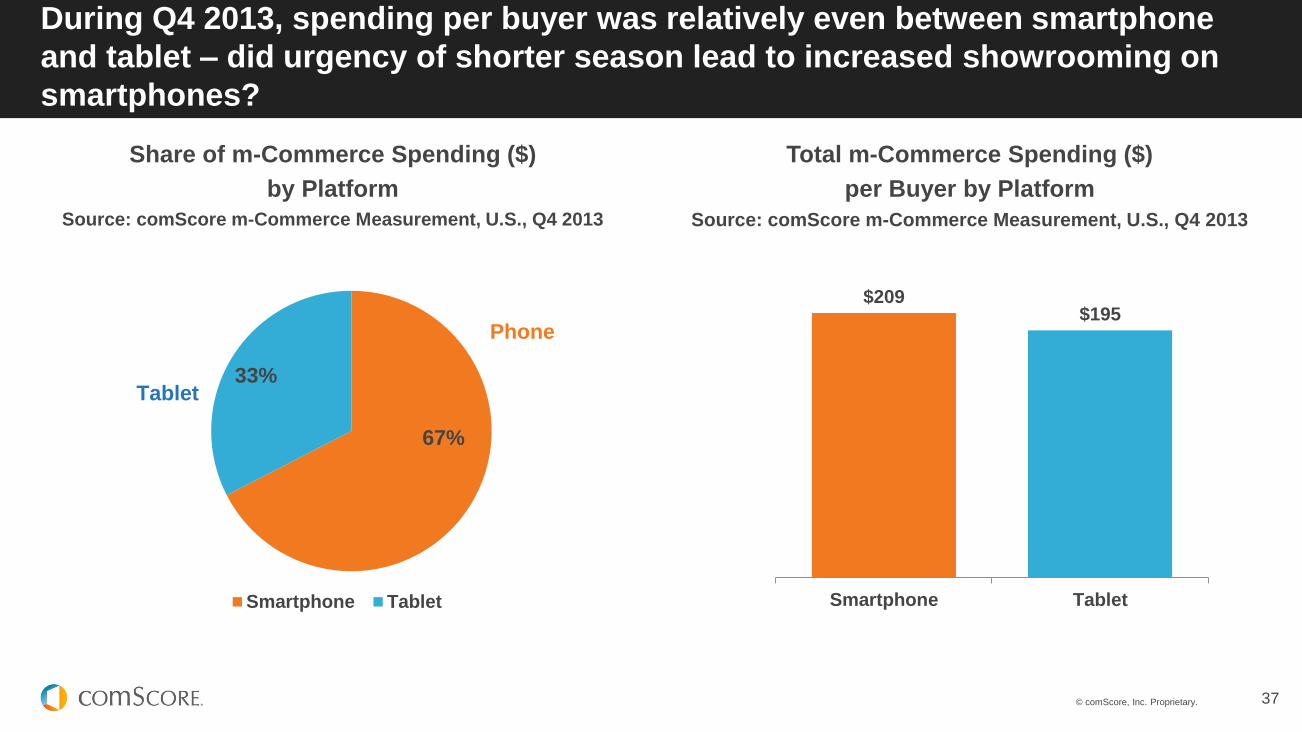
67%
33%
Smartphone Tablet
Tablet
Phone
Total m-Commerce Spending ($)
per Buyer by Platform
Source: comScore m-Commerce Measurement, U.S., Q4 2013
Share of m-Commerce Spending ($)
by Platform
Source: comScore m-Commerce Measurement, U.S., Q4 2013
During Q4 2013, spending per buyer was relatively even between smartphone
and tablet – did urgency of shorter season lead to increased showrooming on
smartphones?
$209 $195
Smartphone Tablet

© comScore, Inc. Proprietary. 38
m-Commerce buying can see significant variation across product
categories, with digital content & tickets skewing mobile
Q4 2013 Share of Product Category Digital Commerce
Dollar Spending by Platform for Selected Categories Source: comScore e-Commerce & m-Commerce Measurement
88%
96%
93%
90%
85%
78%
71%
8%
3%
4%
6%
11%
15%
22%
4%
1%
3%
3%
5%
7%
6%
60% 65% 70% 75% 80% 85% 90% 95% 100%
Total Digital Commerce
Computer Hardware
Consumer Electronics
Apparel & Accessories
Books & Magazines
Digital Content & Subscriptions
Event Tickets
% Desktop % Smartphone % Tablet
© comScore, Inc. Proprietary. 39
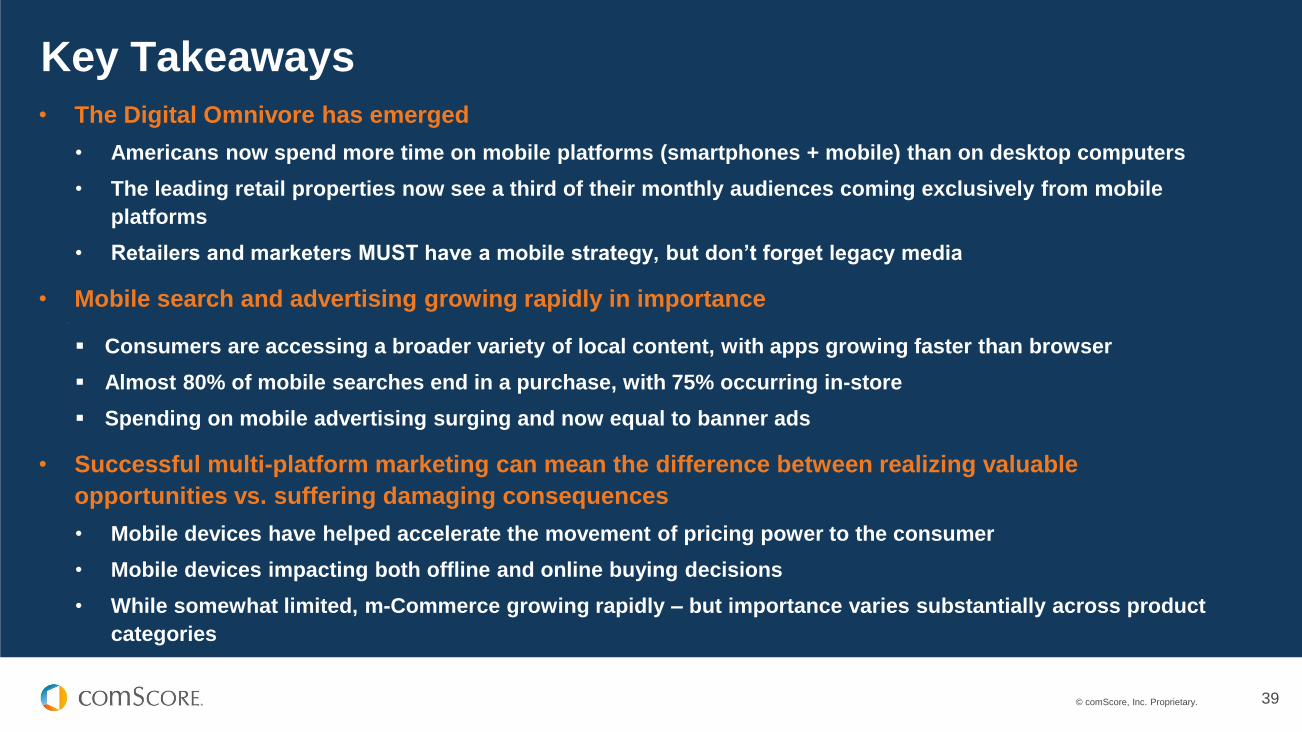
Key Takeaways
• The Digital Omnivore has emerged
• Americans now spend more time on mobile platforms (smartphones + mobile) than on desktop computers
• The leading retail properties now see a third of their monthly audiences coming exclusively from mobile
platforms
• Retailers and marketers MUST have a mobile strategy, but don’t forget legacy media
• Mobile search and advertising growing rapidly in importance 75
Consumers are accessing a broader variety of local content, with apps growing faster than browser
Almost 80% of mobile searches end in a purchase, with 75% occurring in-store
Spending on mobile advertising surging and now equal to banner ads
• Successful multi-platform marketing can mean the difference between realizing valuable
opportunities vs. suffering damaging consequences
• Mobile devices have helped accelerate the movement of pricing power to the consumer
• Mobile devices impacting both offline and online buying decisions
• While somewhat limited, m-Commerce growing rapidly – but importance varies substantially across product
categories
For info about the proprietary technology used in comScore products, refer to http://comscore.com/About_comScore/Patents
Thank you!
For copy of slides, please email: