mobile in numbers
TRANSCRIPT

FREDERIK DE BOSSCHEREStrategist, In The Pocket
#SoMITP
STATE OF MOBILE IN NUMBERS
“CURB YOUR ENTHUSIASM”—

“NUMBERS ARE COMING”—

#SoMITP
Methodology
• Representative set of apps by ITP.
(n = 1.2 mio. app users, 1.7 mio. app downloads, …)
• Field survey.
(n = 160, representative spread across gender / age groups)
• Other research materials.
(Flurry, comScore, …)
#SoMITP
Topics
• Mobile platforms
• Mobile usage
• Industries: retail, media, banking
• Tech: wearables
• In conclusion

STATE OF MOBILE PLATFORMS

In The Pocket
“PLATFORM WARS”—

#SoMITP
THE
STAT
E O
F M
OB
ILE
PLAT
FOR
MS
iOS users are more engaged with apps.
iOS users open an app 1.27 times more often than that same app on Android. But an app session on Android lasts 1.55 times longer.
Sources: Usage statistics of selection of In The Pocket apps for Q3 2015, representing over 1.3 mio users.U.S. Smartphone Subscriber Market Share, July 2015 , comScore
Share of engagement in popular apps (BE)
Compared to the international OS market share?
Android
iOS
Windows
Others
59% 41%
51,4% 44,2%
2,9%
1,4%
48
Internationally?
#SoMITP
New OS features or functionality can be leveraged more quickly on iOS.
Sources: Sampled from 92.874 - 226.674 users of HLN app, measured during one week, counting from 6 months after release date / Device statistics of selection of ITP apps for Q3 2015, representing over 200 devices and 1.2 mio smartphone users.
Adoption speed of new major iOS/Android releases.
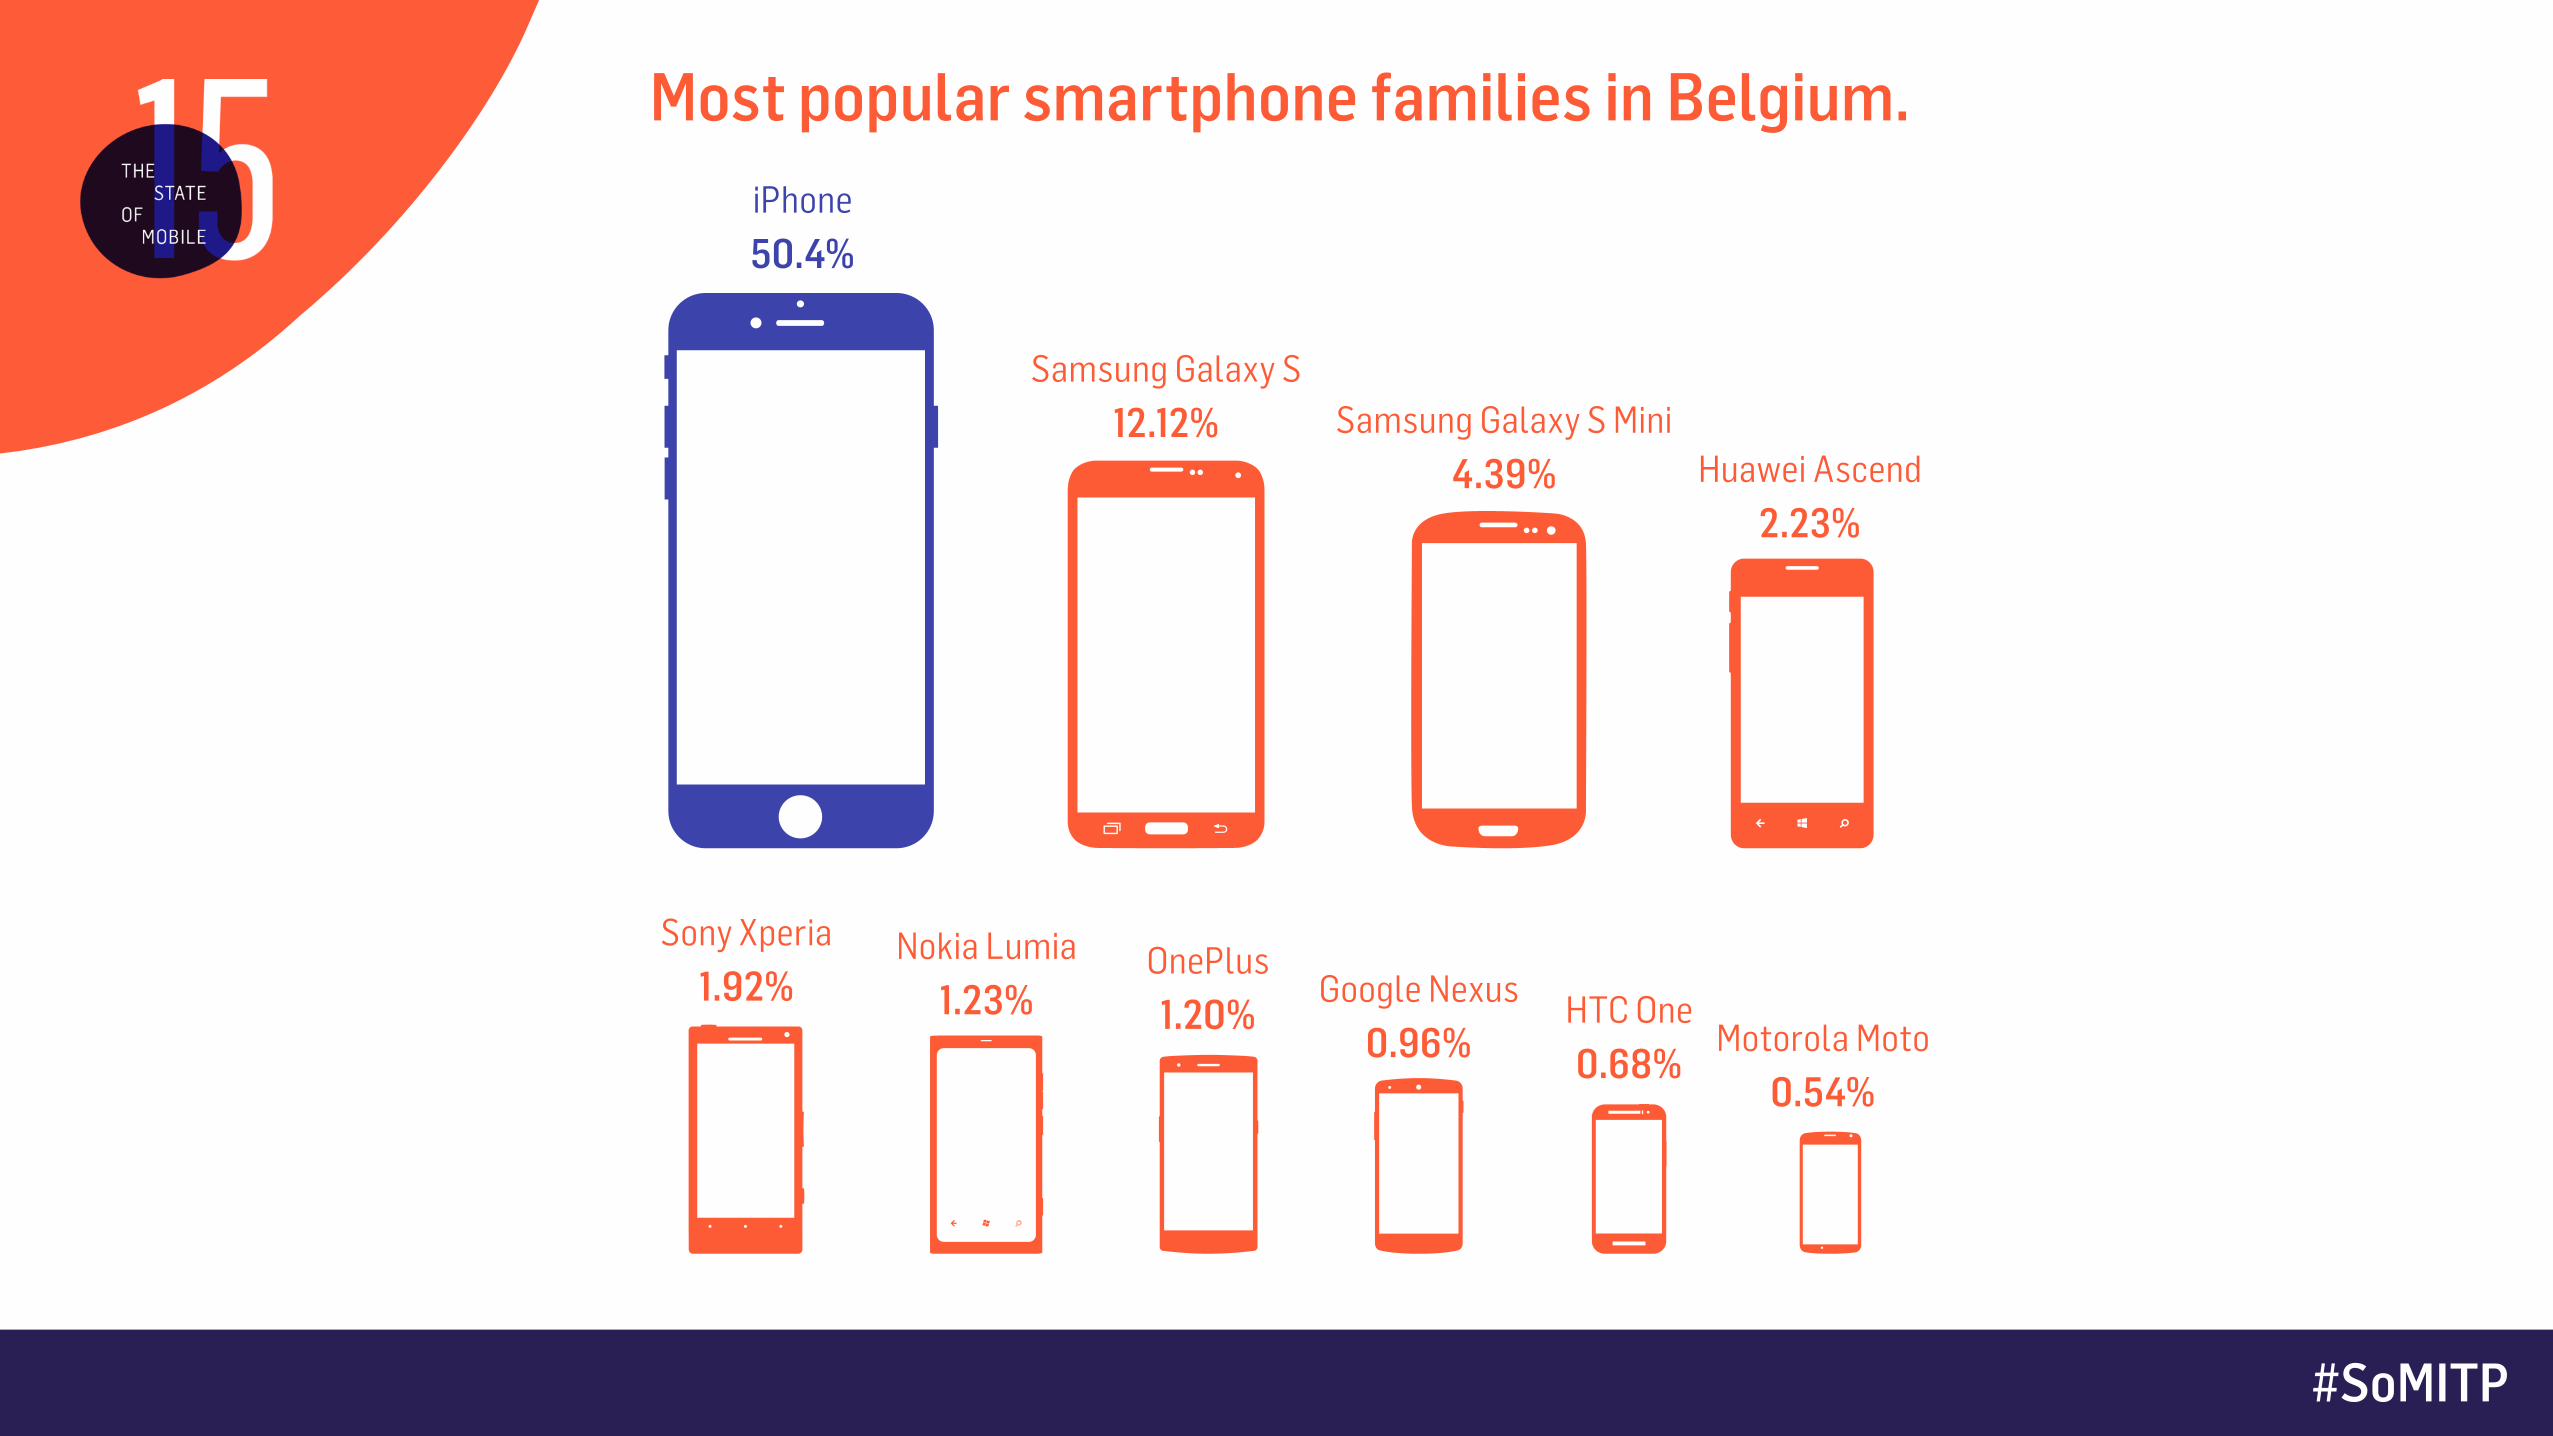
Most popular smartphone families in Belgium.iPhone50.4%
Samsung Galaxy S12.12% Samsung Galaxy S Mini
4.39%
Sony Xperia1.92%
Nokia Lumia1.23%
OnePlus1.20%
Google Nexus0.96%
HTC One0.68%
Motorola Moto0.54%
Huawei Ascend2.23%
Feb 2014 Apr 2014 May 2014 Apr 2015 Jun 2015
Percentage of BE users that have updated 6 months after a major release.
20%
40%
60%
80%
100% iOS 786%
iOS 871%
ANDROID
4.323%
ANDROID
4.414%
ANDROID
5.018%
51

#SoMITP
Share of Android vs. iOS app downloads.In Belgium, Android has finally closed the gap with iOS.
20%
40%
60%
80%
Q3 ‘11 Q4 ‘11 Q1 ‘12 Q2 ‘12 Q3 ‘12 Q4 ‘12 Q1 ‘13 Q2 ‘14Q2 ‘13 Q3 ‘14Q3 ‘13 Q4 ‘14Q4 ‘13 Q1 ‘15Q1 ‘14 Q2 ‘15 Q3 ‘15
52%
IOS ANDROID

#SoMITP
And internationally?
Google Play download growth is mostly driven by smartphone ownership growth in emerging markets and success of budget Android devices.
App Downloads by Store App Revenue by Store
50
100
150
200
+85%
+70%
available on theiOS App Store
Get it onGoogle play
Get it onGoogle play
available on theiOS App Store

#SoMITP
New OS features or functionality can be leveraged more quickly on iOS.
Sources: Sampled from 92.874 - 226.674 users of HLN app, measured during one week, counting from 6 months after release date / Device statistics of selection of ITP apps for Q3 2015, representing over 200 devices and 1.2 mio smartphone users.
Adoption speed of new major iOS/Android releases.
Most popular smartphone families in Belgium.iPhone50.4%
Samsung Galaxy S12.12% Samsung Galaxy S Mini
4.39%
Sony Xperia1.92%
Nokia Lumia1.23%
OnePlus1.20%
Google Nexus0.96%
HTC One0.68%
Motorola Moto0.54%
Huawei Ascend2.23%
Feb 2014 Apr 2014 May 2014 Apr 2015 Jun 2015
Percentage of BE users that have updated 6 months after a major release.
20%
40%
60%
80%
100% iOS 786%
iOS 871%
ANDROID
4.323%
ANDROID
4.414%
ANDROID
5.018%
51

#SoMITP
Which versions to support?
Snapshot of OS versions 1 month after release of iOS9 and Android 6.
4
5.0.X
5.1.X
6
53%
1,5%
14%
27%
5%
7
8
9.0.X
9.1.X
18%
6%
26%
44%
6%

STATE OF MOBILE USAGE

#SoMITP
Mobile has surpassed desktop usage.
We spend 157% more time on digital devices as compared to 2010.
+394%SINCE 2010
+37%SINCE 2010
DESKTOP44%
SMARTPHONES42%
TABLETS14%

#SoMITP
People spend over 3.5 hours per day on mobile devices.
20%
158
162
Q1 ‘13
Q2 ‘14
Q2 ‘15
14%
10%
MOBILE BROWSER APPS
220
20%
3
4
5
14%
10%
-50%
2
+35%
220
Minutes per day on mobile:

#SoMITP
90% of mobile time is in apps.
Facebook has replaced your mobile browser as your window on the world.
42% of app time occurs in most used app. 75% of app usage occurs in top 4 apps.
1/3 of mobile time is spent in social/messaging apps. But 70% of time in social apps is spent consuming media (videos, articles, ...).
FACEBOOK 19%
CHROME 4%
SAFARI 6%
OTHERS 10%
NEWS 2%
PRODUCTIVITY 4%
MESSAGING/SOCIAL 12%
YOUTUBE 3%
ENTERTAINMENT 17%
GAMING 15%- 17%
+12%
+3%
UTILITIES 8%
APPS BROWSER
220minutes
Source: Flurry Analytics, June 2015 49

STATE OF RETAIL

#SoMITP
THE
STAT
E O
F R
ETA
IL
Consumers are very selective of retailer apps they download.
93% of consumers only have 3 shopping apps or less. 62% don’t have any.
Half of consumers aged between 16 and 34 use (one or more) shopping apps.
Source: In The Pocket State of Mobile field survey (n = 160; for each age group: n = 32 = 16 f + 16 m)
20%
40%
60%
80%
0 1-3 4 OR MORE
Amount of retailer apps installed on phone or tablet
All 16-24 25-34 35-44 45-54 55-64
14
Consumers are very selective of shopping apps they download.
93% of consumers only have 3 shopping apps or less.
62% don’t have any.
Half of consumers aged between 16 and 34 use (one or more) shopping apps.
#SoMITP
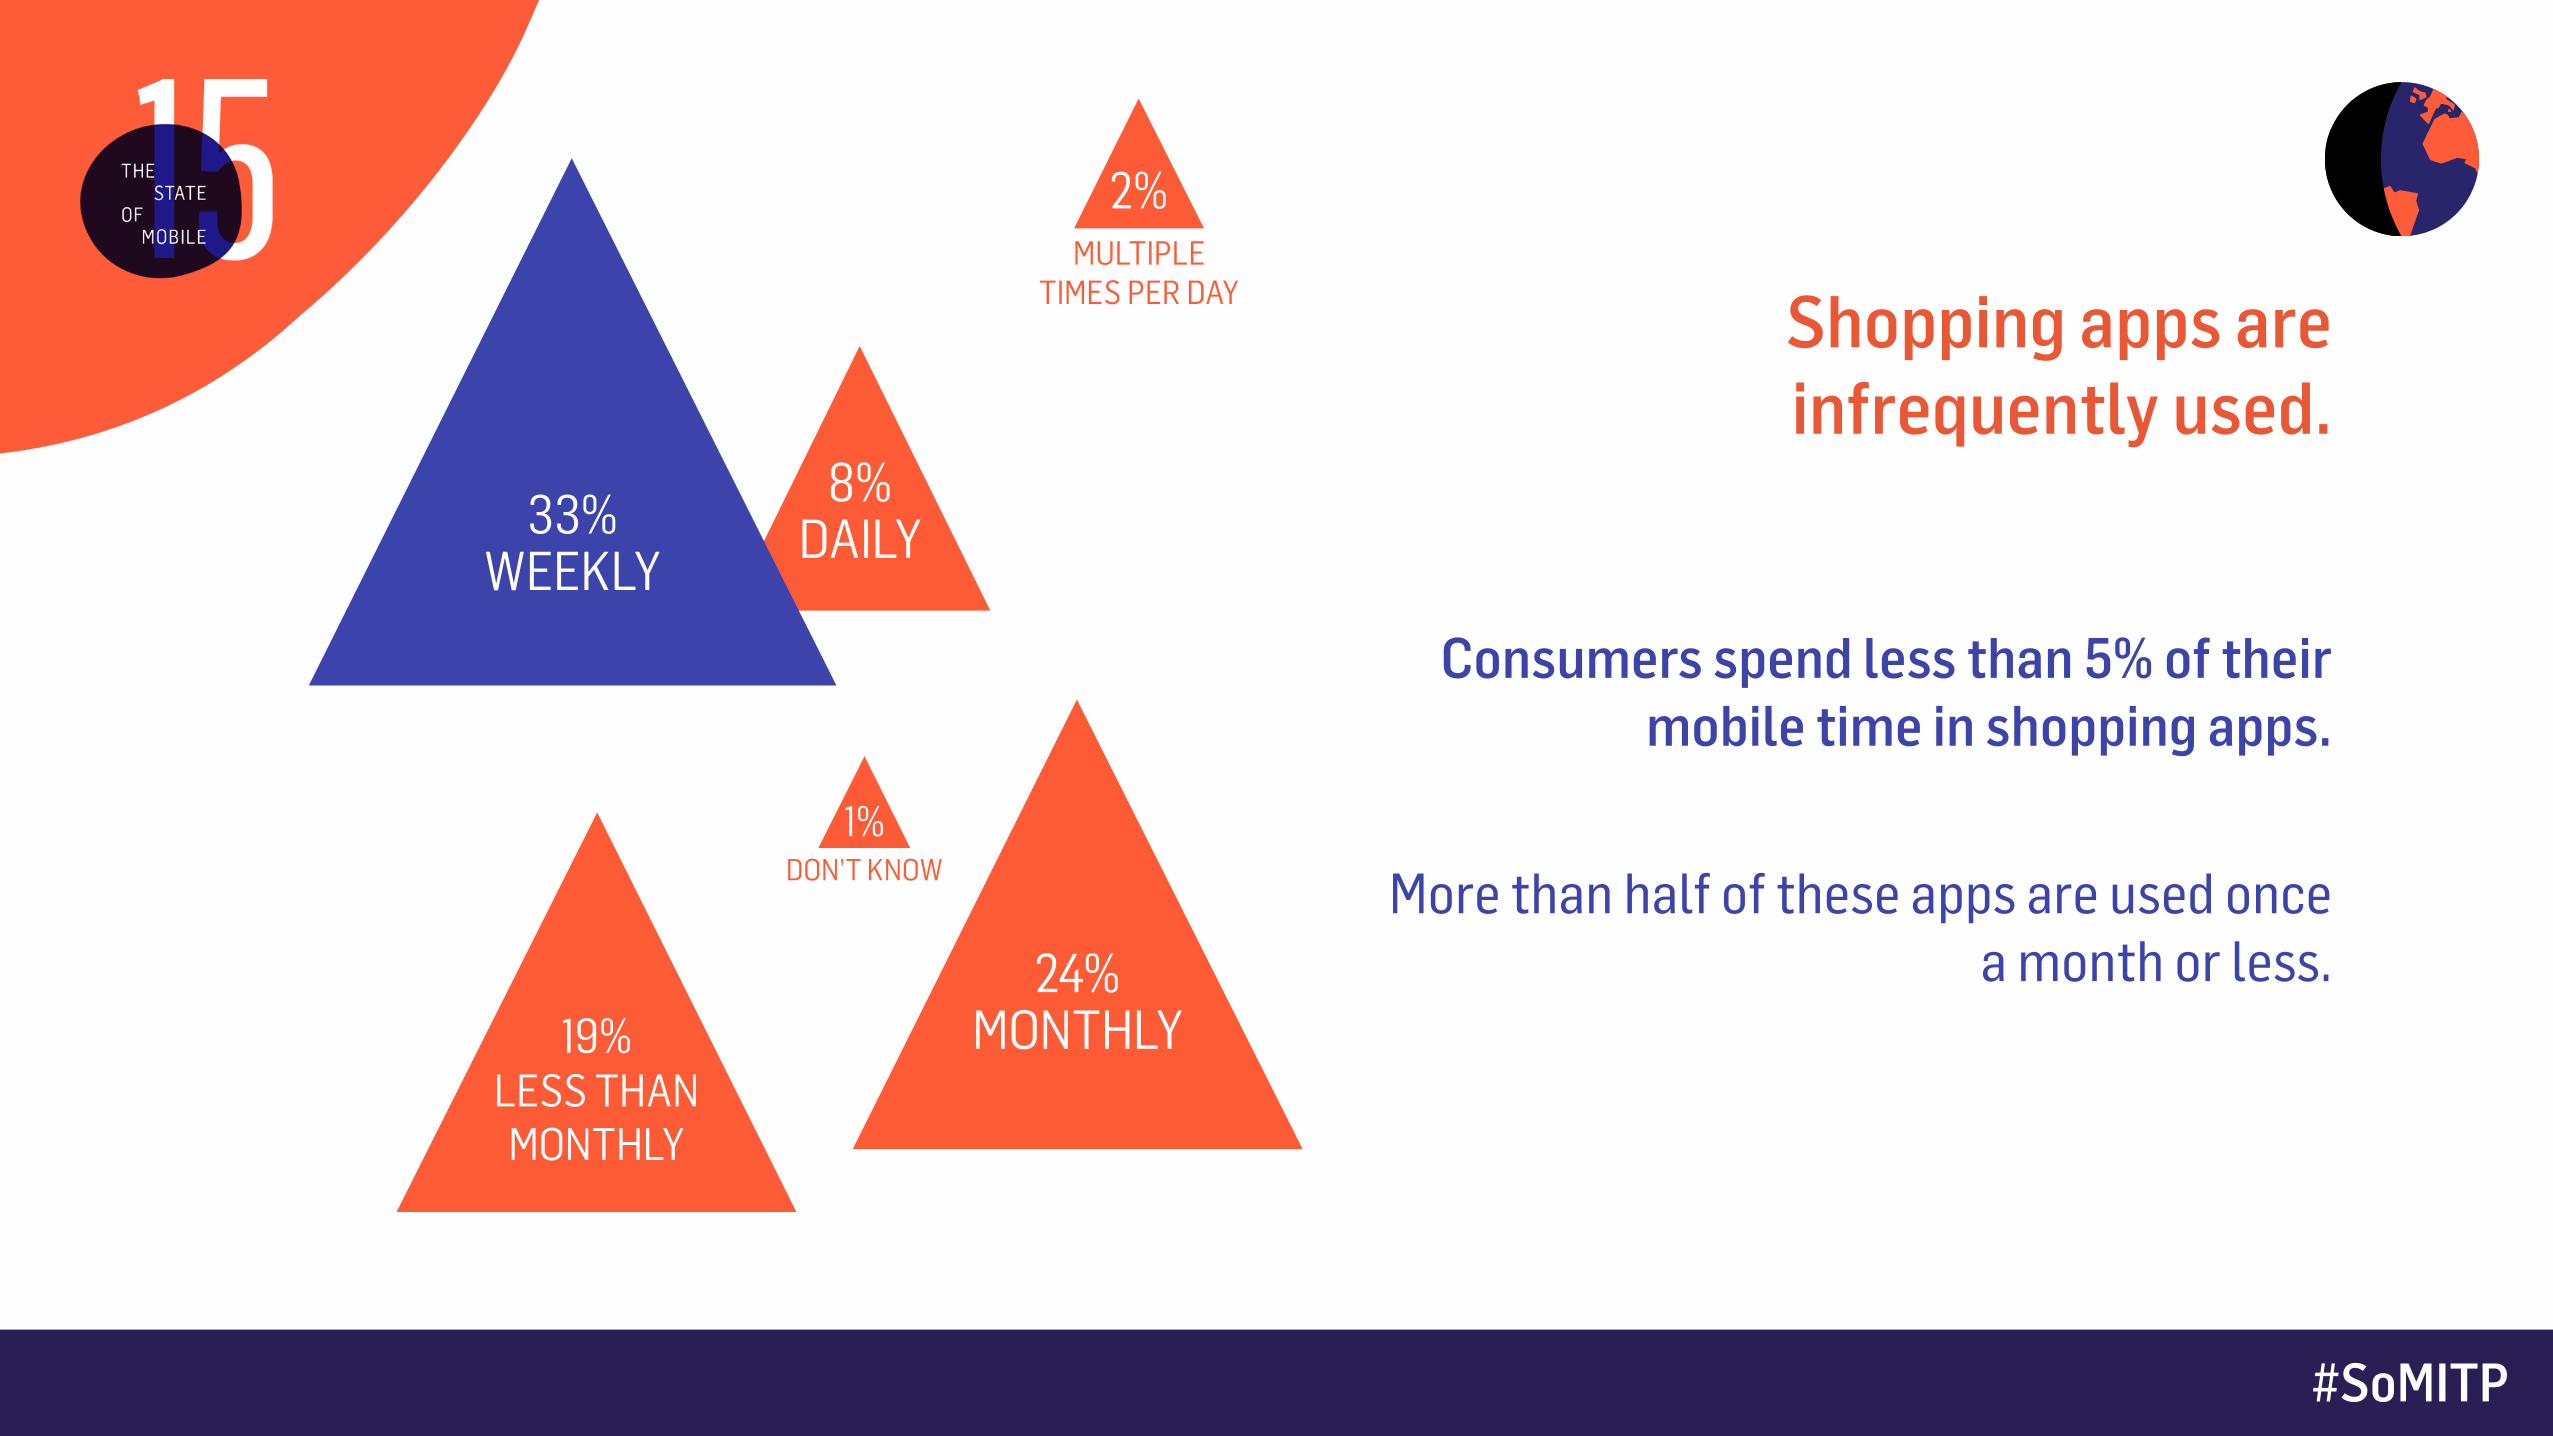
Shopping apps are infrequently used.
Consumers spend less than 5% of their mobile time in shopping apps.
More than half of these apps are used once
a month or less.
8%DAILY
2%MULTIPLE
TIMES PER DAY
1%DON’T KNOW
19%LESS THANMONTHLY
24%MONTHLY
33%WEEKLY

#SoMITP
Mobile commerce is surging, growing 53% year-over-year (Q1 2015 vs. Q1 2014). It outpaces e-commerce growth (9%).
M-commerce accounts for 15% of total e-commerce spending. Which is low, as nearly 60% of online retail browsing occurs on mobile.
What’s holding users back? Sense of security, ease of navigation and browsing, and effort to fulfill all checkout details.
M-commerce is growing rapidly, but there is a monetization gap.
Share of onine retail browsing vs spending by platform
41%
85%
59% 15%
44% monetization gap
20%
40%
60%
80%
% of time spent % of spending
Source: comScore “The M-Commerce Gap”, June 2015
DESKTOP MOBILE
17
Share of online retail browsing vs. spending, by platform:
Mobile commerce is surging, growing 53% year-over-year.
It outpaces e-commerce growth (9%).
But there is a monetization gap.

#SoMITP
People are getting familiar with mobile commerce.
More than half of Belgian consumers have completed an e-commerce transaction
entirely on mobile.
85% of those who have, have done so more than once.
THE
STAT
E O
F R
ETA
IL
People are getting familiar with mobile commerce.
More than half of Belgian consumers have completed an e-commerce transaction entirely on mobile. 85% of those who have, have done so more than once.
Half of consumers between 16 and 44 regularly buy (and pay for) things on their tablets and smartphones.
Source: In The Pocket State of Mobile field survey
All
16-24
25-34
35-44
45-54
55-64
20% 40% 60% 80%
NEVER ONCE MULTIPLE TIMES
16

Find out more—About the future of retail and m-commerce, in our interview with Jan Huysmans, director Belgium for bol.com.

STATE OF MEDIA
#SoMITP
“People don’t want to pay for digital content.”

#SoMITP
Most people really don’t. But: many do.
Unwillingness to pay for digital content is a generational thing: 60% for millennials, 67% for 35-44,
and as high as 73% for those older than 45.

#SoMITP
NEWSPAPERS & ARTICLES 32%Willingness to pay for digital newspapers isn’t tied to age.
Only the group of ‘45-54’ stands out, with 41% willingness to pay.
58%
18%
24%
MUSIC 42%Half of ‘16-34’ would pay for digital music, compared to 1 in 3 of ‘45-64’.
Belgians between ‘35-44’ represent the highest number of people that are very willing to pay for music: over 1 in 3.
68%
12%
20%
NOT OR HARDLY SOMEWHAT VERY
75

#SoMITP
THE
STAT
E O
F M
EDIA
Are people willing to pay for digital access to content?
APPS & IN-APP PURCHASES 24%
Only 1 in 4 of Belgians is willing to pay for apps (or in-app purchases).
It’s a generational thing: 1 in 3 of those aged below 35 buys app, less
than 1 in 5 of those aged above.
“People don’t want to pay for digital content.” Turns out most people really don’t. But many do.
Unwillingness to pay for digital content is a generational thing: 60% for millenials, 67% for 35-44, and as high as 73% for those older than 45.
SERIES, FILMS & TV 34%35% of ‘16-44’ is very willing to pay for digital access to series, films, TV, …
80% of ‘45-64’ is not at all (or hardly) willing to pay.
66%
10% 24%
76%
9%15%
Digital set-top TV & VOD (Telenet, Proximus, etc.) not included.
Source: In The Pocket State of Mobile field survey74
NEWSPAPERS & ARTICLES 32%Willingness to pay for digital newspapers isn’t tied to age.
Only the group of ‘45-54’ stands out, with 41% willingness to pay.
58%
18%
24%
MUSIC 42%Half of ‘16-34’ would pay for digital music, compared to 1 in 3 of ‘45-64’.
Belgians between ‘35-44’ represent the highest number of people that are very willing to pay for music: over 1 in 3.
68%
12%
20%
NOT OR HARDLY SOMEWHAT VERY
75

#SoMITP
NEWSPAPERS & ARTICLES 32%Willingness to pay for digital newspapers isn’t tied to age.
Only the group of ‘45-54’ stands out, with 41% willingness to pay.
58%
18%
24%
MUSIC 42%Half of ‘16-34’ would pay for digital music, compared to 1 in 3 of ‘45-64’.
Belgians between ‘35-44’ represent the highest number of people that are very willing to pay for music: over 1 in 3.
68%
12%
20%
NOT OR HARDLY SOMEWHAT VERY
75

#SoMITP
NEWSPAPERS & ARTICLES 32%Willingness to pay for digital newspapers isn’t tied to age.
Only the group of ‘45-54’ stands out, with 41% willingness to pay.
58%
18%
24%
MUSIC 42%Half of ‘16-34’ would pay for digital music, compared to 1 in 3 of ‘45-64’.
Belgians between ‘35-44’ represent the highest number of people that are very willing to pay for music: over 1 in 3.
68%
12%
20%
NOT OR HARDLY SOMEWHAT VERY
75
THE
STAT
E O
F M
EDIA
Are people willing to pay for digital access to content?
APPS & IN-APP PURCHASES 24%
Only 1 in 4 of Belgians is willing to pay for apps (or in-app purchases).
It’s a generational thing: 1 in 3 of those aged below 35 buys app, less
than 1 in 5 of those aged above.
“People don’t want to pay for digital content.” Turns out most people really don’t. But many do.
Unwillingness to pay for digital content is a generational thing: 60% for millenials, 67% for 35-44, and as high as 73% for those older than 45.
SERIES, FILMS & TV 34%35% of ‘16-44’ is very willing to pay for digital access to series, films, TV, …
80% of ‘45-64’ is not at all (or hardly) willing to pay.
66%
10% 24%
76%
9%15%
Digital set-top TV & VOD (Telenet, Proximus, etc.) not included.
Source: In The Pocket State of Mobile field survey74

In The Pocket
Find out more—About the future of media and the impact of mobile, in our interview with with Christian Van Thillo, CEO of De Persgroep.
STATE OF BANKING

#SoMITP
54% of people use mobile apps for banking.
80% of mobile banking app users aged 25 - 44 age those apps weekly or more frequently.
THE
STAT
E O
F B
AN
KIN
G5%
10%
15%
20%
25%
30%
35%
40%
45%
16-24 25-34 35-44 45-54 55-64
DAILY WEEKLY MONTHLY
How many people of different ages use banking apps and how often do they use them?
Source: In The Pocket State of Mobile field survey
54%65%80%
of people use mobile apps for banking
of clients between 25 and 54 use mobile apps for banking
of mobile banking users between 25 and 54 use those apps weekly or more frequently
TOTAL44%
TOTAL75%
TOTAL53%
TOTAL66%
TOTAL34%
38

#SoMITPWhich channel do clients use more frequently?
For daily banking, apps have surpassed desktop.
Consumers aged 25 to 34 already use their banking app(s) more frequently than laptop/desktop.
How regularly do people use banking apps and banking websites?
20%
20%
40%
40%
60%
60%
80%
80%
Apps
Desktop
DAILY WEEKLY LESS OFTEN
MOBILE > DESKTOP EQUALLY FREQUENT DESKTOP > MOBILE
ALL
16-24
25-34
35-44
45-54
55-64
Sources: In The Pocket State of Mobile field survey 39

#SoMITP
Which channel do clients use more frequently?
For daily banking, apps have surpassed desktop.
Consumers aged 25 to 34 already use their banking app(s) more frequently than laptop/desktop.
How regularly do people use banking apps and banking websites?
20%
20%
40%
40%
60%
60%
80%
80%
Apps
Desktop
DAILY WEEKLY LESS OFTEN
MOBILE > DESKTOP EQUALLY FREQUENT DESKTOP > MOBILE
ALL
16-24
25-34
35-44
45-54
55-64
Sources: In The Pocket State of Mobile field survey 39
Consumers aged 25 to 34 already use their banking app(s) more frequently than laptop/desktop.

STATE OF WEARABLES
“MUCH ADO ABOUT WEARABLES”—

#SoMITP
How many people do fitness & health tracking?
NO, DON’T SEE WHY
54%
NO, BUT I MIGHT
13%SMARTPHONE
24% FITNESS-BAND
8%
1%
SMARTWATCH
1 in 3 does fitness & health tracking. 1 in 10 has a wearable.
#SoMITP
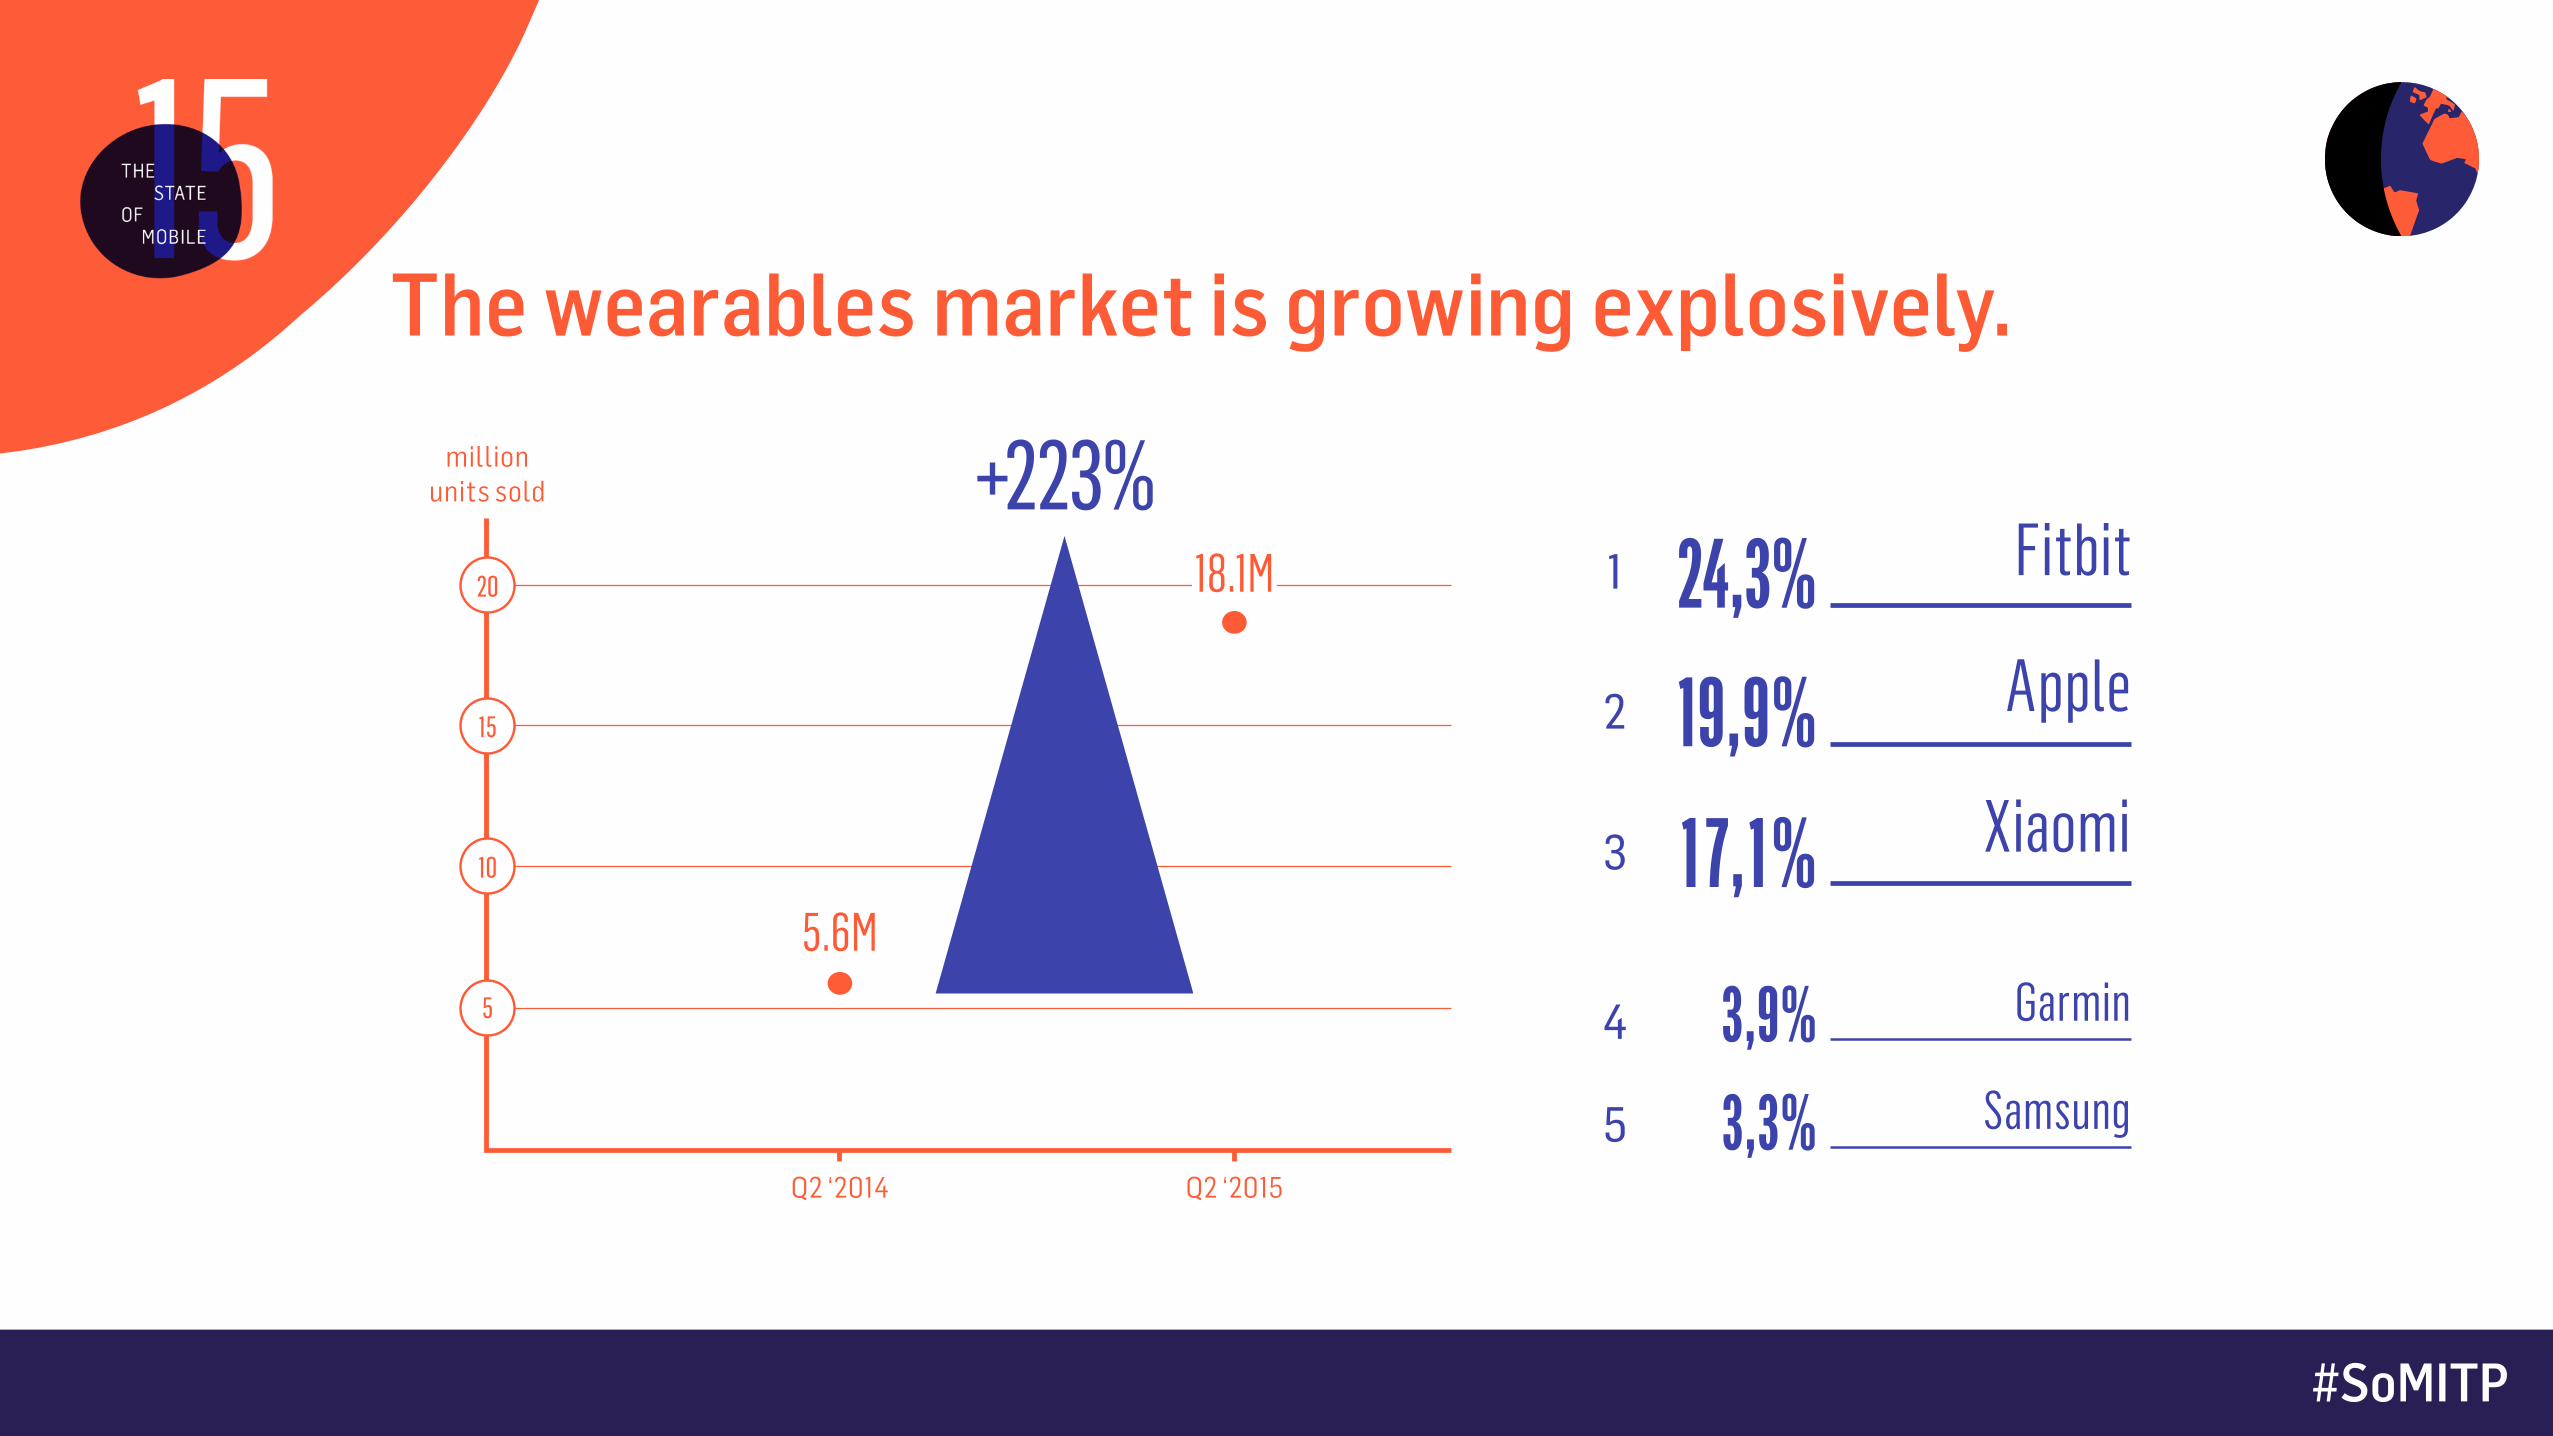
The wearables market is growing explosively.million
units sold
Q2 ‘2014 Q2 ‘2015
24,3%19,9%17,1%
3,9%3,3%
Fitbit
Apple
Xiaomi
Garmin
Samsung
1
2
3
4
5
5
10
15
20
+223%
5.6M
18.1M
#SoMITP
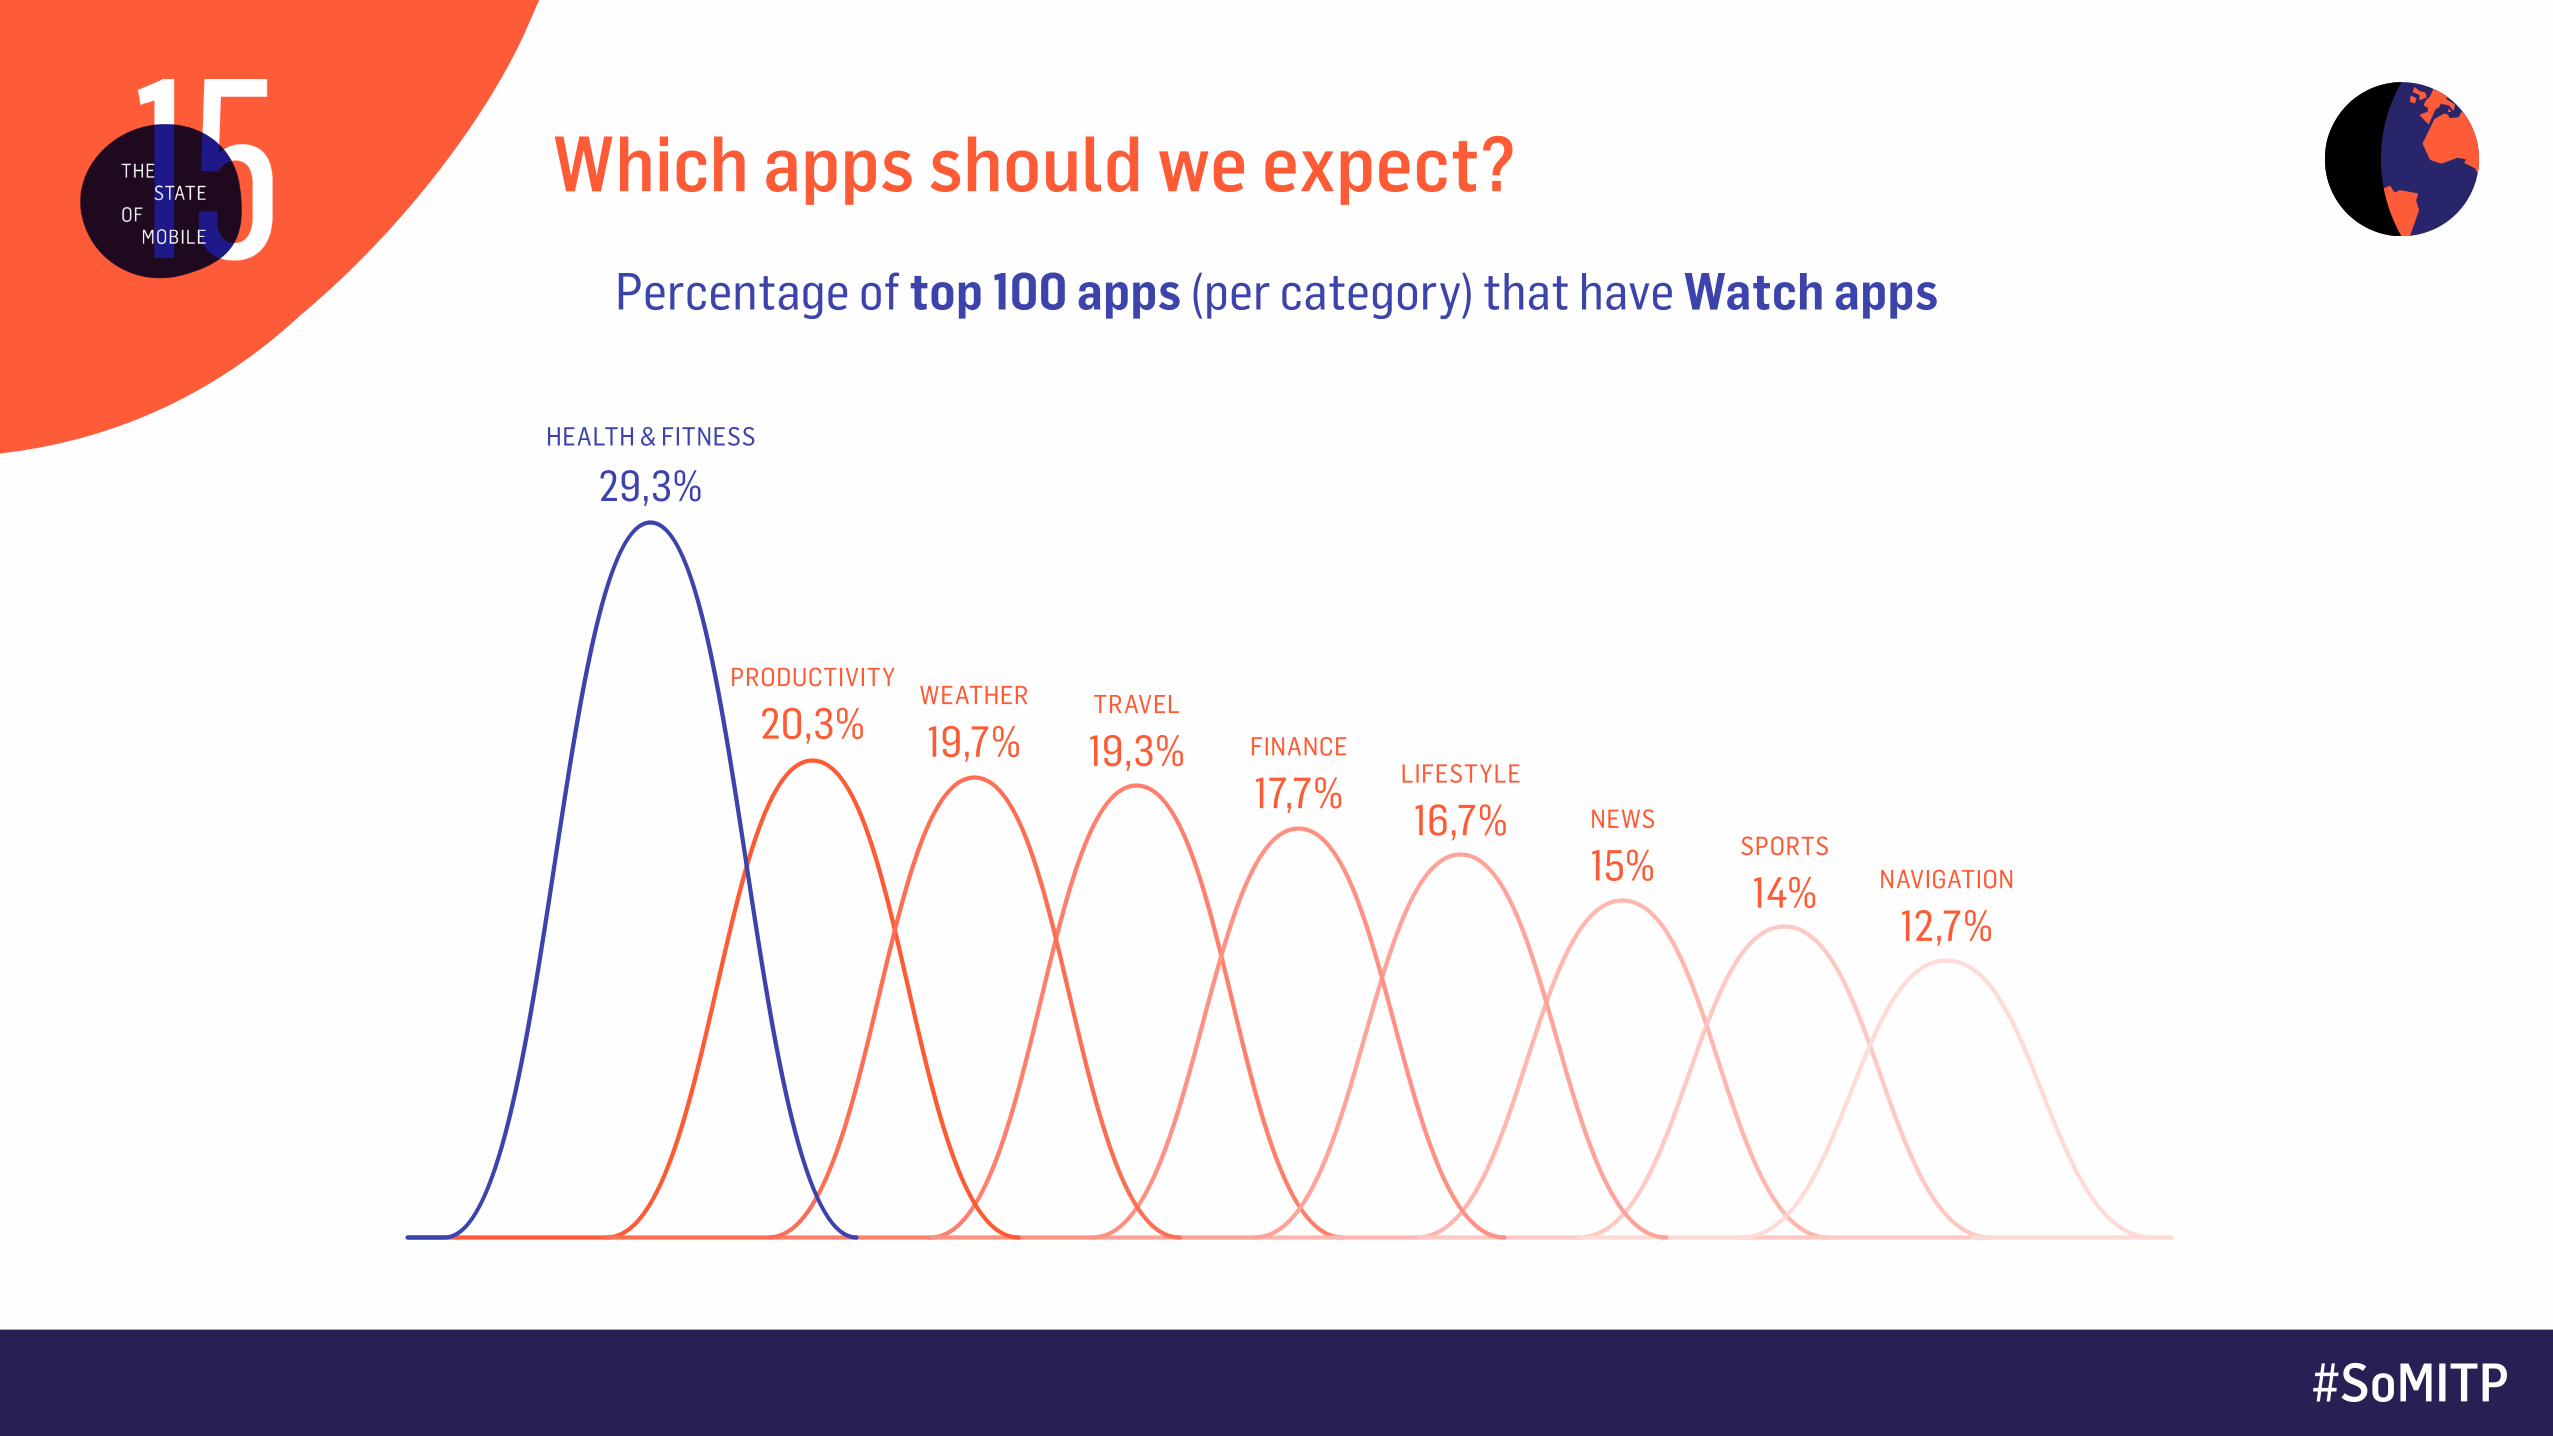
Percentage of top 100 apps (per category) that have Watch apps
Which apps should we expect?
PRODUCTIVITYWEATHER TRAVEL
FINANCELIFESTYLE
NEWSSPORTS
NAVIGATION
HEALTH & FITNESS
29,3%
20,3% 19,7% 19,3%17,7%
16,7%15%
14%12,7%

IN CONCLUSION

“BUT WHAT DOES IT ALL MEAN?”—

#SoMITP
You can’t beat them. Join them.
• People spend over 3 hours/day on their smartphones, mostly in
apps. Most of that app time won’t be for your app though …
• Usual suspects: Facebook & other social/messaging apps,
entertainment & games.
• So if it’s about getting your brand content out there, or striking up
a conversation with your customers: see if you can leverage the
already popular apps with a meaningful presence.

#SoMITP
So why still build apps?
• The mobile browser becomes side-lined. It’s an ephemeral, ad-hoc
tool. A starting point. Apps are key to build a primary relationship
with your user.
• Our smartphone is our life companion. Think how you can re-
imagine your products or services on mobile devices. What’s your
place in this modern Swiss Army knife?

#SoMITP
So why still build apps?
• Leverage better UX or technical possibilities of apps to smoothen
the user or customer journey.
Mobile payments, heightening security, granular messaging,
location-based servicing, …

#SoMITP
Sticking to smartphones won’t suffice.
• Wearables (fitness bands and smartwatches) show every sign of an
exploding market. A lot of people will have them, soon.
People might laugh. But people laughed at smartphones too. Even
cellular phones were mocked.
• Smartwatches offer more touch points with your users, but you’ll
have to re-think your value proposition. It’s a different device, with
different use-cases.
#SoMITP
Devices mean data.
• Wearables and health tracking will offer a lot of interesting data
about users. Learn to leverage these new data-sets through
HealthKit, Google Fit, etc. Give meaning to this data.
• Beacons will do the same, but for user location. Geo-CRM, you’re
welcome.

#SoMITP
Thank you. Let’s have drinks.