mobile web traffic report - deviceatlas · introduction after analysing web traffic statistics from...
TRANSCRIPT

MOBILE WEB TRAFFIC REPORT Q3 2015
MOBILE CARRIERS, DEVICE DIVERSITY, SCREEN SIZES, PHONE VENDORS AND MORE

INTRODUCTIONAfter analysing web traffic statistics from thousands of websites from all over the world, we’ve put together a brand new report covering mobile traffic trends in Q3 2015. In this quarter’s report we focus on:
• Mobile Network Operators’ (MNO) popularity based on web traffic• Device diversity in different countries• Most used smartphone diagonal screen sizes and screen resolutions• Most used mobile Operating Systems and smartphone models
Be sure to read the MNO-focused part of the report revealing which MNOs were leading in terms of website hits in Q3 2015. There are many factors driving these figures, such as 3G/4G network coverage, the cost of data, the types of data plans and the types of devices offered by mobile carriers.
ABOUT THE REPORTThis report is based on visits to thousands of websites powered by DeviceAtlas device detection solution. Here are some of the most important facts about the publication:
• All graphs and tables are based on mobile website hits• The figures in most charts and tables represent the percentage of web traffic• The statistics are selected by the team of data analysts working on the
DeviceAtlas device detection solution
READ THE REPORT TO LEARN ABOUT:
Device diversity in selected local markets
3.5”3.5”5”5”
Most popular screen sizes and resolutions
Most used MNOs, OSes, vendors and smartphones

1. MOBILE NETWORK OPERATORSMobile Network Operators’ market share is typically based on the number of subscribers but it is also important to take into consideration how mobile services are used. A decade ago they were used mostly for phone calls and texting while today data consumption is arguably the most important aspect. There are several factors, other than the number of subscribers, that may cause higher data usage:
• Generous and cost-friendly data plans• Good 3G and 4G coverage• Many low-priced smartphones on offer
The following statistics allow you to understand the popularity of different Mobile Network Operators (mobile carriers) based on the number of website hits generated in Q3 2015.
0%
10%
20%
30%
40%France
Bouygues - 31.4%Orange - 27.8%
SFR - 20.6%
10%
20%
30%
40%
50%Germany
Vodafone - 43.6%E-Plus - 25.2%O2- 25%
10%
20%
30%
40%
50%Italy
Vodafone - 41%Telecom Italia - 32.6%
3 - 25.5%
10%
20%
30%
40%Spain
Vodafone - 32%movistar - 28.3%
Orange - 25%
Most used MNOs based on web traffic from mobile devices in Q3 2015

10%
20%
30%United Kingdom
3 - 28.5%Orange (EE) - 27.2%
Vodafone - 20.6%
10%
20%
30%
40%
50%Australia
Telstra - 41%Optus - 37%
Vodafone (Crazy John’s) - 22%
10%
20%
30%India
Airtel - 28.7%Vodafone - 25.3%IDEA - 18.4%
10%
20%
30%
40%
50%Nigeria
MTN - 41.5%Etisalat - 37.3%Airtel - 14.4%
10%
20%
30%
40%
50%
60%Japan
NTT DoCoMo - 50.8%KDDI - 45.9%SoftBank - 3.2%
10%
20%
30%
40%USA
Verizon - 37.4%AT&T - 29.8%T-Mobile - 16.9%
DeviceAtlas not only identifies detailed device characteristics but can also identify a web visitor’s carrier. This is offered in partnership with Digital Element, a geolocation and IP intelligence expert.

2. DEVICE DIVERSITYThe world of web devices is now populated with different device models filling every available niche: feature phone -> smartphone -> tablet -> laptop -> desktop -> wearable - > smart TV. This makes for an extremely diverse device landscape. For example, you may think there is little mobile OS diversity, but DeviceAtlas tracked over 30 different mobile OSes that generated traffic in Q3 2015. To give you an idea of device diversity we investigated DeviceAtlas statistics to find out which countries can be characterized as diverse and which ones are more uniform.
OS diversity
You can find statistics on the most used Operating Systems in selected countries in section 4. Here, we reveal how many unique mobile OSes were used to access websites in Q3 2015 in different countries. We noticed that a large number of OSes is typical for larger markets, such as USA, India, Brazil, UK, or Russia where users are offered a wide range of smartphone models.
10-15 OSes 16-20 OSes 20+ OSes
Belgium Australia USA
Ireland France India
Austria Mexico Brazil
Singapore Spain Germany
United Arab Emirates
Netherlands Canada
New Zealand Turkey UK
Greece South Africa Italy
Sweden Argentina Russia
Smartphone vendor diversity
While Samsung, Apple and a few other vendors capture over 50% of the worldwide smartphone market according to IDC, there are many local device makers that are popular only in certain regions and are unknown in other corners of the globe. In Q3 2015 DeviceAtlas saw website visits coming from a whopping 500+ different device manufacturers.
The number of mobile operating systems accessing websites in Q3 2015

Diagonal screen size diversity
Knowing the most popular screen sizes is particularly important for web developers who need to make sure the online experience is great on every screen. Higher device diversity in terms of screen sizes means that website owners must be extra careful ensuring that all visitors get an optimised version of the website. The overall number of unique screen sizes for mobile devices tracked by DeviceAtlas reached over 170 in Q3 2015.
150 or less 151-250 250+
Ireland Philippines USA
Indonesia Argentina UK
Belgium Canada Spain
Saudi Arabia Netherlands Russia
Romania Austria India
New Zealand Australia Germany
Japan Pakistan Mexico
Israel United Arab Emirates
Turkey
100 or less 101-120 120+
South Africa Italy USA
Ireland Australia India
Belgium Brazil Russia
United Arab Emirates
Austria Germany
Singapore Indonesia Mexico
New Zealand Netherlands Turkey
Japan Nigeria Spain
Israel Malaysia France
The number of unique diagonal screen sizes in Q3 2015
The number of smartphone vendors in Q3 2015

Smartphone model diversity
There were literally thousands of unique web-enabled devices that generated website hits in Q3 2015. The number of devices we saw in this quarter varied greatly across local markets. The following table shows you which parts of the globe were the most diverse in terms of the number of unique mobile devices used for accessing websites.
1200 or less 1201-2000 2000+
Indonesia Mexico USA
Nigeria Netherlands India
Belgium Austria Ukraine
New Zealand France Russia
Saudi Arabia Australia Germany
Romania Italy Turkey
Japan Brazil Spain
Israel Malaysia Argentina
3. DIAGONAL SCREEN SIZES AND SCREEN RESOLUTIONS
Top diagonal screen sizes in 10 selected countries
Browsing websites on the go is much more comfortable on a large-screen smartphone and therefore phones with 5 inch screens or even larger are gaining traction in every corner of the globe. The following charts present the most used diagonal screen sizes in selected local markets.
24.3%
6.6%
7.9%8.3% 14.3%
38.6%
4.7 in - 38.6%
5 in - 14.3%
5.1 in - 8.3%
5.5 in - 7.9%
4.5 in - 6.6%
Other - 24.3%
France
26.8%
6%
9.1%
11.5%14.8%
31.8%
4.7 in - 31.8%
5 in - 14.8%
5.1 in - 11.5%
4.3 in - 9.1%
4 in - 6%
Other - 26.8%
Germany
Smartphone models generating website hits in Q3 2015

30.1%
8.7%
9.7% 10.5%
17.1%
23.8%
4.7 in - 23.8%
5 in - 17.1%
4.3 in - 10.5%
4.8 in - 9.7%
4.5 in - 8.7%
Other - 30.1%
Italy
29.7%
7.3%
8.4%10.3%
20%
24.2%
5 in - 24.2%
4.7 in - 20%
4.5 in - 10.3%
5.5 in - 8.4%
4 in - 7.3%
Other - 29.7%
Spain
21.6%
5%
8.3%
9.4%9.8%
45.9%
4.7 in - 45.9%
5.1 in - 9.8%
5 in - 9.4%%
5.5 in - 8.3%
4.5 in - 5%
Other - 21.6%
UK
17.1%
5.9%
9.4%
12.3%
13.8%
41.5%
4.7 in - 41.5%
5.5 in - 13.8%
5.1 in - 12.3%
5 in - 9.4%
5.7 in - 5.9%
Other - 17.1%
USA
12.5%3.7%
9.1%
12%
13.2%
49.5%
4.7 in - 49.5%
5.1 in - 13.2%
5.5 in - 12%
5 in - 9.1%
5.7 in - 3.7%
Other - 12.5%
Australia
28.1%
8.9%
10.9% 12.3%
14%
25.9%
5 in - 25.9%
4.7 in - 14%
4 in - 12.3%
5.5 in - 10.9%
4.5 in - 8.9%
Other - 28.1%
India
16.6%
3.6%
5.7%
10%
13.5%
50.6%
4.7 in - 50.6%
5.5 in - 13.5%
5 in - 10%
5.2 in - 5.7%
4.6 in - 3.6%
Other - 16.6%
Japan
33.3%
8.1%
10.1% 12.3%
14.1%
22.2%
5 in - 22.2%
4.7 in - 14.1%
3.1 in - 12.3%
5.5 in - 10.1%
4.2 in - 8.1%
Other - 33.3%
Nigeria
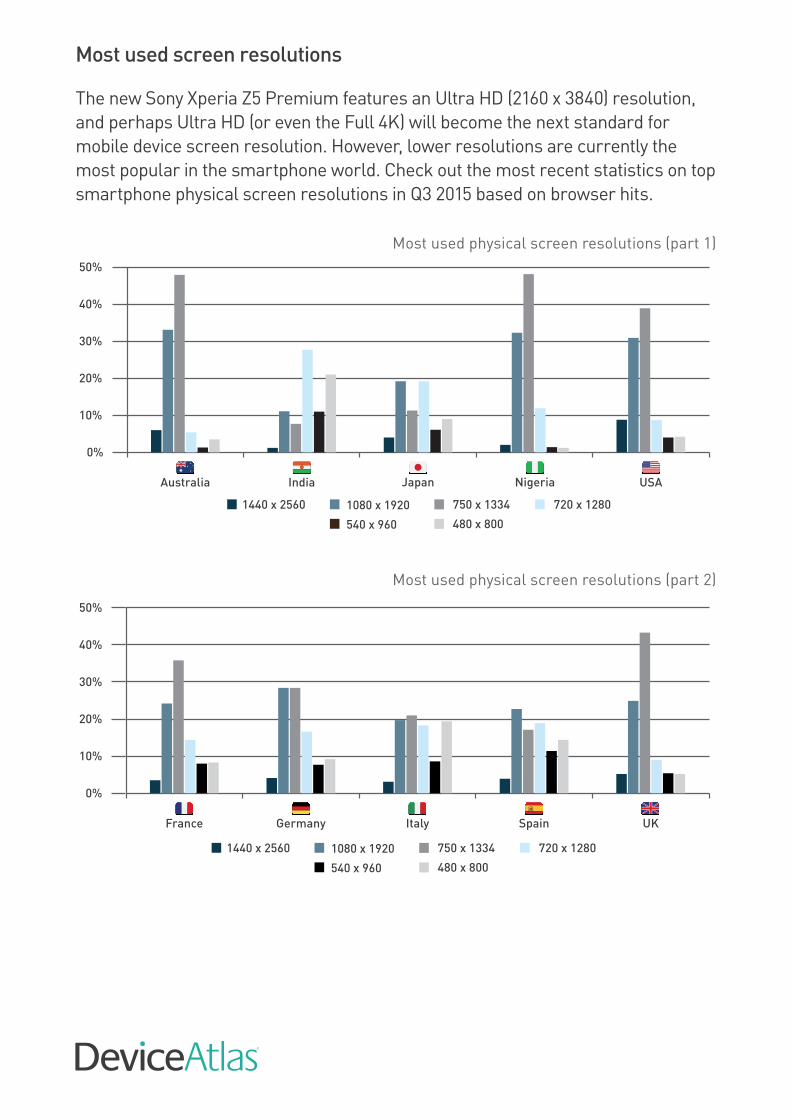
Most used screen resolutions
The new Sony Xperia Z5 Premium features an Ultra HD (2160 x 3840) resolution, and perhaps Ultra HD (or even the Full 4K) will become the next standard for mobile device screen resolution. However, lower resolutions are currently the most popular in the smartphone world. Check out the most recent statistics on top smartphone physical screen resolutions in Q3 2015 based on browser hits.
0%
10%
20%
30%
40%
50%
USAJapanIndiaAustralia
1440 x 2560 750 x 13341080 x 1920 720 x 1280
480 x 800540 x 960
Nigeria
0%
10%
20%
30%
40%
50%
UKSpainItalyGermanyFrance
1440 x 2560 750 x 13341080 x 1920 720 x 1280
480 x 800540 x 960
Most used physical screen resolutions (part 2)
Most used physical screen resolutions (part 1)

Smartphone Diagonal screen size Screen resolution
iPhone 6 / 6S 4.7 in 750 x 1334
iPhone 6 Plus / 6S Plus 5.5 in 1080 x 1920
iPhone 5 / 5S 4.0 in 640 x 1136
Samsung Note 5 5.7 in 1440 x 2560
Samsung Galaxy S6 5.1 in 1440 x 2560
Samsung Galaxy S5 5.1 in 1080 x 1920
Sony Xperia Z5 Premium 5.5 in 2160 x 3840
Sony Xperia Z5 5.2 in 1080 x 1920
Sony Xperia Z3 Compact 4.6 in 720 x 1280
LG G4 5.5 in 1440 x 2560
HTC One M9 5.0 in 1080 x 1920
Our analysis shows that the most popular diagonal screen sizes in countries we studie were 4.7in, 5in, 5.1in and 5.5in, while the most used screen resolutions were 1080 x 1920, 750 x 1334, 720 x 1280, and 480 x 800. qHD resolution (1440 x 2560), used by some of the flagship devices, is so far less popular than other screen resolutions. For comparison, here are some of the most popular smartphones including the details of their displays.
4. OPERATING SYSTEMSiOS vs Android
According to IDC’s sales stats for Q2 2015, Android was the leading OS with 82.8% market share overtaking iOS which took 13.9% of the market. IDC lists only two other mobile OSes including Windows Phone (2.6%) and Blackberry OS (0.3%). How do these stats compare with the DeviceAtlas web traffic statistics?
Generally speaking, the difference between iOS and Android is less than that for sales which perhaps indicates a longer lifespan for iOS devices. There are some countries, especially in Western and Northern Europe and North America, where iOS is the most popular mobile OS. The following map and table show you some selected parts of the globe where either iOS or Android are the leading OSes in terms of web browsing.
Selected smartphones’ screen sizes and screen resolutions

Android vs iOS based on website hits in Q3 2015
Android
iOS
Android countries iOS countries
Serbia Bahamas Costa Rica China Sweden
Greece Panama Barbados Saudi Arabia France
Austria Brazil Uruguay Thailand Belgium
Spain Colombia Myanmar Israel Norway
Poland Mexico Vietnam Hong Kong Ireland
Turkey Trinidad and T. Pakistan Qatar Switzerland
Croatia Dominican Rep. Iraq UK
Italy Peru Jordan Denmark
Ukraine Ecuador India USA
Germany Puerto Rico South Korea Canada
Romania Venezuela Iran Australia
Portugal Chile Bangladesh New Zealand
Russia Argentina Taiwan Kuwait
Netherlands Philippines Indonesia Singapore
Finland Malaysia United Arab Emirates
Japan

Windows Phone’s popularity
In the Q3 2015 report we looked into Windows Phone statistics to learn if it could challenge Android and iOS in the near future. Here is Windows Phone-generated web traffic during the last 4 quarters. As you can see, Windows Phone grew significantly in India, Nigeria, Germany, Italy and UK, although its stats are still far behind the leading OSes especially in the USA and Japan where Windows Phone’s share is marginal.
Windows Phone popularity (part 1)
Windows Phone popularity (part 2)
0%
1%
2%
3%
4%
5%
6%
7%
8%
USANigeriaJapanIndiaAustralia
Q2 2015Q1 2015Q4 2014 Q3 2015
0%
1%
2%
3%
4%
5%
6%
7%
8%
UKSpainItalyGermanyFrance
Q2 2015Q1 2015Q4 2014 Q3 2015

Here are the countries where Windows Phone was the most popular according to our statistics for Q3 2015. It’s worth noting that 4 EU countries are on the list, including Finland, Italy, Poland and Croatia.
5. SMARTPHONE MODELS AND VENDORSIn this section we focus on the most popular vendors and phone models in selected local markets. As we noted in Section 2, in some countries we saw over 300 unique device vendors and over 2,000 unique devices that were used to access mobile websites in Q3 2015. Of course just a few of these makers and devices are recognized by the majority of buyers.
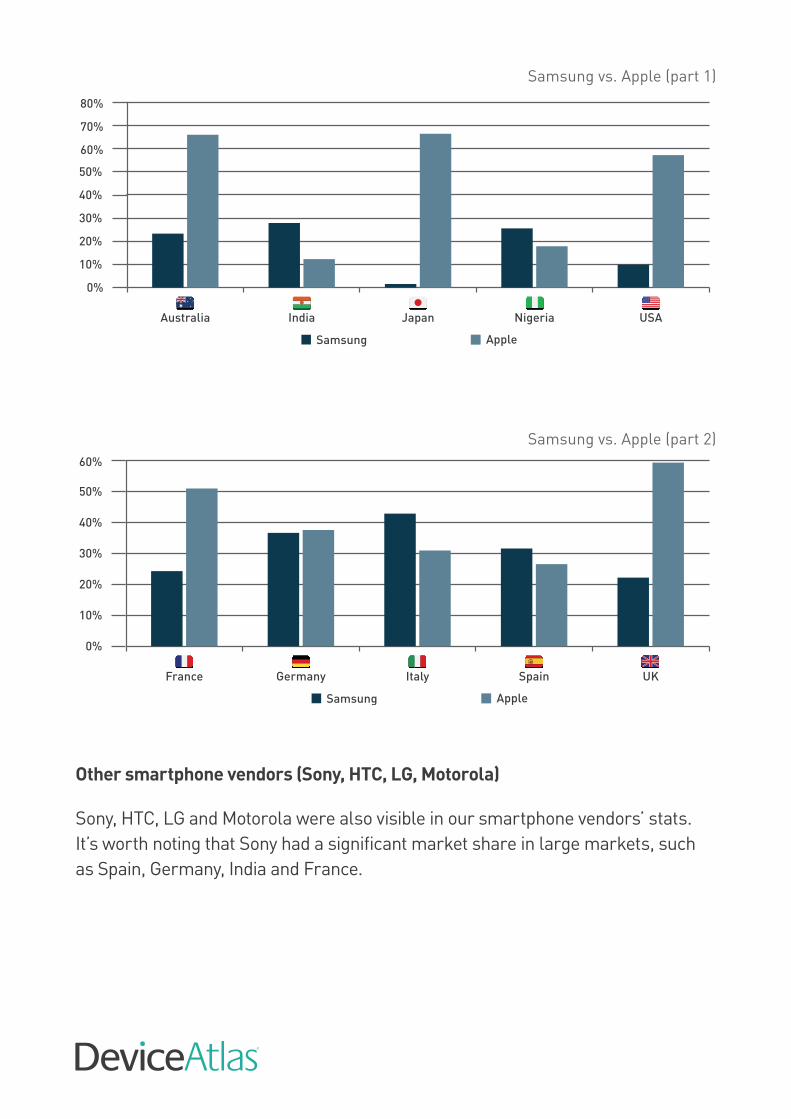
Samsung vs. Apple
According to IDC’s sales statistics Samsung and Apple were the most popular smartphone vendors in Q2 2015. Samsung had 21.4% market share while Apple came second with 13.9% market share. Similarly in our mobile traffic statistics Samsung and Apple are the leading OSes, although Apple is winning in 5 out of 10 countries we analysed. The following chart allows you to compare mobile traffic in Q3 2015 for these two vendors across 10 selected local markets.
0 5 10 15 20 25
CroatiaPoland
EcuadorItaly
South AfricaIndia
BangladeshArgentina
UruguayFinland
Windows Phone popularity (part 3)
0%
10%
20%
30%
40%
50%
60%
70%
80%
USANigeriaJapanIndiaAustralia
Samsung Apple
Samsung vs. Apple (part 1)
0%
10%
20%
30%
40%
50%
60%
UKSpainItalyGermanyFrance
Samsung Apple
Samsung vs. Apple (part 2)
Other smartphone vendors (Sony, HTC, LG, Motorola)
Sony, HTC, LG and Motorola were also visible in our smartphone vendors’ stats. It’s worth noting that Sony had a significant market share in large markets, such as Spain, Germany, India and France.

0%
1%
2%
3%
4%
5%
6%
USANigeriaJapanIndiaAustralia
LGHTCSony Motorola
Sony, HTC, LG, Motorola (part 1)
0%
2%
4%
6%
8%
10%
UKSpainItalyGermanyFrance
LGHTCSony Motorola
Sony, HTC, LG, Motorola (part 2)
Most popular iPhones
The release of the latest iPhones (6S and 6S Plus) certainly improved Apple’s sales but it’s perhaps too early to see their impact on the iPhone-generated traffic statistics. Interestingly, while the newest models certainly attract a lot of new buyers, many iPhone owners use their phones for a relatively long period. iPhone 5 and 5S are still the most popular iPhones for web browsing even though there are two newer generations of Apple phones available.

Most popular iPhones (part 1)
Most popular iPhones (part 2)
Most popular Samsung Android phones
The world of Android phones is extremely fragmented with plenty of devices in every price category. This is one of the reasons why there are so few Android phones that are globally recognizable and their market share is typically inconsiderable. According to our statistics for Q3 2015, the Samsung Galaxy family got the largest share of mobile web traffic among all Android-based phones.
0%
5%
10%
15%
20%
25%
30%
35%
40%
USANigeriaJapanIndiaAustralia
iPhone 6/6SiPhone 5/5SiPhone 4 / 4S iPhone 6 Plus/6S Plus
0%
5%
10%
15%
20%
25%
30%
35%
UKSpainItalyGermanyFrance
iPhone 6/6SiPhone 5/5SiPhone 4/4S iPhone 6 Plus/6S Plus
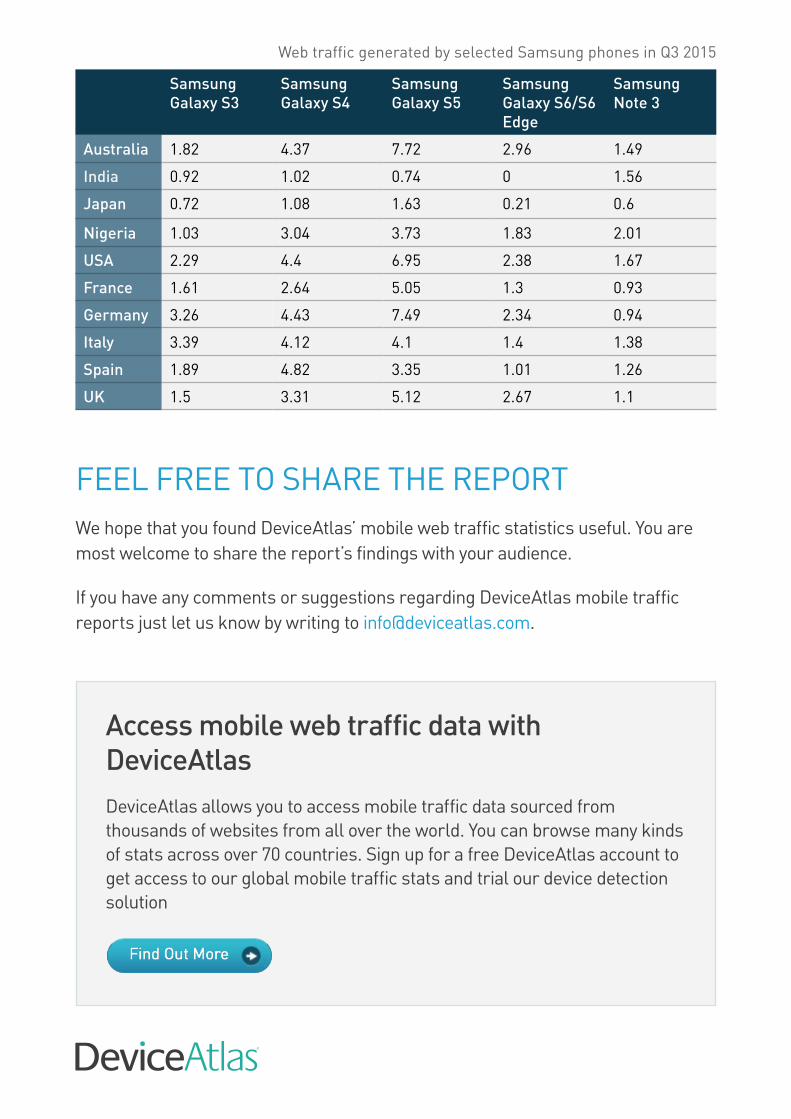
Web traffic generated by selected Samsung phones in Q3 2015
Samsung Galaxy S3
Samsung Galaxy S4
Samsung Galaxy S5
Samsung Galaxy S6/S6 Edge
SamsungNote 3
Australia 1.82 4.37 7.72 2.96 1.49
India 0.92 1.02 0.74 0 1.56
Japan 0.72 1.08 1.63 0.21 0.6
Nigeria 1.03 3.04 3.73 1.83 2.01
USA 2.29 4.4 6.95 2.38 1.67
France 1.61 2.64 5.05 1.3 0.93
Germany 3.26 4.43 7.49 2.34 0.94
Italy 3.39 4.12 4.1 1.4 1.38
Spain 1.89 4.82 3.35 1.01 1.26
UK 1.5 3.31 5.12 2.67 1.1
FEEL FREE TO SHARE THE REPORTWe hope that you found DeviceAtlas’ mobile web traffic statistics useful. You are most welcome to share the report’s findings with your audience.
If you have any comments or suggestions regarding DeviceAtlas mobile traffic reports just let us know by writing to [email protected].
Access mobile web traffic data with DeviceAtlasDeviceAtlas allows you to access mobile traffic data sourced from thousands of websites from all over the world. You can browse many kinds of stats across over 70 countries. Sign up for a free DeviceAtlas account to get access to our global mobile traffic stats and trial our device detection solution