mobility control in surfactant floods: improving napl recovery by in-situ control of viscosity
DESCRIPTION
Mobility Control in Surfactant Floods: Improving NAPL recovery by in-situ control of viscosity. Dick Jackson INTERA Inc., Austin, Texas EPA NAPL Seminar, Chicago December 11, 2002. Mobility Control. - PowerPoint PPT PresentationTRANSCRIPT
1
Mobility Control in Surfactant Floods: Improving NAPL recovery by in-situ control of viscosity
Dick JacksonINTERA Inc., Austin, Texas
EPA NAPL Seminar, ChicagoDecember 11, 2002

2
Mobility Control
The term refers to controlling the viscosity, and subsequently, the direction of flow of injected fluids in heterogeneous oil reservoirs

3
Mobility Control
Mobility ratio:mobility of NAPL ÷ mobility of injectate
Where mobility = µj ÷ keff, j
If µINJ>µNAPL , there is better sweep in-situ and higher NAPL recovery

4
Choice of Approaches
There are two ways of changing in-situ viscosities and thereby overcoming the effects of heterogeneities1. Surfactant-Foam flooding2. Surfactant-Polymer flooding

5
1: Foam Flooding
Surfactant solutions foam when air is injected into them
In-situ this forms a high viscosity and therefore stationary environment in the high perm zones,
Foam is temporary & reversible

6
1: Foam Flooding
Sequential injection of slugs of first surfactant solution then air cause temporary blocking of high-perm units, i.e., low mobility, thus
Foam causes redirection of surfactant into low-perm zones

7
Applications of Foam Flooding
Pilot Scale Test at Hill AFB in 1997 by INTERA and Rice University
Two large-scale Foam floods at Hill in 2001 and 2002 to remove TCE DNAPLAdvisor: George Hirasaki, Rice
University
8
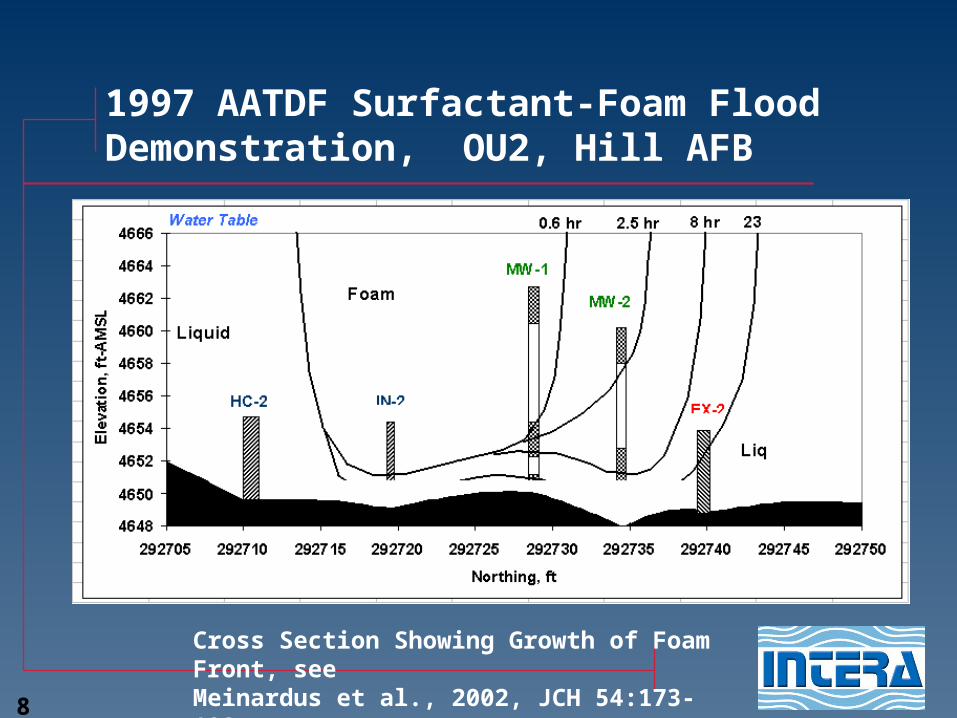
1997 AATDF Surfactant-Foam Flood Demonstration, OU2, Hill AFB
Cross Section Showing Growth of Foam Front, seeMeinardus et al., 2002, JCH 54:173-193
9
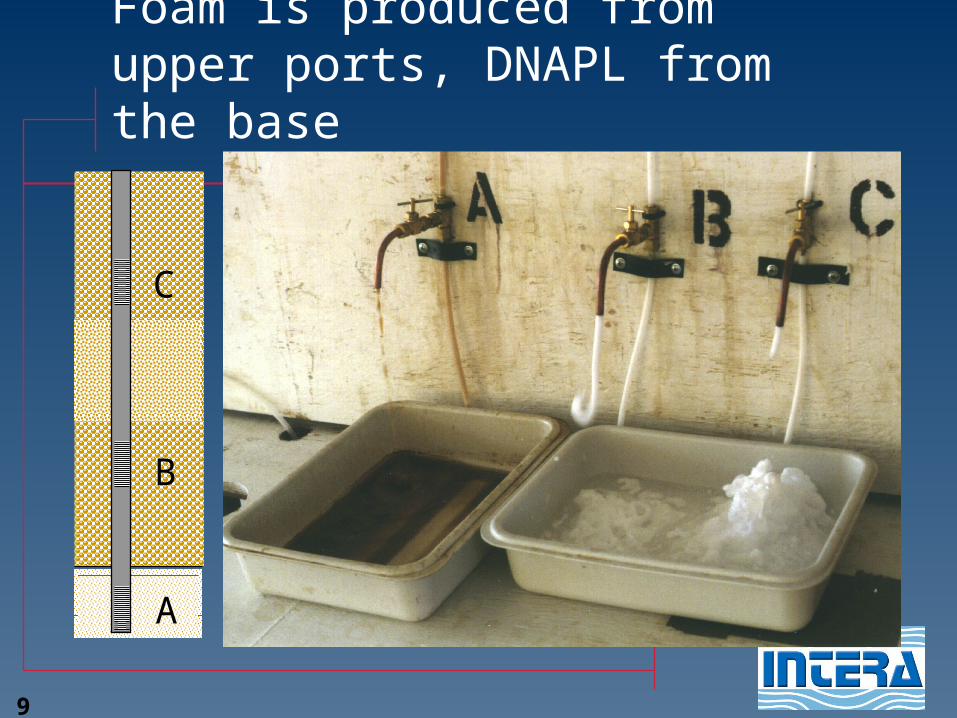
A
B
C
Foam is produced from upper ports, DNAPL from the base

10
SCADA, Flow Control, Autosampling
Mixing/InjectionOn-line GC
Electrolyte(Brine)Staging
Surfactant/Alcohol Staging
InjectionWells (3)
ExtractionWells
ExtractionWells
Wasatch Range
North South
•110 ft Divergent Line Drive•65,000 gal Swept Pore Volume
•Total Remediation Time = 35 days
Full-Scale SEAR at Hill AFB OU2, UtahDNAPL (70% TCE)
Surfactant/Alcohol Staging

11
2: Polymer Flooding
Hundreds of polymer floods conducted since 1960s by the oil industry
The purpose is to maintain local hydraulic gradients and thus cause the injected polymer solution to enter low perm units

12
2: Polymer Flooding
Polymer solutions have high viscosity, e.g., 5 – 20 cP, relative to the NAPL they are to displace
Polymer flooding will displace only free-phase NAPL not residual
Surfactant-polymer flooding displaces both free- and residual-phases– Advisor: Gary Pope, UT-Austin

13
Mobility Control with Polymers:-allows surfactants or biostimulants to be pushed into low-k zones

14
0 10 20 30 40 50
02
46
8
Horizontal Extent (ft)
Depth (ft)
0 10 20 30 40 50
02
46
8
Horizontal Extent (ft)
Depth (ft)
0 10 20 30 40 50
02
46
8
Horizontal Extent (ft)
Depth (ft)
0.0 0.2 0.4 0.6 0.8
Normalized Tracer Concentration
Permeability field for UTCHEM simulations
Progress of fluids without polymer
Progress of fluids with polymer
10 Darcy
2 Darcy
1 Darcy
Polymer induced crossflow

15
Removal of Coal Tar by Surfactant-Polymer Flooding, Illinois

16
Coal Tar at Manufactured Gas Plants
Coal tar may form both LNAPL [“floaters”] and DNAPL [“sinkers”]
the NAPL will probably wet the soil
most NAPL will be residual phase
remediation by waterflooding is limited by viscous fingering [µw<µNAPL]

17
Characteristics of the Bloomington Site
Coal tar viscosity : 65 cP Mostly a DNAPL but some naphthalene-
rich LNAPL is also present The (aqueous) benzene concentrations
are the risk driver depth to water: 10 feet ~20-ft thick aquifer fining upward alluvium with basal coarse
sand average hydraulic conductivity ~5x10⁻³
cm/s

18
Soil Boring Log

19
50-60% coal tar recovery
85-90% coal tar recovery
Column Study Results: The Effect of Polymers
Polymer/ surfactant flood
Surfactant flood
Flo
w d
irec
tion

20
Surfactant System
4% Alfoterra 123-8 PO-Sulfate 8% Secondary Butyl Alcohol 0.13% Xanthan gum biopolymer 0.08% Calcium Chloride
21
0%
10%
20%
30%
40%
50%
60%
70%
0 1 2 3 4 5 6
Time (days)
Su
rfac
tan
t R
eco
ver
y
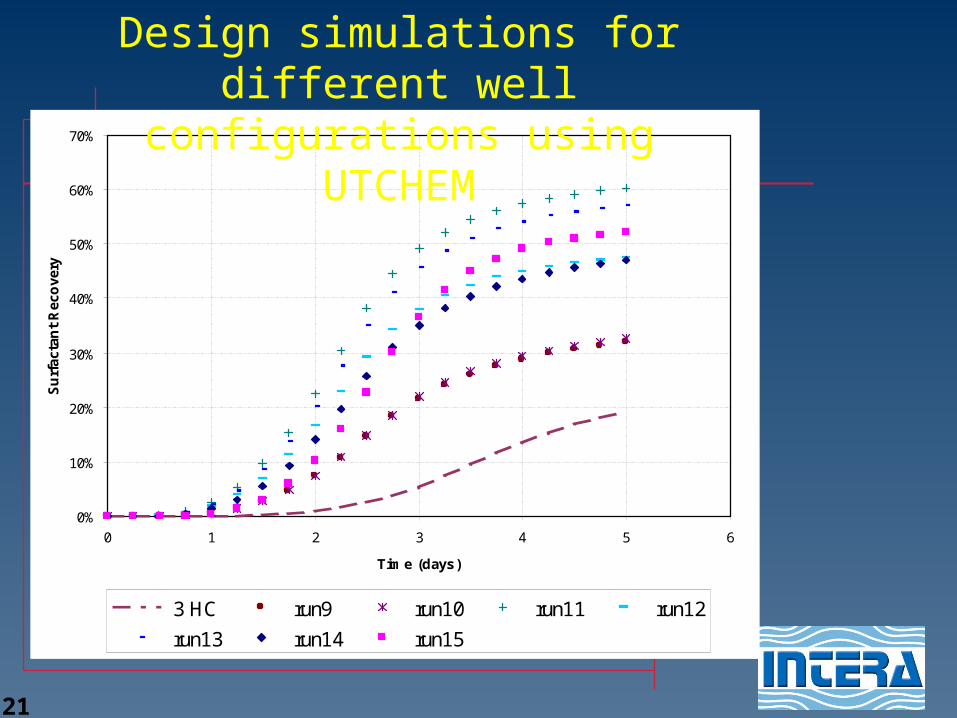
3 HC run9 run10 run11 run12
run13 run14 run15
Design simulations for different well configurations using UTCHEM

22
Piezometric Surface during Floodnatural grad = 0.001imposed grad = 1.7 (60º)
23
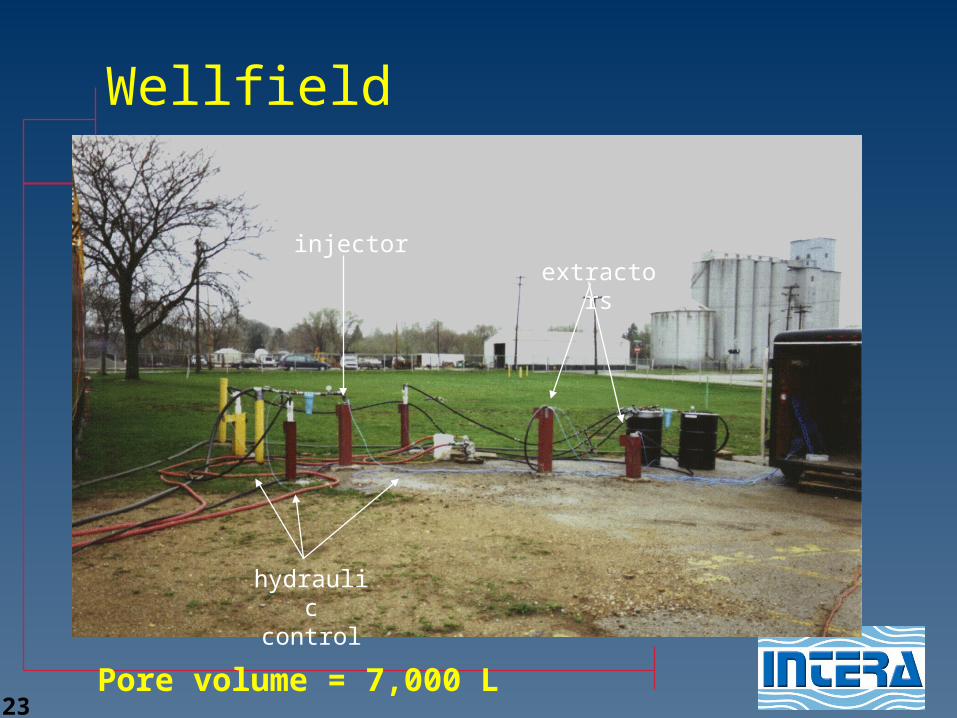
Wellfield
extractorsinjector
hydraulic control
Pore volume = 7,000 L

24
Temperature History

25
0
2
4
6
8
10
12
14
16
18
0 12 24 36 48 60 72 84 96
Flo
w R
ate
[L
/ min
]
Elapsed Time [hours]
Pumping Rates during the Surfactant Flood
surfactant flood post-flood
EX-1 {inboard extractor}
EX-2 {outboard extractor}
Polymer breakthrough reduces Q

26
4/11
080
0
4/11
120
0
4/12
080
0
4/12
150
0
4/12
180
0
4/13
080
0
4/13
180
0
4/14
111
5
4/14
170
0
4/15
080
0
Flood begins 04/11 1000 Post-Flood begins 04/14 0300
Samples from EX-1

27
1
10
100
1,000
10,000
0 12 24 36 48 60 72 84 96
Coal Tar Solubilization at Well EX-1
Elapsed Time [hours]
Sol
ubili
zed
Coa
l Tar
Con
stitu
ents
[m
g/L
]
surfactant flood post-flood
solubility enhanced by heating
ambient coal tar solubility

28
4/11
080
0
4/12
000
0
4/12
080
0
4/12
120
0
4/12
150
0
4/12
180
0
4/12
202
8
4/13
120
0
4/14
030
0
4/14
170
0
4/15
080
0
Flood begins 04/11 1000 Post-Flood begins 04/14 0300
Samples from EX-2

29
1
10
100
1,000
10,000
0 12 24 36 48 60 72 84 96
surfactant flood post-flood
Sol
ubil
ized
Coa
l Tar
Con
stit
uent
s [
mg/
L]
Coal Tar Solubilization at Well EX-2
Elapsed Time [hours]
ambient coal tar solubility
solubility enhanced by heating

30
Coal-Tar Recovery
2,621 L free-phase by mobilization
305 L of residual by solubilization Total recovery=2,926 L
– i.e., 42% of the 7,000 L test pore volume

31
Performance Assessment
Conducted by on-site contractors – [Burns & McDonnell, Oak Brook IL]
Before and after soil sampling indicated removal of – 92% of benzene and – 86% of PAHs

32
SEAR is Cost Competitive
Estimate for SEAR at Bloomington:~$95 / yd3 of aquifer volume
Typical excavation/disposal costs:~$100 - $150 / yd3
(both estimates are based on excavated yardage)

33
Summary
Heterogeneities in alluvium and fractured rock can be overcome by controlling the injectate viscosity1. Surfactant-foam flooding2. Polymer flooding3. Surfactant-polymer flooding

34
Path Forward
Coupling Pressure Pulse Testing with surfactant-polymer flooding for creosote removal at Cape Fear NC
Use of polymer to push biostimulants or oxidants into low-perm units following surfactant flooding