model based methods for improved maintainability and...
TRANSCRIPT
1
Model-based methods for improved maintainability and safety Master of Science Thesis in Secure and Dependable Computer Systems
VAMSI KRISHNA SESHABHATTARU Department of Computer Science and Engineering Chalmers University of Technology, Göteborg, Sweden November 2011

2
The Author grants to Chalmers University of Technology and University of Gothenburg the non-exclusive right to publish the Work electronically and in a non-commercial purpose make it accessible on the Internet. The Author warrants that he/she is the author to the Work, and warrants that the Work does not contain text, pictures or other material that violates copyright law. The Author shall, when transferring the rights of the Work to a third party (for example a publisher or a company); acknowledge the third party about this agreement. If the Author has signed a copyright agreement with a third party regarding the Work, the Author warrants hereby that he/she has obtained any necessary permission from this third party to let Chalmers University of Technology and University of Gothenburg store the Work electronically and make it accessible on the Internet. Model-based methods for improved maintainability and safety VAMSI KRISHNA SESHABHATTARU © VAMSI KRISHNA SESHABHATTARU, November 2010 Supervisor: Henrik Hagström, Volvo 3P Examiner: Prof. Jörgen Hansson Chalmers University of Technology Department of Computer Science and Engineering SE-412 96 Göteborg Sweden Telephone + 46 (0)31-772 1000 Department of Computer Science and Engineering Chalmers University of Technology, Göteborg, Sweden November 2011

3
Abstract
As technology improves by each passing day, so does its use in the automotive industry. Modern vehicles are designed with an increasing number of electronic components ranging from electronic control units, sensors and actuators, anti-lock breaking systems, and a host of other applications, increasing the complexity of the overall system. Reliability, safety and maintainability are among the three main areas of importance that need to be considered when designing electrical systems for road vehicles. The various methods implemented for system analysis also need to be updated on a regular basis as the complexity of the electrical systems implemented is ever increasing. One of the methods which is fast gaining importance is the model-based approach for system analysis. Model-based methods provide an easier way of system analysis through visual representations of physical components. Model-based methods are used for simulating, in a visual way, the desired behaviour of the electrical systems as well as the failure behaviour of the electrical systems.
This master thesis mainly investigated the use of the model-based system-reasoning tool RODON during early design phases for system analysis. The thesis work has special focus on the usage of RODON tool for FMEA analysis and generation of diagnostic requirements, which need to be implemented in the target system. The capabilities of the RODON tool for doing reliability analysis have also been investigated. Different models with varying levels and techniques were developed to explore the results that can be achieved from the tool. A comparative analysis of the reliability analysis results achieved through the tool-based approach was compared to the results achieved through manual based methods. The use of RODON for various system analysis methods suggested in the upcoming functional safety standard ISO26262was also explored.

4
Acknowledgments
I would like to start by thanking my master program co-ordinator Roger Johansson who was very helpful before and during my thesis. I would also like to thank all the members of the real-time and fault tolerant research group who have been very helpful in improving my knowledge and interest in the field of real-time and fault tolerant systems. I would also like to thank my examiner Jörgen Hansson. I would like to thank him for giving me tips and suggestions on different ways of organizing work and planning of work. He also taught me the importance of being focussed, clear and precise in different aspects of work including during meetings, discussions, self-analysis, reports, and planning. I want to thank a few people at Volvo 3P who have helped me complete my thesis work successfully. I would like to start by thanking the three people who believed I was capable of doing a good job in this thesis, namely my supervisor Henrik Hagström, my manager Michael Blackenfelt and Petter Hagberg for the first discussion and interview at Volvo. I would specially like to thank Henrik Bengtsson, Burkhard Muenker and Olle Isaksson for being patient with me and helping me a lot to deal with all my model-based development issues and problems. A special thanks to Beate Frey for the initial training in the RODON tool. It goes without mentioning that it was fun to be around with Mattias, Sofie, Michael, Anders, and the others around who made working much easier and fun filled. Thank you all.. Last but not the least, I would like to thank all my friends and family who have supportive during the course of the thesis. A special thanks to Seshendra, Lobhas, Subir, Graciano, Jenny, Kashyap and all the others who have been very helpful and supportive during the course of the thesis. Thank you all.
5
CONTENTS
Chapter 1 Introduction 6 1.1 Problem Description 6 1.2 Objectives of Project 6 1.3 Report Structure 7
Chapter 2 Theory 8 2.1 Product Development Life Cycle 8 2.2 System Architecture – Vehicle Electronic Systems 8 2.3 On-Board Diagnostics Information System 9 2.4 Diagnosis, Model-Based Diagnosis and Diagnostic Requirements 10 2.5 Failures in the System, Fault Codes and FMEA Analysis 11 2.6 Hazard Analysis 11 2.7 Reliability Analysis 12 2.7 Functional Safety and ISO 26262 13
Chapter 3 Introduction To RODON 15 3.1 RODON Tool Features 15 3.2 Developing Models in Composer Module 15 3.4 Simulation and Model Diagnosis Using Analyzer Module 20 3.5 Auto-Simulation and Database Generations Using AutoSim Module 21 3.6 Analysis of State Databases Using SDBView Module 22 3.7 Reliability Module 22
Chapter 4 Generation of Diagnostic Requirements from Models Developed During Early Design Phases 23 4.1 Background 23 4.2 Development of Model for Simulation and Analysis 23 4.3 Special Considerations during Modelling 25 4.4 FMEA Tables and Diagnostic Requirements 25
Chapter 5 RODON and Reliability Analysis 27 5.1 Background 27 5.2 Detailed Model Developed for Generating Reliability Block Diagrams, Fault Trees and FMEA Analysis 28 5.3 Generic Reliability Model for Calculation of Probabilistic Failure Rates 31 5.4 Reliability Analysis of System Using Reliability Module 32 5.5 SDBView and Reliability Analysis 35
Chapter 6 Modelling Summary 37 6.1 Early Design Phase Modelling Comparison Tables 37 6.2 A Comparative Study of Early Design Modelling and Late Phase Modelling 38
Chapter 7 ISO 26262 and RODON 41
Chapter 8 Manual Analysis Vs. Model-Based Analysis 42
Chapter 9 Summary 43
References 45

6
Chapter 1 Introduction
1.1 Problem Description Modern vehicle technology is based on distributed systems with ever-increasing electronic components like electronic control units, sensors and actuators, thus increasing the complexity of the overall system. Reliability, safety and maintainability are the three main areas of importance, which need to be considered when designing electrical systems for road vehicles. It is of prime importance for the electrical systems to be reliable as electronics and electrical parts directly or indirectly control a lot of vehicle functionality installed. The effects of the electronics and electrical parts on other electrical components and the overall vehicle also need to be investigated comprehensively to improve the overall reliability of the systems. The increasing complexity in electronic systems is also increasing the difficulty of fault tracing them. On-board diagnostics and off the board fault tracing methods help identifying the system faults and system failures. This information can be used for identifying faulty components and taking necessary actions. Fault tracing of system faults is part of the work carried out by the System Design and Diagnostics team in Volvo 3P. Model-based diagnostics is one of the methods used for fault tracing of electronic systems. In the model-based approach, the system functionality is simulated in a visual way including the desired nominal behaviour of the electrical systems as well as the failure behaviour of the systems. A model-based reasoning tool RODON [3], developed by Sorman Information and Media AB [11], is used for generating fault tracing information for the various sub-systems in the vehicle. Currently, the model-based diagnostics work is carried out in the late design phases of the life cycle. The fault tracing information that is generated by the model-based diagnostics team is useful for the workshop technicians for trouble-shooting and fault tracing in vehicles. However, this does not help in the improvement of the system design or for generating early diagnostic requirements. This can be attributed to the fact that the work is carried out late in the life cycle, when the design details of the system function have already been frozen and making changes to them is usually very expensive.
1.2 Objectives of Project The main objective of the project work is exploring the RODON tool for developing and analysing the system models during early design phases, such as the pre-study and concept phases. To elaborate, this thesis explores the following objectives: • The extraction of diagnostic requirements during the earlier phases of development
through model-based reasoning of the system function • Various kinds of reliability analysis which can be performed using RODON’s Reliability
Analysis module • Comparison of results achieved from the tool with those achieved through traditional
manual methods. This helps to analyse the advantages and disadvantages of each of these methods.
• The possible use of the RODON for the system analysis methods suggested in the upcoming functional safety standard ISO 26262 [10].The standard is divided into ten parts. The scope of the thesis work is restricted to the parts of the standard which cater to

7
the requirements at the system level, namely Part 1(Vocabulary), Part 3(Concept phase) and Part 4(Product development—System Level).
1.3 Report Structure The following chapters of this document look into the different tasks carried out during the course of this project: Chapter 2:A theory chapter briefly explaining the various concepts, which have been addressed in this project work. Chapter 3: An introduction and overview of the RODON tool used for doing modelling work in the project. Chapter 4:This chapter discusses the modelling methodology which was used in developing models required for the generation of diagnostic requirements. The various steps involved in the generation of the diagnostic requirements from models developed during early design phases have also been discussed. Chapter 5:This chapter discusses the different models developed for the purpose of the reliability analysis. It also discusses the various kinds of reliability analysis tests, which can be carried out using RODON. A simple example has been selected to show the various reliability analysis results that can be achieved. Chapter 6:This chapter gives a summary of all the modelling work carried out during the course of the project along with the results and various kinds of analysis done. A comparative analysis of the current model-based diagnostics work carried out at Volvo and that carried out during this project work is discussed in this chapter. Chapter 7:This chapter explores the relation between RODON and ISO 26262. Chapter 8:This chapter briefly discusses the similarities and differences of the results achieved by model-based approach and the manual analysis. Chapter 9:Summary

8
Chapter 2 Theory This chapter introduces the electronic system architecture of Volvo 3P. This chapter also introduces the various concepts that were investigated during the course of the thesis, namely diagnostics, model-based diagnostics, and hazard analysis methods including FMEA [7], FMECA [7], probabilistic failure rate calculations [1], minimal cut sets [6], reliability block diagrams [9] and fault trees [9]. This chapter also has a brief introduction to functional safety and functional safety standard ISO 26262[10].
2.1 Product Development Life Cycle The product development life cycle process in Volvo 3P consists of various phases, which carry the project from the product initiation phase to the end of the project. A simplified life cycle model is shown in Figure 1.
Figure 1: Simplified life cycle model
During the pre-study phase and the conceptualization phase, the basic requirements for developing a system are studied and the basic early design for the system requirements is made. Once the system requirements and the basic design have been frozen, detailed design and development work is carried out in the development phase. Once the development is completed, system deployment and production phase begins which is followed by the maintenance phase. From the model-based diagnostics perspective, the development phase and the phases leading to it are of high importance. The current model-diagnostics related work is carried out in the late development phase, where the system requirements and design have already been frozen. From the thesis perspective, the pre-study and the conceptualization phases are of interest.
2.2 System Architecture – Vehicle Electronic Systems In a highly competitive branch like the automotive industry, product development is continuous. There is a constant demand for improved levels of efficiency and making vehicles more fuel efficient and environment-friendly. Such challenging requirements force the
Conceptualization phase
Pre-study phase
Deployment and Production phase
Maintanence phase
Development phase

9
development of new designs and architectures, which can cater the needs for improved performance of vehicles developed. Using electronics in vehicles has some major advantages compared to mechanical systems. The advantages can be partly attributed to the programmability of the electronic components and their memory capacity where information can be stored when the vehicle is used. This information can be later retrieved for analysis. In order to meet the requirements for better performance, Volvo have come up with a new electronic system architecture or EE-system [5]. The new EE-system is a computerized control and monitoring system that regulates the functions of the truck. A number of Electronic Control Units (ECUs) handle the EE functionality of the truck. An ECU is a microcomputer with a processor, memory and some sensors and actuators connected to it. It monitors the functioning of a truck component based on the information it receives from the sensors and actuators. In the new EE-system architecture, the ECUs are connected to each other in a computer network. The communication occurs through routed cable loops between the control units. The cables are called data links and are based on communication protocols like CAN [12] or LIN [13]. It is important to have a structured procedure for trouble-shooting of control units. A structured procedure can help the technician at the workshop to work efficiently. One of the important steps involved is tracing the course of events that led to the discovery of a fault. If there is a fault in the electronic system, the control unit that indicates the failure sends a fault code to the information link. This can be read by the other control units, which are connected through the same data link. The fault code is stored in the control unit in question until it is deleted. Even though fault codes give information about a fault, fault codes do not provide much information about the overall system behavior during faults. For the analysis of system, behavior there is another method of trouble shooting. This method is called system diagnostics with symptoms. It is mainly used when no fault is indicated via fault codes even though there is a fault. In the symptom-based approach, a possible faulty system behavior is considered and the possible causes of this faulty behavior are investigated in the system.
2.3 On-Board Diagnostics Information System The On-Board Diagnostics (OBD) function has been selected for design, development and testing for this project work. On-Board Diagnostics is one of the several functions of the truck. The OBD system handles emission related issues like catalytic reductions and storage of emission related information. The main functionalities related to the OBD system are:
• Activation of an indication lamp for alerting the driver of emission related faults. • Monitoring of components and systems influencing emissions significantly. • Storage of information that identifies the faulty component or system and the type of
malfunction that has occurred. • To read out emission values during vehicle checks in the field and roads by governing
agencies conducting pollution inspection checks. A group of electronic control units, which communicate with each other through different CAN interfaces, implements the OBD functionality. The CAN interfaces are selected based on the information which needs to be sent. There are also a few sensors connected to the

10
different control units. There is also a warning lamp installed in the Instrument Cluster ECU, which needs to be illuminated in case of any mal-functioning in the function. The Instrument Cluster ECU is responsible for the display of vehicle information to the driver. The displayed information can range from vehicle speed, distance travelled, fuel reserves in the tank, warnings if something is wrong in the vehicle. The amount of information shown on the display is based on the level of instrumentation present in the Instrument Cluster. The instrument cluster can be equipped with simple, medium or high level instrumentation depending on the truck model. Please note that the OBD system is just one of the several functions in the vehicle. It does not cater to the diagnostic issues of the complete truck even though the name says On-Board Diagnostics. The OBD function handles the emission related functionality only.
2.4 Diagnosis, Model-Based Diagnosis and Diagnostic Requirements Diagnosis in simple terms can be considered as a method of finding symptoms and possible ways a system can fail or has failed. The primary diagnosis problem is detecting a fault in a system and then locating the possible cause of the failure. Fault detection can be carried out in several ways like comparing expected values with actual values or using a set of diagnostic rules developed based on the application and needs. There are different tools and methods which can be used to perform diagnostic analysis of automotive systems. Some of the methods involve testing the actual vehicle for faults and trying to find out the causes of these failures. Tools like TechTool are under use in Volvo for diagnostic purposes. Some methods are using software tools for diagnosis of the system failures. The diagnostic method used for this project work is model-based diagnosis. The general steps involved in model-based diagnosis [8] include developing visual models of the system under consideration and doing simulations and analysis of the developed models. In general, the models are developed and simulated for nominal behaviour. Nominal behaviour is that the system is working without any problems. After the model is considered representing the required functionality of the system, the observed failure conditions of the actual system are inserted into the model and the behaviour of the various components of the system are observed and analysed. In the process of investigating, the possible components of the system which can cause system failure are traced. Based on the results, necessary actions can be taken. A model-based approach supports simulating the system in possible failure conditions and the system behaviour can be ascertained. RODON, a model-based reasoning tool is currently used in the System Design and Diagnostics team at Volvo 3P for generating fault tracing information, which is used in this project. More information about the tool is provided in the next chapter. Diagnostic requirements are a set of requirements for a function (system), specific to the diagnostic needs of the system. Diagnostic requirements are based on the fault codes to be included in the system for optimal diagnosis of the system. There are some general fault codes like electrical faults and internal faults, which need to be included in the system. However, some more fault codes based on the components of a function need to be added. For example, let us consider a speed sensor that is connected to a control unit 1. Control units in the system which need the speed sensor value will be waiting for the value to be updated by the control unit connected to the speed sensor. Hence, if the sensor is faulty, then the control unit 1 needs to update the other control units about the same. In such a scenario, there is a

11
possibility of having a fault code associated with the speed sensor behavior in the control unit 1. The status of this fault code is made available to all control units that are connected through the network.
2.5 Failures in the System, Fault Codes and FMEA Analysis In general electrical systems with many components like ECUs, sensors, wires, and data-links like CAN and LIN are very complex. The possibility of components failures need to be addressed during the development phase. In such a scenario, diagnosis (see section 2.3) plays an important role. In model-based diagnostics, one of the important methods implemented for diagnostics is by fault tracing failures in the system with the help of fault codes and system analysis. For example, if a sensor connected to a ECU fails, then the fault code related to the failure must be shown in the FMEA table. If this fault code is present in the FMEA table, it can be considered that with the current system design it is possible to generate fault codes if a failure occurs. This is the same for all the components in the system. All fault codes are communicated through the data links in the system. If there was an error in the data link interface of a control unit, it would not be able to communicate with the other control units. In such a scenario, a ‘communication lost’ fault code must be set in the other control units. If there is an internal error in a control unit, it would not be able to communicate or function correctly and this information needs to be communicated. This would enable the other control units to take necessary action in such a scenario. Electrical faults like ‘short to ground’ faults, ‘short to open’ faults, ‘open circuit’ faults in the wires and pins of the control units and need to be taken into account when a design is made. All communication including the information regarding faults and fault codes need to be communicated through the data links. Therefore, if there is a fault in the data link, then proper communication is lost. It is also possible that there is physical failure of the data link and the complete communication is lost. If a fault code is triggered, the possible root causes of the failure are investigated and the impact of a component failure on the system is investigated. For such a purpose, FMEA analysis is very useful. RODON can be helpful in conducting such analysis. This is discussed in subsequent chapters.
2.6 Hazard Analysis “A hazard is a situation in which there is actual or potential danger to people or the environment.” – [1] Hazard analysis [1] is a name given to a range of techniques used for providing different insight into the characteristics of the system under investigation. Some of the hazard analysis techniques under investigation in the course of this project are mentioned below.
12
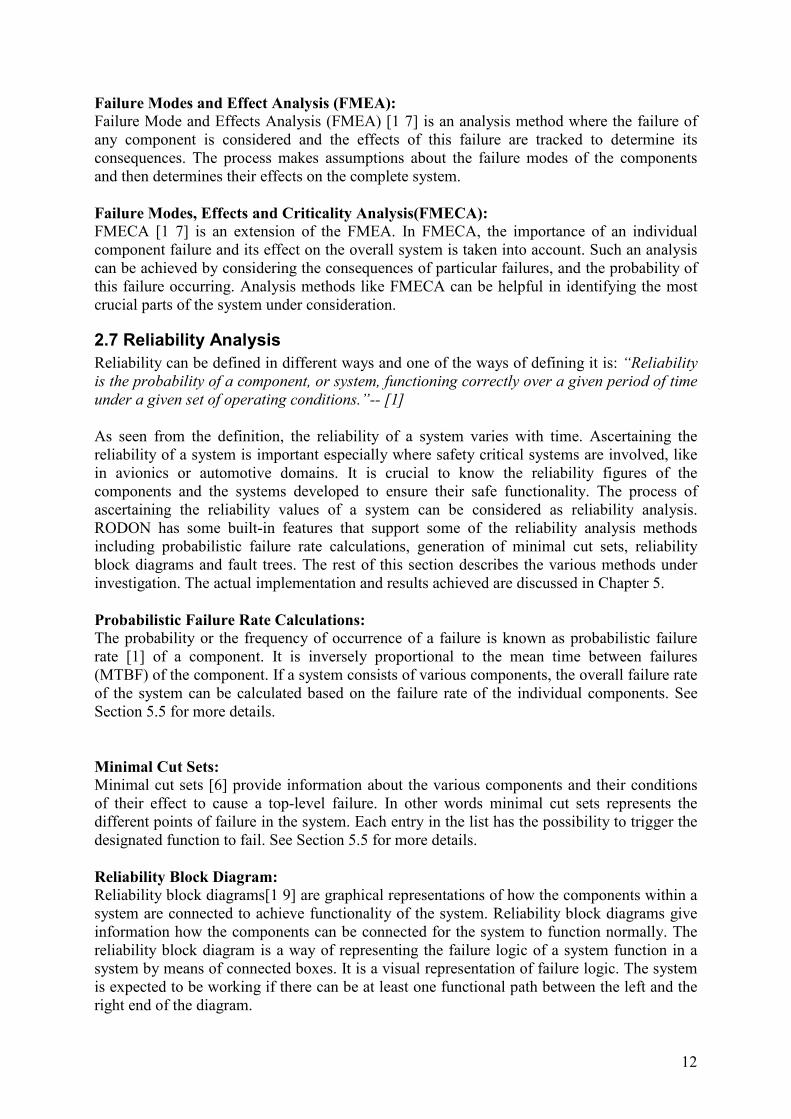
Failure Modes and Effect Analysis (FMEA): Failure Mode and Effects Analysis (FMEA) [1 7] is an analysis method where the failure of any component is considered and the effects of this failure are tracked to determine its consequences. The process makes assumptions about the failure modes of the components and then determines their effects on the complete system. Failure Modes, Effects and Criticality Analysis(FMECA): FMECA [1 7] is an extension of the FMEA. In FMECA, the importance of an individual component failure and its effect on the overall system is taken into account. Such an analysis can be achieved by considering the consequences of particular failures, and the probability of this failure occurring. Analysis methods like FMECA can be helpful in identifying the most crucial parts of the system under consideration.
2.7 Reliability Analysis Reliability can be defined in different ways and one of the ways of defining it is: “Reliability is the probability of a component, or system, functioning correctly over a given period of time under a given set of operating conditions.”-- [1] As seen from the definition, the reliability of a system varies with time. Ascertaining the reliability of a system is important especially where safety critical systems are involved, like in avionics or automotive domains. It is crucial to know the reliability figures of the components and the systems developed to ensure their safe functionality. The process of ascertaining the reliability values of a system can be considered as reliability analysis. RODON has some built-in features that support some of the reliability analysis methods including probabilistic failure rate calculations, generation of minimal cut sets, reliability block diagrams and fault trees. The rest of this section describes the various methods under investigation. The actual implementation and results achieved are discussed in Chapter 5. Probabilistic Failure Rate Calculations: The probability or the frequency of occurrence of a failure is known as probabilistic failure rate [1] of a component. It is inversely proportional to the mean time between failures (MTBF) of the component. If a system consists of various components, the overall failure rate of the system can be calculated based on the failure rate of the individual components. See Section 5.5 for more details. Minimal Cut Sets: Minimal cut sets [6] provide information about the various components and their conditions of their effect to cause a top-level failure. In other words minimal cut sets represents the different points of failure in the system. Each entry in the list has the possibility to trigger the designated function to fail. See Section 5.5 for more details. Reliability Block Diagram: Reliability block diagrams[1 9] are graphical representations of how the components within a system are connected to achieve functionality of the system. Reliability block diagrams give information how the components can be connected for the system to function normally. The reliability block diagram is a way of representing the failure logic of a system function in a system by means of connected boxes. It is a visual representation of failure logic. The system is expected to be working if there can be at least one functional path between the left and the right end of the diagram.

13
Fault Trees: Fault trees [1 9] are a graphical representation of the system with a top-down approach and represent the paths within a system, which can cause undesirable effects or failure of the system. Fault trees are a method of determining the probability of a top event failing. This is done by evaluating the failure logic expressed by Boolean relations between the various lower level events and the failure rates of the components involved. The fault tree analysis has a top-down approach with the top representing the failure condition of the top-level event.
2.7 Functional Safety and ISO 26262 Functional safety can be defined as part of the overall safety that depends on a system or equipment operating correctly in response to its inputs. It is important to differentiate between functional safety and functionality of a system. They are two different aspects of a system. Functional safety relates to the improvement of the safety of the system whereas functionality relates to the correctness of the system. It is important to take into account that the development of functions and functional safety should be conducted simultaneously. This is important because it is generally costly to add functional safety features late in the development process. There are various functional safety standards catering to the different domains like automotive, avionics, chemical and medical. ISO 26262[11] is an upcoming standard for functional safety in road vehicles and is developed by the International Organization for Standardization (ISO). ISO 26262 is applicable to the development of all electrical and electronic systems related to safety. The standard is being developed in collaboration with automotive OEM’s and suppliers. ISO 26262 is primarily targeted for safety related systems with one or more E/E systems installed in the vehicle. The standard also deals with the possible hazards caused by the malfunctioning of E/E safety-related systems and the interaction of these systems. also It also addresses the whole life cycle of an E/E system i.e. concept phase, design phase, production phase, operation phase, maintenance phase and decommissioning phase. This is intended to lead to the required functional safety of an E/E system. ISO 26262 is intended to reduce the increasing risks from system failures and random hardware failures. The standard provides appropriate requirements and processes dedicated for decreasing risks in automotive development. Along with this, the standard also provides a framework within which safety related systems based on other technologies could be considered.
Some of the salient features of the ISO 26262 standard are: • Provides an automotive safety lifecycle (management, development, production, operation,
service, decommissioning) and supports tailoring of the necessary activities during these
lifecycle phases.
• Provides an automotive specific risk-based approach for determining integrity levels
(Automotive Safety Integrity levels or ASILs).
• Provides requirements for validation and confirmation measures to ensure a sufficient and
acceptable level of safety.
14
• Provides requirements for the relation with suppliers.
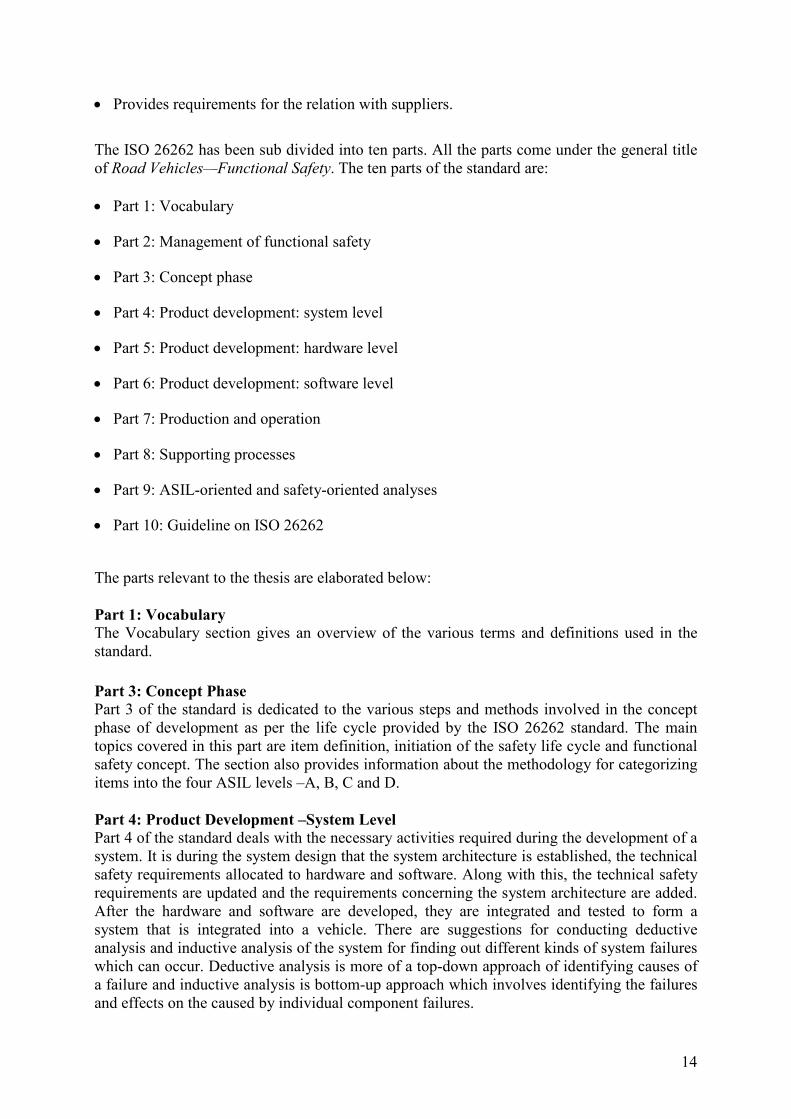
The ISO 26262 has been sub divided into ten parts. All the parts come under the general title of Road Vehicles—Functional Safety. The ten parts of the standard are:
• Part 1: Vocabulary
• Part 2: Management of functional safety
• Part 3: Concept phase
• Part 4: Product development: system level
• Part 5: Product development: hardware level
• Part 6: Product development: software level
• Part 7: Production and operation
• Part 8: Supporting processes
• Part 9: ASIL-oriented and safety-oriented analyses
• Part 10: Guideline on ISO 26262
The parts relevant to the thesis are elaborated below: Part 1: Vocabulary The Vocabulary section gives an overview of the various terms and definitions used in the standard. Part 3: Concept Phase Part 3 of the standard is dedicated to the various steps and methods involved in the concept phase of development as per the life cycle provided by the ISO 26262 standard. The main topics covered in this part are item definition, initiation of the safety life cycle and functional safety concept. The section also provides information about the methodology for categorizing items into the four ASIL levels –A, B, C and D. Part 4: Product Development –System Level Part 4 of the standard deals with the necessary activities required during the development of a system. It is during the system design that the system architecture is established, the technical safety requirements allocated to hardware and software. Along with this, the technical safety requirements are updated and the requirements concerning the system architecture are added. After the hardware and software are developed, they are integrated and tested to form a system that is integrated into a vehicle. There are suggestions for conducting deductive analysis and inductive analysis of the system for finding out different kinds of system failures which can occur. Deductive analysis is more of a top-down approach of identifying causes of a failure and inductive analysis is bottom-up approach which involves identifying the failures and effects on the caused by individual component failures.
15
Chapter 3 Introduction To RODON RODON is a model-based reasoning tool used for system modelling and analysis of systems, developed by Sörman Information AB. RODON is component-oriented, object-oriented, non-domain specific and local (i.e. context-independent). Rodelica is the language used for programming in RODON. A model in RODON reflects the physical relations between the real system components. The model also takes into consideration the nominal and the faulty behaviour of the target system while doing analysis.
3.1 RODON Tool Features The RODON tool consists of various features with specific functionalities. The features of interest for this project and their functionalities are given in Table 1.Using the features mentioned in Table 1, it is possible to develop models, simulate and analyse models and finally view the simulated results in various formats based on the analysis to be performed. Table 1: RODON modules and functionalities
3.2 Developing Models in Composer Module The Composer module is used for developing models. The tool has a list of functional features used for modelling. Table 2 gives a brief description of the various types of modelling which have been done during the project.
Table 2: Features of Composer
Type of classes / models to be developed
Brief description Rules to do modelling
Package For structuring of hierarchical libraries
A package may only contain declarations of constants and declarations of inner classes and must not be usedas an instance in other classes.
Model For declaration of model classes
No restrictions.
Connector For declaration of ports (interfaces):
Neither the class itself nor one of its attributes may contain a behavioral description.
Feature Main Functionality /Usage Composer Developing models
Analyzer Simulating the models SDBView Viewing simulated results in different formats like Simulation Tables and
FMEA tables
Reliability Reliability analysis based on the MTBF values
16
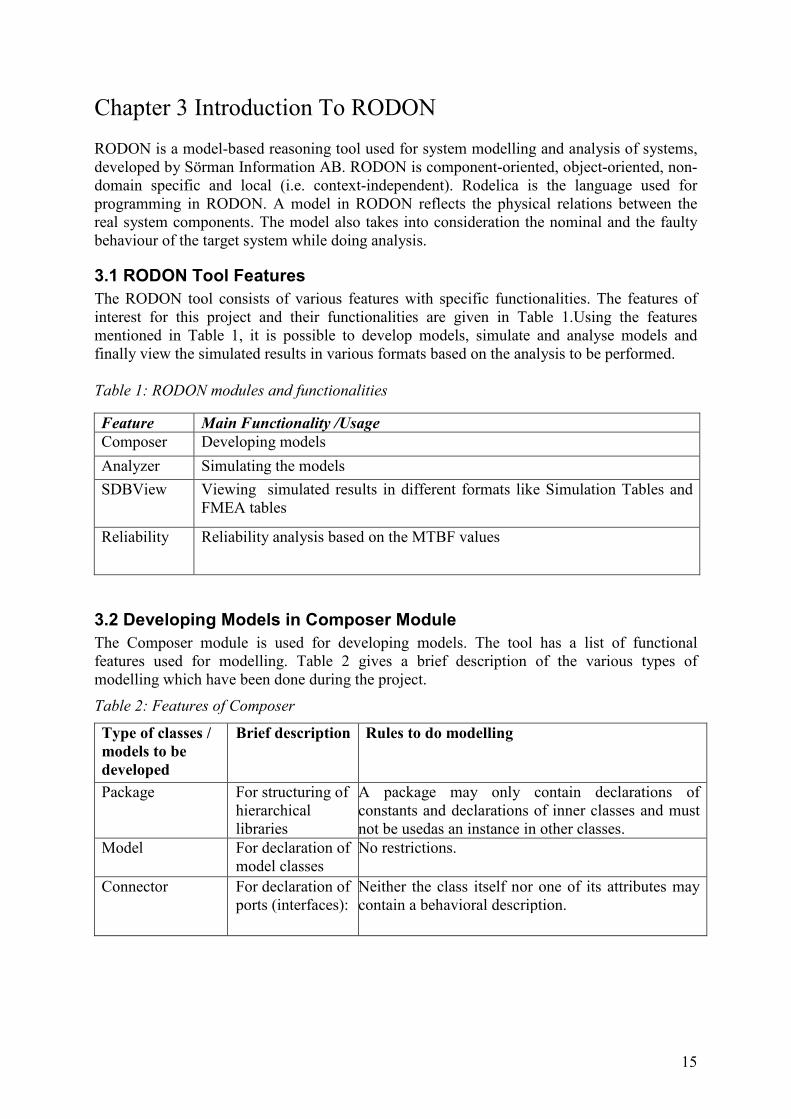
Developing Models in Composer for Model-Based Diagnostics: Developing models in Composer follows the same basic steps irrespective of what the purpose of the model is. A model can be created graphically by dragging and dropping component classes from the library or by textual programming. The object-oriented feature of RODON is helpful during modelling. There are some base classes provided in the default libraries provided with the tool. With the help of the inheritance feature, it is possible to create new altered class abstractions of already existing component base classes. These new classes can then be used in various places in the model as per requirements. For example, if a model contains a lot of wires which have the same resistance and parameters, then it is enough to create one class abstraction of this model and then the same class can be reused in all the places where this wire needs to be modeled. The main purpose of creating models in RODON is for system analysis. The analysis could be for diagnostic purposes or for performing reliability analysis. In models created for diagnostic analysis the emphasis lies on the system failures, component failures and their effects on the overall systems. In models created for reliability analysis the emphasis is on performing reliability analysis like probabilistic failure rate calculations, reliability block diagrams and fault trees. The creation of a model involves selection of components based on the requirements, defining the attributes of a model, defining how a component should behave and making inter-connections between components for capturing the data flow between components. The rest of this section explains the creation of a model in RODON. For the ease of explanation, a simple wire circuit consisting of a simple battery, a wire, a resistance and a ground node has been selected as an example. In a nominal case, there will be a voltage drop across the resistance, which acts a load. There can be various failure conditions in the circuit like low battery or open circuits or short circuits. At this point the main interest lies in the creation of a model and the various steps to be taken into consideration in the process. Figure 2 shows a model developed in RODON for the simple wire circuit. The equivalent Rodelica code is also shown. It is built up by a simple 12V battery, wire, resistor of 100 ohms and a ground point connected in series. All components are in the model have a nominal fault free behavior. In a nominal scenario, the battery supplies 12 Volts, the ground node has 0 volts, the voltage at both ends of a wire is same and the resistance follows Ohm’s law.
17
Figure 2: A simple wire circuit model in RODON
Connectors, Inter-Connections and Signal Flows in Models: An electrical circuit is based on the flow of current through the various components in the circuit. All components in an electrical circuit have a voltage u, measured in volts and current i measured in amperes. Resistors, capacitors and inductors can also be part of the circuit. These components are useful in controlling the flow of currents and voltages in the circuit. When modelling an electrical circuit, it is important to capture the correct flow of signals and currents within the circuit to enable the model to work correctly. This is done with the help of inter-connections between the various components of the circuit. Inter-connections can be made with the help of connectors present in each component of the model. A connector is a type of class in RODON. A connector is used to connect the different components of the model. For each connection made in the model, the corresponding equations defining propagation of signals between the connectors is generated. The connections made can be seen in the behavior part of the Rodelica code in Figure 2. This indicates the ports or connectors which are connected and the direction of the flow of data. Property Marks: Property marks are used for assigning specific roles to the model attributes. Property marks are useful for analysis purposes. For instance, if there is an analysis required to be carried out on a component in the model, the component can be tagged to a property mark. After a component is tagged with a property mark, it is possible to observe the component’s behavior with respect to the property mark when doing simulation and analysis of the model in the Analyzer (see Section 3.4). Property marks can be tagged to either inputs or output signals. Property marks can be used for a value of a control signal, an observation, for defining a component’s behavior mode or as a flag for a particular test that has been conducted like a fault code test. For example, if we need to make a resistance measurement across the wire, we can have a property mark as t-cont or t-short on the wire component. t-cont is for doing a continuity check across the wire, t-

18
short is for testing the short to ground of the wire. Some of the commonly used property marks in the model-based diagnostics team along with brief descriptions are shown in Table 3.
Table 3: Property marks
Property marks S.No Property mark Usage
Input property marks 1 Sw Switch : For variables which represents electrical switches 2 Fm Failure mode: Behavioral model. Representing the component
behavioral mode e.g. ok, stuck error.
Output property marks 3 Obs Observation: Used for variable which represent observable
quantity. e.g. fuel level in tank 4 t-vis t-visual: result of a manually visual check e.g. messages/
indications on driver interface. 5 t-cont t-continuity: continuity checks on a wire 6 t-short t-short: short to ground test of a wire 7 ohmic Resistance measurement across a component 8 v-m-p Voltage measurements across a component. Developing Models in Composer for Reliability Analysis:
The main difference in developing models for diagnostics and models for reliability is the selection of components used in the models. Since the characteristics and the attributes of the components used differ, so does their behavior. The reliability models use components from the reliability (OptRel) library. In reliability models, all components are Boolean in nature. This means a component is either working (ok) or not working (not_ok). Reliability models are of interest for conducting reliability analysis of systems. Reliability analysis methods supported by RODON include probabilistic failure rate calculations, reliability block diagrams, fault trees and minimal cut sets. Reliability calculations and analysis are based on the failure rates of components. In RODON, the MTBF or Mean Time Between Failures values are used. In reliability terms, MTBF and failure rate of a component are inversely proportional.
MTBF = 1/ Failure Rate
The reliability modelling equivalent of the simple wire circuit shown in Figure2 is shown in Figure 3. In the model shown in Figure 3, the emphasis lies in calculating the overall reliability of the system, based on the failure rates of the individual components of the system. The components are selected from the OptRel library and each block in the figure corresponds to a part of the circuit shown in Figure 2. Reliability calculations are further discussed in Chapter 5.

19
Figure 3: Reliability model for a simple wire circuit
Attributes and Parameterization of Components: Attributes are parameters which are associated with a component. For example, the main attributes of a wire would be the current, voltage, resistance and failure modes. For a component from the reliability library, the attributes would be MTBF, mass and dimensions. Once a component is dropped in the layout window, it is possible to change the parameters of the component. For changing parameters, double click on the component to open the attributes tab of the component. In the attributes tab it is possible to find the definition of the component, its parameters and its failure rate (for reliability models) and failure modes (for diagnostic models). The various parameters of the simple wire circuit model from Figure 3are shown in Figure 4 below. For example, the resistance Resistor_100_Ohms has two connector’s p1 and p2. The attributes at each of these connectors include the display name, the current i, voltage u and the nominal resistance valuerNom. The values of these parameters can be modified as per the requirements of the model. For example, the nominal resistance value was selected as 100 Ohms and is displayed as rNom. Similarly, the various attributes and parameters of the other components of the system can be viewed and changed from this tab view. This feature is useful when a component is used at different places in the model. For example, there can be three resistances in the circuit with different values. The resistance values can be changed by simply opening the attributes and parameterization tab and changing the values.

20
Figure 4: Attributes tab
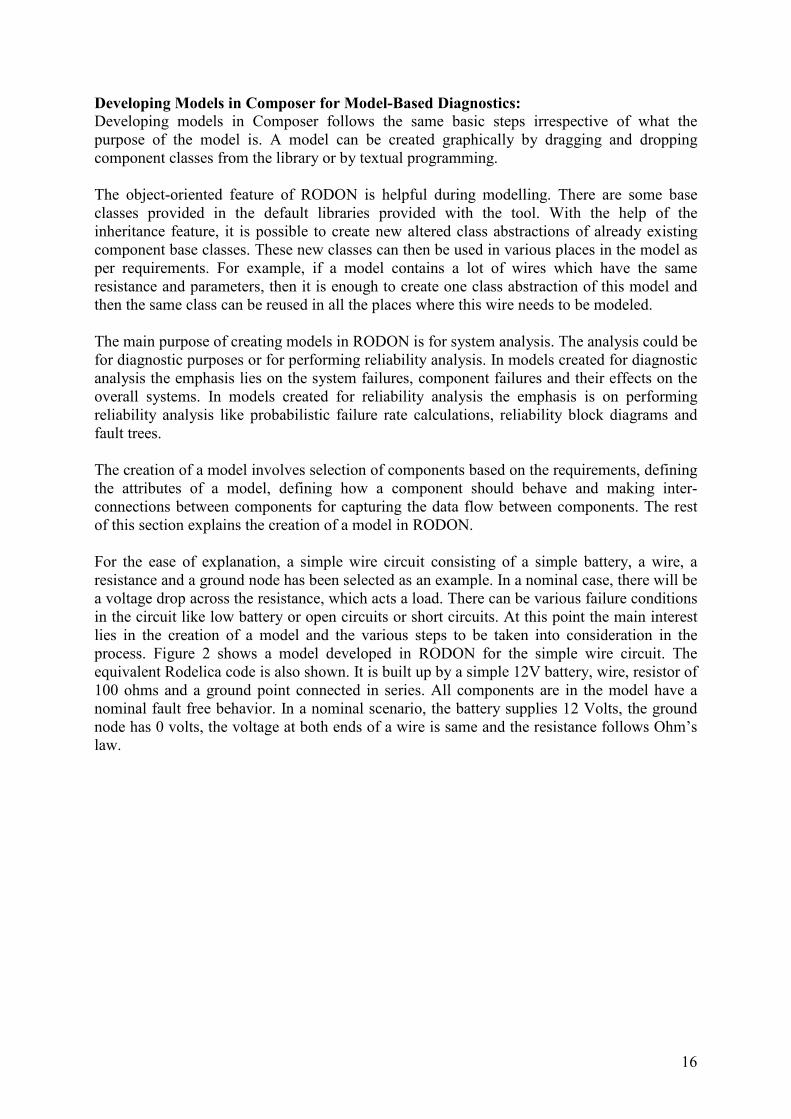
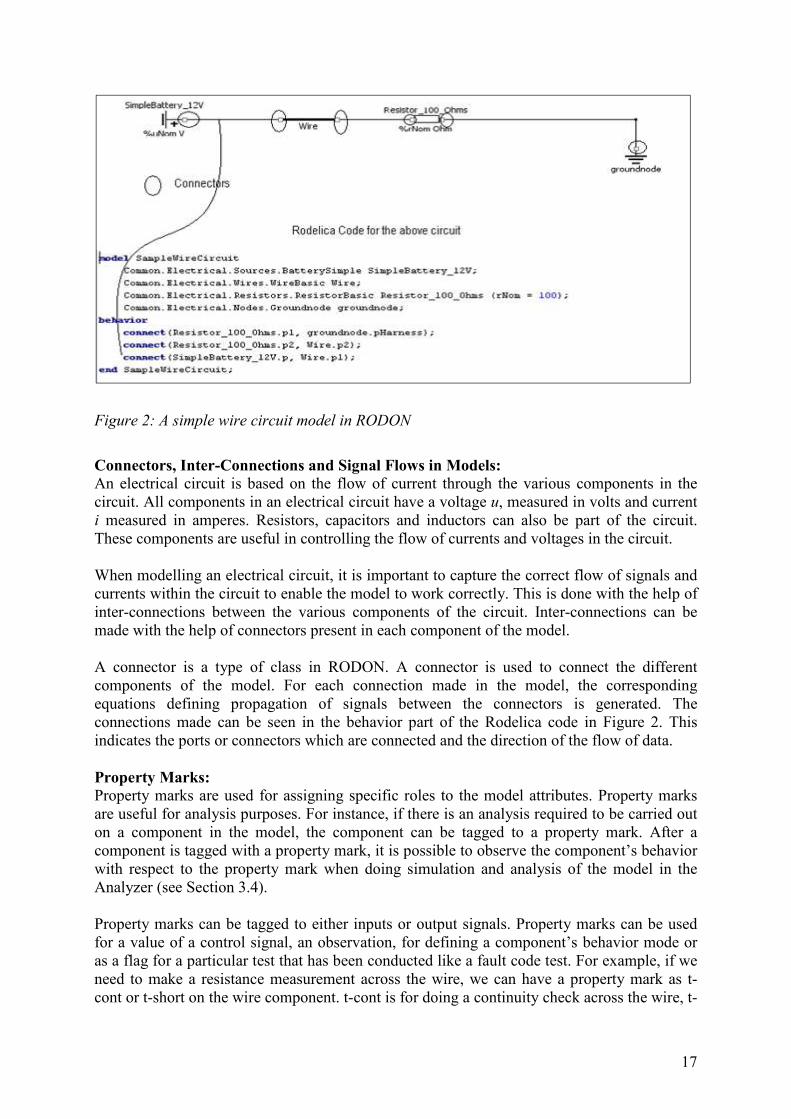
3.4 Simulation and Model Diagnosis Using Analyzer Module The Analyzer is the feature of RODON used to simulate and diagnose the models developed in the Composer. Models can either be simulated simply by clicking the simulate button in the Analyzer window or simulations can be automated by using the AutoSim feature which is part of the Analyzer module. Once the model is ready, it is possible to load the model in the analyzer by right clicking in the layout tab of composer and selecting load in analyzer option. After loading the model in the Analyzer, the model can be simulated to analyze the behavior of the system. It is also possible to set the failure modes to specific values manually as shown in Figure 5 below. In the figure below, the wire component is selected and has two failure modes- ok and disconnected, represented by Wire.fm as shown in the pop-up window. The wire can be ok and connected properly or the wire can be disconnected. One of these failure modes can be selected before simulating the model. It is possible to set the failure mode of all the components in the model to a desired value. In case the failure mode of a component is not specifically selected before simulation, the Analyzer module sets the failure mode of the component to the first defined failure mode. For the wire component marked in the figure below, the failure mode selected by Analyzer would be ok state.
21
Figure 5: Simulating model in Analyzer After a simulation command is issued, the values for the different parameters and components of the model are calculated based on the input conditions and settings. The updated values can be seen in the Analyzer view. After the correctness of the models are verified, it is possible to auto simulate the system with some specific component behavior using the AutoSim feature of the Analyzer module.
3.5 Auto-Simulation and Database Generations Using AutoSim Module The RODON AutoSim module is designed for simulating the system with various input states along with the various failure modes the components in the system can have. The simulated results are saved in a state database (.sdb) file. AutoSim is useful when the model has many components with different failure modes, since it would be difficult and time consuming to simulate all combinations of failure modes of the components and observing the system behavior manually. There are some variables, which are used for triggering varying input conditions, and some variables, which are used to observe the system behavior. For example, variables which have the property mark of switches, are inputs since they can switch their values during an auto-simulation. Similarly, a variable which has a property mark of observation or fault code, represent the behaviour of the system and are hence considered as output variables. The basic functionality of the AutoSim is to simulate the model with all combinations of specified input variables and save the corresponding values of output variables. The number of simulations to be carried out is dependent on the input variable combinations. If the number of simulations is high, restrictions to the input variable combinations need to be applied to reduce the simulation time.

22
3.6 Analysis of State Databases Using SDBView Module Once a database is generated in AutoSim, it can be viewed in different tabular formats using the SDBView module. A few table formats are provided as default formats. It is also possible to create your own tables by modifying the default formats. There are seven default table formats. The formats include three types of simulation tables, three types of FMEA tables and a table, which provide various predicate states. Out of these, only two of the FMEA table formats are of interest from the project perspective. They are the are fault-oriented and effect-oriented formats. Both the formats provide information about the failures of individual components and their effects on the overall system behavior. The tables also provide information about the indications in the system when a failure occurs. FMEA tables in RODON have four columns that provide information. The columns have a default order in which they are represented as shown in Figure 6. It would be possible to manually change the order in which presented.
Figure 6: Various tabs in FMEA view
Component tab: The component tab represents the name of a component. The other tabs provide more information about this component. Fault mode tab: This tab consists of the failure mode of the corresponding component in the component tab. Effects tab: When a component has a failure, it has some effects on the overall system. The type of failure of the component is indicated in the fault mode tab and the effects of the component failing with a particular failure mode are listed in the effects tab. Indications tab: When a component has a failure, there can be indications in the system based on the type of failure (failure mode). For example, a warning light glows in the Instrument Cluster or a fault code is raised in an ECU when a sensor connected to the ECU turns faulty. Such indications, if any, are displayed in the indications tab.
3.7 Reliability Module The reliability module provided in the RODON tool handles all the computations and analysis of the system in terms of reliability. The reliability module is capable of doing calculation of probabilistic failure rate calculations, generation of minimal cut sets, reliability block diagrams and fault trees. More information about the reliability module is provided in Chapter 5.
23
Chapter 4 Generation of Diagnostic Requirements from Models Developed During Early Design Phases
4.1 Background One of the primary objectives of this project work was to investigate if it is possible to generate some diagnostic requirements during early design phases like concept phase or pre-study phases. For investigating this, models were developed and simulated to see if the generation of such diagnostic requirements was possible. This model makes use of generic components from the tool's standard library and the common component development library provided along with the tool.
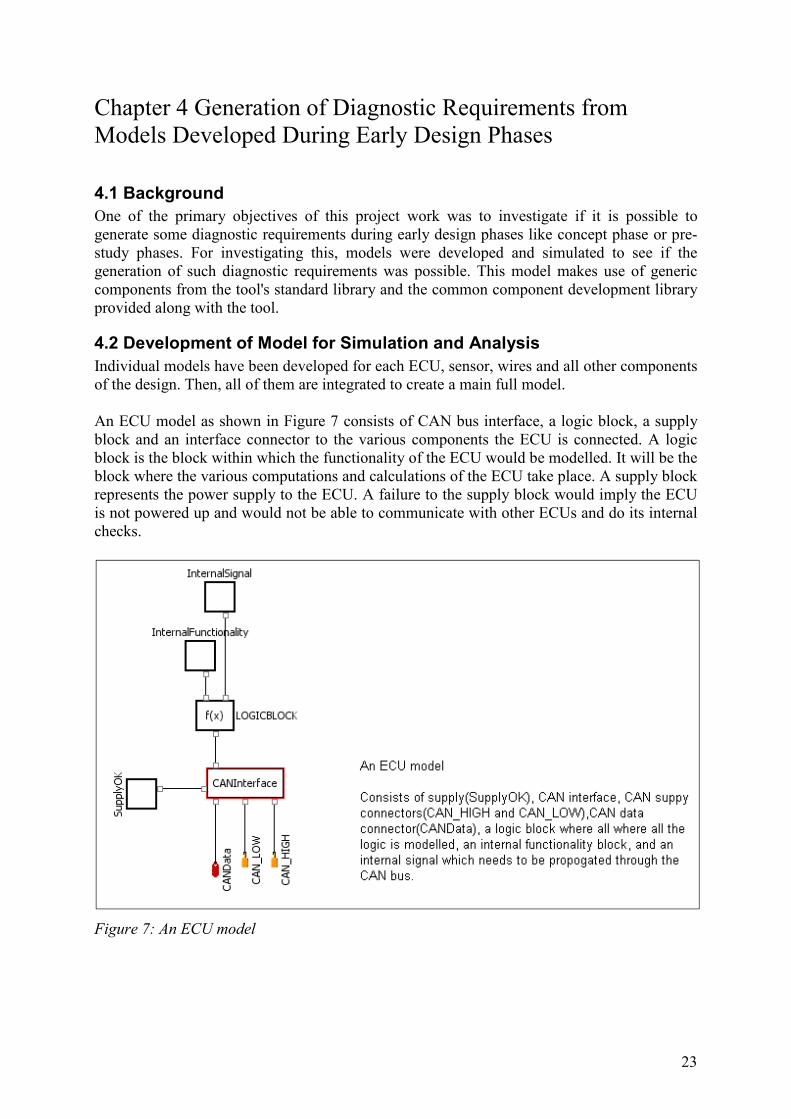
4.2 Development of Model for Simulation and Analysis Individual models have been developed for each ECU, sensor, wires and all other components of the design. Then, all of them are integrated to create a main full model. An ECU model as shown in Figure 7 consists of CAN bus interface, a logic block, a supply block and an interface connector to the various components the ECU is connected. A logic block is the block within which the functionality of the ECU would be modelled. It will be the block where the various computations and calculations of the ECU take place. A supply block represents the power supply to the ECU. A failure to the supply block would imply the ECU is not powered up and would not be able to communicate with other ECUs and do its internal checks.
Figure 7: An ECU model

24
A CAN interface is a specific class with a base class provided in the standard library. Each interface is connected to a supply, two CAN connectors (CAN HIGH and CAN LOW), an in signal and an out signal. The in signal consists of the information to be transmitted from the ECU. The out signal is the connection which provided the information from the CAN interface from the other connected ECUs. A sensor model as shown in Figure 8 consists of an internal logic block and a connection block to its corresponding ECU. If both are in ok state, the sensor is expected to send correct information to the ECU.
Figure 8: A Sensor Model
A wire connection model as shown in Figure 9 has a ground component, power supply component and a component which represents the signal it is communicating.
Figure 9: A wire model
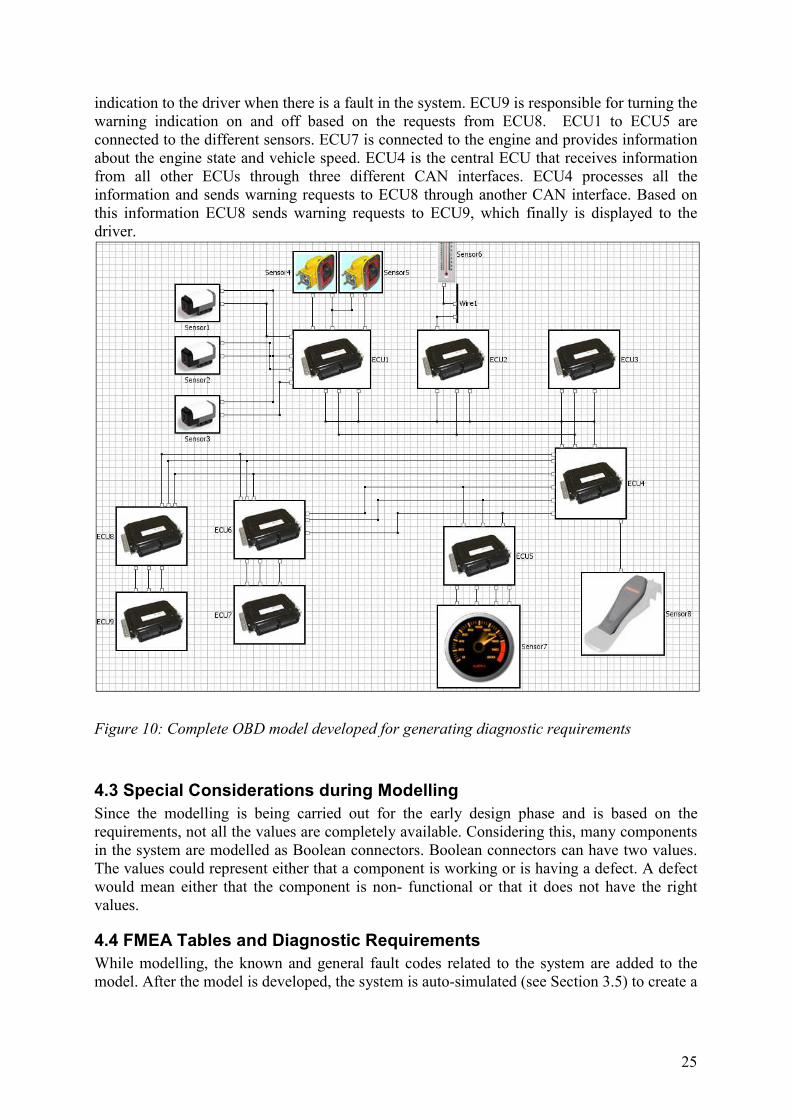
After creating individual component model classes for control units, sensors, wires and CAN buses, the inheritance feature of RODON is used to replicate individual components. After all the components of the system are placed at the top level, all inter-connections, attributes and parameterization of the individual components are made. The inter-connections are based on the system requirements and the flow of signals within the system. For example, there are some sensors connected to ECU1, a sensor is connected to ECU2 through a wire. Similarly, all the other connections are made with the basic concepts described in Chapter 3.Figure 10 is the overview of the model for the overall OBD system developed. Specific details of the model are confidential but in a generic way, there are nine ECUs, seven sensors and four CAN interfaces in the system. The basic requirement of the system is to have a warning
25
indication to the driver when there is a fault in the system. ECU9 is responsible for turning the warning indication on and off based on the requests from ECU8. ECU1 to ECU5 are connected to the different sensors. ECU7 is connected to the engine and provides information about the engine state and vehicle speed. ECU4 is the central ECU that receives information from all other ECUs through three different CAN interfaces. ECU4 processes all the information and sends warning requests to ECU8 through another CAN interface. Based on this information ECU8 sends warning requests to ECU9, which finally is displayed to the driver.
Figure 10: Complete OBD model developed for generating diagnostic requirements
4.3 Special Considerations during Modelling Since the modelling is being carried out for the early design phase and is based on the requirements, not all the values are completely available. Considering this, many components in the system are modelled as Boolean connectors. Boolean connectors can have two values. The values could represent either that a component is working or is having a defect. A defect would mean either that the component is non- functional or that it does not have the right values.
4.4 FMEA Tables and Diagnostic Requirements While modelling, the known and general fault codes related to the system are added to the model. After the model is developed, the system is auto-simulated (see Section 3.5) to create a

26
state database with all possible combinations of the failure modes of the system. With the help of the database, an FMEA table (see Section 3.6) is created. During the course of this project work, models of system design have been developed, simulated and analysed. The FMEA tables generated are for the system. The results were analysed for diagnostic requirements. All the known and implemented fault codes and faults present in the model are expected to be present in the FMEA table. If there is a fault shown in the FMEA table without a fault code then a decision needs to be made if the fault requires a fault code or not. This process of analysing is for improving the diagnostic capabilities of the system by adding or deleting fault codes from the system. The whole process of the possible generation of diagnostic requirements from models developed from early design phases can be considered as a series of steps as mentioned below. Step 1: Developing the system model from available system requirements in Composer.
Step 2: Verifying and analysing the system model for correctness in Analyzer.
Step 3: Auto-simulating and generating the state database in AutoSim.
Step 4: Loading the database in SDBView and opening the it in the FMEA format.
Step 5: Checking for available fault codes in the Indications column
Step 6: For fault modes of components, where fault codes are not present, investigating further if fault codes are required for the components.
Step 7: Updating the system design team about the findings and the addition of missing fault codes in the requirements for improving the overall system diagnostics.
27
Chapter 5 RODON and Reliability Analysis
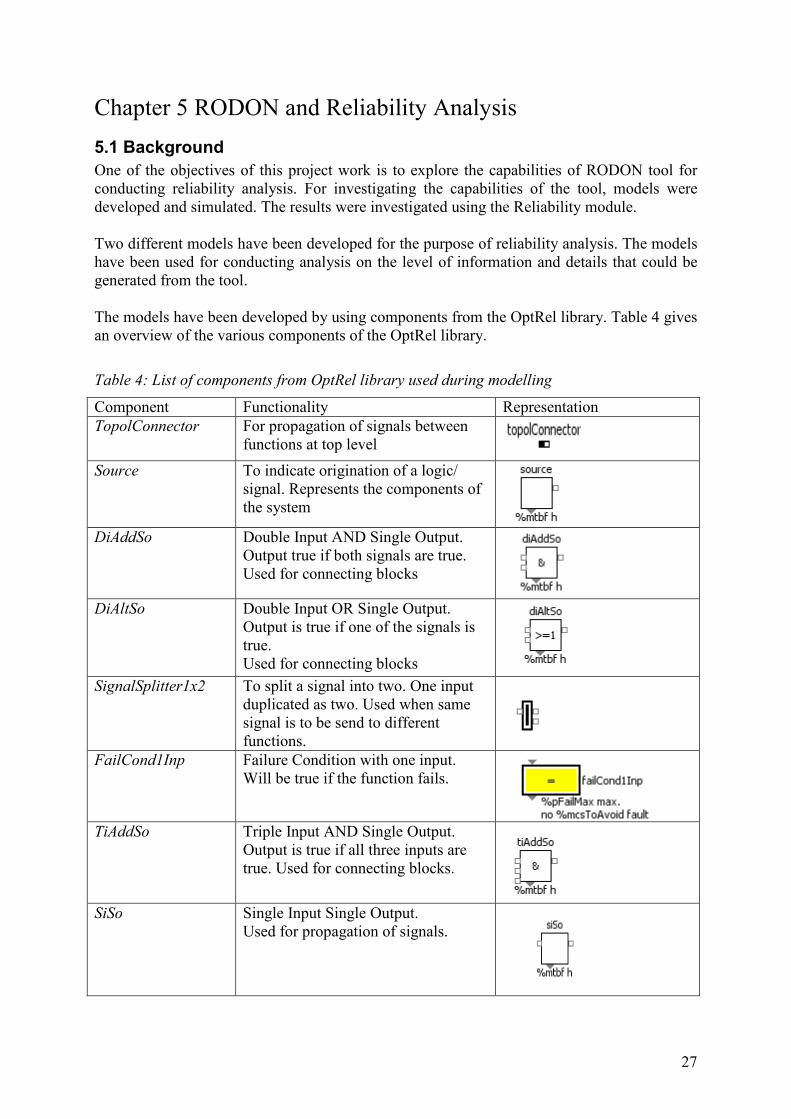
5.1 Background One of the objectives of this project work is to explore the capabilities of RODON tool for conducting reliability analysis. For investigating the capabilities of the tool, models were developed and simulated. The results were investigated using the Reliability module. Two different models have been developed for the purpose of reliability analysis. The models have been used for conducting analysis on the level of information and details that could be generated from the tool. The models have been developed by using components from the OptRel library. Table 4 gives an overview of the various components of the OptRel library.
Table 4: List of components from OptRel library used during modelling
Component Functionality Representation TopolConnector For propagation of signals between
functions at top level
Source To indicate origination of a logic/ signal. Represents the components of the system
DiAddSo Double Input AND Single Output.
Output true if both signals are true. Used for connecting blocks
DiAltSo Double Input OR Single Output.
Output is true if one of the signals is true. Used for connecting blocks
SignalSplitter1x2 To split a signal into two. One input duplicated as two. Used when same signal is to be send to different functions.
FailCond1Inp Failure Condition with one input. Will be true if the function fails.
TiAddSo Triple Input AND Single Output.
Output is true if all three inputs are true. Used for connecting blocks.
SiSo Single Input Single Output.
Used for propagation of signals.

28
SignalSplitter1x3 To split a signal into three. One input is replicated as three. Used when same signal is to be sent to different functions.
DiAddSink Double Input AND Sink. The inputs end here but the value of the block is true only if the input is True. Used for connecting blocks.
SiSink Single Sink. Termination point of a signal or a Sink.
FailCondAnd2 Failure Condition with two inputs.
Will be true if both the inputs fail.
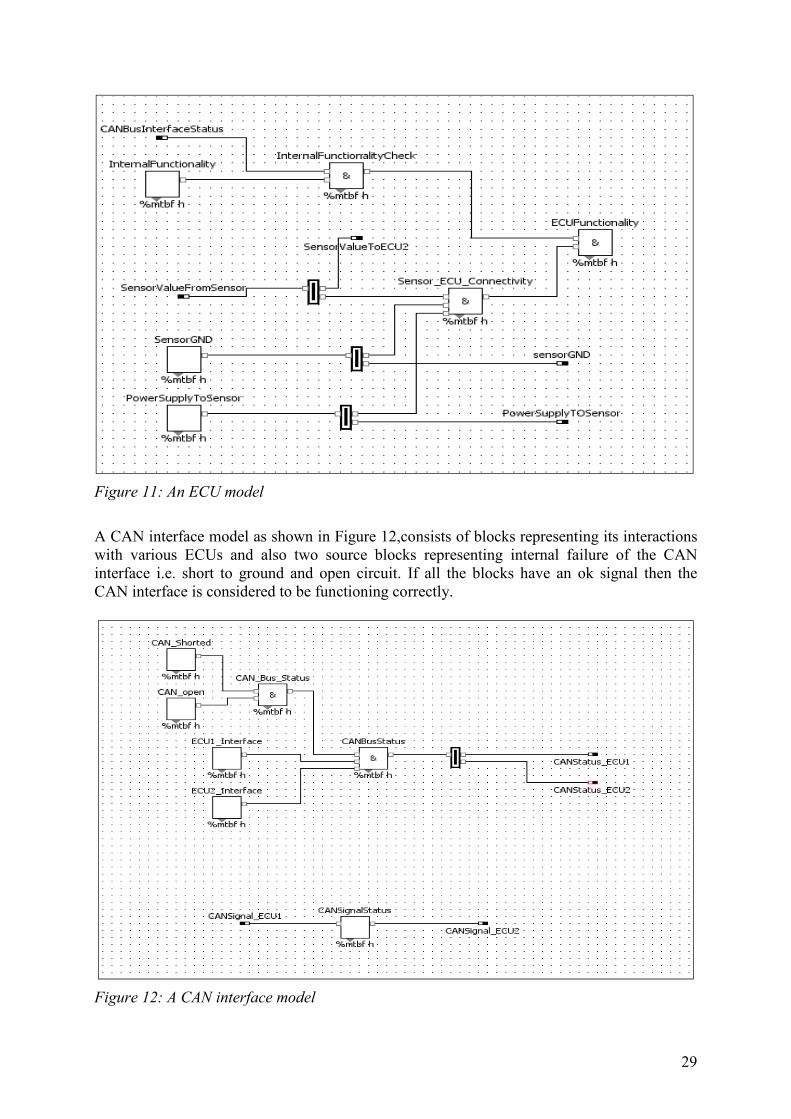
5.2 Detailed Model Developed for Generating Reliability Block Diagrams, Fault Trees and FMEA Analysis This modelling approach for developing a detailed model is similar to the approach that was used for developing models for generating diagnostic requirements. A model is developed for each ECU, sensor, bus interfaces, wires and all other components of the design with the basic modelling concepts discussed in Section 3.2. After the individual models have been developed, all of them are integrated to create a main full model. This is useful for doing detailed analysis of the system like FMEA analysis, detailed reliability block diagrams and fault trees. An ECU model as shown in Figure 11 below, consists of an internal functionality block, a CAN interface block and other interface blocks like sensors connected to the ECU.
29
Figure 11: An ECU model
A CAN interface model as shown in Figure 12,consists of blocks representing its interactions with various ECUs and also two source blocks representing internal failure of the CAN interface i.e. short to ground and open circuit. If all the blocks have an ok signal then the CAN interface is considered to be functioning correctly.
Figure 12: A CAN interface model

30
A sensor model as shown in Figure 13,consists of an internal functionality block and a connection block to its corresponding ECU. If all blocks are in ok state, the sensor is expected to be sending correct information to the ECU.
Figure 13: A sensor model
A wire connection model as shown in Figure 14 below, has two main components. They are Ground and Power supply connection. Both connections are represented by source blocks and if they are both working, then the wire is considered to be functioning correctly.
Figure 14: A Wire model

31
Fc_Wire_ECU represents the fault codes that the system can have. They are designed and handled in the code part of the model. Since all components are Boolean based, the values set will also be Boolean including the fault codes. With all components Boolean in nature, it would be possible to point out a faulty component and whether a fault code is set or not. It is however difficult to differentiate between various faults and fault codes. For example, a wire can have different fault codes for different failure modes like disconnected, short-to-ground or short-to-battery. In the current modelling method, it can be pointed out that the wire is faulty and a fault code is set, but it cannot be exactly pointed out if it is a disconnect, short-to-ground or a short-to-battery fault. This is one of the constraints of modelling at this level of the life cycle and using the OptRel library for modelling of the system. The OBD model for reliability analysis has been developed in a similar way as the OBD model developed for diagnostic requirement analysis in Chapter 4. The basic steps include developing individual component model classes, creating multiple instances of the base classes and finally inter-connecting the components based on the requirements. Figure 15 gives an overview of the complete model. The model implements the same logic as described in Section 4.2 for Figure 10.
Figure 15:Detailed model developed for reliability analysis
5.3 Generic Reliability Model for Calculation of Probabilistic Failure Rates The main use of such a model is for calculation of overall failure rate or the probabilistic failure rate of the system. For finding out the failure rate of the overall system, it is sufficient to have the failure rate for the components of the system like ECUs, CAN buses and sensors. It is not necessary to model their internal elements as done in the previous section, and all components can be modelled with simple connectors as shown in Figure 16 below.

32
Figure 16: Model developed for calculation of probabilistic failure rates
5.4 Reliability Analysis of System Using Reliability Module Reliability analysis of systems is based on failure rates of the individual components and the type of connection that exists between components. In systems where the components are connected in series, failure of one component leads to the complete system failure. In series connected systems, a single component failure causes the overall system to be faulty and deviate from the nominal behaviour. The failure rate (failures per million hours) of a series connected system is dependent on the component with the lowest failure rate, as the failure of this component causes the complete system to fail. In systems where the components are connected in parallel, failure of one component does not cause a complete system failure. The overall functionality of a parallel-connected system relies on at least one component working and there will be a deviation only when all the components in parallel fail. The failure rate of a parallel-connected system is dependent on the component with the highest failure rate, as this component has the lowest probability of failing. There are also systems, which are combination of series and parallel connections. In such systems, some parts of the systems are series connected and some parts are parallel connections. The failure rate of each part is dependent on the connections in that part. The overall system failure rate is combination of the failure rates of each part of the system. For reliability calculations, RODON uses the MTBF values of individual components and checks the type of connections in the system. RODON also has in-built algorithms to perform reliability calculations. The use of connector blocks like AND and OR determine if the system is series connected or parallel connected respectively. RODON checks if the model has parallel connections or series connections or a combination and uses this information as the input to the algorithms before starting calculations.

33
Figure 17 below is a part of the OBD system model created for reliability analysis. Only the CAN interface part has been selected here to provide an understanding and overview of the information which can be generated in the Reliability module. It is also possible to select the complete system model discussed in this chapter. The main goal is to understand the different types of results possible to generate in Reliability module. The chosen model has three components, namely CAN_interface1, CAN_interface2 and CAN_interface3 connected in series with each other by a AND connector block.
Figure 17: A simple reliability model
Probabilistic Failure Rate Calculations Probabilistic failure rate calculations provide the overall reliability value of the system. The Reliability module first gathers the MTBF values of all the components then checks for the type of connection between the components and finally calculates the MTBF of the complete model. Figure 18 shows how the result for probabilistic failure rate calculations can be viewed in RODON. On the left side, the failure rate of individual components are given and the calculated failure rate of the overall system is provided in the right side. The tool calculates the maximum failure probability rate and the actual failure rate for the given set of input components.

34
Figure 18: Failure Rate Calculations
Minimal Cut Sets Failure of some individual components or a combination of components in a system can cause the overall system to fail. Minimal cut sets provide a list of such components. The tool does system analysis to determine the possible candidates that can cause complete system failure. This list is useful when the systems are complex with many components in series, parallel or in combination of series-parallel connections. The identification of various single points of failure in the system can be used for system analysis and improving the system design and improving the overall system reliability. There are three points of failure in the model shown in Figure 17. Since the CAN_interface blocks are connected in series, failure of any one of them causes a system failure and each is identified by the tool as a minimal cut set as shown in Figure 19 below.
Figure 19: Minimal cut sets
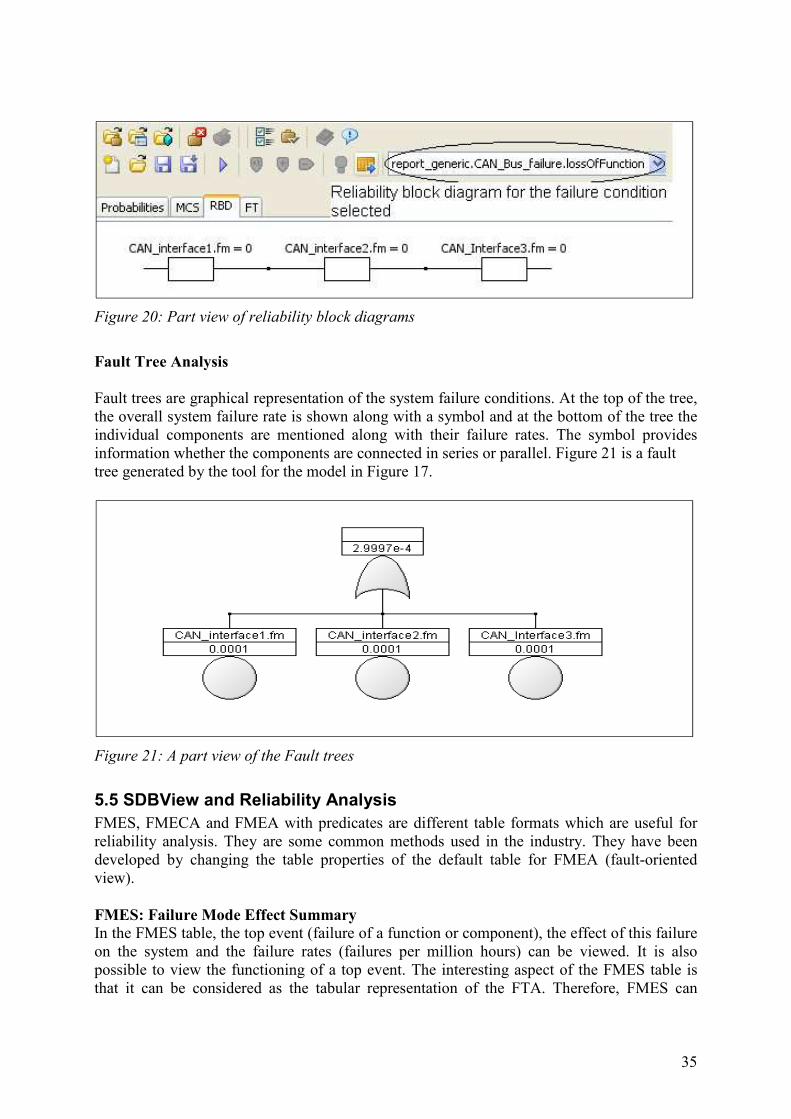
Reliability Block Diagrams Reliability block diagram provides a graphical view of the connections in the system. Reliability block diagrams shows how the system components are connected to each other for achieving nominal system behavior. Reliability block diagrams also show the failure modes each of the components must have in order to achieve nominal system behaviour. Figure 20is an overview of a reliability block diagram generated by the tool for the model in Figure 17.
35
Figure 20: Part view of reliability block diagrams
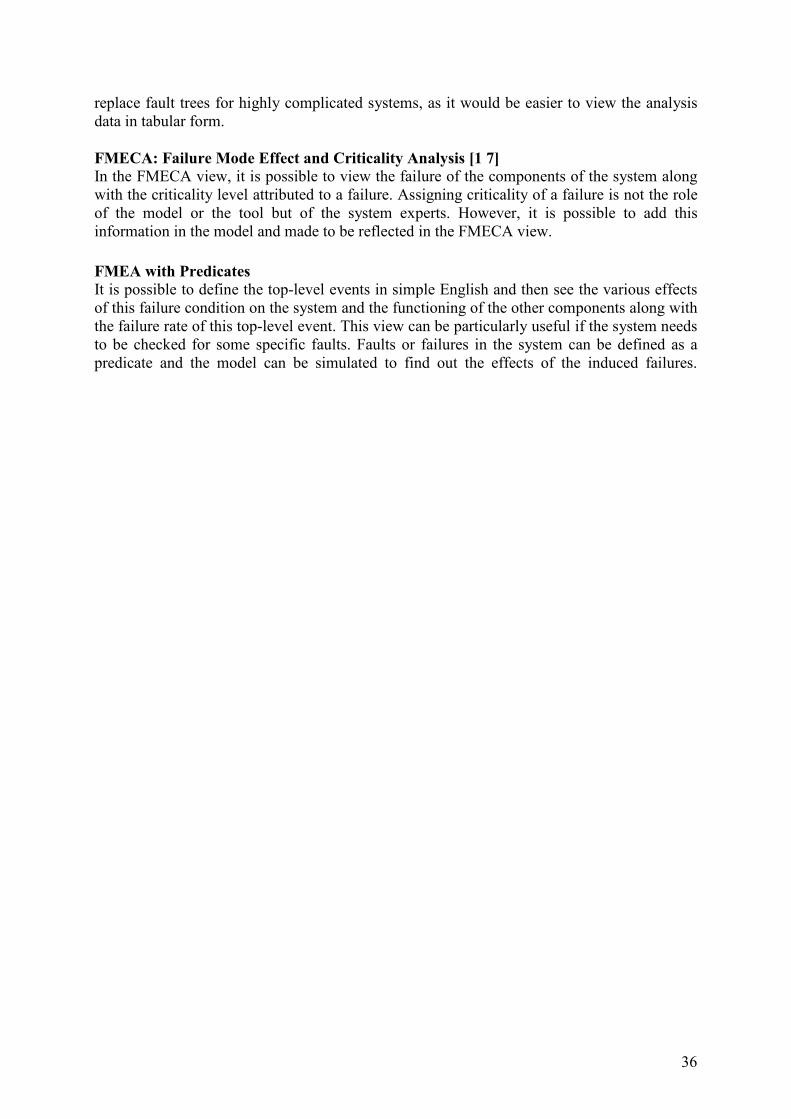
Fault Tree Analysis Fault trees are graphical representation of the system failure conditions. At the top of the tree, the overall system failure rate is shown along with a symbol and at the bottom of the tree the individual components are mentioned along with their failure rates. The symbol provides information whether the components are connected in series or parallel. Figure 21 is a fault tree generated by the tool for the model in Figure 17.
Figure 21: A part view of the Fault trees
5.5 SDBView and Reliability Analysis FMES, FMECA and FMEA with predicates are different table formats which are useful for reliability analysis. They are some common methods used in the industry. They have been developed by changing the table properties of the default table for FMEA (fault-oriented view). FMES: Failure Mode Effect Summary In the FMES table, the top event (failure of a function or component), the effect of this failure on the system and the failure rates (failures per million hours) can be viewed. It is also possible to view the functioning of a top event. The interesting aspect of the FMES table is that it can be considered as the tabular representation of the FTA. Therefore, FMES can
36
replace fault trees for highly complicated systems, as it would be easier to view the analysis data in tabular form. FMECA: Failure Mode Effect and Criticality Analysis [1 7] In the FMECA view, it is possible to view the failure of the components of the system along with the criticality level attributed to a failure. Assigning criticality of a failure is not the role of the model or the tool but of the system experts. However, it is possible to add this information in the model and made to be reflected in the FMECA view. FMEA with Predicates It is possible to define the top-level events in simple English and then see the various effects of this failure condition on the system and the functioning of the other components along with the failure rate of this top-level event. This view can be particularly useful if the system needs to be checked for some specific faults. Faults or failures in the system can be defined as a predicate and the model can be simulated to find out the effects of the induced failures.

37
Chapter 6 Modelling Summary This section summarizes the work done in terms of modelling and results achieved through modelling.
6.1 Early Design Phase Modelling Comparison Tables There were three different models developed for different objectives during the course of this project work. Table 5 is a comparative chart of the three models developed, their goals and the differences. Different modules in RODON were used for investigating and analysing different results. Table 6 is a chart, which gives an overview of the various analyses done in this project and the RODON module used for the analysis.
Table 5: Comparitive analysis of model developed during this project
Comments Model 1 Model 2 Model 3 Purpose of model developed
For generation of diagnostic requirements
For doing detailed reliability analysis
For calculating the probabilistic failure rate of the overall system function.
Is the model / modelling described in this document
Yes(Section 4.2)
Yes (Section 5.2) Yes (Section 5.2)
RODON Library used
Common library (non-OptRel)
OptRel library OptRel library
Difficulty of modelling
High High Low
Results achieved/ required from RODON
FMEA tables FMEA tables, Reliability block diagrams Fault trees Minimal cut sets FMES FMECA FMEA with Predicates
System failure rates Fault trees Reliability block diagrams Minimal cut sets
Do the results from this model achieve purpose of the model directly defined in row 1?
No. The tool provides FMEA tables that need to be investigated further and decisions need to be made on updating diagnostic requirements.
Yes. The primary objective of understanding the capabilities of the tool for reliability analysis has been achieved. The default reliability analyses the tool can provide include FMEA tables, perform probabilistic failure rate calculations, generate reliability block diagrams, minimal cut sets and fault trees. It is also possible to generate FMES, FMECA
Yes. It is possible to calculate the overall system failure rates when the failure rates of individual components are known.
38
and FMEA with predicates tables.
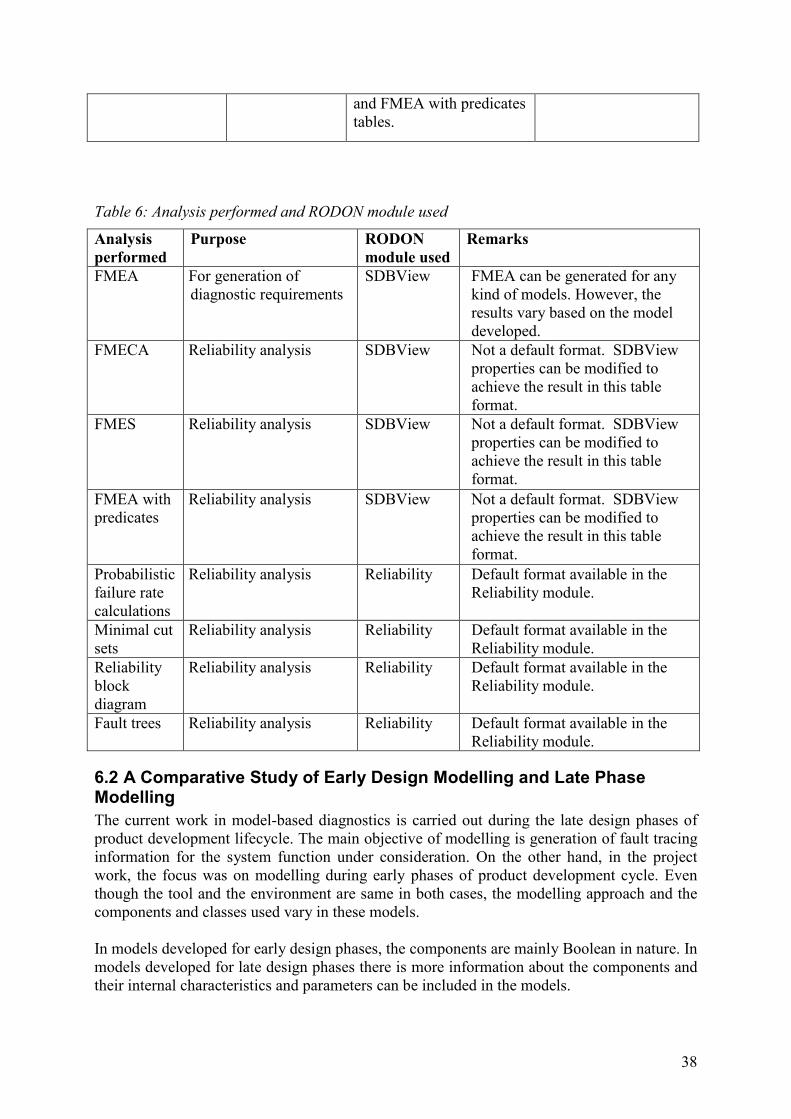
Table 6: Analysis performed and RODON module used
Analysis performed
Purpose RODON module used
Remarks
FMEA For generation of diagnostic requirements
SDBView FMEA can be generated for any kind of models. However, the results vary based on the model developed.
FMECA Reliability analysis SDBView Not a default format. SDBView properties can be modified to achieve the result in this table format.
FMES Reliability analysis SDBView Not a default format. SDBView properties can be modified to achieve the result in this table format.
FMEA with predicates
Reliability analysis SDBView Not a default format. SDBView properties can be modified to achieve the result in this table format.
Probabilistic failure rate calculations
Reliability analysis Reliability Default format available in the Reliability module.
Minimal cut sets
Reliability analysis Reliability Default format available in the Reliability module.
Reliability block diagram
Reliability analysis Reliability Default format available in the Reliability module.
Fault trees Reliability analysis Reliability Default format available in the Reliability module.
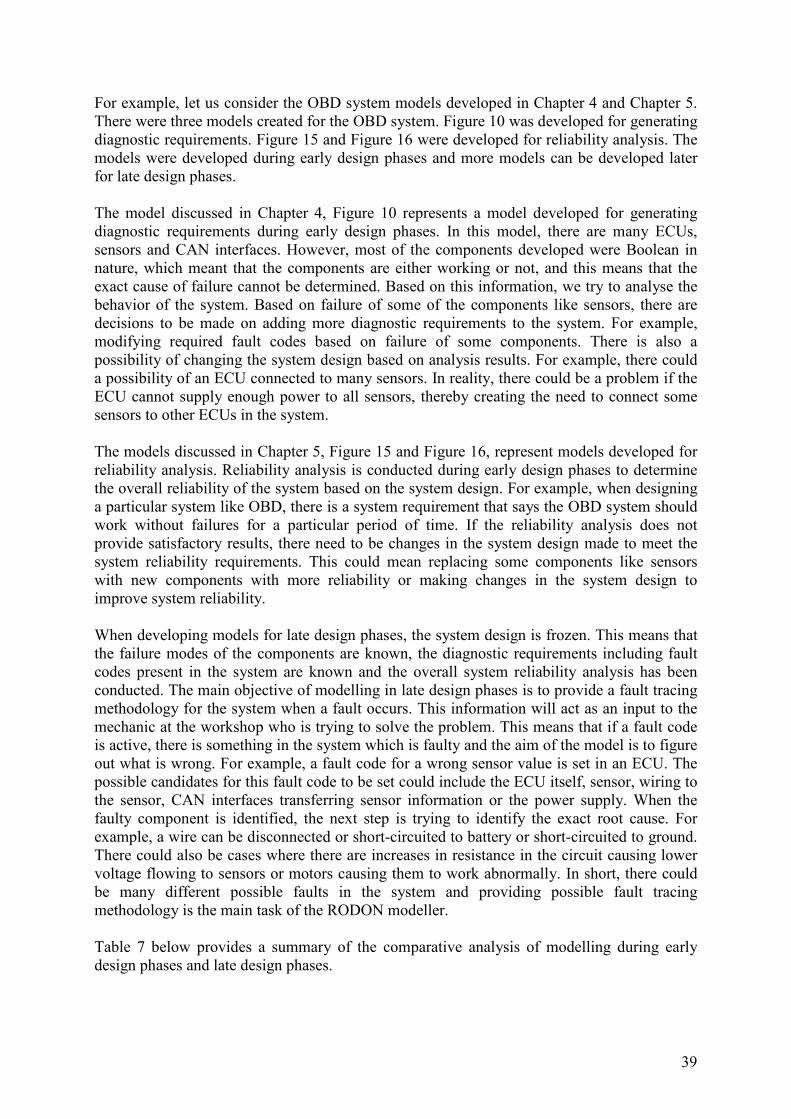
6.2 A Comparative Study of Early Design Modelling and Late Phase Modelling The current work in model-based diagnostics is carried out during the late design phases of product development lifecycle. The main objective of modelling is generation of fault tracing information for the system function under consideration. On the other hand, in the project work, the focus was on modelling during early phases of product development cycle. Even though the tool and the environment are same in both cases, the modelling approach and the components and classes used vary in these models. In models developed for early design phases, the components are mainly Boolean in nature. In models developed for late design phases there is more information about the components and their internal characteristics and parameters can be included in the models.
39
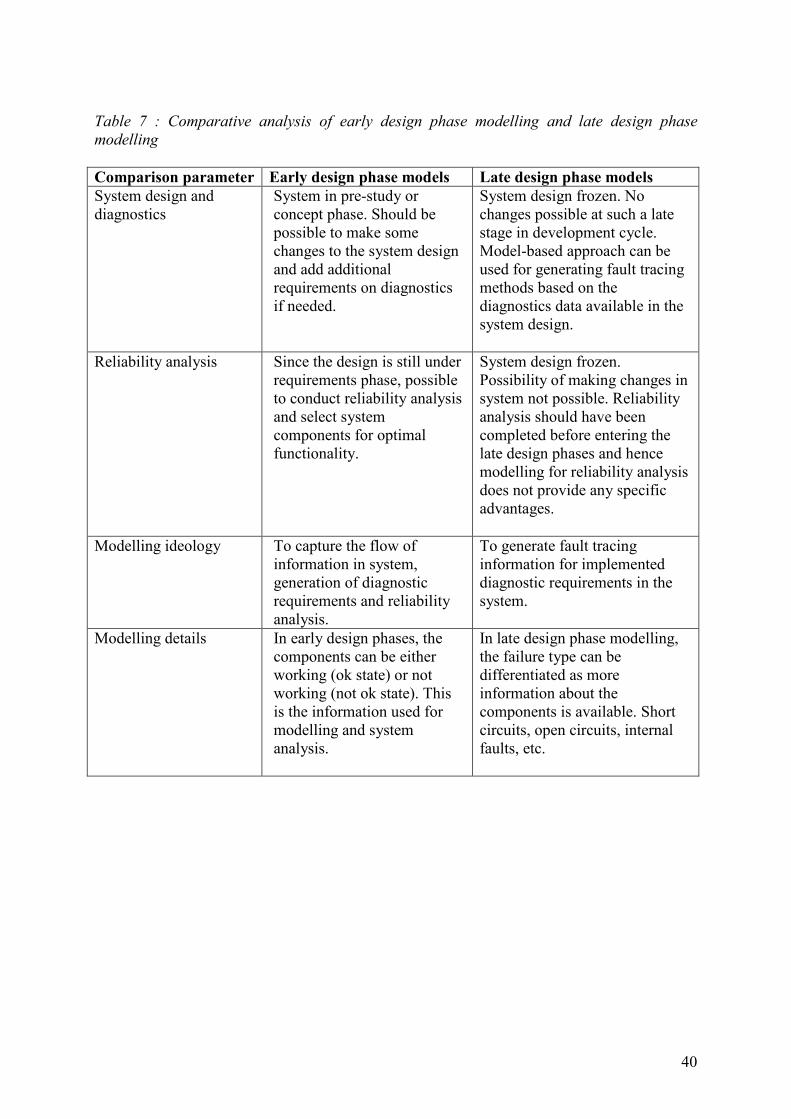
For example, let us consider the OBD system models developed in Chapter 4 and Chapter 5. There were three models created for the OBD system. Figure 10 was developed for generating diagnostic requirements. Figure 15 and Figure 16 were developed for reliability analysis. The models were developed during early design phases and more models can be developed later for late design phases. The model discussed in Chapter 4, Figure 10 represents a model developed for generating diagnostic requirements during early design phases. In this model, there are many ECUs, sensors and CAN interfaces. However, most of the components developed were Boolean in nature, which meant that the components are either working or not, and this means that the exact cause of failure cannot be determined. Based on this information, we try to analyse the behavior of the system. Based on failure of some of the components like sensors, there are decisions to be made on adding more diagnostic requirements to the system. For example, modifying required fault codes based on failure of some components. There is also a possibility of changing the system design based on analysis results. For example, there could a possibility of an ECU connected to many sensors. In reality, there could be a problem if the ECU cannot supply enough power to all sensors, thereby creating the need to connect some sensors to other ECUs in the system. The models discussed in Chapter 5, Figure 15 and Figure 16, represent models developed for reliability analysis. Reliability analysis is conducted during early design phases to determine the overall reliability of the system based on the system design. For example, when designing a particular system like OBD, there is a system requirement that says the OBD system should work without failures for a particular period of time. If the reliability analysis does not provide satisfactory results, there need to be changes in the system design made to meet the system reliability requirements. This could mean replacing some components like sensors with new components with more reliability or making changes in the system design to improve system reliability. When developing models for late design phases, the system design is frozen. This means that the failure modes of the components are known, the diagnostic requirements including fault codes present in the system are known and the overall system reliability analysis has been conducted. The main objective of modelling in late design phases is to provide a fault tracing methodology for the system when a fault occurs. This information will act as an input to the mechanic at the workshop who is trying to solve the problem. This means that if a fault code is active, there is something in the system which is faulty and the aim of the model is to figure out what is wrong. For example, a fault code for a wrong sensor value is set in an ECU. The possible candidates for this fault code to be set could include the ECU itself, sensor, wiring to the sensor, CAN interfaces transferring sensor information or the power supply. When the faulty component is identified, the next step is trying to identify the exact root cause. For example, a wire can be disconnected or short-circuited to battery or short-circuited to ground. There could also be cases where there are increases in resistance in the circuit causing lower voltage flowing to sensors or motors causing them to work abnormally. In short, there could be many different possible faults in the system and providing possible fault tracing methodology is the main task of the RODON modeller. Table 7 below provides a summary of the comparative analysis of modelling during early design phases and late design phases.
40
Table 7 : Comparative analysis of early design phase modelling and late design phase modelling Comparison parameter Early design phase models Late design phase models System design and diagnostics
System in pre-study or concept phase. Should be possible to make some changes to the system design and add additional requirements on diagnostics if needed.
System design frozen. No changes possible at such a late stage in development cycle. Model-based approach can be used for generating fault tracing methods based on the diagnostics data available in the system design.
Reliability analysis Since the design is still under requirements phase, possible to conduct reliability analysis and select system components for optimal functionality.
System design frozen. Possibility of making changes in system not possible. Reliability analysis should have been completed before entering the late design phases and hence modelling for reliability analysis does not provide any specific advantages.
Modelling ideology To capture the flow of information in system, generation of diagnostic requirements and reliability analysis.
To generate fault tracing information for implemented diagnostic requirements in the system.
Modelling details In early design phases, the components can be either working (ok state) or not working (not ok state). This is the information used for modelling and system analysis.
In late design phase modelling, the failure type can be differentiated as more information about the components is available. Short circuits, open circuits, internal faults, etc.

41
Chapter 7 ISO 26262 and RODON ISO 26262 standard provides a lot of information about the various factors which need to be taken into consideration to achieve acceptable functional safety in road vehicles. In this regard, there are a lot of analysis methods suggested by the standard as discussed. Some of these analysis methods can be carried out with model-based methods, RODON in particular. Here are a few features of the tool that can be useful for doing some of the analysis methods suggested in the standard. • RODON can be useful for impact analysis suggested in the standard, specifically when modifications of design are involved. In a model-based approach like RODON, the system models are ready and the changes just need to be updated in the models. After this, the tool can take care of the calculations.
• RODON can be useful for doing hazard analysis. The standard suggests deductive analysis techniques like fault tree analysis and reliability block diagrams. In addition, some inductive analysis techniques like FMEA analysis. Along with this, the tool is also capable of doing symptom analysis.
• RODON can be helpful in calculation of probabilistic failure rate calculations. This information can be used during ASIL level determination of items.
• RODON can be used for analysis of system behaviour in the presence of faults and can be very helpful in finding root causes of faults
• RODON can be used for diagnosis of an item or system. RODON can be used for finding out single points of failure in the system. It can also generate decision trees which can find out points of failure in the system.
• RODON can be used for testing the correctness of a system design. • RODON can be useful in conducting some of the requirement-based tests, fault injection tests, back-to-back tests and error guessing tests suggested in the standard.

42
Chapter 8 Manual Analysis Vs. Model-Based Analysis The comparative analysis of the manual techniques used for system analysis with the results of the model-based analysis provided some interesting views. The nomenclature was different but the results were similar.
The manual analysis of system functions is split into various kinds of analysis. Initially the system analysis is done with functional parts of the system like ECUs, and then non-functional parts of the systems like sensors. Once this individual analysis is done, the initial system FMEA analysis is carried out. In the tool based approach, all the components of the system are designed into one model and the FMEA of the system generated.
In the manual method, the level of details required for the reliability block diagrams or fault trees is decided and the results generated accordingly. This is possible even in the model-based approach, but the level of details required in the results will be based on the models. In manual approach, not all methods like reliability block diagrams and fault trees are done. The methods to be used are decided and analysis of the system is done for the same only.
In manual approach, each of the reliability analysis methods have to be done from scratch. For example, reliability block diagrams or fault trees are two separate methods and work on each of them needs to be started from scratch. The model-based approach was able to provide information from a single model in different formats. In the model-based approach, time is spent on developing models and then using the Reliability model, results can be viewed in different formats based on the requirements.
It was of interest to know that models were easier for reusability and maintainability. Model-based approach using RODON was seen to be much easier and effective in fault frequency calculations and reliability analysis. The information available from the model-based approach needs to be properly classified in order to fit some of the manual methods used currently.
The comparisons were carried out only on the results. However, it would be interesting to compare both the methods based on time taken for analysis, cost of analysis, maintainability and reusability. The discussion ended with a view of having a pilot project to truly evaluate the capabilities of the RODON tool and the range of information the tool can provide.

43
Chapter 9 Summary The main objectives of this project were to explore the use of model-based methods for the generation of diagnostic requirements during early design phases, reliability analysis and to investigate the use of RODON for system analysis methods suggested in ISO26262 standard. One of the major challenges during the course of this project work was that it was carried out in an on-going project, and not all required information was available. The lack of information meant the results achieved cannot be taken as fully verified. However, the approach and the method used during the course of this project work have been accepted as a possible way forward. From the models developed, the following results were achieved using the tool
• Generation of FMEA tables • Calculation of Probabilistic failure rates • Generation of Reliability block diagrams • Generation of Minimal cut sets • Generation of Fault trees • Generation of FMES tables • Generation of FMECA tables • Generation of FMEA with predicates tables
Some of the important analysis results achieved during the project include • Generation of diagnostic requirements- FMEA tables generated by the tool can be used for analysing the system behaviour and the available diagnostics in the system. It can also be useful in investigating the needs of improving diagnostic requirements on the system. It was not possible to generate the exact diagnostic requirements, but a method of investigating has been determined.
• Reliability analysis capabilities of RODON- The tool was found capable of generating failure rate predictions, reliability block diagrams, fault trees and minimal cut-sets from the models created using OptRel library. The exact results and values cannot be used, as not all information regarding failure rates of individual components was available. However, some values were assumed and the reliability analysis was conducted to determine the capabilities of the tool. The tool can also provide information in FMES, FMECA and FMEA with predicate tables formats which can be used for reliability analysis.
• System analysis methods suggested in ISO 26262- Out of the many different system analysis methods suggested in ISO 26262, RODON can support FMEA analysis, fault tree analysis, generation of reliability block diagrams, symptom analysis, diagnosis of systems and probabilistic failure rate calculations.
Based on the work carried out during the course of this project and the results achieved, I would like to propose some recommendations and possible future work. • The investigation of diagnostic requirements in a system during early design phases itself may prove very helpful in improving the overall diagnostics in the final product. I would recommend for further investigations in this field. This can also be useful, especially in the current scenario where the use of electronics in automotive industry is ever increasing.

44
• Reliability analysis for complex systems like automotive electrical and electronic systems can be challenging. A single change in the reliability value of a single component in the system requires the overall system reliability analysis. This can be challenging. RODON has good capabilities in terms of reliability analysis of systems. The reusability and maintenance of models is easy. I would like to recommend the use of the tool for reliability analysis in the future.
45
References [1] Neil Storey, Safety Critical Computer Systems, Prentice Hall, 1996 [2] William R. Dunn, Practical Design of Safety-Critical Computer Systems, Reliability Press, 2002 [3] RODON Manual Draft, Sörman Information & Media [4] RODON Modelling Guidelines, Version 0.2, Volvo 3P [5] Basic Vehicle Technology, Part 1-3, 1995, Volvo Truck Parts Corporation [6] http://www.weibull.com/hotwire/issue63/relbasics63.htm [7] http://www.weibull.com/hotwire/issue46/relbasics46.htm [8] Thesis report on Model-based Diagnosis of a Satellite Electrical Power System with RODON, Olle Isaksson, Linkoping University, Sweden. [9] http://www.reliasoft.com/newsletter/2q2003/fta.htm [10] ISO 26262-Road Vehicles-Functional Safety- Parts1, 3 and 4. [11] http://www.sorman.com/Site/System/Rodon.aspx [12] http://www.vector-elearning.com/vl_einfuehrunglin_en.html [13] http://www.vector-elearning.com/vl_einfuehrungcan_en.html