model development and validation of ethyl tert-butyl …nuno/tams/old/2012-13/aula02/domingues...
TRANSCRIPT
Model Development and Validation of Ethyl tert-Butyl EtherProduction Reactors Using Industrial Plant DataLuis Domingues,† Carla I. C. Pinheiro,*,† Nuno M. C. Oliveira,‡ Jorge Fernandes,§ and Andre Vilelas§
†Institute for Biotechnology and Bioengineering, Instituto Superior Tecnico, Universidade Tecnica de Lisboa, Avenida Rovisco Pais 1,1049-001 Lisboa, Portugal‡Department of Chemical Engineering, Universidade de Coimbra, Rua Sílvio LimaPolo II, 3030-790 Coimbra, Portugal§Repsol Polímeros S.A., Apartado 41, 7520-954 Sines, Portugal
*S Supporting Information
ABSTRACT: This work considers the development and validation of a first-principles dynamic model for the production ofethyl tert-butyl ether (ETBE) in the presence of the coproducts diisobutene (DIB) and tert-butyl alcohol (TBA). Desulfonation isassumed to be the main deactivation mechanism of the catalyst used, an acidic ion-exchange resin. Operational data from anindustrial ETBE production plant, taken over the period of 1 year, were used to estimate both the deactivation and DIB kineticconstant parameters. A data reconciliation strategy was employed to convert the raw data into a consistent data set, representingthe most likely process operation data. The parameters estimated were incorporated in a set of detailed mass and energybalances, together with additional kinetic and physical information from the literature, to originate a distributed parameter modelcapable of accurately describing the operation of two industrial reactors used for the production of ETBE. Model developmentand validation were performed in gPROMS Modelbuilder with the necessary physical properties calculated by Aspen Plus,through the CAPE-OPEN standard. The desulfonation decay order obtained was close to second order kinetics, previouslyproposed by other authors. The activation energy estimated for the desulfonation process was also comparable with past reportedvalues, while the value of the pre-exponential factor for the desulfonation was slightly lower. Different temperature ranges andparticle sizes are attributed as possible causes for the differences observed.
■ INTRODUCTION
Ethers were introduced in gasoline in the mid-1970s to replacelead-based additives as octane-rating enhancers and to increasethe combustion efficiency of gasoline.1 Methyl tert-butyl ether(MTBE) was initially chosen by most refiners over otheroxygenates, due to its blending properties and low cost.2 MTBEwas first produced in Italy in 1973 and in the United States in1979. The continuous phase-out of lead-based additivesstimulated the growth of MTBE production during the1980s. Demand for this oxygenated compound continued toincrease in the 1990s, driven by the review of the Clean Air Actin the United States, which required at least 2.7 wt % oxygen(for a minimum of 4 months) in gasoline sold in metropolitanareas that exceeded the federal standard for carbon monoxideemissions.1−4 However, in 1999, the state of Californiaannounced a ban on MTBE, as a response to the discoveryof trace amounts of this substance in drinking water.1 Followingthis ban, which was also implemented by other states, thedemand for other oxygenated additives began, and ethyl tert-butyl ether (ETBE) emerged as a suitable replacement.ETBE is a clear, colorless to pale yellow liquid, with a
distinctive ether-like odor. Even though MTBE and ETBE havepractically the same octane rating, ETBE has a lower solubilityin water, and thus, the risk of water contamination is lower.Nevertheless, the oxygen content of ETBE is also lower, andthus, to achieve the same oxygen content in gasoline, a higherquantity of this substance is required compared to MTBE.2
ETBE is produced from the liquid-phase, reversible, andexothermic reaction of isobutene (IB) and ethanol (EtOH),according to the reaction
+ ⇄IB EtOH ETBE (1)
Jensen and Datta5 provided an expression for the equilibriumconstant of this reaction, and Zhang et al.6 proposed anexpression for the reaction kinetics, based on a Langmuir−Hinshelwood−Hougen−Watson (LHHW) model.Two main side reactions in the production of ETBE are the
formation of the isomers 2,4,4-trimethyl-1-pentene and 2,4,4-trimethyl-2-pentene (usually referred to as diisobutene, DIB),from the reaction of two isobutene molecules, and theformation of tert-butyl alcohol (TBA), from the reaction ofisobutene and water:7
→2IB DIB (2)
+ ⇄IB H O TBA2 (3)
Oligomerization of isobutene over resin catalysts was studiedby Haag8 and later by Honkela and Krauze,9 who used TBA asa polar selectivity-enhancing solvent. This reaction has alsobeen studied as a side reaction in the MTBE productionprocess.10−13 The hydration of isobutene to TBA using ion-
Received: July 31, 2012Revised: October 15, 2012Accepted: October 16, 2012Published: October 17, 2012
Article
pubs.acs.org/IECR
© 2012 American Chemical Society 15018 dx.doi.org/10.1021/ie302030j | Ind. Eng. Chem. Res. 2012, 51, 15018−15031
exchange resins as catalysts has been previously studied.14−18
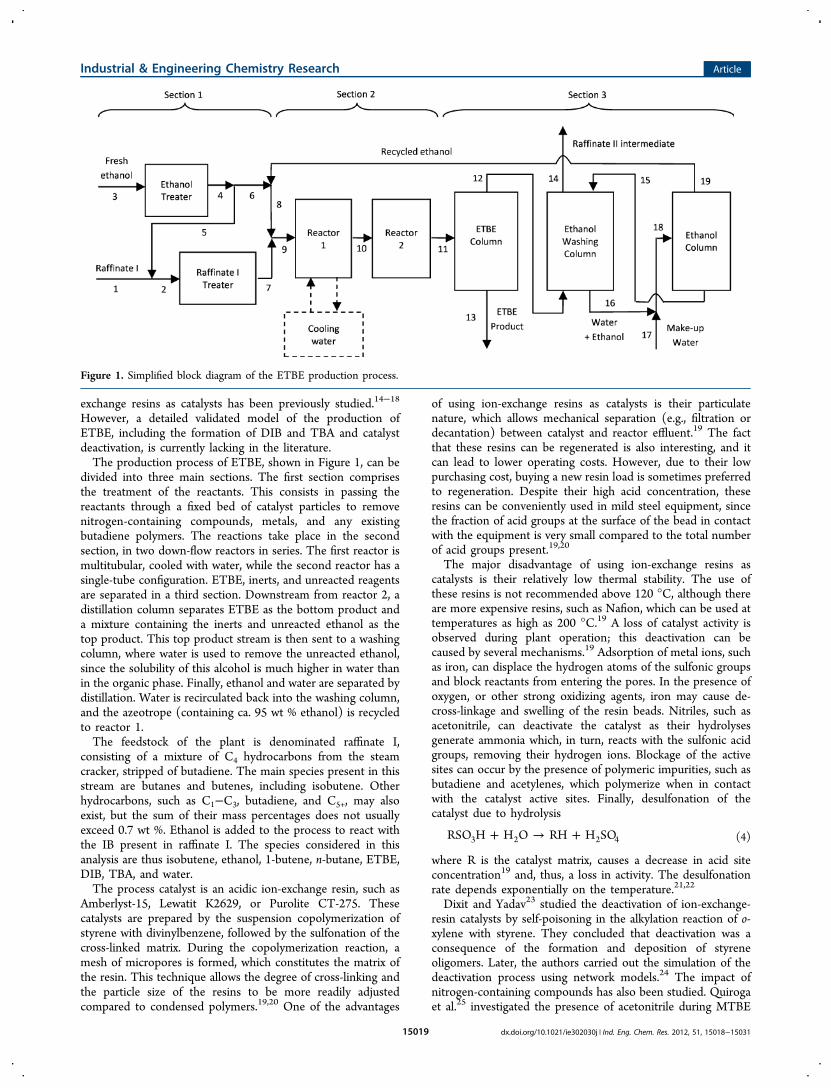
However, a detailed validated model of the production ofETBE, including the formation of DIB and TBA and catalystdeactivation, is currently lacking in the literature.The production process of ETBE, shown in Figure 1, can be
divided into three main sections. The first section comprisesthe treatment of the reactants. This consists in passing thereactants through a fixed bed of catalyst particles to removenitrogen-containing compounds, metals, and any existingbutadiene polymers. The reactions take place in the secondsection, in two down-flow reactors in series. The first reactor ismultitubular, cooled with water, while the second reactor has asingle-tube configuration. ETBE, inerts, and unreacted reagentsare separated in a third section. Downstream from reactor 2, adistillation column separates ETBE as the bottom product anda mixture containing the inerts and unreacted ethanol as thetop product. This top product stream is then sent to a washingcolumn, where water is used to remove the unreacted ethanol,since the solubility of this alcohol is much higher in water thanin the organic phase. Finally, ethanol and water are separated bydistillation. Water is recirculated back into the washing column,and the azeotrope (containing ca. 95 wt % ethanol) is recycledto reactor 1.The feedstock of the plant is denominated raffinate I,
consisting of a mixture of C4 hydrocarbons from the steamcracker, stripped of butadiene. The main species present in thisstream are butanes and butenes, including isobutene. Otherhydrocarbons, such as C1−C3, butadiene, and C5+, may alsoexist, but the sum of their mass percentages does not usuallyexceed 0.7 wt %. Ethanol is added to the process to react withthe IB present in raffinate I. The species considered in thisanalysis are thus isobutene, ethanol, 1-butene, n-butane, ETBE,DIB, TBA, and water.The process catalyst is an acidic ion-exchange resin, such as
Amberlyst-15, Lewatit K2629, or Purolite CT-275. Thesecatalysts are prepared by the suspension copolymerization ofstyrene with divinylbenzene, followed by the sulfonation of thecross-linked matrix. During the copolymerization reaction, amesh of micropores is formed, which constitutes the matrix ofthe resin. This technique allows the degree of cross-linking andthe particle size of the resins to be more readily adjustedcompared to condensed polymers.19,20 One of the advantages
of using ion-exchange resins as catalysts is their particulatenature, which allows mechanical separation (e.g., filtration ordecantation) between catalyst and reactor effluent.19 The factthat these resins can be regenerated is also interesting, and itcan lead to lower operating costs. However, due to their lowpurchasing cost, buying a new resin load is sometimes preferredto regeneration. Despite their high acid concentration, theseresins can be conveniently used in mild steel equipment, sincethe fraction of acid groups at the surface of the bead in contactwith the equipment is very small compared to the total numberof acid groups present.19,20
The major disadvantage of using ion-exchange resins ascatalysts is their relatively low thermal stability. The use ofthese resins is not recommended above 120 °C, although thereare more expensive resins, such as Nafion, which can be used attemperatures as high as 200 °C.19 A loss of catalyst activity isobserved during plant operation; this deactivation can becaused by several mechanisms.19 Adsorption of metal ions, suchas iron, can displace the hydrogen atoms of the sulfonic groupsand block reactants from entering the pores. In the presence ofoxygen, or other strong oxidizing agents, iron may cause de-cross-linkage and swelling of the resin beads. Nitriles, such asacetonitrile, can deactivate the catalyst as their hydrolysesgenerate ammonia which, in turn, reacts with the sulfonic acidgroups, removing their hydrogen ions. Blockage of the activesites can occur by the presence of polymeric impurities, such asbutadiene and acetylenes, which polymerize when in contactwith the catalyst active sites. Finally, desulfonation of thecatalyst due to hydrolysis
+ → +RSO H H O RH H SO3 2 2 4 (4)
where R is the catalyst matrix, causes a decrease in acid siteconcentration19 and, thus, a loss in activity. The desulfonationrate depends exponentially on the temperature.21,22
Dixit and Yadav23 studied the deactivation of ion-exchange-resin catalysts by self-poisoning in the alkylation reaction of o-xylene with styrene. They concluded that deactivation was aconsequence of the formation and deposition of styreneoligomers. Later, the authors carried out the simulation of thedeactivation process using network models.24 The impact ofnitrogen-containing compounds has also been studied. Quirogaet al.25 investigated the presence of acetonitrile during MTBE
Figure 1. Simplified block diagram of the ETBE production process.
Industrial & Engineering Chemistry Research Article
dx.doi.org/10.1021/ie302030j | Ind. Eng. Chem. Res. 2012, 51, 15018−1503115019
synthesis. They explained the observed activity loss with thepresence of acetamide, formed during the hydrolysis ofacetonitrile. They also concluded that the role of ammonia asa deactivating agent could not be neglected. Parra et al.26 alsoused the MTBE synthesis reaction to study the effects of thepresence of impurities. They investigated the effect of ammoniaand iron, and they concluded that both ions have a strongimpact on catalyst deactivation.Petrus et al.21 studied the thermal deactivation of acid ion-
exchange resins. These authors modeled the rate of loss ofsulfonic acid groups due to hydrolysis. They used a stainlesssteel tubular reactor, containing approximately 5 mL of resinsample (with a particle size of 0.6−1 mm). Demineralized waterwas passed through the bed at different temperatures (in therange 150−204 °C), and catalyst activity was measured withtime by continuous titration of the effluent with NaOH. Eventhough the authors were successful in modeling the loss rate ofsulfonic acid groups, the parameters were obtained when thehydrolyzing medium was pure water. However, this is not thecase when MTBE or ETBE synthesis is considered, since inthese processes the water is present in trace amounts. Aragon etal.22 also studied the deactivation due to hydrolysis of sulfonicgroups in the self-condensation reaction of cyclohexanonecatalyzed by Amberlyst-15. These authors concluded that therate constant proposed by Petrus et al.21 was not adequate todescribe the observed loss of activity due to sulfonic grouphydrolysis. The differences were attributed to much lower watercontent and smaller particle size (0.053−0.08 mm).22
The use of ion-exchange resins as catalysts is still the subjectof current research. Songwei et al.27 recently studied thedesulfonation of these catalysts during isobutene dimerization.Catalyst acidity was determined using a titrimetric procedure.The authors found that the presence of water has a significantimpact on desulfonation.Given the diversity and dispersion of results available in the
literature, the goal of this work is the development of amechanistic dynamic model that is able to accurately describethe operation of the reactors in the ETBE process, consideringthe formation of coproducts DIB and TBA. Since the catalystdeactivation plays a major role in the operation of the reactors,an important part of this work is the use of industrial datarelative to the operation of these units, to support theparameter estimation and model validation phases requiredduring the model development. In order to compare theactivity of the used catalysts with the model predictions, asimple experimental procedure was devised, which is describedin the Experimental Section.
■ EXPERIMENTAL SECTION
To assess the residual activity of the catalyst in reactor 1, spentcatalyst samples were collected at the end of a catalyst run(September 2011), when complete catalyst replacementoccurred. After a drying stage with nitrogen, the catalyst wasdischarged by gravitation and stored in three big bags; threecatalyst samples were taken, one from the top of each big bag.The spent catalyst activity was determined using a simpletitration procedure, consisting of the following steps:• Five milliliters of the spent catalyst was placed in a glass
column containing 5 mL of demineralized water and washedwith 25 mL of demineralized water at a rate of 1 mL/min.• Ninety-five milliliters of sodium chloride solution (2.5 wt
%) was passed through the catalyst at a rate of 1 mL/min. The
effluent was collected in a 100 mL flask and topped up to themark with demineralized water.• Ten milliliters of this effluent was diluted with 90 mL of
demineralized water and titrated against methyl orange, with0.1 N aqueous sodium hydroxide solution (NaOH). Theconcentration of the NaOH solution had been previouslydetermined by titration with a hydrochloric acid standardsolution.Prior to determining the activity of the spent catalyst
samples, this method was tested using a sample of fresh catalyst,whose activity was known. To check the repeatability of themethod, the activity of the fresh catalyst sample was determinedsix times. The activity obtained for the fresh catalyst sample was0.97 ± 0.02. Since this is practically unitary, this method wasconsidered adequate to determine the activity of the spentcatalyst samples.
■ RECONCILIATION OF INDUSTRIAL DATA
As mentioned previously, industrial data were used to validatethe model for the reaction section of the ETBE process. Sincethe available raw plant measurements do not allow the closureof the material balances, a data reconciliation procedure wasintroduced to allow prior verification of the material balanceequations, while minimizing deviations from the measuredvalues.The industrially available data consisted of flow measure-
ments of streams 1, 4, 5, 8, 12, 13, 14, 15, and 19 in the processdiagram of Figure 1. Chemical analysis were performed on adaily basis on streams 1 (raffinate I) and 13 (ETBE industrialproduct), twice a week on stream 19 (recycled ethanol), andonce a week on stream 14 (raffinate II intermediate). Theraffinate II intermediate consists essentially of the inerts presentin raffinate I (butanes, 1-butene, and 2-butene). Afterhydrogenation, this stream is referred to as raffinate II, whichis recycled back to the steam cracker.Since flow rate data and composition analysis data were not
available for all streams of the process with the desiredfrequency, the following assumptions were used:• Fresh ethanol does not contain any water.• Since the stream flow rate data were collected every hour
and analysis of streams 1 and 13 were taken daily, it wasassumed that the compositions of these streams remainedconstant until their next measurements became available.• The composition of stream 19 was also assumed to remain
constant during the days that this analysis was not executed,despite the fact that it was only carried out twice a week. In fact,their values do not change significantly, since the recycledethanol has a (near) azeotropic composition.• Analyses of stream 14 were not considered, since they
varied significantly with every measurement. Increasing thefrequency of this analysis was not feasible, since this wouldneed to be considered during an extended period of time.• Even though the flow rate of stream 14 was available, its
value was also not considered, due to the existence of knownproblems with the calibration of this sensor. This issue waslooked into during the period of this study by the plant staff,but it had already affected part of the data. Consequently, thisinformation was not incorporated in this analysis, to avoid theintroduction of significant nonrandom errors.• Ethanol is only present in the top product of the ETBE
column (Figure 1). Isobutene, 1-butene, and n-butane are alsorecovered as top products in the ETBE column. ETBE, DIB,
Industrial & Engineering Chemistry Research Article
dx.doi.org/10.1021/ie302030j | Ind. Eng. Chem. Res. 2012, 51, 15018−1503115020
and TBA formed in the reactors, as well as water, are bottomproducts in this column.• The aqueous and organic phases present in the ethanol
washing column are immiscible. Ethanol present in the organicphase is completely recovered in the aqueous phase in thiscolumn.Considering these assumptions, a first-principles process
model was created, consisting of material balances to thedifferent units in the diagram of Figure 1. For simplicity ofusage at the industrial plant, this model was implemented inMS Excel, using the application Solver. The objective functionused was
∑ ∑σ σ
−+
−⎡⎣⎢⎢
⎛⎝⎜
⎞⎠⎟
⎛⎝⎜
⎞⎠⎟
⎤⎦⎥⎥
F w F F FminF c v
v c v c
c s
s s
s( , )
calc, , calc,2
calc, meas,2
scalc,
(5)
where s ∈ S ≡ {1, 4, 5, 8, 12, 13, 15, 19} represents the streamset for which flow measurements are available, and (c,v) ∈ Q ≡{(ETBE, 13), (H2O, 19)} are a pair of compounds and streamsfor which composition measurements can be used. Equation 5is composed of two main parts, where the first summationpenalizes the deviations in the partial mass balances relative tothe compounds for which chemical compositions are availableand the second summation penalizes deviations in themeasured total flow rates at the existing sampling points.This objective is used subject to the mass balance constraintsfor every species in each process unit, ensuring the consistencyof the derived values. Within the limits of the previousassumptions, this procedure is therefore able to produce anupdated set of estimated values Fcalc,s every hour, using the mostrecently available raw process data. In eq 5, a value of σc = 10−4
was used, together with a convergence tolerance of 10−5.
■ MODEL DEVELOPMENT AND VALIDATIONMETHODOLOGY
A mechanistic dynamic model of the industrial reactors wasdeveloped and implemented in gPROMS Modelbuilder 3.3.1,using Aspen Plus 2006.5 to provide the required physicalproperty models, through the CAPE-OPEN standard.Process Details and Model Assumptions. A more
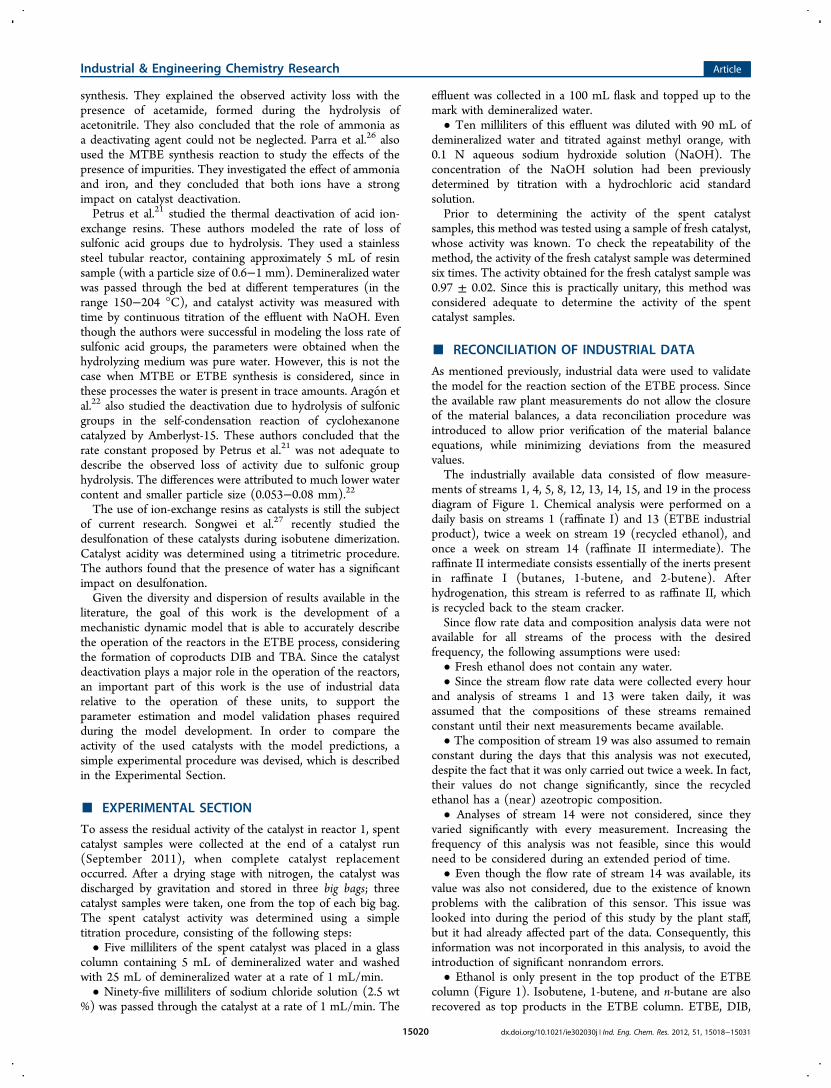
detailed view of the reaction section is given in Figure 2. Asmentioned previously, reactor 1 has a multitubular fixed-bedstructure, cooled with water. The reactor feed is allocated to thetube side and cooling water is allocated to the shell side, incocurrent mode. The division of the reactor volume into severaltubes improves the heat exchange in the equipment, byincreasing the lateral area; additionally, the possibility of hot-
spot formation is also decreased compared to the single-tubearrangement. In order to maintain all the compounds in theliquid phase, reactor 1 operates at 14 bar. Ideally, this reactor isoperated isothermally. However, due to fast reaction kineticsand high exothermicity, not all of the heat generated by thereaction near the reactor inlet is removed fast enough, resultingin a temperature peak.Reactor 2 operates in series with reactor 1 and has a single-
tube fixed-bed configuration. Since the feed is practicallycompletely converted in reactor 1, the amount of heatgenerated in reactor 2 is low, and consequently this equipmentdoes not require a cooling agent. While the purpose of reactor 1is to convert the majority of the feed, the purpose of reactor 2 isto further increase conversion. To achieve this, the inlettemperature of reactor 2 is decreased to approximately 40 °C,which promotes the forward exothermic reaction of the ETBEequilibrium (eq 1). In addition, reactor 2 plays an importantrole in compensating for the loss of conversion in reactor 1, dueto catalyst aging.The UNIFAC method was used to calculate the activity
coefficients of the liquid phase, given its significant deviationfrom ideality; this is a common assumption when modeling theETBE system.7,28−31 In order to reduce the complexity of theresulting model, additional simplifications were introduced:• Both reactors were described by the dynamic pseudoho-
mogeneous plug-flow reactor model.32
• The shell side was modeled as a tube with an equivalentarea.• The presence of inerts (1-butene and n-butane) was
considered, as they play an important role in increasing thethermal inertia of the system.• No pressure drop through the fixed beds nor in the shell
side was considered. The reaction mixture is in the liquid phase;consequently, the effect of the pressure drop on the physicalproperties is negligible.• Only heat exchanged between the tube side and the shell
side in reactor 1 is considered. No heat losses to the outside bythe cooling water through the reactor shell were accounted for.• Reactor 2 operates adiabatically.• The reaction enthalpies were assumed to be constant in
each reactor.• The unique cause considered for catalyst deactivation was
desulfonation (eq 4). Since both fresh ethanol and raffinate Iare passed through feed treaters (Figure 1), it is assumed thatall compounds containing nitrogen, as well as all metals, areremoved in the feed treatment section.
Mathematical Description of the Model. A completedescription of the equations that compose the dynamic modelfor the ETBE production is given in this section.
Material and Heat Balances. The mass balance for the ithcomponent in the nth reactor is given by the followingequation:
∑ε ρ ν∂∂
= −∂∂ *
+C
t
F
A N L
C
zi n V n
n n n
i n
ji j j nb
, ,
CS, t,
,b , ,
(6)
The heat balances for the tube side of reactors 1 and 2 aregiven byFigure 2. Detailed scheme of the reactor section.
Industrial & Engineering Chemistry Research Article
dx.doi.org/10.1021/ie302030j | Ind. Eng. Chem. Res. 2012, 51, 15018−1503115021
∑ ∑ρ ρ
ν
∂∂
= −∂∂ *
+ −Δ
− −
CTt
FC
A N LTz
H
Ud
T T
( ) ( )
4( )
pp
p jj
p j j
11 1 ,f,1
CS,1 t,1 1
1b R, ,1
, ,1t,int ,1
1 cw(7)
∑ ∑
ρ
ρ ν
∂∂
= −∂∂ *
+ −Δ
CTt
F C
A N LTz
H
( )
( )
pp
p jj p j j
22 2 ,f,2
CS,2 t,2 2
2
b R, ,2 , ,2(8)
The heat balance for the shell side of reactor 1 is given by
ρ∂∂
= −∂∂ *
+ −
CT
t
F C
A LTz
UA N
d AT T
4( )
pp
cw ,cwcw cw ,cw
e 1
cw
CS,1 t,1
t,int ,1 e1 cw
(9)
Kinetic Model. Three reactions and eight lumps areconsidered in this work. 1-Butene and n-butane were chosento represent the inert secondary olefins and paraffins,respectively. While ETBE, EtOH, water, IB, and TBA arelumps representing single components, DIB is a lump thatrepresents two isomers (2,4,4-trimethyl-1-pentene and 2,4,4-trimethyl-2-pentene). The corresponding chemical reactionsare described by eqs 1−3.Zhang et al.6 published an expression for the kinetic law of
the ETBE formation. This kinetic expression, also adopted byvarious other authors,7,28,33−35 is based on the LHHW model.The accepted reaction mechanism involves first the adsorptionof ethanol at two catalyst sites and the adsorption of isobuteneat another adjacent site. The rate determining step is theetherification reaction between the adsorbed reactants, whilethe final step is the desorption of the product.6 Since the liquidphase is nonideal, this equation involves liquid activities, whichare here computed using the UNIFAC model. Despite theexistence of secondary olefins, these are assumed to bechemically inert since isobutene forms a tertiary carbeniumion, which is more stable.6,36 The resulting kinetic equation is
= Φ−
+
⎜ ⎟⎛⎝
⎞⎠k a a
K a(1 )n n
n n na
K a
n nETBE,
rate,ETBE, EtOH,2
IB,
ad,EtOH, EtOH,3
n
n n
ETBE,
eq,ETBE, EtOH,
(10)
where the variable Φn was introduced to express the catalystdeactivation. The rate of deactivation is given by eq 20 (sectionCatalyst Deactivation). When deducing this rate law, anassumption was made that EtOH is the most abundant lumpadsorbed at the catalyst surface. As explained in the sectionMolecular Modeling, this is justified by the fact that,considering the lumps with highest adsorption enthalpies(EtOH, water, and TBA), EtOH is the lump present in thehighest amount.The kinetic constant for the ETBE formation and the ethanol
adsorption constant are given by
= −⎛⎝⎜
⎞⎠⎟k k
E
RTexpn
nrate,ETBE, 0,ETBE
a,ETBE
(11)
θθ
= +KT
ln nn
ad,EtOH, ETBE,1ETBE,2
(12)
The equilibrium constant for the ETBE reaction waspreviously studied by Jensen and Datta:5
δδ
δ
δ δ δ
= + +
+ + +
KT
T
T T T
ln lnnn
n
n n n
eq,ETBE, ETBE,1ETBE,2
ETBE,3
ETBE,4 ETBE,52
ETBE,63
(13)
The kinetics and equilibrium of TBA formation have beenpreviously studied.18,37,38 In this work, the rate law proposed byVelo et al.18 was used. These authors determined the kineticexpression of TBA formation in a solvent-free liquid system, indilute aqueous conditions. The rate expression proposed is
= Φ−
+
⎜ ⎟⎛⎝
⎞⎠k C C
K C1n n
n n nC
K
n nTBA,
rate,TBA, IB, H O,
ad,TBA, TBA,
n
n2
TBA,
eq,TBA,
(14)
Even though the ETBE rate law (eq 10) assumes that ethanolis the most abundant component adsorbed to the catalystsurface, the rate law for TBA formation contains only the TBAadsorption term (eq 14). This assumption was considered sothat the rate law, and the expressions for the kinetic,equilibrium, and adsorption terms, would be coherent withthe work of Velo et al.18
The TBA formation reaction kinetic constant and TBAadsorption constant are given by18
= −⎛⎝⎜
⎞⎠⎟k k
E
RTexpn
nrate,TBA, 0,TBA
a,TBA
(15)
θθ
= +⎛⎝⎜
⎞⎠⎟K
Texpn
nad,TBA, TBA,1
TBA,2
(16)
Also, in order to use a thermodynamically consistent rate law,the equilibrium constant expression proposed by the authors18
was also used:
δδ
= +⎛⎝⎜
⎞⎠⎟K
Texpn
neq,TBA, TBA,1
TBA,2
(17)
The formation of DIB has also been studied in previousworks;8,12,13,39 here, the DIB formation is described by the ratelaw proposed by Haag.8 This model was also used bySundmacher et al.13 to represent the effect of multiple reactionsin the MTBE and TAME reactive distillation processes.However, these authors did not take into account the presenceof TBA.The formation of DIB follows a Langmuir−Rideal
mechanism,8 where the rate determining step is the reactionbetween one molecule of adsorbed IB and one molecule of IBin solution:
= Φ+
ka
K a an n nn
n nDIB, rate,DIB,
IB,2
r EtOH, IB, (18)
Even though it is assumed that EtOH is the most abundantcomponent adsorbed at the catalyst surface, the rate lawexpressed by eq 10 considers the existence of adsorbed IB. Intheir work on the MTBE synthesis, Sundmacher et al.13
estimated the sorption constants ratio (Kr) between methanoland isobutene to be 500; this value is also adopted here. Thekinetic constant for DIB formation is given by
Industrial & Engineering Chemistry Research Article
dx.doi.org/10.1021/ie302030j | Ind. Eng. Chem. Res. 2012, 51, 15018−1503115022
= − −⎛⎝⎜⎜
⎛⎝⎜
⎞⎠⎟⎞⎠⎟⎟k k
E
R Texp
1 1334.42n
nrate,DIB, 0,DIB
a,DIB
(19)
Catalyst Deactivation. In order to protect the catalyst in thereactors, both fresh ethanol and raffinate I previously passthrough fixed-beds containing the same catalyst used in thereactors (feed treaters), to remove metals and compoundscontaining nitrogen. Hence deactivation was assumed to beonly caused by desulfonation (eq 4). This phenomenon isconsidered to be nonselective, affecting similarly all chemicalreactions.Deactivation was accounted by introducing a parameter Φ in
the kinetic models, expressing the ratio between the number ofcatalyst acid sites available at a given instant to the total numberof active sites present in the fresh catalyst. This variable is thusrestricted to the interval Φ ∈ [0,1], decreasing monotonicallywith the catalyst age. The deactivation kinetics is described by
∂Φ∂
= − − − Φ α⎛⎝⎜⎜
⎛⎝⎜
⎞⎠⎟⎞⎠⎟⎟t
kE
R Texp
1 1334.42
n
nn0,d
a,d
(20)
with an adjustable catalyst decay order α, to allow a close matchto the observed variations in the catalyst activity.Additional Equations for the Tube Side. The activity of
lump i is given by=a y xi n i n i n, , , (20a)
The molar and mass fractions are given, respectively, by
=∑
xC
Ci ni n
j j n,
,
, (21)
=∑
wM C
M Ci ni i n
j j j n,
w, ,
w, , (22)
The molar flow rate of lump i and the total molar flow rateare given, respectively, by
=F C FM i n i n V n, , , , (23)
∑=F FM ni
M i n,total, , ,(24)
Additional equations for the cross-section area of a singletube and volumetric flow rate are given by
π=A d /4n nCS, t,int ,2
(25)
ρ=F F /V n n n, f, (26)
Since the reaction occurs in the liquid phase, the enthalpy ofreaction was assumed to be constant in each reactor. The valuefor the enthalpy of reaction used was corrected to the inlettemperature of each reactor, using the heat capacities of eachlump.40 Equation 27 is used to calculate the mixture averageheat capacity between the reference temperature (Tref = 298.15K) and the nth reactor inlet temperature (Tin,n). Equation 28 isused to determine the corrected enthalpy of reaction.
∑ − =−
=
C T T bT T
k( )p i n n
kk i
nk k
, , in, ref1
4
,in, ref
(27)
Δ = Δ ° + −H H C T T( )j n j p i n nR, , R, , , in, ref (28)
Important variables, such as conversion, yields, and selectivitywere determined by the following equations.
=−
xF F
FnM n M n
M n
,in,IB, ,IB,
,in,IB, (29)
=− * =
xF F z
F
( 1)M M
Mglobal
,in,IB,1 ,IB,2
,in,IB,1 (30)
ν=
| | −→yF F
F
( )p n
p M p n M p n
M n,
IB,IB , , ,in, ,
,in,IB, (31)
= S y x100 /p n p n n, , (32)
where FM,in,i,n = FM,i,n(z* = 0).Additional Equations for the Shell Side. Reactor 1 is cooled
by water, which is allocated to the shell side. The feed isallocated to the tube side, which has a triangular arrangement.Kern’s method41 was used for the determination of the shellequivalent diameter and area. For a triangular tubulararrangement, the equivalent diameter is given by
= −Dd
p d1.10
( 0.917 )et,out,1
t2
t,out,12
(33)
where the pitch is the distance between two tube centers. Theequivalent shell side cross-section area is given by
=−
Ap d
pD Be
t t,out,1
ts,int ,1 S
(34)
Initial, Boundary, and Continuity Conditions. Theboundary conditions used for z* = 0 are
= = =CF w
F MT T T T; ;i n
n i n
V n in n,
in, ,
, w,in, cw in,cw
(35)
The initial conditions used were the following:
∂∂
=∂∂
=∂∂
=C
tTt
Tt
0i n n, cw(36)
Φ =z(0, ) 11 (37)
ϕΦ =z(0, )2 res (38)
Here ϕres is the residual activity for reactor 2. This parameteris explained in more detail in section Parameter Estimation andModel Validation.Both reactors are connected in series, requiring the use of
continuity equations:
= = * =F F w w z; ( 1)i i2 1 in, ,2 ,1 (39)
An additional degree of freedom (Tin,2) is introduced by thepresence of a heat exchanger between the two reactors (Figure2).
Numerical Solution. The model equations were solvedusing the gPROMS simulation software, version 3.3.1. Thesystem of integro-partial differential and algebraic equations(IPDAEs) was solved using the method of lines (MOL) familyof numerical methods. This involves the discretization of thedistributed equations with respect to all spatial domains, whichwas achieved using orthogonal collocation on finite elements(OCFE). The numerical parameters relative to the discretiza-tion are presented in Table 1. In Table 1, the order of the
Industrial & Engineering Chemistry Research Article
dx.doi.org/10.1021/ie302030j | Ind. Eng. Chem. Res. 2012, 51, 15018−1503115023
method corresponds to the order of the interpolatingpolynomials used in each element.
Parameter Estimation and Model Validation. While themodel developed in this work incorporates previous kineticinformation, industrial data are still required for parameterestimation and model validation. In this case, the estimatedparameters were the heat transfer coefficient of reactor 1 (U),the constants of the deactivation kinetic term (k0,d, Ea,d, and α),the constants of the DIB formation kinetic constant (k0,DIB andEa,DIB), and the residual catalyst activity of reactor 2 (ϕres). Thekinetic constant equations for the deactivation and DIBformation were reparametrized, in order to decrease thestatistical correlation between the pre-exponential factor andthe activation energy in these equations.42
The industrial data available for this part of the workconsisted of a set of mass flow rates and compositions forstreams 1−19 (Figure 1), except for the reactors' intermediatestream (stream 10). These data were first subjected to thereconciliation methodology described in the section Reconcilia-tion of Industrial Data. Plant temperatures measured onlinewere also made available, including the temperature profiles inboth reactors. For reactor 1, both the inlet and outlettemperatures, as well as a temperature profile (consisting ofsix intermediate temperatures), were available, but for thecooling water only the inlet and outlet temperatures wereregistered. For reactor 2, a total of four temperatures weremeasured (two for the inlet and outlet and two intermediatetemperatures). The coordinates of the temperature profilemeasurements are presented in Table 2, where z* ∈ [0,1] is thenormalized reactor length.
Data were gathered during the time period of August 2010 toSeptember 2011, with missing values for the months ofSeptember 2010 to December 2010 and February 2011 toMarch 2011. Reactor 1 was loaded with fresh catalyst in August2010 and September 2011. Consequently, the available data ofSeptember 2011 can be divided in two distinct periods: onecorresponding to the end of the catalyst run and the othercorresponding to the beginning of the next catalyst run. Theprocess data used were divided into three subsets:
• Data set 1 corresponds to the available measurementsbetween August 2010 and May 2011. Reactor 1 was loadedwith fresh catalyst at the beginning of this interval.• Data set 2 corresponds to 1 week of measurements in mid-
September 2011, when reactor 1 was reloaded with freshcatalyst.• Data set 3 corresponds to the periods where reactor 1 was
loaded with fresh catalyst (in August 2010 and September2011).Parameter estimation was carried out in gPROMS. The
methodology followed is presented in Figure 3. First, themeasured temperature profile, as well as the cooling wateroutlet temperature of data set 2 for reactor 1, was used toestimate the heat transfer coefficient in this reactor. Sincereactor 1 was loaded with fresh catalyst, the activity of thecatalyst was considered as its maximum value during the shortperiod of data set 2.Because reactor 2 is exposed to much lower temperatures
than reactor 1, its catalyst life cycles are longer, andconsequently the catalyst is replaced less often. This posedthe problem of determining the catalyst activity profile inreactor 2 at the beginning of the tests, when only reactor 1 wasreloaded. Since reactor 2 was charged with fresh catalyst inApril 2003, and there were no available data between April2003 and August 2010, a residual activity parameter (ϕres) wasintroduced in the model of reactor 2. This parametercorresponds to a mean catalyst activity through the entirelength of the bed that occurs when the catalyst in reactor 1 isreplaced. Its estimation from data set 3 was possible assuming aconstant activity profile through the entire reactor. This wasused for initialization of the simulation model; after this step,the catalyst activity in reactor 2 was described by the generalmodel of eq 20. It should be noted that this would not be anadequate procedure for reactor 1, since in this reactor thetemperature varies between 40 and 100 °C, causing a verypronounced decay of the catalyst activity in specific zones of thebed, due to the exponential dependence on the temperature(eq 20). In reactor 2, the temperature profile is much smoother,with variations between 40 and 45 °C.The residual catalyst activity for the data set 3 was
consequently determined by fitting the predicted and measuredtemperature profiles, using a least-squares objective:
∑ ∑ −ϕ
T Tmin ( )t k
t k t kcalc, , meas, ,2
res (40)
where Tmeas,t,k represents the measurement taken at the timeinstant t, in the sampling point k. Using a modified version ofthis objective, the estimation of ϕres at a given time instant t isalso possible, and the various measures obtained through thisprocess can be combined to assess the variance of the estimatesof ϕres thus produced.With the heat transfer coefficient and the catalyst residual
activity of reactor 2 in August 2010, the kinetic deactivationparameters of the catalyst were then jointly estimated. Thecatalyst used during this period was Lewatit K-2629. For thispurpose, the evolution of the measured temperature profile ofreactor 1 was used (data set 1). The temperature profile ofreactor 2 was not considered in the estimation of thedeactivation parameters. Since this reactor is responsible foronly approximately 4% of the total conversion, the differencebetween the inlet and outlet temperatures is very small (ca. 5°C) compared to reactor 1. It is important to take intoconsideration that the deactivation parameters were estimated
Table 1. Numerical Parameters Used in the SpatialDiscretization
numerical discretization
reactor 1 reactor 2
method OCFE OCFEnumber of elements 100 20order 4 2
Table 2. Temperature Measurement Profiles for BothReactors, as a Function of Normalized Length (z*)
measurement z* of reactor 1 z* of reactor 2
inlet 0 0A 0.1 0.35B 0.27 0.69C 0.43 −D 0.6 −E 0.77 −F 0.93 −outlet 1 1
Industrial & Engineering Chemistry Research Article
dx.doi.org/10.1021/ie302030j | Ind. Eng. Chem. Res. 2012, 51, 15018−1503115024
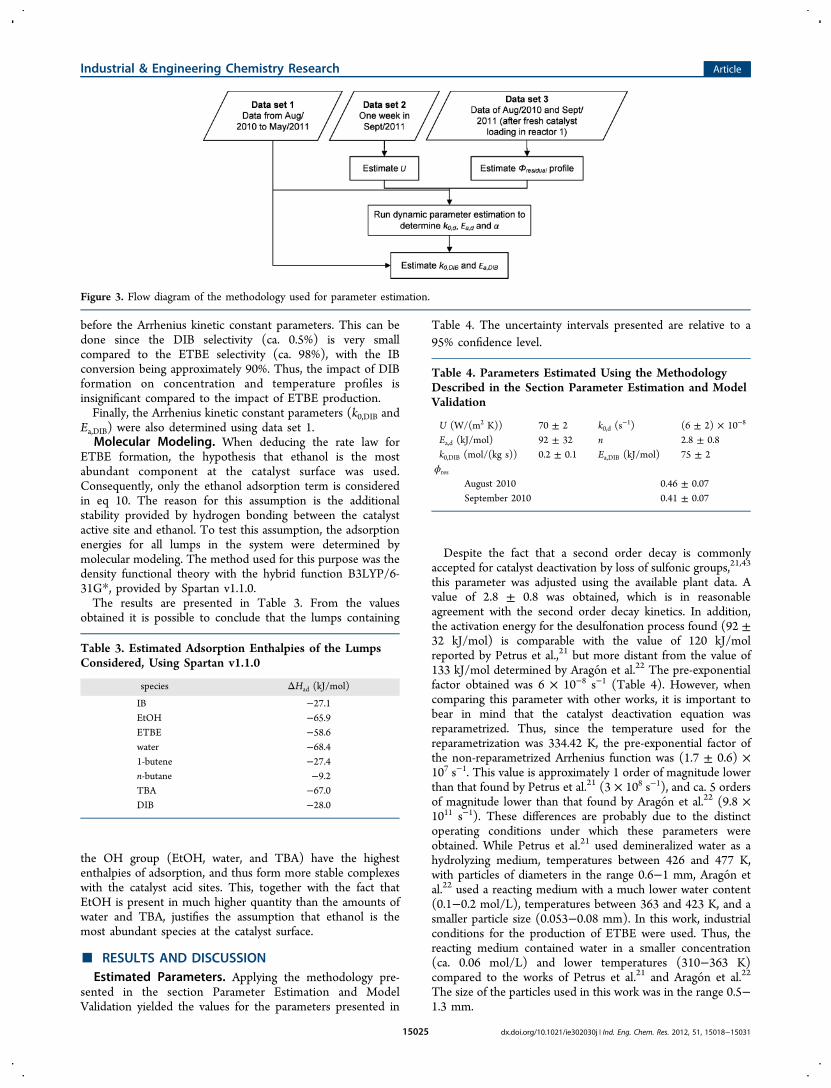
before the Arrhenius kinetic constant parameters. This can bedone since the DIB selectivity (ca. 0.5%) is very smallcompared to the ETBE selectivity (ca. 98%), with the IBconversion being approximately 90%. Thus, the impact of DIBformation on concentration and temperature profiles isinsignificant compared to the impact of ETBE production.Finally, the Arrhenius kinetic constant parameters (k0,DIB and
Ea,DIB) were also determined using data set 1.Molecular Modeling. When deducing the rate law for
ETBE formation, the hypothesis that ethanol is the mostabundant component at the catalyst surface was used.Consequently, only the ethanol adsorption term is consideredin eq 10. The reason for this assumption is the additionalstability provided by hydrogen bonding between the catalystactive site and ethanol. To test this assumption, the adsorptionenergies for all lumps in the system were determined bymolecular modeling. The method used for this purpose was thedensity functional theory with the hybrid function B3LYP/6-31G*, provided by Spartan v1.1.0.The results are presented in Table 3. From the values
obtained it is possible to conclude that the lumps containing
the OH group (EtOH, water, and TBA) have the highestenthalpies of adsorption, and thus form more stable complexeswith the catalyst acid sites. This, together with the fact thatEtOH is present in much higher quantity than the amounts ofwater and TBA, justifies the assumption that ethanol is themost abundant species at the catalyst surface.
■ RESULTS AND DISCUSSIONEstimated Parameters. Applying the methodology pre-
sented in the section Parameter Estimation and ModelValidation yielded the values for the parameters presented in
Table 4. The uncertainty intervals presented are relative to a95% confidence level.
Despite the fact that a second order decay is commonlyaccepted for catalyst deactivation by loss of sulfonic groups,21,43
this parameter was adjusted using the available plant data. Avalue of 2.8 ± 0.8 was obtained, which is in reasonableagreement with the second order decay kinetics. In addition,the activation energy for the desulfonation process found (92 ±32 kJ/mol) is comparable with the value of 120 kJ/molreported by Petrus et al.,21 but more distant from the value of133 kJ/mol determined by Aragon et al.22 The pre-exponentialfactor obtained was 6 × 10⁻⁸ s−1 (Table 4). However, whencomparing this parameter with other works, it is important tobear in mind that the catalyst deactivation equation wasreparametrized. Thus, since the temperature used for thereparametrization was 334.42 K, the pre-exponential factor ofthe non-reparametrized Arrhenius function was (1.7 ± 0.6) ×107 s−1. This value is approximately 1 order of magnitude lowerthan that found by Petrus et al.21 (3 × 10⁸ s−1), and ca. 5 ordersof magnitude lower than that found by Aragon et al.22 (9.8 ×10¹¹ s−1). These differences are probably due to the distinctoperating conditions under which these parameters wereobtained. While Petrus et al.21 used demineralized water as ahydrolyzing medium, temperatures between 426 and 477 K,with particles of diameters in the range 0.6−1 mm, Aragon etal.22 used a reacting medium with a much lower water content(0.1−0.2 mol/L), temperatures between 363 and 423 K, and asmaller particle size (0.053−0.08 mm). In this work, industrialconditions for the production of ETBE were used. Thus, thereacting medium contained water in a smaller concentration(ca. 0.06 mol/L) and lower temperatures (310−363 K)compared to the works of Petrus et al.21 and Aragon et al.22
The size of the particles used in this work was in the range 0.5−1.3 mm.
Figure 3. Flow diagram of the methodology used for parameter estimation.
Table 3. Estimated Adsorption Enthalpies of the LumpsConsidered, Using Spartan v1.1.0
species ΔHad (kJ/mol)
IB −27.1EtOH −65.9ETBE −58.6water −68.41-butene −27.4n-butane −9.2TBA −67.0DIB −28.0
Table 4. Parameters Estimated Using the MethodologyDescribed in the Section Parameter Estimation and ModelValidation
U (W/(m2 K)) 70 ± 2 k0,d (s−1) (6 ± 2) × 10−8
Ea,d (kJ/mol) 92 ± 32 n 2.8 ± 0.8k0,DIB (mol/(kg s)) 0.2 ± 0.1 Ea,DIB (kJ/mol) 75 ± 2ϕres
August 2010 0.46 ± 0.07September 2010 0.41 ± 0.07
Industrial & Engineering Chemistry Research Article
dx.doi.org/10.1021/ie302030j | Ind. Eng. Chem. Res. 2012, 51, 15018−1503115025
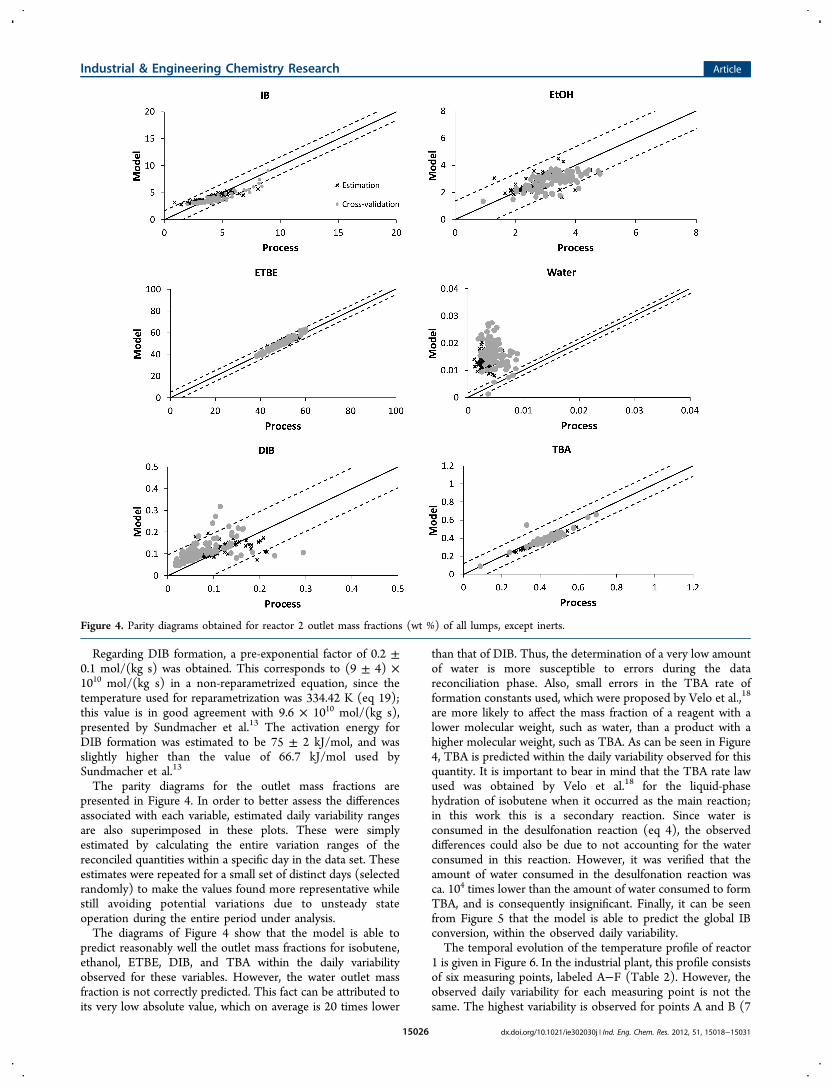
Regarding DIB formation, a pre-exponential factor of 0.2 ±0.1 mol/(kg s) was obtained. This corresponds to (9 ± 4) ×1010 mol/(kg s) in a non-reparametrized equation, since thetemperature used for reparametrization was 334.42 K (eq 19);this value is in good agreement with 9.6 × 10¹⁰ mol/(kg s),presented by Sundmacher et al.13 The activation energy forDIB formation was estimated to be 75 ± 2 kJ/mol, and wasslightly higher than the value of 66.7 kJ/mol used bySundmacher et al.13
The parity diagrams for the outlet mass fractions arepresented in Figure 4. In order to better assess the differencesassociated with each variable, estimated daily variability rangesare also superimposed in these plots. These were simplyestimated by calculating the entire variation ranges of thereconciled quantities within a specific day in the data set. Theseestimates were repeated for a small set of distinct days (selectedrandomly) to make the values found more representative whilestill avoiding potential variations due to unsteady stateoperation during the entire period under analysis.The diagrams of Figure 4 show that the model is able to
predict reasonably well the outlet mass fractions for isobutene,ethanol, ETBE, DIB, and TBA within the daily variabilityobserved for these variables. However, the water outlet massfraction is not correctly predicted. This fact can be attributed toits very low absolute value, which on average is 20 times lower
than that of DIB. Thus, the determination of a very low amountof water is more susceptible to errors during the datareconciliation phase. Also, small errors in the TBA rate offormation constants used, which were proposed by Velo et al.,18
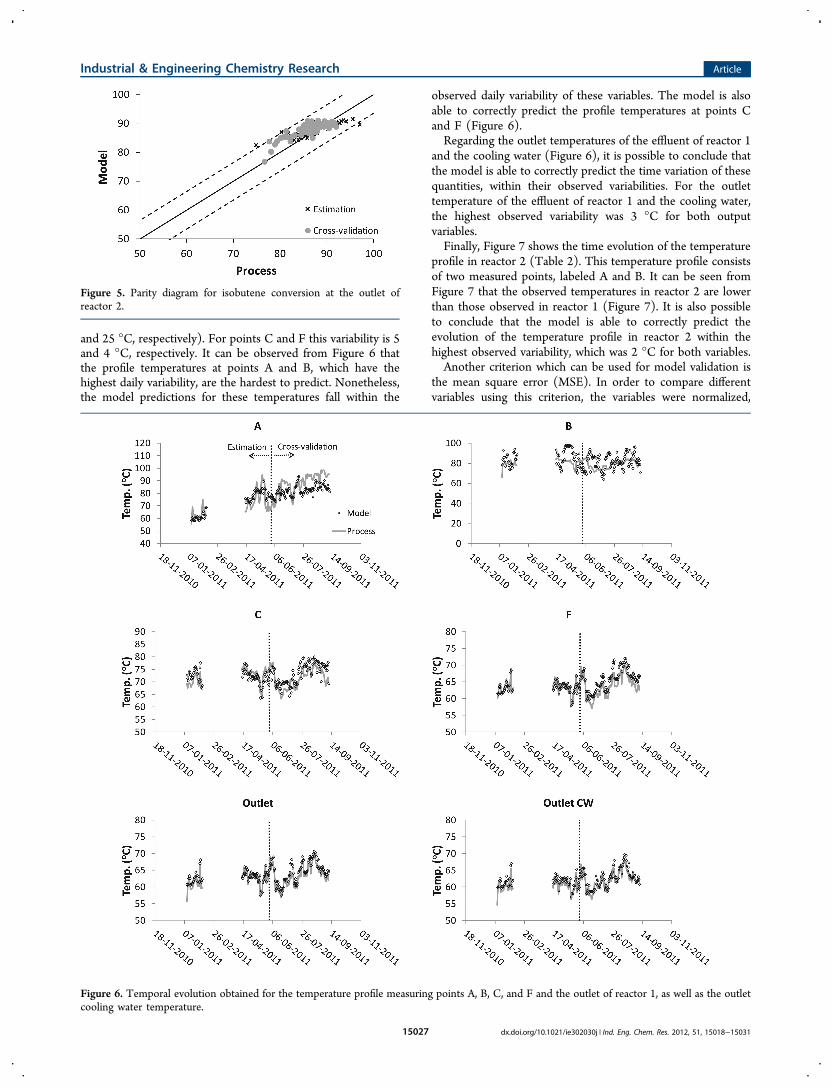
are more likely to affect the mass fraction of a reagent with alower molecular weight, such as water, than a product with ahigher molecular weight, such as TBA. As can be seen in Figure4, TBA is predicted within the daily variability observed for thisquantity. It is important to bear in mind that the TBA rate lawused was obtained by Velo et al.18 for the liquid-phasehydration of isobutene when it occurred as the main reaction;in this work this is a secondary reaction. Since water isconsumed in the desulfonation reaction (eq 4), the observeddifferences could also be due to not accounting for the waterconsumed in this reaction. However, it was verified that theamount of water consumed in the desulfonation reaction wasca. 104 times lower than the amount of water consumed to formTBA, and is consequently insignificant. Finally, it can be seenfrom Figure 5 that the model is able to predict the global IBconversion, within the observed daily variability.The temporal evolution of the temperature profile of reactor
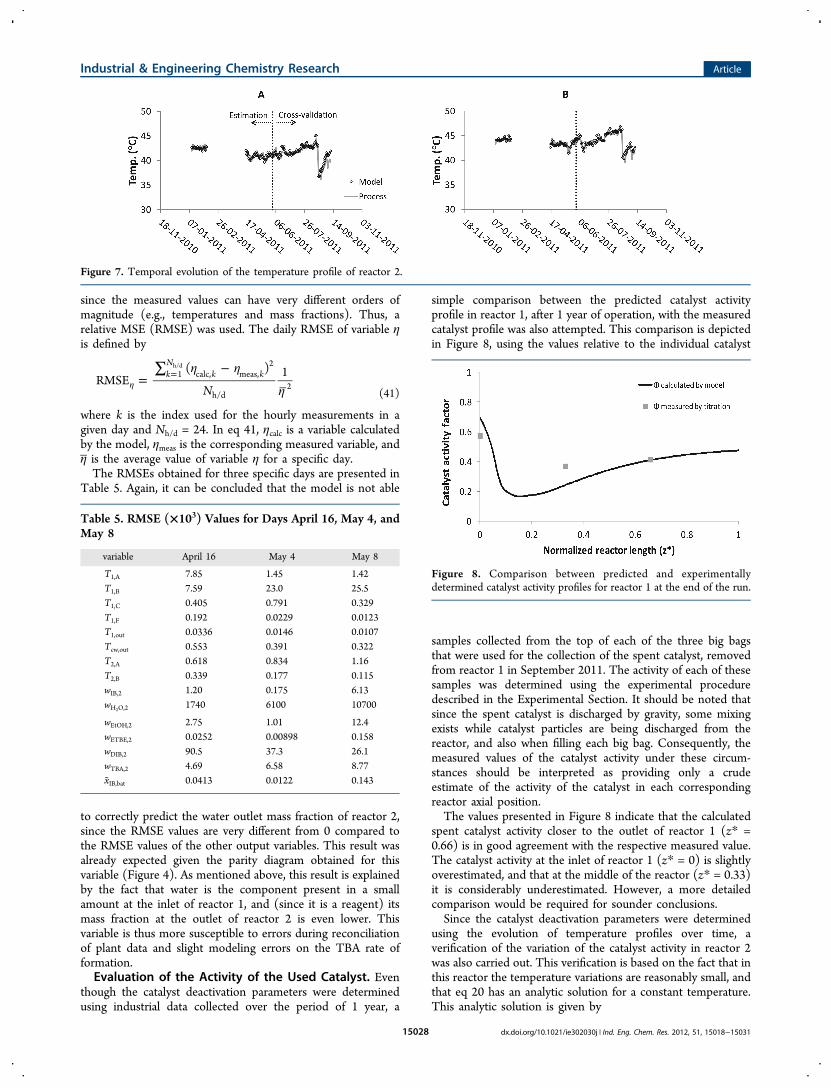
1 is given in Figure 6. In the industrial plant, this profile consistsof six measuring points, labeled A−F (Table 2). However, theobserved daily variability for each measuring point is not thesame. The highest variability is observed for points A and B (7
Figure 4. Parity diagrams obtained for reactor 2 outlet mass fractions (wt %) of all lumps, except inerts.
Industrial & Engineering Chemistry Research Article
dx.doi.org/10.1021/ie302030j | Ind. Eng. Chem. Res. 2012, 51, 15018−1503115026
and 25 °C, respectively). For points C and F this variability is 5and 4 °C, respectively. It can be observed from Figure 6 thatthe profile temperatures at points A and B, which have thehighest daily variability, are the hardest to predict. Nonetheless,the model predictions for these temperatures fall within the
observed daily variability of these variables. The model is alsoable to correctly predict the profile temperatures at points Cand F (Figure 6).Regarding the outlet temperatures of the effluent of reactor 1
and the cooling water (Figure 6), it is possible to conclude thatthe model is able to correctly predict the time variation of thesequantities, within their observed variabilities. For the outlettemperature of the effluent of reactor 1 and the cooling water,the highest observed variability was 3 °C for both outputvariables.Finally, Figure 7 shows the time evolution of the temperature
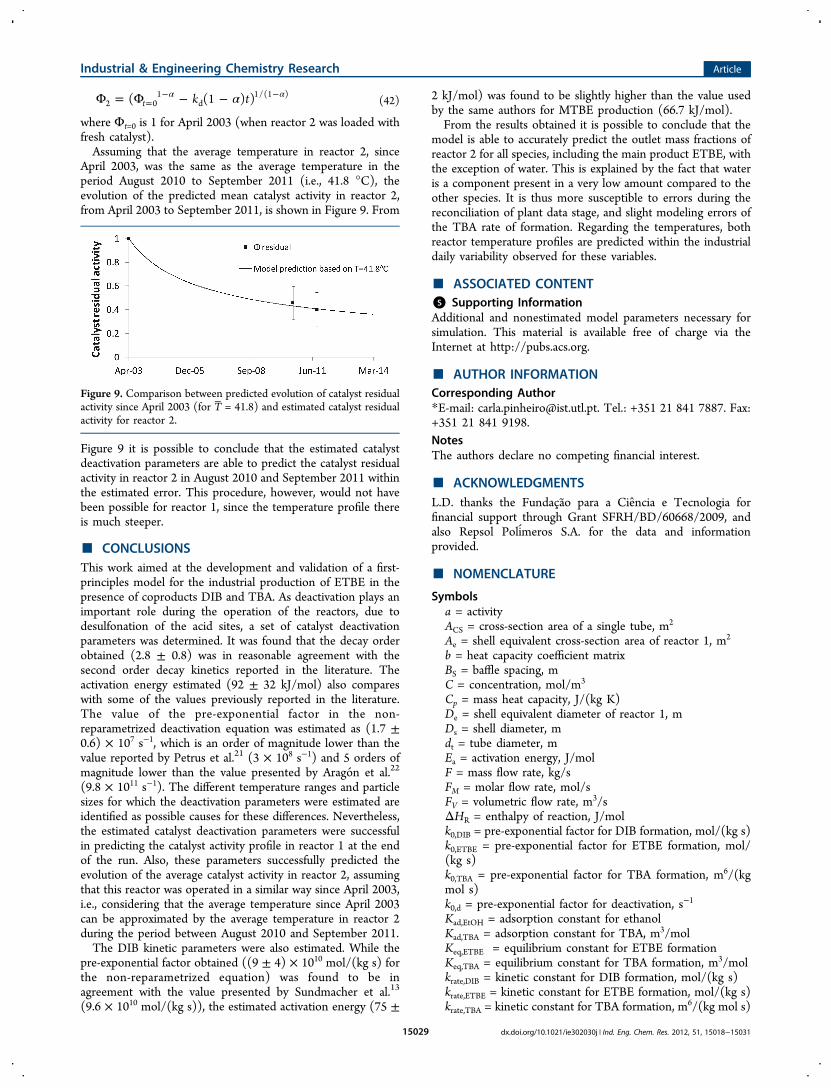
profile in reactor 2 (Table 2). This temperature profile consistsof two measured points, labeled A and B. It can be seen fromFigure 7 that the observed temperatures in reactor 2 are lowerthan those observed in reactor 1 (Figure 7). It is also possibleto conclude that the model is able to correctly predict theevolution of the temperature profile in reactor 2 within thehighest observed variability, which was 2 °C for both variables.Another criterion which can be used for model validation is
the mean square error (MSE). In order to compare differentvariables using this criterion, the variables were normalized,
Figure 5. Parity diagram for isobutene conversion at the outlet ofreactor 2.
Figure 6. Temporal evolution obtained for the temperature profile measuring points A, B, C, and F and the outlet of reactor 1, as well as the outletcooling water temperature.
Industrial & Engineering Chemistry Research Article
dx.doi.org/10.1021/ie302030j | Ind. Eng. Chem. Res. 2012, 51, 15018−1503115027
since the measured values can have very different orders ofmagnitude (e.g., temperatures and mass fractions). Thus, arelative MSE (RMSE) was used. The daily RMSE of variable ηis defined by
η η
η=
∑ −
η
=
NRMSE
( ) 1kN
k k1 calc, meas,2
h/d2
h/d
(41)
where k is the index used for the hourly measurements in agiven day and Nh/d = 24. In eq 41, ηcalc is a variable calculatedby the model, ηmeas is the corresponding measured variable, andη is the average value of variable η for a specific day.The RMSEs obtained for three specific days are presented in
Table 5. Again, it can be concluded that the model is not able
to correctly predict the water outlet mass fraction of reactor 2,since the RMSE values are very different from 0 compared tothe RMSE values of the other output variables. This result wasalready expected given the parity diagram obtained for thisvariable (Figure 4). As mentioned above, this result is explainedby the fact that water is the component present in a smallamount at the inlet of reactor 1, and (since it is a reagent) itsmass fraction at the outlet of reactor 2 is even lower. Thisvariable is thus more susceptible to errors during reconciliationof plant data and slight modeling errors on the TBA rate offormation.Evaluation of the Activity of the Used Catalyst. Even
though the catalyst deactivation parameters were determinedusing industrial data collected over the period of 1 year, a
simple comparison between the predicted catalyst activityprofile in reactor 1, after 1 year of operation, with the measuredcatalyst profile was also attempted. This comparison is depictedin Figure 8, using the values relative to the individual catalyst
samples collected from the top of each of the three big bagsthat were used for the collection of the spent catalyst, removedfrom reactor 1 in September 2011. The activity of each of thesesamples was determined using the experimental proceduredescribed in the Experimental Section. It should be noted thatsince the spent catalyst is discharged by gravity, some mixingexists while catalyst particles are being discharged from thereactor, and also when filling each big bag. Consequently, themeasured values of the catalyst activity under these circum-stances should be interpreted as providing only a crudeestimate of the activity of the catalyst in each correspondingreactor axial position.The values presented in Figure 8 indicate that the calculated
spent catalyst activity closer to the outlet of reactor 1 (z* =0.66) is in good agreement with the respective measured value.The catalyst activity at the inlet of reactor 1 (z* = 0) is slightlyoverestimated, and that at the middle of the reactor (z* = 0.33)it is considerably underestimated. However, a more detailedcomparison would be required for sounder conclusions.Since the catalyst deactivation parameters were determined
using the evolution of temperature profiles over time, averification of the variation of the catalyst activity in reactor 2was also carried out. This verification is based on the fact that inthis reactor the temperature variations are reasonably small, andthat eq 20 has an analytic solution for a constant temperature.This analytic solution is given by
Figure 7. Temporal evolution of the temperature profile of reactor 2.
Table 5. RMSE (×103) Values for Days April 16, May 4, andMay 8
variable April 16 May 4 May 8
T1,A 7.85 1.45 1.42T1,B 7.59 23.0 25.5T1,C 0.405 0.791 0.329T1,F 0.192 0.0229 0.0123T1,out 0.0336 0.0146 0.0107Tcw,out 0.553 0.391 0.322T2,A 0.618 0.834 1.16T2,B 0.339 0.177 0.115wIB,2 1.20 0.175 6.13wH2O,2 1740 6100 10700
wEtOH,2 2.75 1.01 12.4wETBE,2 0.0252 0.00898 0.158wDIB,2 90.5 37.3 26.1wTBA,2 4.69 6.58 8.77xIB,bat 0.0413 0.0122 0.143
Figure 8. Comparison between predicted and experimentallydetermined catalyst activity profiles for reactor 1 at the end of the run.
Industrial & Engineering Chemistry Research Article
dx.doi.org/10.1021/ie302030j | Ind. Eng. Chem. Res. 2012, 51, 15018−1503115028
αΦ = Φ − −α α=
− −k t( (1 ) )t2 01
d1/(1 )
(42)
where Φt=0 is 1 for April 2003 (when reactor 2 was loaded withfresh catalyst).Assuming that the average temperature in reactor 2, since
April 2003, was the same as the average temperature in theperiod August 2010 to September 2011 (i.e., 41.8 °C), theevolution of the predicted mean catalyst activity in reactor 2,from April 2003 to September 2011, is shown in Figure 9. From
Figure 9 it is possible to conclude that the estimated catalystdeactivation parameters are able to predict the catalyst residualactivity in reactor 2 in August 2010 and September 2011 withinthe estimated error. This procedure, however, would not havebeen possible for reactor 1, since the temperature profile thereis much steeper.
■ CONCLUSIONSThis work aimed at the development and validation of a first-principles model for the industrial production of ETBE in thepresence of coproducts DIB and TBA. As deactivation plays animportant role during the operation of the reactors, due todesulfonation of the acid sites, a set of catalyst deactivationparameters was determined. It was found that the decay orderobtained (2.8 ± 0.8) was in reasonable agreement with thesecond order decay kinetics reported in the literature. Theactivation energy estimated (92 ± 32 kJ/mol) also compareswith some of the values previously reported in the literature.The value of the pre-exponential factor in the non-reparametrized deactivation equation was estimated as (1.7 ±0.6) × 107 s−1, which is an order of magnitude lower than thevalue reported by Petrus et al.21 (3 × 10⁸ s−1) and 5 orders ofmagnitude lower than the value presented by Aragon et al.22
(9.8 × 10¹¹ s−1). The different temperature ranges and particlesizes for which the deactivation parameters were estimated areidentified as possible causes for these differences. Nevertheless,the estimated catalyst deactivation parameters were successfulin predicting the catalyst activity profile in reactor 1 at the endof the run. Also, these parameters successfully predicted theevolution of the average catalyst activity in reactor 2, assumingthat this reactor was operated in a similar way since April 2003,i.e., considering that the average temperature since April 2003can be approximated by the average temperature in reactor 2during the period between August 2010 and September 2011.The DIB kinetic parameters were also estimated. While the
pre-exponential factor obtained ((9 ± 4) × 1010 mol/(kg s) forthe non-reparametrized equation) was found to be inagreement with the value presented by Sundmacher et al.13
(9.6 × 10¹⁰ mol/(kg s)), the estimated activation energy (75 ±
2 kJ/mol) was found to be slightly higher than the value usedby the same authors for MTBE production (66.7 kJ/mol).From the results obtained it is possible to conclude that the
model is able to accurately predict the outlet mass fractions ofreactor 2 for all species, including the main product ETBE, withthe exception of water. This is explained by the fact that wateris a component present in a very low amount compared to theother species. It is thus more susceptible to errors during thereconciliation of plant data stage, and slight modeling errors ofthe TBA rate of formation. Regarding the temperatures, bothreactor temperature profiles are predicted within the industrialdaily variability observed for these variables.
■ ASSOCIATED CONTENT*S Supporting InformationAdditional and nonestimated model parameters necessary forsimulation. This material is available free of charge via theInternet at http://pubs.acs.org.
■ AUTHOR INFORMATIONCorresponding Author*E-mail: [email protected]. Tel.: +351 21 841 7887. Fax:+351 21 841 9198.NotesThe authors declare no competing financial interest.
■ ACKNOWLEDGMENTSL.D. thanks the Fundacao para a Ciencia e Tecnologia forfinancial support through Grant SFRH/BD/60668/2009, andalso Repsol Polimeros S.A. for the data and informationprovided.
■ NOMENCLATURE
Symbolsa = activityACS = cross-section area of a single tube, m2
Ae = shell equivalent cross-section area of reactor 1, m2
b = heat capacity coefficient matrixBS = baffle spacing, mC = concentration, mol/m3
Cp = mass heat capacity, J/(kg K)De = shell equivalent diameter of reactor 1, mDs = shell diameter, mdt = tube diameter, mEa = activation energy, J/molF = mass flow rate, kg/sFM = molar flow rate, mol/sFV = volumetric flow rate, m3/sΔHR = enthalpy of reaction, J/molk0,DIB = pre-exponential factor for DIB formation, mol/(kg s)k0,ETBE = pre-exponential factor for ETBE formation, mol/(kg s)k0,TBA = pre-exponential factor for TBA formation, m6/(kgmol s)k0,d = pre-exponential factor for deactivation, s−1
Kad,EtOH = adsorption constant for ethanolKad,TBA = adsorption constant for TBA, m3/molKeq,ETBE = equilibrium constant for ETBE formationKeq,TBA = equilibrium constant for TBA formation, m3/molkrate,DIB = kinetic constant for DIB formation, mol/(kg s)krate,ETBE = kinetic constant for ETBE formation, mol/(kg s)krate,TBA = kinetic constant for TBA formation, m6/(kg mol s)
Figure 9. Comparison between predicted evolution of catalyst residualactivity since April 2003 (for T = 41.8) and estimated catalyst residualactivity for reactor 2.
Industrial & Engineering Chemistry Research Article
dx.doi.org/10.1021/ie302030j | Ind. Eng. Chem. Res. 2012, 51, 15018−1503115029
Kr = sorption constants ratio of EtOH and IBL = reactor length, mMw = molecular weight, kg/molNh/d = number of hours in a dayNt = number of tubespt = pitch, m
= rate of reaction, mol/(kg s)S = selectivityT = temperature, Kt = time on stream, sU = coefficient for heat exchange, W/(m2 K)w = mass fractionx = molar fractionx = conversiony = yieldz* = normalized axial coordinate
Greek Symbolsα = deactivation decay orderδ = parameters for equilibrium constant calculationε = porosityγ = activity coefficientν = stoichiometric coefficientΦ, ϕ = deactivation factorρ = density, kg/m3
σ = standard deviation of measurementsθ = parameters for adsorption constant determination
Subscripts, Superscripts, and Abbreviationsb = bedc = index for lumps {ETBE, H2O}calc = calculatedcw = cooling waterd = deactivationDIB = diisobuteneETBE = ethyl tert-butyl etherEtOH = ethanolf = fluidglobal = both reactors in seriesi = index for lumps {1-butene, n-butane, IB, EtOH, H2O,ETBE, TBA, DIB}in = at reactor inletint = innerIB = isobuteneIPDAE = integro-partial differential and algebraic equationsj = index for reactions {ETBE, TBA, DIB}k = index for summationLHHW = Langmuir−Hinshelwood−Hougen−Watsonmeas = measuredMTBE = methyl tert-butyl etherMOL = method of linesMSE = mean square errorn = index for reactors {1, 2}out = outerOCFE = orthogonal collocation on finite elementsp = index for a subset of lumps {ETBE, TBA, DIB}Q = set of pairs of lumps and streams {(ETBE, 13), (H2O,19)}ref = referenceres = residualRMSE = relative mean square errorS = set of streams {1, 4, 5, 8, 12, 13, 15, 19}s = index for streamsTBA = tert-butyl alcohol
v = index for streams {13, 19}
■ REFERENCES(1) Kirk-Othmer Encyclopedia of Chemical Technology, 5th ed.; JohnWiley & Sons: New York, 2005; Vol. 10.(2) Handbook of MTBE and Other Gasoline Oxygenates; Hamid, H.,Ashraf, A., Eds.; Marcel Dekker: New York, 2004.(3) Ullmann’s Encyclopedia of Industrial Chemistry; Elvers, B.,Hawkings, S., Schulz, G., Eds.; VCH Publishers: New York, 1990;Vol. A16.(4) Encyclopedia of Chemical Processing and Design; McKetta, J. J., Ed.;Marcel Dekker: New York, 1989; Vol. 30.(5) Jensen, K. L.; Datta, R. Ethers from Ethanol. 1. EquilibriumThermodynamic Analysis of the Liquid-Phase Ethyl tert-Butyl EtherReaction. Ind. Eng. Chem. Res. 1995, 34, 392−399.(6) Zhang, T.; Jensen, K. L.; Kitchaiya, P.; Phillips, C.; Datta, R.Liquid-Phase Synthesis of Ethanol-Derived Mixed Tertiary Alkyl EthylEthers in an Isothermal Integral Packed-Bed Reactor. Ind. Eng. Chem.Res. 1997, 36, 4586−4594.(7) Sneesby, M. G.; Tade, M. O.; Datta, R.; Smith, T. N. ETBESynthesis via Reactive Distillation. 1. Steady-State Simulation andDesign Aspects. Ind. Eng. Chem. Res. 1997, 36, 1855−1869.(8) Haag, W. O. Oligomerization of isobutene on cation exchangeresins. Chem. Eng. Prog. Symp. Ser. 1967, 63, 140−147.(9) Honkela, M. L.; Krause, A. O. I. Kinetic Modeling of theDimerization of Isobutene. Ind. Eng. Chem. Res. 2004, 43, 3251−3260.(10) Rehfinger, A.; Hoffmann, U. Formation of Di-isobutene, MainBy-Product of Methyl Tertiary Butyl Ether Synthesis Catalyzed by IonExchange Resin. Chem. Eng. Technol. 1990, 13, 150−156.(11) Izquierdo, J. F.; Vila, M.; Tejero, J.; Cunill, F.; Iborra, M. Kineticstudy of isobutene dimerization catalyzed by a macroporous sulphonicacid resin. Appl. Catal., A: Gen. 1993, 106, 155−165.(12) Vila, M.; Cunill, F.; Izquierdo, J. F.; Gonzalez, J.; Hernandez, A.The role of by-product formation in methyl tert-buyl ether synthesiscatalyzed by a macroporous acidic resin. Appl. Catal., A: Gen. 1994,117, L99−L108.(13) Sundmacher, K.; Uhde, G.; Hoffmann, U. Multiple reactions incatalytic distillation processes for the production of the fuel oxygenatesMTBE and TAME: Analysis by rigorous model and experimentalvalidation. Chem. Eng. Sci. 1999, 54, 2839−2847.(14) Iborra, M.; Tejero, J.; El-Fassi, M. B.; Cunill, F.; Izquierdo, J. F.;Fite, C. Experimental Study of the Liquid-Phase SimultaneousSyntheses of Methyl tert-Butyl Ether (MTBE) and tert-Butyl Alcohol(TBA). Ind. Eng. Chem. Res. 2002, 41, 5359−5365.(15) Zhang, C. M.; Adesina, A. A.; Wainwright, M. S. Isobutenehydration over Amberlyst-15 in a slurry reactor. Chem. Eng. Process.2003, 42, 985−991.(16) Delion, A.; Torck, B.; Hellin, M. Equilibrium constant for theliquid-phase hydration of isobutylene over ion-exchange resin. Ind.Eng. Chem. Process Des. Dev. 1986, 25, 889−893.(17) Cunill, F.; Vila, M.; Izquierdo, J. F.; Tejero, J. Effect of WaterPresence on Methyl tert-Butyl Ether and Ethyl tert-Butyl Ether Liquid-Phase Syntheses. Ind. Eng. Chem. Res. 1993, 32, 564−569.(18) Velo, E.; Puigjaner, L.; Recasens, F. Inhibition by product in theliquid-phase hydration of isobutene to tert-Butyl Alcohol: Kinetics andequilibrium studies. Ind. Eng. Chem. Res. 1988, 27, 2224−2231.(19) Chakrabarti, A.; Sharma, M. M. Cationic ion exchange resins ascatalyst. React. Polym. 1993, 20, 1−45.(20) Abrams, I. M.; Millar, J. R. A history of the origin anddevelopment of macroporous ion-exchange resins. React. Funct. Polym.1997, 35, 7−22.(21) Petrus, L.; Stamhuls, E. J.; Joosten, G. E. H. Thermaldeactivation of strong-acid ion-exchange resins in water. Ind. Eng.Chem. Prod. Res. Dev. 1981, 20, 366−371.(22) Aragon, J. M.; Vegas, J. M. R.; Jodra, L. G. Self-Condensation ofCyclohexanone Catalyzed by Amberlyst-15. Study of DiffusionalResistances and Deactivation of the Catalyst. Ind. Eng. Chem. Res.2000, 33, 592−599.
Industrial & Engineering Chemistry Research Article
dx.doi.org/10.1021/ie302030j | Ind. Eng. Chem. Res. 2012, 51, 15018−1503115030
(23) Dixit, A. B.; Yadav, G. D. Deactivation of ion-exchange resincatalysts. Part I: Alkylation of o-xylene with styrene. React. Funct.Polym. 1996, 31, 237−250.(24) Dixit, A. B.; Yadav, G. D. Deactivation of ion-exchange resincatalysts. Part II: Simulation by network models. React. Funct. Polym.1996, 31, 251−263.(25) Quiroga, M.; Capeletti, M. R.; Fgoli, N.; Sedran, U. A. Catalystdeactivation by acetonitrile in MTBE synthesis. Appl. Catal., A: Gen.1999, 177, 37−42.(26) Parra, D.; Izquierdo, J. F.; Cunill, F.; Tejero, J.; Fite, C.; Iborra,M.; Vila, M. Catalytic activity and deactivation of acidic ion-exchangeresins in methyl tert-butyl ether liquid-phase synthesis. Ind. Eng. Chem.Res. 1998, 37, 3575−3581.(27) Songwei, T.; Hongjun, W.; Hongliang, J.; Liqun, W.; Tsao, W.;Xiangzhou, L. Study on the stability of ion-exchange resin catalysts: II.Desulfuration during isobutylene dimerization. China Pet. Process. Pet.Technol. 2011, 13, 52−57.(28) Khaledi, R.; Young, B. R. Modeling and Model PredictiveControl of Composition and Conversion in an ETBE ReactiveDistillation Column. Ind. Eng. Chem. Res. 2005, 44, 3134−3145.(29) Jhon, Y. H.; Lee, T.-h. Dynamic simulation for reactivedistillation with ETBE synthesis. Sep. Purif. Technol. 2003, 31, 301−317.(30) Umar, M.; Patel, D.; Saha, B. Kinetic studies of liquid phaseethyl tert-butyl ether (ETBE) synthesis using macroporous and gelularion exchange resin catalysts. Chem. Eng. Sci. 2009, 64, 4424−4432.(31) Thiel, C.; Sundmacher, K.; Hoffmann, U. Synthesis of ETBE:Residue curve maps for the heterogeneously catalysed reactivedistillation process. Chem. Eng. J. 1997, 66, 181−191.(32) Froment, G. F.; Bischoff, K. B. Chemical Reactor Analysis andDesign, 1st ed.; John Wiley & Sons: New York, 1979.(33) Al-Arfaj, M. A.; Luyben, W. L. Control Study of Ethyl tert-ButylEther Reactive Distillation. Ind. Eng. Chem. Res. 2002, 41, 3784−3796.(34) Bumbac, G.; Ene, A.; Isopescu, R.; Toma, A. Process simulationof reactive distillation in dividing wall column for ETBE synthesisprocess. Chem. Eng. Trans. 2009, 18, 487−492.(35) Gomez, J. M.; Reneaume, J. M.; Roques, M.; Meyer, M.; Meyer,X.-M. A Mixed Integer Nonlinear Programming Formulation forOptimal Design of a Catalytic Distillation Column Based on a GenericNonequilibrium Model. Ind. Eng. Chem. Res. 2006, 45, 1373−1388.(36) Luyben, W. L.; Yu, C.-C. Reactive Distillation Design and Control;Wiley: New York, 2008; p 574.(37) Petrus, L.; De Roo, R. W.; Stamhuis, E. J.; Joosten, G. E. H.Kinetics and equilibria of the hydration of propene over a strong acidion exchange resin as catalyst. Chem. Eng. Sci. 1984, 39, 433−446.(38) Petrus, L.; De Roo, R. W.; Stamhuis, E. J.; Joosten, G. E. H.Kinetics and equilibria of the hydration of linear butenes over a strongacid ion-exchange resin as catalyst. Chem. Eng. Sci. 1986, 41, 217−226.(39) Hauge, K.; Bergene, E.; Chen, D.; Fredriksen, G. R.; Holmen, A.Oligomerization of isobutene over solid acid catalysts. Catal. Today2005, 100, 463−466.(40) Perry, R. H.; Green, D. W. Perry’s Chemical Engineers’ Handbook,7th ed.; McGraw-Hill: New York, 1999.(41) Sinnott, R. K. Chemical Engineering Design: Chemical EngineeringVol. 6 (Coulson & Richardson’s Chemical Engineering), 3rd ed.;Butterworth-Heinemann: Oxford, Great Britain, 1999.(42) Himmelblau, D. M. Process Analysis by Statistical Methods; JohnWiley & Sons: New York, 1970; p 463.(43) Bothe, N.; Doscher, F.; Klein, J.; Widdecke, H. Thermal stabilityof sulphonated styrene-divinylbenzene resins. Polymer 1979, 20, 850−854.
Industrial & Engineering Chemistry Research Article
dx.doi.org/10.1021/ie302030j | Ind. Eng. Chem. Res. 2012, 51, 15018−1503115031