model for the analysis of steel fibre reinforced concrete ...isi... · model for the analysis of...
TRANSCRIPT

1
MODEL FOR THE ANALYSIS OF STEEL FIBRE REINFORCED CONCRETE
SLABS ON GRADE
J. A. O. Barros1 and J. A. Figueiras2
1 Dep. of Civil Eng., School of Eng., Univ. of Minho, Azurém, 4810 058 Guimarães, Portugal
2 Dep. of Civil Eng., Faculty of Eng., Univ. of Porto, Rua dos Bragas, 4050 123 Porto, Portugal
Summary
A constitutive model is developed for material non-linear analysis of steel fibre reinforced
concrete slabs supported on soil. The energy absorption capacity provided by fibre
reinforcement is taken into account in the material constitutive relationship. The theory of
plasticity is used to deal with the elasto-plastic behaviour of concrete. A smeared-crack
model is used for reproducing the concrete cracking behaviour. The soil non-linear
behaviour is simulated by springs on orthogonal direction to the slab. The loss of contact
between the slab and the soil is accounted for. The model performance is assessed using
results of experimental research.
KEY WORDS: steel fibres, elasto-plasticity, smeared-crack model, fracture energy,
softening, finite element method
2
1 - INTRODUCTION
Westergaard [1] was, probably, the first researcher to develop analytical models for
studying plain concrete beams and slabs supported on an elastic field. These models are,
however, restricted to the linear elastic regime, which is far from the real behaviour of
cement based materials such as concrete. In order to avoid the brittle failure of plain
concrete, the use of steel rods and steel wire meshes on concrete industrial floors became a
current practice after the sixties. To design reinforced concrete slabs on grade, Losberg [2]
and Meyerhof [3] developed analytical models based on the yield line theory [4]. However,
these models are not able to reproduce the deformational behaviour up to the collapse load
of a reinforced concrete slab on grade.
Recently, a finite element based model [5] was proposed to evaluate the load-carrying
capacity of plain concrete slabs on grade. However, the model results are mesh dependent
[6] because the tensile post cracking energy absorption capacity was not accounted for.
In the last two decades the conventional reinforcement on industrial floors has been
replaced by steel fibres. Research and practice have shown that, in comparison to
conventional reinforcement, steel fibre reinforcement is more efficient and economic for
industrial floors [7,8]. The mechanical properties and the cracking behaviour are improved
by adding steel fibres to the concrete mix [9-11]. Numerical models for analysing laminar
structures of steel fibre reinforced concrete (SFRC) are still scarce. Using a model for
material non-linear analysis of reinforced concrete structures, Falkner and Teutsch [12]
have proposed some procedures to adjust this model to SFRC structures. The main
suggestion advanced by these researchers was the evaluation of a reinforcement equivalent
3
to a given content of fibres. This procedure was based on the equivalent flexural tensile
strength proposed by the German Concrete Association [13]. The assumptions of Falkner
and Teutsch seem too simplified for simulating the behaviour introduced by fibre
reinforcement, as it can be observed from their numerical results.
The experimental research has revealed that the post-peak behaviour of SFRC, both under
tension and under compression is much more ductile than the corresponding behaviour of
plain concrete [9,14]. New constitutive laws have been proposed for modelling the
post-peak behaviour of SFRC in compression, as well as in tension [10]. The failure
envelope of SFRC under biaxial compression is also different from the corresponding plain
concrete [15,16]. However, for the content of fibres usually applied in industrial floors, the
differences are marginal.
In the present work a constitutive model is developed for material non-linear analysis of
SFRC slabs supported on soil. The main characteristics induced by fibre reinforcement are
simulated in the material constitutive laws, namely, in the tension and in the compression
post-peak stress-strain relationship. The parameters of the material constitutive laws have
been assessed for concrete reinforced with hooked ends steel fibres [17] (ZP30/.50 and
ZX60/.80).

4
2 – THE SOFTENING BEHAVIOUR OF SFRC
2.1 - Introduction
The ability of SFRC to absorb energy has long been recognized [9,18-20] as one of the
most important benefits of incorporating fibres into plain concrete. Tension [21],
compression [22-23] and bending [9,10] tests performed under displacement control have
revealed the high-energy absorption capacity of SFRC. For the content of fibres used in
current applications the tension and the compression behaviour are basically changed on
their post-peak branches (strain-softening).
An experimental work was recently carried out to appraise the strain softening behaviour of
SFRC on tension and on compression [10]. The main results obtained and used in
ascertaining the numerical model developed, will be briefly described in the present
section.
2.2 – Compression behaviour
Previous work [14,22,23] has shown that the complete stress-strain expressions proposed
for plain concrete [24,25] cannot adequately fit the post-peak response of the fibre
concrete. Based on experimental research, a new expression was proposed [10],

5
( )p
q
c
c
c
c
c
c
cc
pqqp
f−
+
+−−
=1
11
1
1ε
ε
ε
ε
ε
ε
σ (1)
with
q pE
E
c
ci
= − −11
, ] [p q+ ∈ 0 1, , 1
0−
>q
p (2)
where
fcc W0002.0101 +=εε , (3)
p Wf= − −10 0 919 0 394. . exp( . ) (4)
for ZP30/.50 fibres and
ε εc c fW1 10 0 00026= + . , (5)
p Wf= − −10 0 722 0144. . exp( . ) (6)
for ZX60/.80 fibres. In these expressions cf is the compression strength, ciE is the initial
modulus of elasticity, 1cE is the modulus of elasticity at peak stress [24], εc10 is the strain
at peak for plain concrete (2.2 × 10⁻³
according to CEB-FIP Model Code 1990) and Wf is
the fibre weight percentage in the mixture. In Fig. 1, σ εc c− experimental curves are
compared to the σ εc c− relationship given by the above expressions [10].
6
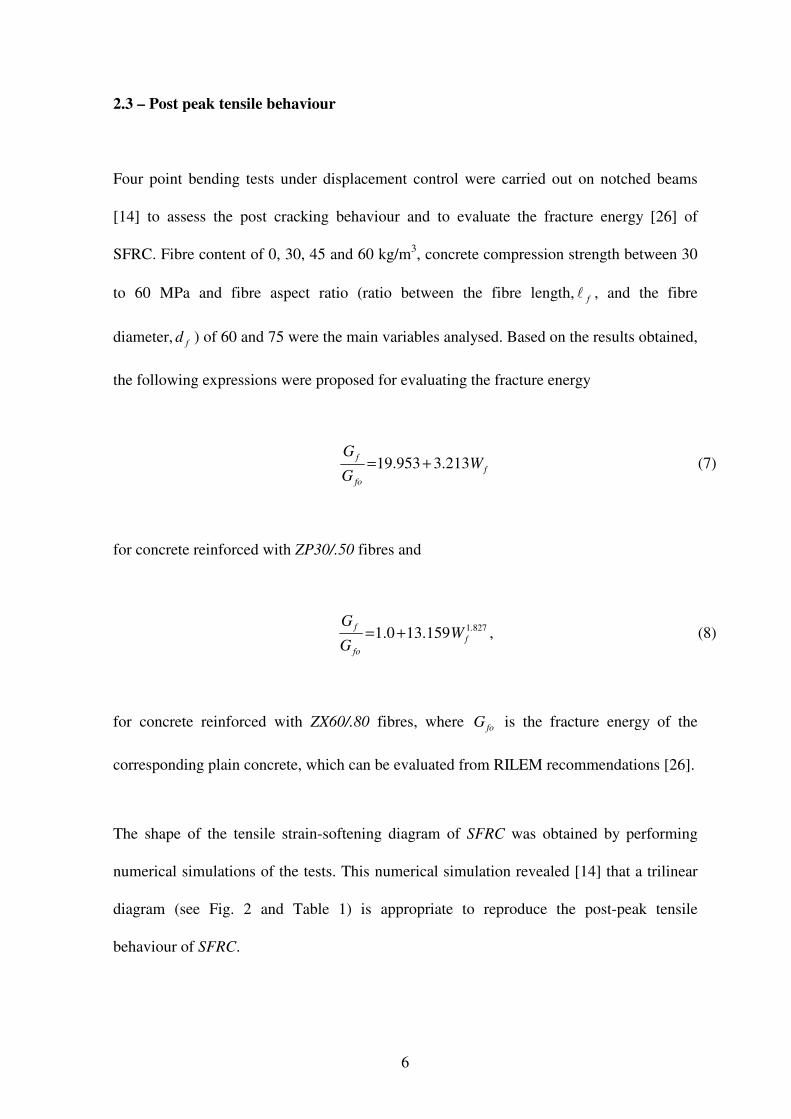
2.3 – Post peak tensile behaviour
Four point bending tests under displacement control were carried out on notched beams
[14] to assess the post cracking behaviour and to evaluate the fracture energy [26] of
SFRC. Fibre content of 0, 30, 45 and 60 kg/m3, concrete compression strength between 30
to 60 MPa and fibre aspect ratio (ratio between the fibre length, fl , and the fibre
diameter, fd ) of 60 and 75 were the main variables analysed. Based on the results obtained,
the following expressions were proposed for evaluating the fracture energy
f
fo
fW
G
G213.3953.19 += (7)
for concrete reinforced with ZP30/.50 fibres and
827.1159.130.1 f
fo
fW
G
G+= , (8)
for concrete reinforced with ZX60/.80 fibres, where foG is the fracture energy of the
corresponding plain concrete, which can be evaluated from RILEM recommendations [26].
The shape of the tensile strain-softening diagram of SFRC was obtained by performing
numerical simulations of the tests. This numerical simulation revealed [14] that a trilinear
diagram (see Fig. 2 and Table 1) is appropriate to reproduce the post-peak tensile
behaviour of SFRC.

7
The values of the characteristic points of the trilinear softening diagram, specified in Table
1, were also obtained from the numerical simulation of the tests.
Table 1. Values for defining the characteristic points of the softening diagram of SFRC.
Fibre type
Parameters ZP30/.50 ZX60/.80
Fibre content (kg/m3) Fibre content (kg/m
3)
30 45 60 30 45 60
1ξ ( )310−× 7 – 9 4 - 6 3 - 5 3 - 5 3 - 5 10 - 100
1α 0.35 - 0.45 0.55 – 0.65 0.6 – 0.65 0.4 – 0.5 0.6 – 0.7 0.65 – 0.75
2ξ 0.2 – 0.3 0.25 – 0.35 0.3 – 0.4 0.15 – 0.25 0.15 – 0.25 0.3 – 0.5
2α 0.1 – 0.2 0.15 – 0.25 0.15 – 0.25 0.2 – 0.3 0.25 – 0.35 0.25 – 0.35
3 – NUMERICAL MODEL
3.1 - Introduction
In order to simulate the progressive damage induced by plasticity and cracking, the
concrete shell element thickness is discretized in layers. Each layer is considered in a state
of plane stress. The concrete shell can be reinforced with conventional smeared steel bars
or/and steel fibres. The shell element is formulated under the Reissner-Mindlin theory [27],
using the finite element techniques [14].

8
The concrete cracking is simulated under the framework of the smeared crack concepts,
which can be categorised into fixed, multifixed and rotating crack models [14, 28-30].
These three models are available in the computational code developed.
According to the present model, the total strain increment of cracked concrete, ∆ε ,
consists of the strain increment in the fracture zone, ∆ε cr , and the strain increment of
concrete between cracks, ∆εep
co ,
∆ ∆ ∆ε ε ε=ep
co cr+ . (9)
In smeared crack models the fracture is distributed over a crack band width, bl , which is
related to the particular finite element configuration. In the present numerical simulation
bl is taken equal to the square root of the area of a Gauss point [31].
3.2 - Concrete constitutive laws
Stress and strain increment vectors are related by
coco
D εσ ∆=∆ (10)
where co
D is the concrete tangent constitutive matrix,

9
=
co
s
co
mbco
D
DD
φ
φ, (11)
co
mbD is the material in-plane stiffness matrix and co
sD is the material out-of-plane shear
stiffness matrix.
3.2.1 - Linear elastic uncracked concrete
For the homogeneous, isotropic and linear elastic material, the submatrix co
mbD given in
(11) is the elastic in-plane stiffness matrix, co
embD , ,
−−==
2
100
01
01
1 2,
c
c
c
c
cico
emb
co
mb
EDD
υυ
υ
υ (12)
where cυ is the concrete Poisson coefficient. The transverse shear behaviour is considered
linear elastic, being the corresponding stiffness matrix given by
==
10
01, c
co
es
co
s GFDD (13)
where cG is the concrete shear modulus and F=5/6 is a correction shear factor [14].

10
3.2.2 - Linear elastic cracked concrete
For cracked concrete with concrete between cracks in linear elastic state (ecr), the
submatrix co
mbD given in (11) is designated by co
ecrmbD , , defined by the following expression
[30]:
+−==
−co
emb
Tco
emb
Tcrco
emb
co
emb
co
ecrmb
co
mb DRRDRDRDDDD ,
1
,,,,ˆˆˆˆˆ ,
(14)
where R̂ is a matrix defining the direction of the cracks formed at a sampling point (Fig. 3)
and cr
D̂ is a matrix which accounts for the constitutive law of the cracks. Each crack is
governed by the following constitutive relationship:
∆ ∆s D ecr cr cr= , (15)
where ∆scr is the crack stress increment vector (Fig. 3)
[ ]∆ ∆ ∆s s scr
nn
cr
nt
crT
= , (16)
∆ecr is the crack strain increment vector
[ ]∆ ∆ ∆e ecr
nn
cr
nt
crT
= γ (17)
and

11
DD
D
cr I
cr
II
cr=
0
0, (18)
is the crack stiffness matrix, where DI
cr and DII
cr are the fracture mode I and the fracture
mode II stiffness modulus of smeared cracks, respectively. The DI
cr is characterised by the
fracture parameters [6, 30], namely, the tensile strength, f ct , the fracture energy, G f , the
shape of the softening law and the crack band width, bl . Fibre reinforcement mechanisms
are reflected, mainly, on the fracture energy and on the shape of the softening branch. For
current fibre contents used in the concrete applications, the remainder fracture parameters
are only marginally affected by fibre addition. The fracture energy and the shape of the
softening branch of SFRC were evaluated from the data presented in section 2.3.
Residual strain at crack closing is higher on fibrous concrete than on plain concrete [21].
To model this behaviour it is proposed the following relationship (Fig. 2):
e enn l
cr
nn m
cr
, ,= η , (19)
where enn mcr
, is the maximum attained crack strain normal to the crack and η is given by,
( )[ ]
−−−−=
f
ffcr
mnndC
We
lexp11000exp1 ,η . (20)
A value of 165 can be advanced to C parameter, but more experimental research is needed
to calibrate this parameter. According to this expression, the residual strain increases with

12
enn mcr
, and with the fibre percentage and fibre aspect-ratio, which is in accordance with the
trend showed by the reduced experimental data available.
The fracture mode II modulus, DIIcr , is obtained from the expression [30]:
D GIIcr
c=−
β
β1, (21)
where β is the shear retention factor determined from
p
cr
unn
cr
nn
e
e
−=
,
1β (p=1, 2 or 3) (22)
for plain concrete, with enn u
cr
, being the ultimate normal crack strain (Fig. 2), and
−=
cr
unn
cr
nn
f
f
f e
e
l
d
W
M
,
expβ (23)
for SFRC. Taking into account the experimental data available [32], it is proposed a value
of 980 for the M parameter. According to this expression, the shear retention factor
increases with the fibre percentage and with the fibre aspect-ratio, and decreases with the
crack strain, which gives the trend revealed by the experimental data.

13
The shear retention factor for the conventionally reinforced concrete is evaluated from the
expression proposed by Cervenka [31]
2
1
ln
C
C
ecr
nn
−=β (24)
with
015.0
005.057
,
1
−+=
efeqC
ρ,
015.0
005.05.210
,
2
−−=
efeqC
ρ, (25)
where efeq ,ρ is the equivalent effective reinforcement [14],
ρ ρ θeq ef i ef ii
nr
, , cos==
∑ 4
1
(26)
nr is the number of sets of reinforcing layers crossing the crack, ρi ef, is the effective
reinforcing ratio [24] of layer i and θi is the angle between the reinforcing layer i and the
crack direction.
3.2.3 - Elasto-plastic uncracked concrete
For elasto-plastic (ep) uncracked concrete, the in-plane material stiffness matrix co
mbD given
in (11) is defined by
aDah
DaaDDDD
co
emb
T
co
emb
Tco
embco
emb
co
epmb
co
mb
,
,,
,,+
−== (27)
14
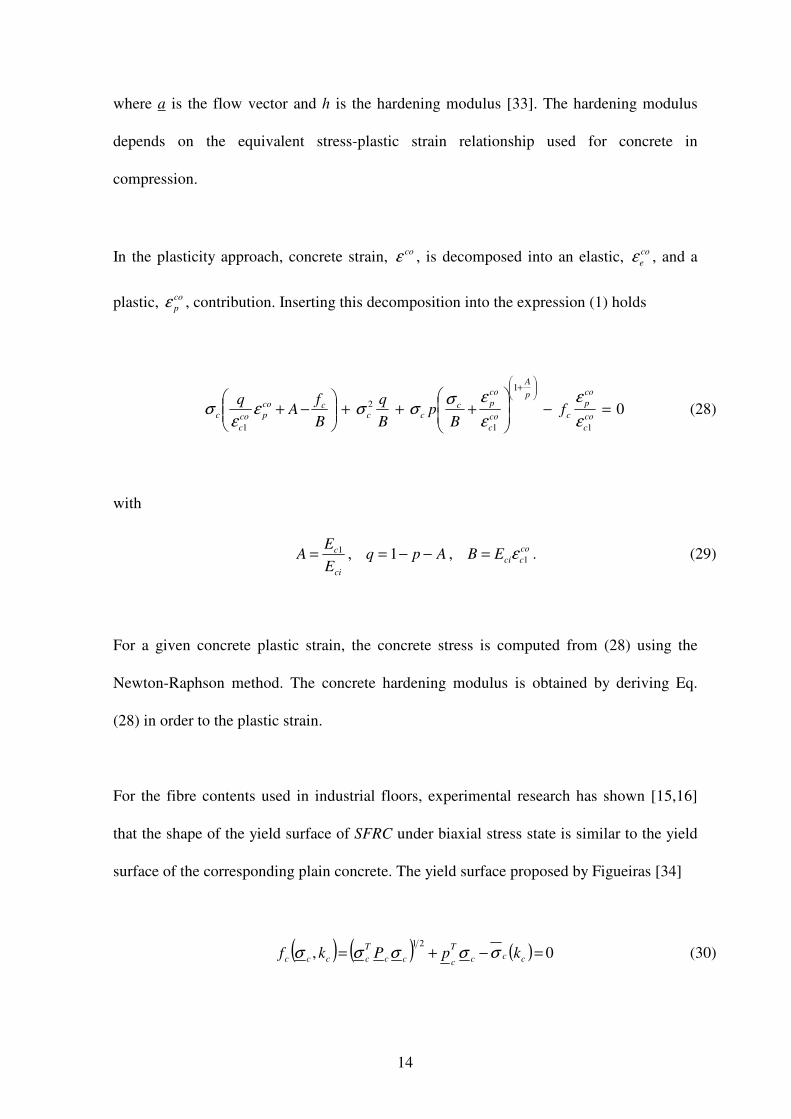
where a is the flow vector and h is the hardening modulus [33]. The hardening modulus
depends on the equivalent stress-plastic strain relationship used for concrete in
compression.
In the plasticity approach, concrete strain, coε , is decomposed into an elastic,
co
eε , and a
plastic, co
pε , contribution. Inserting this decomposition into the expression (1) holds
01
1
1
2
1
=−
+++
−+
+
co
c
co
p
c
p
A
co
c
co
pccc
cco
pco
c
c fB
pB
q
B
fA
q
ε
ε
ε
εσσσε
εσ (28)
with
ci
c
E
EA 1= , q p A= − −1 ,
co
cciEB 1ε= . (29)
For a given concrete plastic strain, the concrete stress is computed from (28) using the
Newton-Raphson method. The concrete hardening modulus is obtained by deriving Eq.
(28) in order to the plastic strain.
For the fibre contents used in industrial floors, experimental research has shown [15,16]
that the shape of the yield surface of SFRC under biaxial stress state is similar to the yield
surface of the corresponding plain concrete. The yield surface proposed by Figueiras [34]
( ) ( ) ( ) 0,21
=−+= ccc
T
ccc
T
cccc kpPkf σσσσσ (30)

15
is used in the present work for plain and fibrous concrete, where ( )σ c ck is the equivalent
compressive stress, with kc being the hardening parameter associated to the equivalent
plastic strain rate or to the plastic work rate, Pc is the projection matrix [35]
P
a b b
b a b
b b a
c
c=
0
0
0
0 0 0
(31)
and pc is the projection vector,
[ ]Tc
dp 0111= . (32)
Scalar parameters a, b, c and d are defined as
a =
0 355
2
2.
, b =
−
0 355
2
1355
2
2. .
, c = ×3 1355. , d =0 355
2
.. (33)
3.2.4 - Elasto-plastic cracked concrete
For cracked concrete with concrete between cracks in elasto-plastic behaviour (epcr) the
submatrix co
mbD given in (11) is obtained from the following expression:
+−==
−co
epmb
Tco
epmb
Tcrco
epmb
co
epmb
co
epcrmb
co
mb DRRDRDRDDDD ,
1
,,,,ˆˆˆˆˆ (34)

16
where co
epmbD , was defined in Eq. (27).
3.2.5 –Tensile behaviour of reinforced concrete layers
The relative position between a concrete layer and a reinforcing layer defines which
diagram will be used to simulate the tensile behaviour of the concrete layer. The behaviour
of a concrete layer will be simulated by a tension stiffening diagram if its middle surface is
positioned within the effective tension area [24] (Fig. 4). The behaviour of the other
concrete layers will be simulated by a softening diagram (Section 2.3).
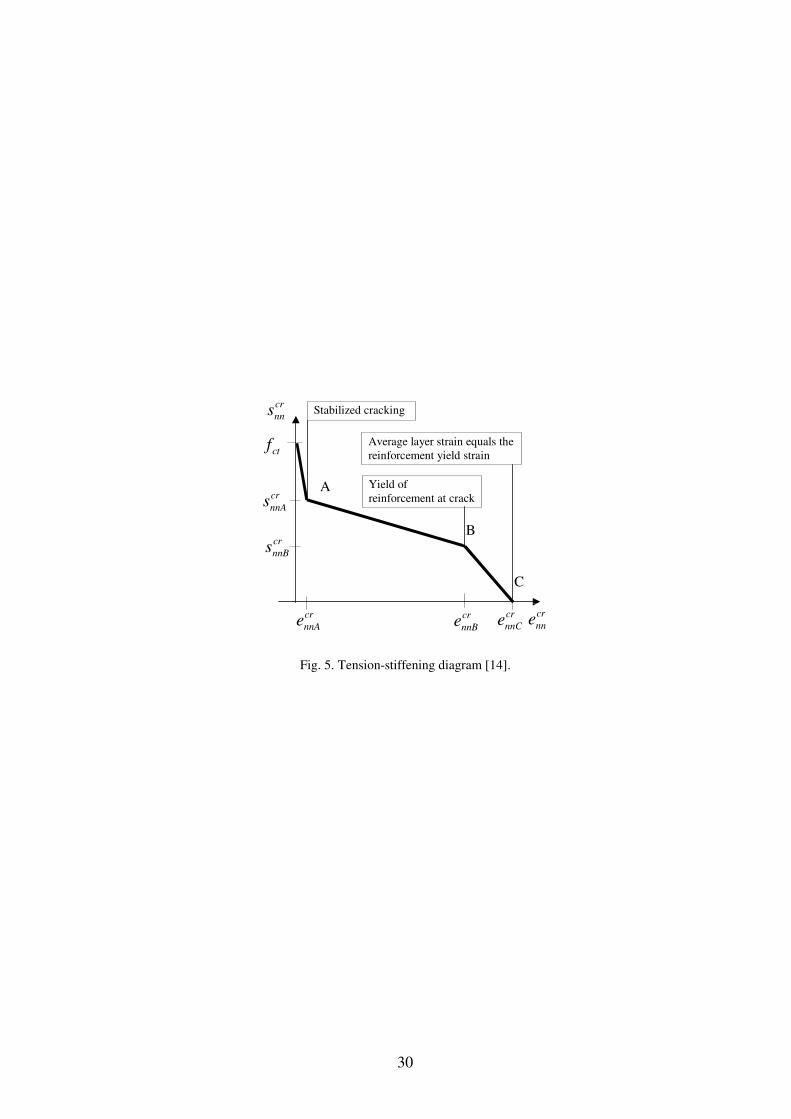
A tension-stiffening model was developed [14] for laminar concrete structures reinforced
with sets of smeared steel bars. These sets can have different orientation and properties.
The model is based on the principles proposed by Link et al. [36] and Massicotte et
al. [37], and can be represented by the post-peak stress-strain trilinear diagram illustrated in
Fig. 5. The expressions defining the coordinates of the points A, B and C were deduced in
a previous work [14].
3.3 - Constitutive relationship for the reinforcement
Reinforcement of smeared steel bars added to plain or fibrous concrete can be modelled by
a linear-parabola diagram or by a multilinear diagram [14]. The material non-linear
behaviour of steel bars is reproduced under the elasto-plasticity framework [14].

17
3.4 - Soil
The soil is simulated by springs orthogonal to the laminate structure (Figure 6). The
tangent soil reaction modulus is usually evaluated from plate-loading tests [11]. The results
of these tests have revealed that soil pressure–soil settlement relationship may be simulated
by a multilinear or linear-parabola diagram [14]. The soil contribution to the stiffness of the
whole structural system is computed by adding the soil stiffness matrix,
( )
( )∫=eA
s
Te
so dANkNK (35)
to the slab stiffness, where ( )eA is the area of a finite element, N is a vector with the
dimension of the number of element nodes. The terms of N are the values of the element
shape functions. In Eq. (35) sk is the tangent soil reaction modulus. The soil stiffness
contributes only to the rigidity terms of the degrees-of-freedom orthogonal to the laminate
structure. The friction between the slab and the soil is neglected.
If in a given sampling point the concrete slab loses the contact with the soil (Fig. 7), i.e., if
the displacement orthogonal to the slab middle surface, 3u , is less than the plastic soil
settlement, spa , the part of the soil corresponding to this sampling point does not contribute
to the stiffness of the slab-soil system. These procedure accounts for the zones where the
soil has plastic settlements (zone A in Fig. 7), as well as, for the zones where the slab lift
up with soil in linear elastic state (zone B in Fig. 7).

18
4 - MODEL APPRAISAL
In a previous work [11] the model performance was already assessed, simulating the tests
carried out with sets of slabs of plain concrete, slabs reinforced with wire mesh and slabs
reinforced with 30 and 45 kg/m3 of ZX60/.80 hooked ends steel fibres. The purpose of the
present section is to evaluate the model performance by simulating the behaviour of SFRC
slabs supported on other materials such as rubber and cork. For experimental research in
laboratory, these materials are easier to deal with than soil, being a useful alternative.
Falkner and Teutsch [12] have carried out tests with 3000×3000×150 mm concrete slabs
supported on a 60 mm thick elastic subbase of cork and rubber. The slabs were loaded via a
hydraulic jack, acting on a 120×120 mm2 steel plate placed at the centre of the slab. The
two experimental tests carried out with concrete slabs reinforced with 20 kg/m3 of 60/.80
hooked ends Dramix steel fibres [17] are simulated with the numerical model described in
the present work. The slab designated by P3 was supported on elastic cork subbase. In slab
named P4, the elastic cork subbase was replaced by a layer of rubber mats of the same
thickness, in the load applied zone over an area of 1.5×1.5 m2. The reaction modulus of the
cork and rubber subbase was evaluated from plate loading tests on specimens of 500×500
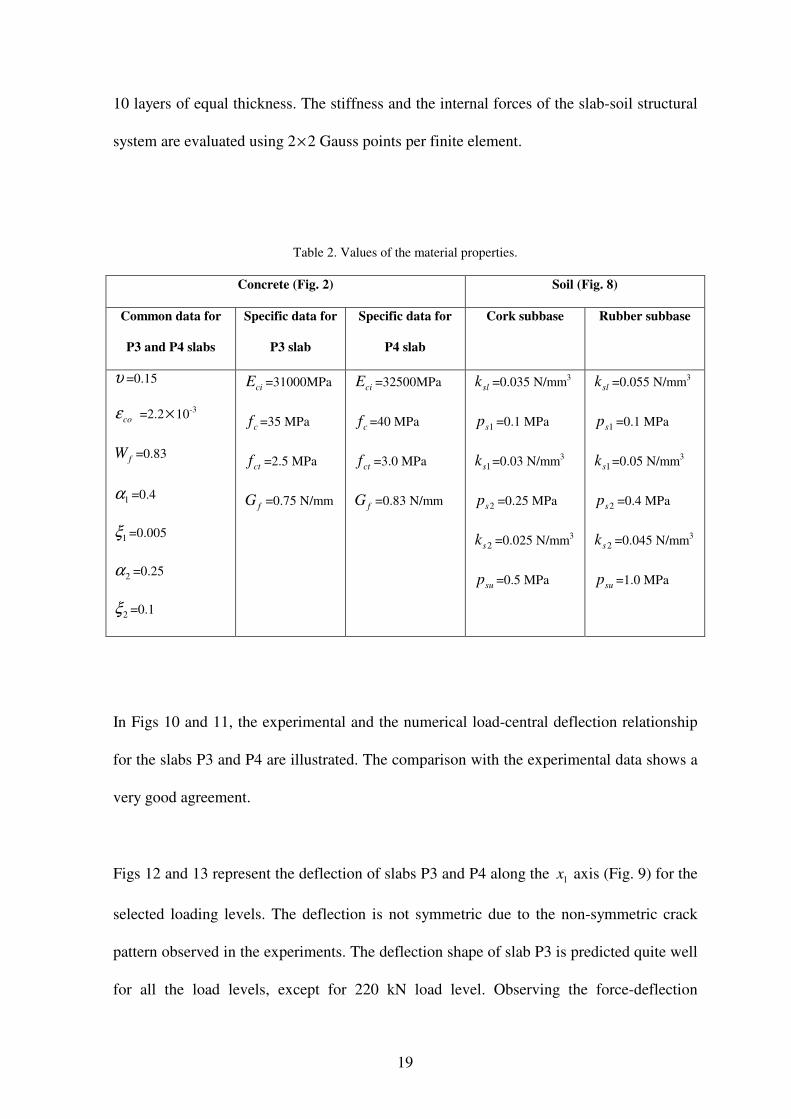
mm, with a plate of 150 mm diameter. The values of the material properties for numerical
simulation are included in Table 2. These values were obtained from the experimental data
published [12] (see also Fig. 8).
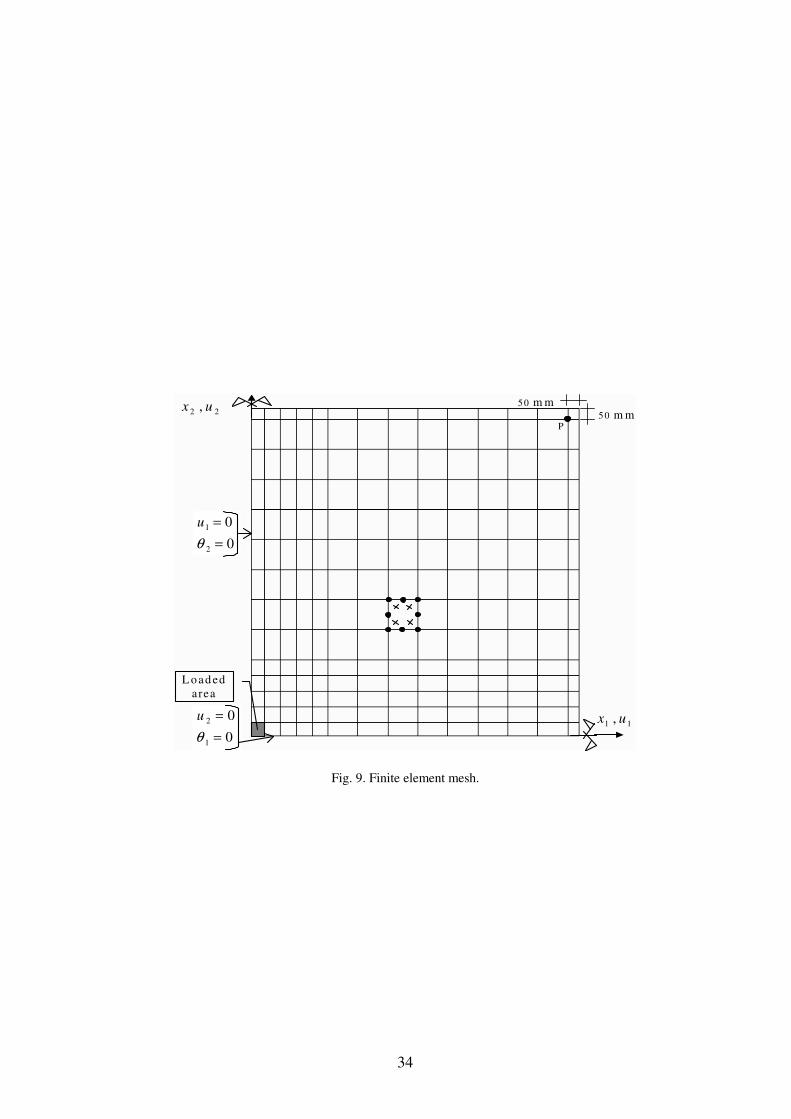
Taking the symmetry of the problem, a quarter of the slab is discretized by eight-noded
isoparametric Serendipity elements, as shown in Fig. 9. The slab thickness is discretized in
19
10 layers of equal thickness. The stiffness and the internal forces of the slab-soil structural
system are evaluated using 2×2 Gauss points per finite element.
Table 2. Values of the material properties.
Concrete (Fig. 2) Soil (Fig. 8)
Common data for
P3 and P4 slabs
Specific data for
P3 slab
Specific data for
P4 slab
Cork subbase Rubber subbase
υ =0.15
coε =2.2×10⁻³
fW =0.83
1α =0.4
1ξ =0.005
2α =0.25
2ξ =0.1
ciE =31000MPa
cf =35 MPa
ctf =2.5 MPa
fG =0.75 N/mm
ciE =32500MPa
cf =40 MPa
ctf =3.0 MPa
fG =0.83 N/mm
slk =0.035 N/mm3
1sp =0.1 MPa
1sk =0.03 N/mm3
2sp =0.25 MPa
2sk =0.025 N/mm3
sup =0.5 MPa
slk =0.055 N/mm3
1sp =0.1 MPa
1sk =0.05 N/mm3
2sp =0.4 MPa
2sk =0.045 N/mm3
sup =1.0 MPa
In Figs 10 and 11, the experimental and the numerical load-central deflection relationship
for the slabs P3 and P4 are illustrated. The comparison with the experimental data shows a
very good agreement.
Figs 12 and 13 represent the deflection of slabs P3 and P4 along the 1x axis (Fig. 9) for the
selected loading levels. The deflection is not symmetric due to the non-symmetric crack
pattern observed in the experiments. The deflection shape of slab P3 is predicted quite well
for all the load levels, except for 220 kN load level. Observing the force-deflection

20
relationship of slab P3 (Fig. 10), it is noted that, above the load of 220 kN, the deflection
increases significantly for a small load increment. Due to this fact, the deflection for load
level of 230 kN is also included in Figure 12. It can be conclude that the deflection
registered experimentally for 220 kN is reproduced with reasonable accuracy in the range
220-230 kN in the numerical simulation.
In slab P4, apart from the left branch of the deflection along the 1x axis for load level of
345 kN, the remainder deflections are predicted quite well. The smaller deflection
predicted by the numerical model in –1500 ≤ 1x ≤ 0 mm for load level of 345 kN (Fig. 13)
is due to the crack pattern developed in the experiment [12]. The deflection in the negative
1x coordinate is smaller, because the failure crack nº 3 (Figure 14) is far from the 1x axis
comparing to the failure crack nº 1. The direction of the crack nº 1 is similar to the
direction of the rupture crack determined by the numerical model, as it can be observed in
Figs 14 and 15. In Fig. 15, only the cracks completely open (where the fracture energy was
exhausted) are depicted. A crack is represented by a rectangle with thickness proportional
to crack opening ( b
cr
nne l )
The deflections registered on displacement transducers placed at corners (50 mm apart
from the corner – point P in Fig. 9) in slab P3 for load levels of 60, 120, 180 and 220 kN
are depicted in Fig. 16. The relationship between the applied force and the displacement at
point P obtained with the numerical model is also illustrated in Fig. 16. A good agreement
between experimental and numerical results is observed.

21
4 - CONCLUSIONS
A numerical model for the non-linear analysis of steel fibre reinforced concrete slabs
supported on soil was developed. Using experimental data, the main features of the fibre
reinforcement were introduced in the concrete constitutive laws, mainly in the tension and
in the compression post-peak behaviour. More experiments should be carried out in order
to tune the constitutive laws proposed. The experimental research performed was restricted
to two types of fibres only.
The behaviour of the uncracked concrete and concrete between cracks was simulated under
the elasto-plasticity framework. The cracking behaviour was reproduced using a smeared
multifixed crack model. The soil or other base material supporting the concrete slab was
simulated by distributed springs orthogonal to the concrete slab middle surface. An
elasto-plastic model was used to modulate the non-linear behaviour of the springs. The loss
of contact between the base and the slab was accounted for.
The model performance was evaluated using the experimental results given by Falkner and
Teutsch. A good agreement between the experimental and the numerical results was
obtained.
5 - REFERENCES
1. Westergaard, H.M., New formulas for stresses in concrete pavements of airfield.
Transactions of ASCE, 1948, 113(2340), 425-444.

22
2. Losberg, A., Design methods for structurally reinforced concrete pavements,
Transactions of Chalmers University of Technology Gothenburg, Sweden, 1961.
3. Meyerhof, G.G., Load carrying capacity of concrete pavements. Jour. Soil Mech. and
Found. Div., ASCE, 1962, 88(3), 89-115.
4. Baumann, R.A. and Weisgerber, F.E., Yield line analysis of slabs-on-grade. Jour. Struct.
Engrg. ASCE, 1983, 109(7), 1553-1568.
5. Shentu, L., Jiang, D. and Hsu, C.-T.T., Load-carrying capacity for concrete slabs on
grade. Jour. Struct. Engrg., ASCE, 1997, 123(1), 95-103.
6. Bazant, Z.P. and Oh, B.H., Crack band theory for fracture of concrete. Materials and
Structures, RILEM, 1983, 16(93), 155-177.
7. Nanni, A. and Johari, A., RCC pavement reinforced with steel fibers. Concrete
International, April 1989, 64-69.
8. Tatnall, P.C. and Kuitenbrouwer, L., Steel fiber reinforced concrete in industrial floors.
Concrete International, December 1992, 43-47.
9. ACI 544.1R-96, State-of-the-Art Report on Fiber Reinforced Concrete, ACI, 1997.
10. Barros, J.A.O. and Figueiras, J.A., Flexural behavior of steel fiber reinforced concrete:
testing and modelling. Journal of Materials in Civil Engineering, ASCE. 1999, 11(4),
331-339.
11. Barros, J.A.O. and Figueiras, J.A., Experimental behaviour of fibre concrete slabs on
soil. Journal Mechanics of Cohesive-frictional Materials, 1998, 3, 277-290.
12. Falkner, H. and Teutsch, M., Comparative investigations of plain and steel fibre
reinforced industrial ground slabs, Institut fur Baustoffe, Massivbau und brandschutz,
1993, nº 102.
13. German Concrete Association, Recommendations: Fundamental Principles for the
Evaluation of Steel Fibre Concrete in Tunnel Construction, Edition September 1992.

23
14. Barros, J.A.O., Comportamento do betão reforçado com fibras - análise experimental e
simulação numérica, PhD Thesis, Civil Eng. Dept., Faculty of Engineering, University
of Porto, Portugal, 1995 (in Portuguese).
15. Yin, W.S., Su, E.C.M., Mansur, M.A. and Hsu, T.T.C., Biaxial Tests of plain and fiber
concrete. ACI Materials Journal, 1989, 86(3), 236-243.
16. Traina, L.A. and Mansour, S.A., Biaxial strength and deformational behaviour of plain
and steel fiber concrete. ACI Materials Journal, 1991, 88(3), 354-362.
17. Dramix fibres hors fils d’acier pour reinforcement de betón et mortier, Specification,
Bekaert N.V., October, 1991.
18. Balaguru, P.N. and Shah, S.P., Fiber reinforced cement composites, McGraw-Hill
International Editions, Civil Engineering Series, 1992.
19. Trottier, J.-F. and Banthia, N., Toughness characterization of steel-fiber reinforced
concrete. J. Materials Civ. Engrg., ASCE, 1994, 6(2) 264-289.
20. Gopalaratnam, V.S., Shah, S.P., Batson, G.B., Criswell, M.E., Ramakrishnan, V.,
Wecharatana, M., Fracture toughness of fiber reinforced concrete. ACI Materials
Journal, July-August 1991, 88(4), 339-353.
21. Gopalaratnam, V.S. and Shah, S.P., Tensile failure of steel fibre-reinforced mortar.
Jour. of Eng. Mech., ASCE, May 1987, 113(5), 635-653.
22. Fanella, D.A. and Naaman, A., Stress-strain properties of fiber reinforced mortar in
compression. ACI Journal, 1985, 82(4), 475-483.
23. Ezeldin, A.S. and Balaguru, P.N., Normal- and high-strength fiber-reinforced concrete
under compression. J. Materials in Civil Engrg, ASCE, 1993, 4(4), 415-428.
24. CEB-FIP Model Code, Design code, Bulletin d’Information CEB Lausanne,
Switzerland, 1993.
24
25. Wee, T.H., Chin, M.S. and Mansur, M.A., Stress-strain relationship of high-strength
concrete in compression. J. Materials Civ. Engrg., ASCE, 1996, 8(2), 70-76.
26. RILEM, Draft Recommendation, 50-FMC Committee Fracture Mechanics of Concrete,
Determination of fracture energy of mortar and concrete by means of three-point bend
tests on notched beams. Materials and Structures, 1985, 18(106), 285-290.
27. Reissner, E., The effect of transverse shear deformation on the bending elastic plates.
Jour. Appl. Mech., 1945, 12, 69-76.
28. De Borst, R. and Nauta, P., Non-orthogonal cracks in a smeared finite element model.
Eng. Computations, March 1985, 2, 35-46.
29. De Borst, R., Non-linear analysis of frictional materials, Ph.D. Thesis, Delft Univ. of
Technology, 1986.
30. Rots, J.G., Computational modeling of concrete fracture, Ph.D. Thesis, Delft Univ. of
Technology, 1988.
31. Cervenka, V., Pukl, H. and Eligehausen, R., Computer simulation of anchoring
technique and design of concrete structures. Proc. Second Intern. Conf. on Computer
Aided Analysis and Desing of Concrete Structures, Zell am See, Austria, 1990, 1-19.
32. Swamy, R., Jones, R. and Chiam, T., Shear transfer in steel fiber reinforced concrete.
Fiber Reinforced Concrete Properties and Applications, Eds: S.P. Shah, G.B. Batson,
SP-105, 1987, 565-592.
33. Hofstetter, G. and Mang, H.A., Computational mechanics of reinforced concrete
structures, Ed. Vieweg, 1995.
34. J.A. Figueiras, Ultimate load analysis of anisotropic and reinforced concrete plates
and shells, Ph.D. Thesis, C/Ph/72/83, Uni. College of Swansea, 1983.
35. Feenstra, P.H., Computational aspects of biaxial stress in plain and reinforced
concrete, Ph.D. Thesis Delft Univ. of Technology, 1993.

25
36. Link, R.A., Elwi, A.E. and Scanlon, A., Biaxial tension stiffening due to generally
oriented reinforced layers. Jour. of Eng. Mech., ASCE, August 1989, 115(8),
1647-1662.
37. Massicote, B., Elwi, A.E. and J.G. MacGregor, Tension-stiffening model for planar
reinforced concrete members. Jour. of Struct. Eng., ASCE, November 1990, 116(11),
3039-3058.

26
Experimental
Model
30.024.012.0 18.06.00.0
10.0
15.0
20.0
30.0
35.0
40.0
25.0
0.0
5.0
( )MPa
cσ
( )εc 10 3−(a)
Experimental
Model
30.024.012.0 18.06.00.0
10.0
15.0
20.0
30.0
35.0
40.0
25.0
0.0
5.0
( )MPa
cσ
( )εc 10 3−(b)
Fig. 1. Analytical versus experimental compression stress-strain curves for concrete reinforced with 30 kg/m3
(a) and 60 kg/m3 (b) of ZX60/.80 fibers [10].

27
snncr
fct
f ct1
s nn,mcr
2 ctf
ecrnn,u1 2 nn,ue
crnn,uecr
cre nnnn,le
crnn,mcr
e
I,3D
cr
crDI,2
crD
I,1
G f b
/l
n nnecr
nnscr
αααα
αααα
ξξξξ ξξξξ
m
l
bfG l
Fig. 2. Trilinear softening diagram for hooked-ends steel fibre reinforced concrete ( bl is the width of the
fracture process zone).

28
t
snn
+
crs cr
nt
ntγ cr
e crnn
n
1x
2x
θ
Fig. 3. Crack stress and crack strain components.

29
hefh
b
c
φxNeutral axis
( )( )
hc
h xef =
+
−
min. /
/
2 5 2
3
φ
Fig. 4. Effective tension area according to CEB-FIP Model Code 1990 [24].
30
cr
nnAe
cr
nnBs
cr
nnAs
cr
nns
ctf
C
B
A
cr
nnBecr
nnCe cr
nne
Yield of
reinforcement at crack
Average layer strain equals the
reinforcement yield strain
Stabilized cracking
Fig. 5. Tension-stiffening diagram [14].

31
Slab middle surface
(s1,s2)
ji
Ksj
Ks
s2
s1
Fig. 6. The soil is simulated by spring elements, orthogonal to the concrete slab middle surface.

32
u
Z o n e BZ o n e A
3
s pa
D e f o r m e d s l a b
U n d e f o r m e d s l a b
S o i l
Z o n e B
Fig. 7. The loss of contact between the slab and the soil is accounted for.

33
as1 as2 asu
ps2
ps1
ks1
ksl
ks2
psu
Soil pressure
ps
Soil settlement as
Fig. 8 - Pressure–settlement relationship used to simulate the soil behaviour.
34
0
0
2
1
=
=
θ
u
0
0
1
2
=
=
θ
u
5 0 m m 5 0 m m
P
11 , ux
22 , ux
L o ad ed
area
Fig. 9. Finite element mesh.

35
0
50
100
150
200
250
300
0 2 4 6 8 10 12 14 16
Deflection (mm)
Fo
rce
(k
N)
Numerical
Experimental
Fig. 10. Force-deflection relationship at the central point of slab P3.

36
0
50
100
150
200
250
300
350
400
450
0 2 4 6 8 10 12 14 16 18 20
Deflection (mm)
Fo
rce (
kN
)
Numerical
Experimental
Fig. 11. Force-deflection relationship at the central point of slab P4.

37
-12
-10
-8
-6
-4
-2
0
2
4
6
-1500 -1000 -500 0 500 1000 1500
x1 - coordinate (mm)
De
fle
cti
on
(m
m)
60 kN
120 kN
180 kN
220 kN
230 kN
220 kN
60 kN
120 kN
180 kN
Experimental
Fig. 12. Deflection of slab P3 along 1x axis.

38
-12
-10
-8
-6
-4
-2
0
2
4
6
8
10
-1500 -1000 -500 0 500 1000 1500
x1 - coordinate (mm)
De
fle
cti
on
(m
m)
80 kN
160 kN
265 kN
345 kN
80 kN 160 kN 265 kN 345 kN
Experimental
Fig. 13. Deflection of slab P4 along 1x axis.

39
nº 1
nº 3
Fig. 14. Crack pattern of test slab P4 after failure (experimental).

40
Fig. 15. Crack pattern at bottom layer of test slab P4 for ultimate load (numerical).

41
-2
0
2
4
6
8
10
12
14
0 20 40 60 80 100 120 140 160 180 200 220
Force (kN)
Defl
ec
tio
n a
t co
rne
rs (
mm
) Experimental (four corners)
Numerical
Fig. 16. Deflection at point P (Fig. 9).

42
Fig. 1. Analytical versus experimental compression stress-strain curves for concrete reinforced with 30 kg/m3
(a) and 60 kg/m3 (b) of ZX60/.80 fibers [10].
Fig. 2. Trilinear softening diagram for hooked-ends steel fibre reinforced concrete ( bl is the width of the
fracture process zone).
Fig. 3. Crack stress and crack strain components.
Fig. 4. Effective tension area according to CEB-FIP Model Code 1990 [24].
Fig. 5. Tension-stiffening diagram [14].
Fig. 6. The soil is simulated by spring elements orthogonal to the concrete slab middle surface.
Fig. 7. The loss of contact between the slab and the soil is accounted for.
Fig. 8 - Pressure–settlement relationship used to simulate the soil behaviour.
Fig. 9. Finite element mesh.
Fig. 10. Force-deflection relationship at the central point of slab P3.
Fig. 11. Force-deflection relationship at the central point of slab P4.
Fig. 12. Deflection of slab P3 along 1x axis.
Fig. 13. Deflection of slab P4 along 1x axis.
Fig. 14. Crack pattern of test slab P4 after failure (experimental).

43
Fig. 15. Crack pattern at bottom layer of test slab P4 for ultimate load (numerical).
Fig. 16. Deflection at point P (see fig. 9).