model of a heat recovery steam generator (hrsg) process ... · state and transient operation of a...
TRANSCRIPT
Model of a Heat Recovery Steam Generator (HRSG) Process and Simulation in Steady State and Transient Operation
José Luis Vega-Fonseca1, Isaías Hernández-Ramírez1, Graciano Dieck-Assad2
1 CERREY S.A. de C.V. Monterrey, México 2 Department of Electrical and Computer Engineering
Tecnológico de Monterrey, Monterrey Campus
Abstract This paper provides the main characteristics of a modeling and simulation tool to analyze the steady
state and transient operation of a HRSG (Heat Recovery Steam Generator) when they are subject to load changes. The HRSG model includes the following modules: economizer, evaporator, super-heater, drum tank and control systems. The main contribution of this paper is the development of a numerical modeling tool that integrates sub-models based upon first principle equations of mass, energy and momentum balance. Also, the main heat transfer mechanisms are used to evaluate the dynamics of the HRSG system during normal and abnormal operations which includes the response of key process variables such as vapor pressure, temperature and mass flow rate. The analyzed cases are dynamic ramps from 100% to 75% load and a double ramp from 50% to 75% and to 100%. The simulation results show acceptable errors with less than 5.5% differences when compared with respect to design data. The analyzed variables are: gas temperature, fluid temperature, drum pressure, drum´s liquid level, and mass flow rate at each module. Those variables are analyzed with the design predicted performance of the real equipment of a HRSG provided by a local Company in Monterrey, México.
Introduction Electric Energy production and conservation has become a key technological challenge in the
development of nations to promote a steady and healthy socioeconomic development in countries. Nowadays, the most common electric Energy production process is to perform a fossil fuel combustion and transfer their calorific energy towards flue gases and water-vapor that impinge a prime mover connected to an electric generator. The gas turbine is one of the best options in electric generation power units due to their low costs in initial investment, operation, low emissions and low reaction time or response time in generating electric energy from scratch. In this case 2/3 of the mechanical work is used to self-power the operation of the turbine system and the rest can be used to generate electric energy. This characteristic produces an estimated efficiency between 25% and 45% [1] in gas turbine systems. Thermal and energetic engineering has developed methods to increase the efficiency in energy generation processes such that residues of a particular process can be used to drive another heat exchange process and therefore, this technique is called cogeneration. The most common cogeneration technique takes advantage of the residual heat of a gas turbine to produce useful thermal energy loaded to vapor or heated air and then, this energy is used in other industrial processes to increase electric energy production.
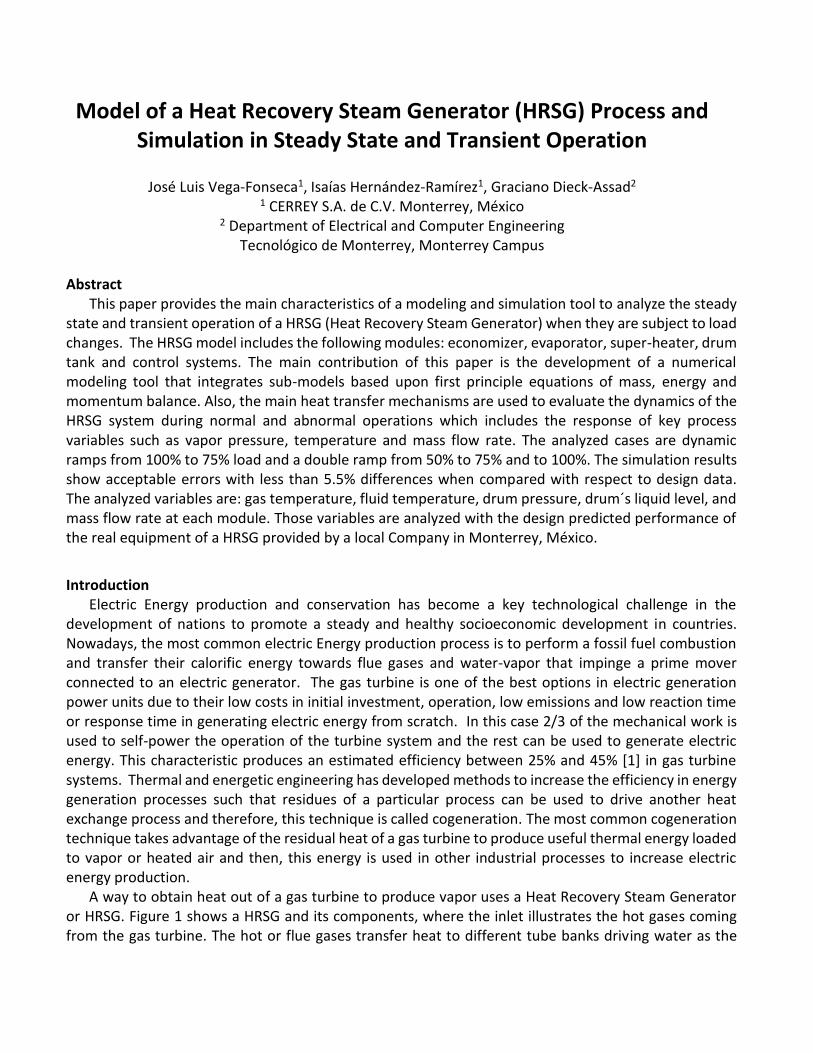
A way to obtain heat out of a gas turbine to produce vapor uses a Heat Recovery Steam Generator or HRSG. Figure 1 shows a HRSG and its components, where the inlet illustrates the hot gases coming from the gas turbine. The hot or flue gases transfer heat to different tube banks driving water as the
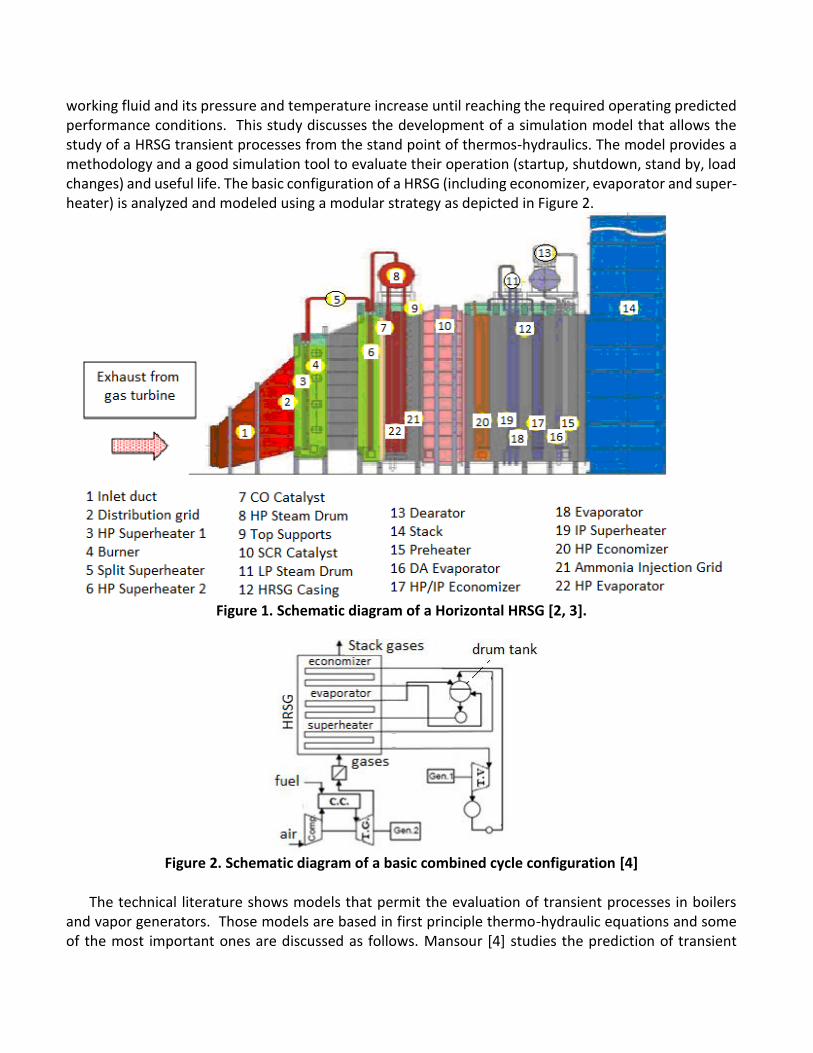
working fluid and its pressure and temperature increase until reaching the required operating predicted performance conditions. This study discusses the development of a simulation model that allows the study of a HRSG transient processes from the stand point of thermos-hydraulics. The model provides a methodology and a good simulation tool to evaluate their operation (startup, shutdown, stand by, load changes) and useful life. The basic configuration of a HRSG (including economizer, evaporator and super-heater) is analyzed and modeled using a modular strategy as depicted in Figure 2.
Figure 1. Schematic diagram of a Horizontal HRSG [2, 3].
Figure 2. Schematic diagram of a basic combined cycle configuration [4]
The technical literature shows models that permit the evaluation of transient processes in boilers
and vapor generators. Those models are based in first principle thermo-hydraulic equations and some of the most important ones are discussed as follows. Mansour [4] studies the prediction of transient

behaviors of CCGT (Combined Cycle Gas Turbine) plants and describes mathematical models of the dynamic behavior of the main components in the combined cycle process. His study describes the heat transfer equations of super-heater, evaporator and economizer that allows him to develop a numerical model and simulation system. His results are validated with field measurements from a power unit in Egypt. Dumont [5] describes models for HRSG in boilers “once-through” without drums. The economizer, superheater and evaporator models are lumped in one complex main super-model which is complex and difficult to differentiate individual component output variables. Dieck-Assad [6, 7] presents the development of a boiler model departing from first principle equations. The present work adopts his drum-evaporator model due to its simplicity considering just two control volumes with fewer state variables.
1. Modeling the HRSG System
1.1. Heat Exchangers
A HRSG consists of a tandem of heat exchangers such that their mathematical modeling uses the governing equations from heat transfer, fluid dynamics thermal properties of tube materials and thermal properties of water. The heat exchange physical phenomena involve nonlinear models that produces complex equation systems to represent the HRSG. Therefore, in order to simplify the equations a set of assumptions is required and the following considerations and simplifications are proposed:
The hot (flue) gases inertia is neglected.
Heat loss around the HRSG control volume is not considered.
The combustion gases flow has a uniform homogeneous distribution across the tube interchange area.
The combustion gases coming from the turbine are considered to behave ideal at a pressure of 1 atm.
The tubes in a distributed arrangement are identical, in other words, the water-vapor mass flow rate divides among the number of tubes leaving the header and the quantity of flue gases between tubes is the same.
The following considerations are made at each module: at the economizer the water flowing is at saturated liquid conditions, in the evaporator we assume two phases at saturated conditions, and in the super-heater, only superheated steam is considered except for the control volume of the attemperator system.
The gas flow coming from the turbine has also a pressure loss through the heat Exchange process, however, this work focus on the internal behavior of the heat Exchange fluid and therefore, the velocity, pressure and composition of flue gases are the same as the entering conditions to the first module. The super-heater and economizer are considered as large heat exchangers where the flue gas follows trajectories similar to the ones shown in the figure 3. The water flows thru a series of tube banks which are aligned in normal directions to hot gases flow coming from the turbine. The tube banks are parallel among them and they are tied together with U tube connections as shown in figure 3.
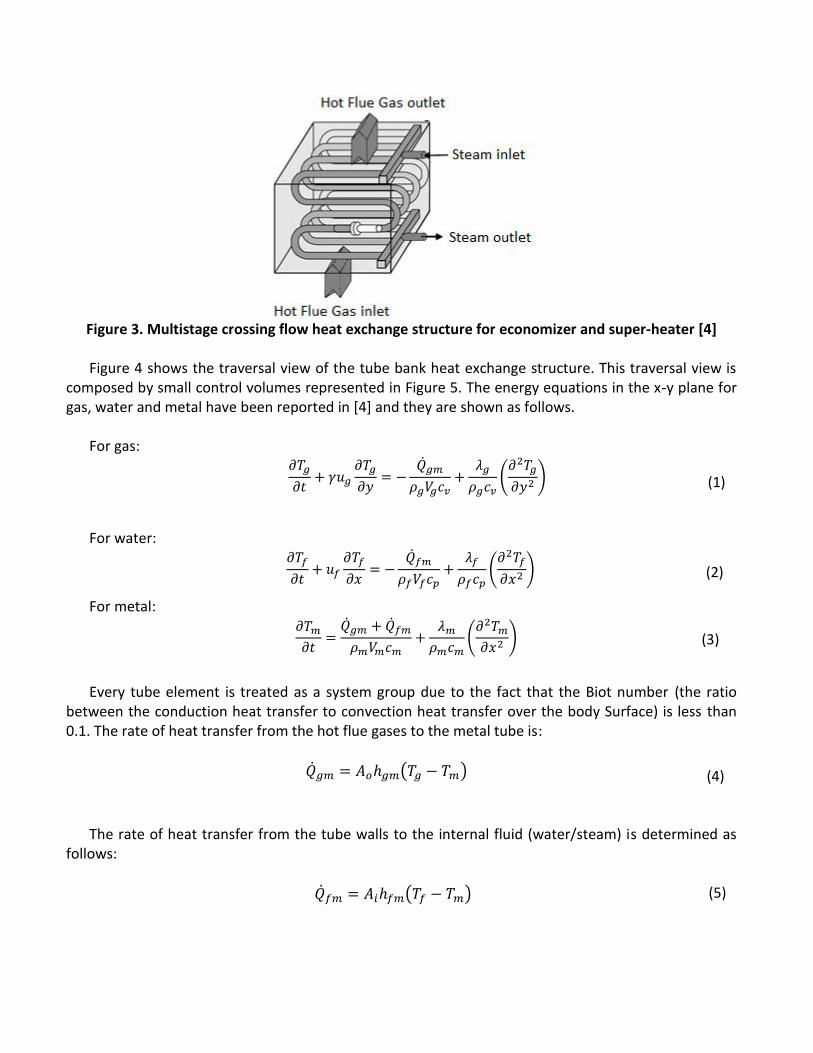
Figure 3. Multistage crossing flow heat exchange structure for economizer and super-heater [4]
Figure 4 shows the traversal view of the tube bank heat exchange structure. This traversal view is
composed by small control volumes represented in Figure 5. The energy equations in the x-y plane for gas, water and metal have been reported in [4] and they are shown as follows.
For gas:
𝜕𝑇𝑔
𝜕𝑡+ 𝛾𝑢𝑔
𝜕𝑇𝑔
𝜕𝑦= −
�̇�𝑔𝑚
𝜌𝑔𝑉𝑔𝑐𝑣+
𝜆𝑔
𝜌𝑔𝑐𝑣(
𝜕2𝑇𝑔
𝜕𝑦2 ) (1)
For water:
𝜕𝑇𝑓
𝜕𝑡+ 𝑢𝑓
𝜕𝑇𝑓
𝜕𝑥= −
�̇�𝑓𝑚
𝜌𝑓𝑉𝑓𝑐𝑝+
𝜆𝑓
𝜌𝑓𝑐𝑝(
𝜕2𝑇𝑓
𝜕𝑥2 ) (2)
For metal: 𝜕𝑇𝑚
𝜕𝑡=
�̇�𝑔𝑚 + �̇�𝑓𝑚
𝜌𝑚𝑉𝑚𝑐𝑚+
𝜆𝑚
𝜌𝑚𝑐𝑚(
𝜕2𝑇𝑚
𝜕𝑥2 ) (3)
Every tube element is treated as a system group due to the fact that the Biot number (the ratio
between the conduction heat transfer to convection heat transfer over the body Surface) is less than 0.1. The rate of heat transfer from the hot flue gases to the metal tube is:
�̇�𝑔𝑚 = 𝐴𝑜ℎ𝑔𝑚(𝑇𝑔 − 𝑇𝑚) (4)
The rate of heat transfer from the tube walls to the internal fluid (water/steam) is determined as follows:
�̇�𝑓𝑚 = 𝐴𝑖ℎ𝑓𝑚(𝑇𝑓 − 𝑇𝑚) (5)
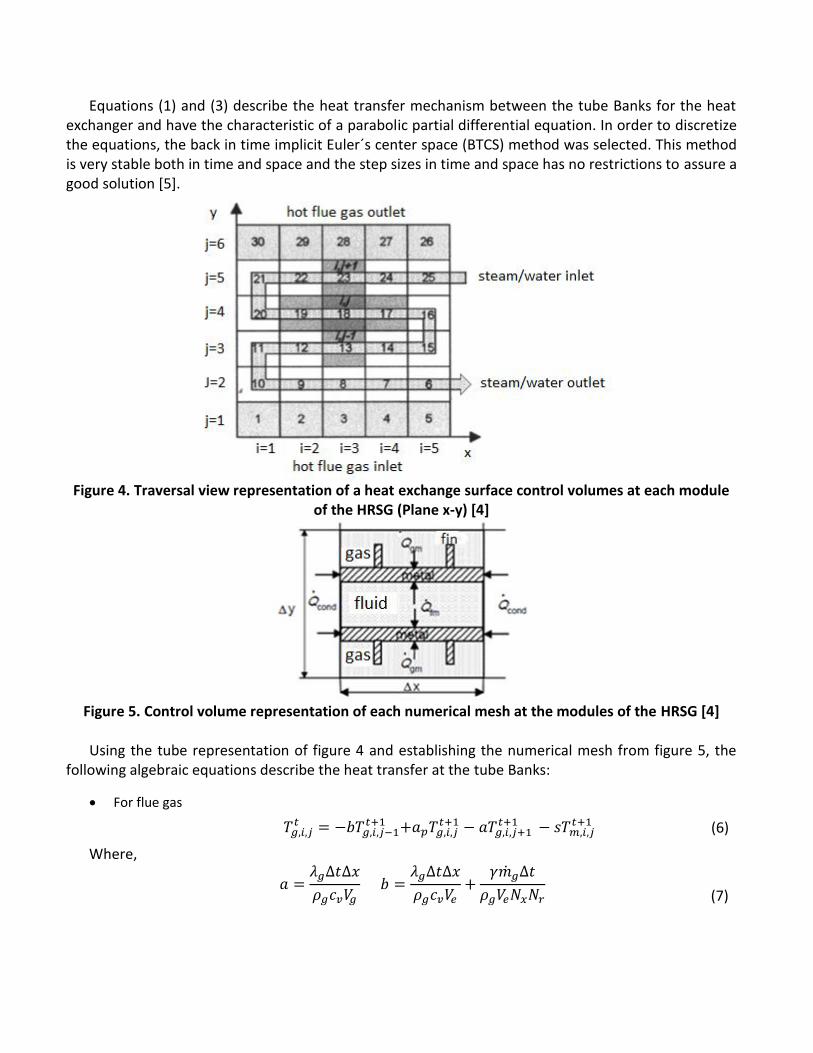
Equations (1) and (3) describe the heat transfer mechanism between the tube Banks for the heat exchanger and have the characteristic of a parabolic partial differential equation. In order to discretize the equations, the back in time implicit Euler´s center space (BTCS) method was selected. This method is very stable both in time and space and the step sizes in time and space has no restrictions to assure a good solution [5].
Figure 4. Traversal view representation of a heat exchange surface control volumes at each module
of the HRSG (Plane x-y) [4]
Figure 5. Control volume representation of each numerical mesh at the modules of the HRSG [4]
Using the tube representation of figure 4 and establishing the numerical mesh from figure 5, the
following algebraic equations describe the heat transfer at the tube Banks:
For flue gas
Where,
𝑎 =𝜆𝑔∆𝑡∆𝑥
𝜌𝑔𝑐𝑣𝑉𝑔 𝑏 =
𝜆𝑔∆𝑡∆𝑥
𝜌𝑔𝑐𝑣𝑉𝑒+
𝛾�̇�𝑔∆𝑡
𝜌𝑔𝑉𝑒𝑁𝑥𝑁𝑟
(7)
𝑇𝑔,𝑖,𝑗𝑡 = −𝑏𝑇𝑔,𝑖,𝑗−1
𝑡+1 +𝑎𝑝𝑇𝑔,𝑖,𝑗𝑡+1 − 𝑎𝑇𝑔,𝑖,𝑗+1
𝑡+1 − 𝑠𝑇𝑚,𝑖,𝑗𝑡+1 (6)
𝑠 =𝐴0ℎ𝑔𝑚∆𝑡
𝜌𝑔𝑉𝑔𝑐𝑣 𝑎𝑝 = 1 + 𝑎 + 𝑏 + 𝑠
For Metal
𝑇𝑚,𝑖,𝑗𝑡 = −𝑎𝑇𝑚,𝑖−1,𝑗
𝑡+1 + 𝑎𝑝𝑇𝑚,𝑖,𝑗𝑡+1 − 𝑎𝑇𝑚,𝑖+1,𝑗
𝑡+1 − 𝑏𝑇𝑔,𝑖,𝑗𝑡+1 − 𝑠𝑇𝑓,𝑖,𝑗
𝑡+1 (8)
Where,
𝑎 =𝜆𝑚∆𝑡∆𝑦
𝜌𝑚𝑐𝑚𝑉𝑚 𝑏 =
𝐴𝑜ℎ𝑔𝑚∆𝑡
𝜌𝑚𝑉𝑚𝑐𝑚
𝑠 =𝐴𝑖ℎ𝑓𝑚∆𝑡
𝜌𝑚𝑉𝑚𝑐𝑚 𝑎𝑝 = 1 + 2𝑎 + 𝑏 + 𝑠
(9)
Water/Vapor
𝑇𝑓,𝑖,𝑗𝑡 = −𝑏𝑇𝑓,𝑖−1,𝑗
𝑡+1 + 𝑎𝑝𝑇𝑓,𝑖,𝑗𝑡+1 − 𝑎𝑇𝑓,𝑖+1,𝑗
𝑡+1 − 𝑠𝑇𝑚,𝑖,𝑗𝑡+1
(10)
Where,
𝑎 =𝜆𝑓∆𝑡𝐷𝑖
𝜌𝑓𝑐𝑝𝑉𝑓 𝑏 =
𝜆𝑓∆𝑡𝐷𝑖
𝜌𝑓𝑐𝑝𝑉𝑓+
�̇�𝑓∆𝑡
𝜌𝑓𝑉𝑓𝑁𝑡
𝑠 =𝐴𝑖ℎ𝑓𝑚∆𝑡
𝜌𝑓𝑉𝑓𝑐𝑝 𝑎𝑝 = 1 + 𝑎 + 𝑏 + 𝑠
(11)
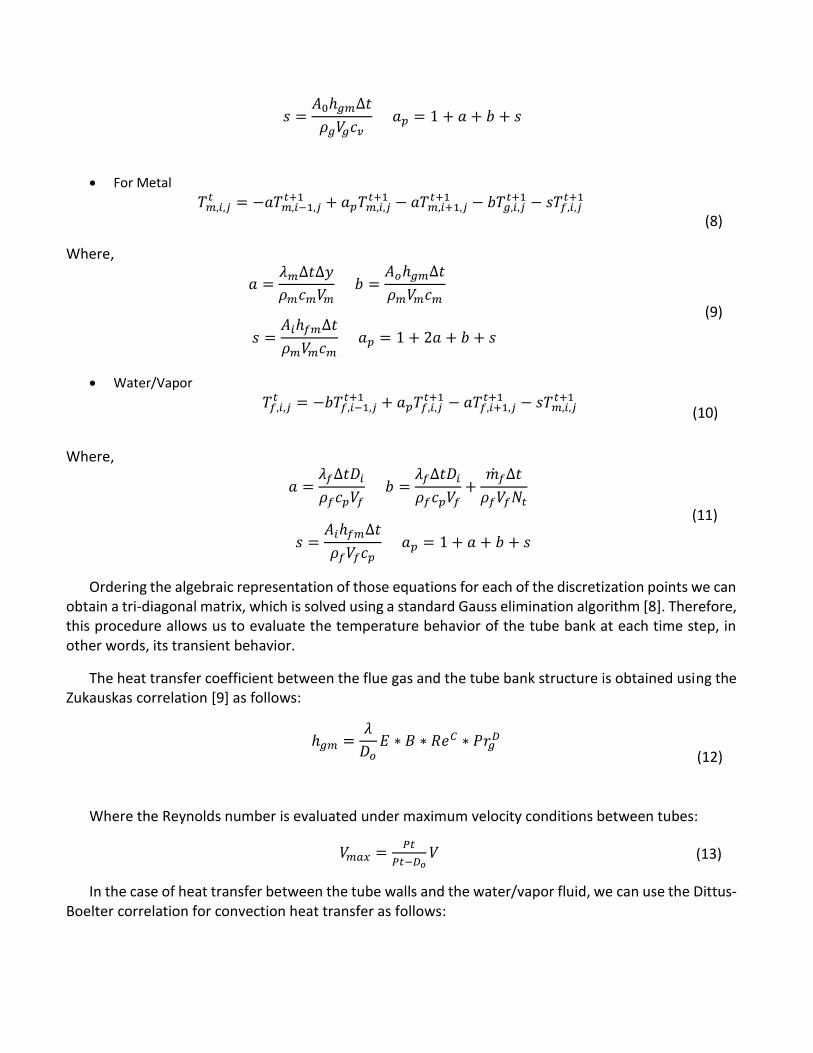
Ordering the algebraic representation of those equations for each of the discretization points we can obtain a tri-diagonal matrix, which is solved using a standard Gauss elimination algorithm [8]. Therefore, this procedure allows us to evaluate the temperature behavior of the tube bank at each time step, in other words, its transient behavior.
The heat transfer coefficient between the flue gas and the tube bank structure is obtained using the Zukauskas correlation [9] as follows:
ℎ𝑔𝑚 =𝜆
𝐷𝑜𝐸 ∗ 𝐵 ∗ 𝑅𝑒𝐶 ∗ 𝑃𝑟𝑔
𝐷
(12)
Where the Reynolds number is evaluated under maximum velocity conditions between tubes:
𝑉𝑚𝑎𝑥 =𝑃𝑡
𝑃𝑡−𝐷𝑜𝑉 (13)
In the case of heat transfer between the tube walls and the water/vapor fluid, we can use the Dittus-Boelter correlation for convection heat transfer as follows:

Where n=0.4 when the tube is at higher temperature tan the working fluid (cooling) and n=0.33 when the tube is at lower temperature tan the working fluid (heating).
1.2. Thermodynamic Properties
The thermo-physical properties of the working fluids and flue gases that participates in the heat Exchange process of the HRSG change with respect to temperature and pressure. Therefore, we need to include a thermodynamics properties model that describes the water/vapor and hot gases behavior at different temperatures. The International Association of Properties of Water and Vapor, IAPWS, [10] proposes equations distributed in regions of thermodynamic state as illustrated in the pressure (p) versus Temperature (T) diagram shown in Figure 6.
Figure 6. Distribution of thermodynamic property regions for modeling equations by IAPWS [9].
The simulation model integrates routines for the water thermodynamic properties which are based
and published in IAPWS-IF97 [10], “Release on the IAPWS Industrial Formulation 1997 for the Thermodynamic Properties of Water and Steam”. For the thermodynamic properties of turbine waste gases, we used the polynomials published by Yaws [11], which describe the behavior of each component in terms of temperature.
The heat transfer capacity in the tube banks is determined by the thermal conductivity, specific heat and density, which depend upon the operating temperature of the material. The ASME in “2001 ASME Boiler and Pressure Bessel Code, Section II – Materials” [12] describes and classifies the materials which have similar behavior due to their chemical composition and their thermodynamic properties are shown as a function of the working temperature.
hfm = 0.023λ
DiRe4/5Prn (14)
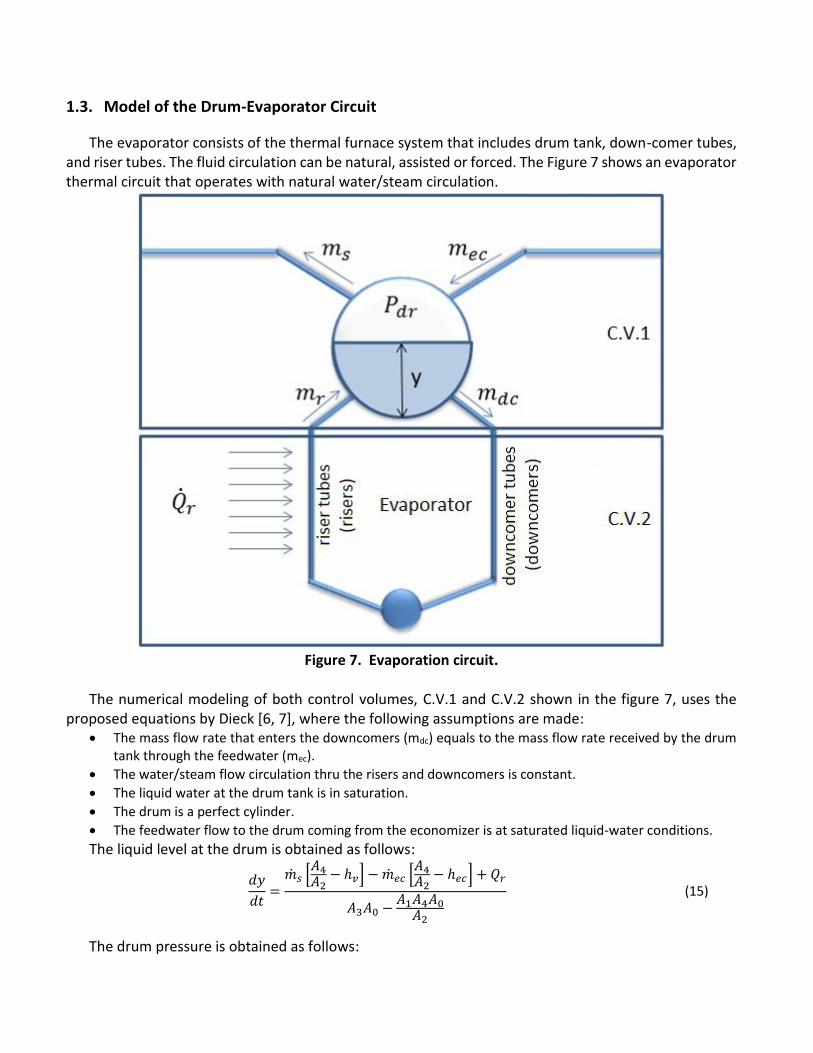
1.3. Model of the Drum-Evaporator Circuit
The evaporator consists of the thermal furnace system that includes drum tank, down-comer tubes, and riser tubes. The fluid circulation can be natural, assisted or forced. The Figure 7 shows an evaporator thermal circuit that operates with natural water/steam circulation.
Figure 7. Evaporation circuit.
The numerical modeling of both control volumes, C.V.1 and C.V.2 shown in the figure 7, uses the
proposed equations by Dieck [6, 7], where the following assumptions are made: The mass flow rate that enters the downcomers (mdc) equals to the mass flow rate received by the drum
tank through the feedwater (mec).
The water/steam flow circulation thru the risers and downcomers is constant.
The liquid water at the drum tank is in saturation.
The drum is a perfect cylinder.
The feedwater flow to the drum coming from the economizer is at saturated liquid-water conditions.
The liquid level at the drum is obtained as follows:
𝑑𝑦
𝑑𝑡=
�̇�𝑠 [𝐴4𝐴2
− ℎ𝑣] − �̇�𝑒𝑐 [𝐴4𝐴2
− ℎ𝑒𝑐] + 𝑄𝑟
𝐴3𝐴0 −𝐴1𝐴4𝐴0
𝐴2
(15)
The drum pressure is obtained as follows:
𝑑𝑃
𝑑𝑡=
�̇�𝑠 [𝐴3𝐴1
− ℎ𝑣] − �̇�𝑒𝑐 [𝐴3𝐴1
− ℎ𝑒𝑐] + 𝑄𝑟
𝐴4 −𝐴3𝐴2
𝐴1
(16)
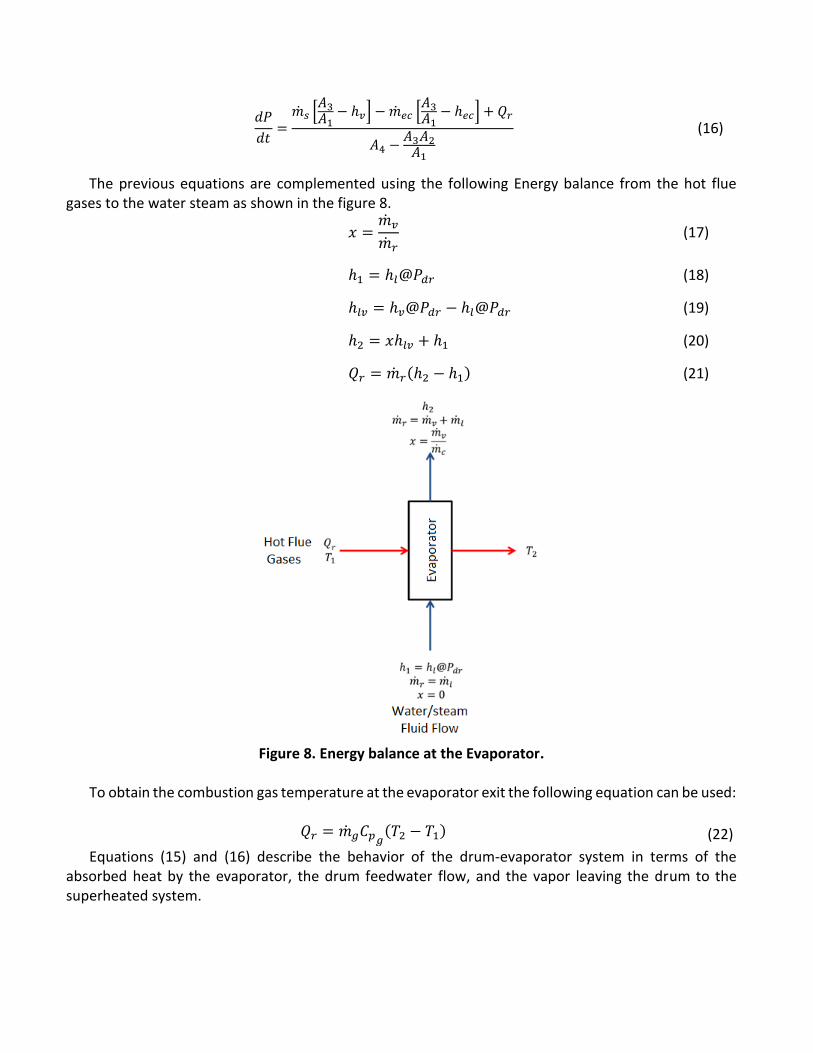
The previous equations are complemented using the following Energy balance from the hot flue gases to the water steam as shown in the figure 8.
𝑥 =�̇�𝑣
�̇�𝑟 (17)
ℎ1 = ℎ𝑙@𝑃𝑑𝑟 (18)
ℎ𝑙𝑣 = ℎ𝑣@𝑃𝑑𝑟 − ℎ𝑙@𝑃𝑑𝑟 (19)
ℎ2 = 𝑥ℎ𝑙𝑣 + ℎ1 (20)
𝑄𝑟 = �̇�𝑟(ℎ2 − ℎ1) (21)
Figure 8. Energy balance at the Evaporator.
To obtain the combustion gas temperature at the evaporator exit the following equation can be used:
𝑄𝑟 = �̇�𝑔𝐶𝑝𝑔(𝑇2 − 𝑇1) (22)
Equations (15) and (16) describe the behavior of the drum-evaporator system in terms of the absorbed heat by the evaporator, the drum feedwater flow, and the vapor leaving the drum to the superheated system.

1.4. Control System Model
The predicted performance of the HRSG expects the use of a three element drum level control system in the evaporator. This will allow a smooth control in the drum tank dynamic behavior. The configuration is based upon three process variables that are measured during the HRSG operation: output steam flow, drum liquid level and feedwater flow. The proposed control system model uses PID controllers for the three element control system.
The standard PID model is as follows:
𝐺𝑐 = 𝑘𝑝 (𝐸𝑡 +1
𝑇𝑖∫ 𝐸𝑡𝑑𝑡
𝑡
0+ 𝑇𝑑
𝑑𝐸𝑡
𝑑𝑡) (23)
Where the discrete formulation is:
∆𝐺𝑐 = 𝑘𝑝 [𝐸𝑡 − 𝐸𝑡−∆𝑡 +∆𝑡
2𝑇𝑖(𝐸𝑡 + 𝐸𝑡−∆𝑡) +
𝑇𝑑
∆𝑡(𝐸𝑡 − 2𝐸𝑡−∆𝑡 + 𝐸𝑡−2∆𝑡)]
(24)
The first PID controller sets the demand for drum level that is compensated by the feedforward signal from the steam flow as shown in the figure 9. The compensated demand signal for drum level is compared to the measured feedwater flow signal to obtain the error signal that feeds the second PID controller that activates the feedwater valve actuator. Therefore, the use of three process signals: drum level, steam flow and feedwater flow in the HRSG decreases the expansion and contraction behavior in the drum liquid due to sudden changes in steam load. Summarizing the drum level control includes the first PID controller, which determines the liquid level demands, and the second PID controller, which determines the feedwater to the drum tank.
The feedwater flow is controlled by modifying the cross sectional area of the valve which is the percentage of opening. The following equations illustrate this controlling action.
𝐸(𝐴𝑃𝑤𝑣𝑦) = 𝑦𝑟 − 𝑦, 𝐸(𝐴𝑃𝑤𝑣�̇�) = �̇�𝑣 − �̇�𝑤
∆𝐴𝑃𝑤𝑣 = ∆𝐺[𝐸(𝐴𝑃𝑤𝑣𝑦)] + ∆𝐺[𝐸(𝐴𝑃𝑤𝑣�̇�)] (25)
The steam flow, flowing out of the drum tank, is also modifying using the percentage of opening, however, this controller does not follow the liquid level signal, but the drum pressure of the HRSG. The figure 10 shows how the drum pressure signal, that generates a demand signal which is feedforwarded by the steam flow, obtains the demand for the vapor actuator valve. The following equations show the controlling action for the actuator of steam valve.
𝐸(𝐴𝑃𝑠𝑣) = 𝑃𝑟 − 𝑃 ∆𝐴𝑃𝑠𝑣 = ∆𝐺[𝐸(𝐴𝑃𝑠𝑣)]
(26)
The Figure 11 shows the steam temperature control system that uses vapor attemperation to regulate the main steam thermal conditions going to the superheater system. The system compares the steam temperature at the superheater 2 outlet with the set point to generate the error. Then the PID controller generates the demand signal to open or close the spray valve which brings water/vapor at lower temperature than the superheat leaving the drum.
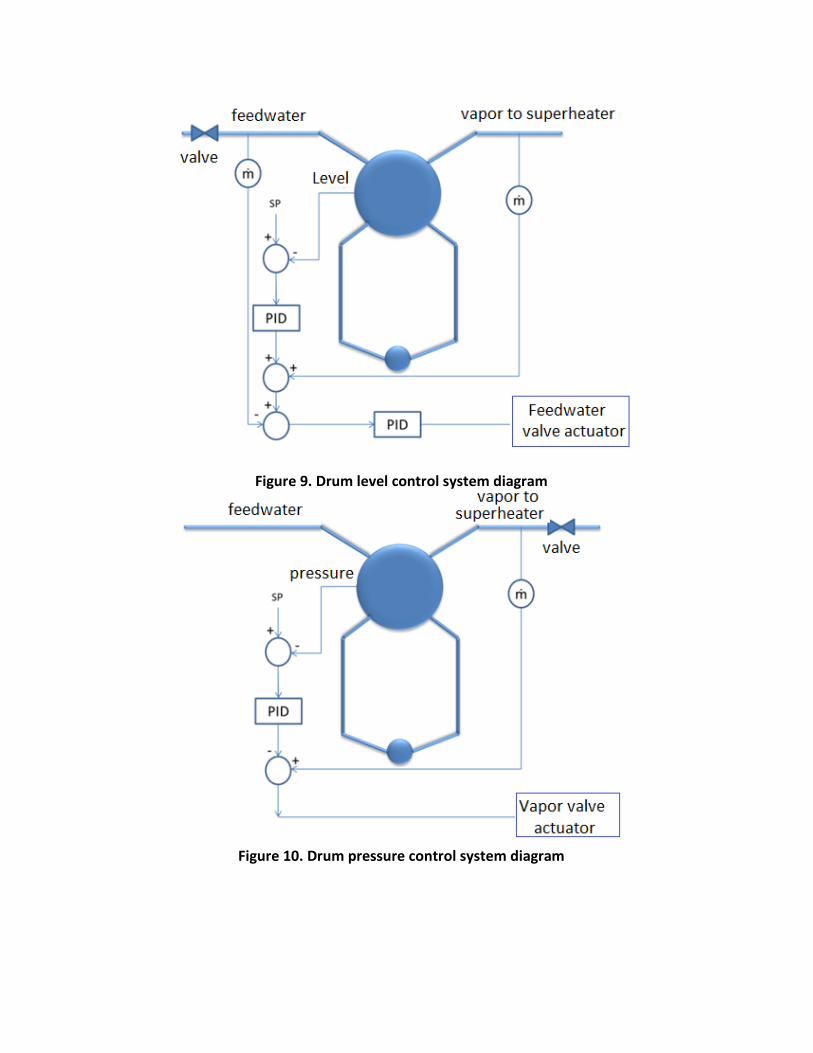
Figure 9. Drum level control system diagram
Figure 10. Drum pressure control system diagram
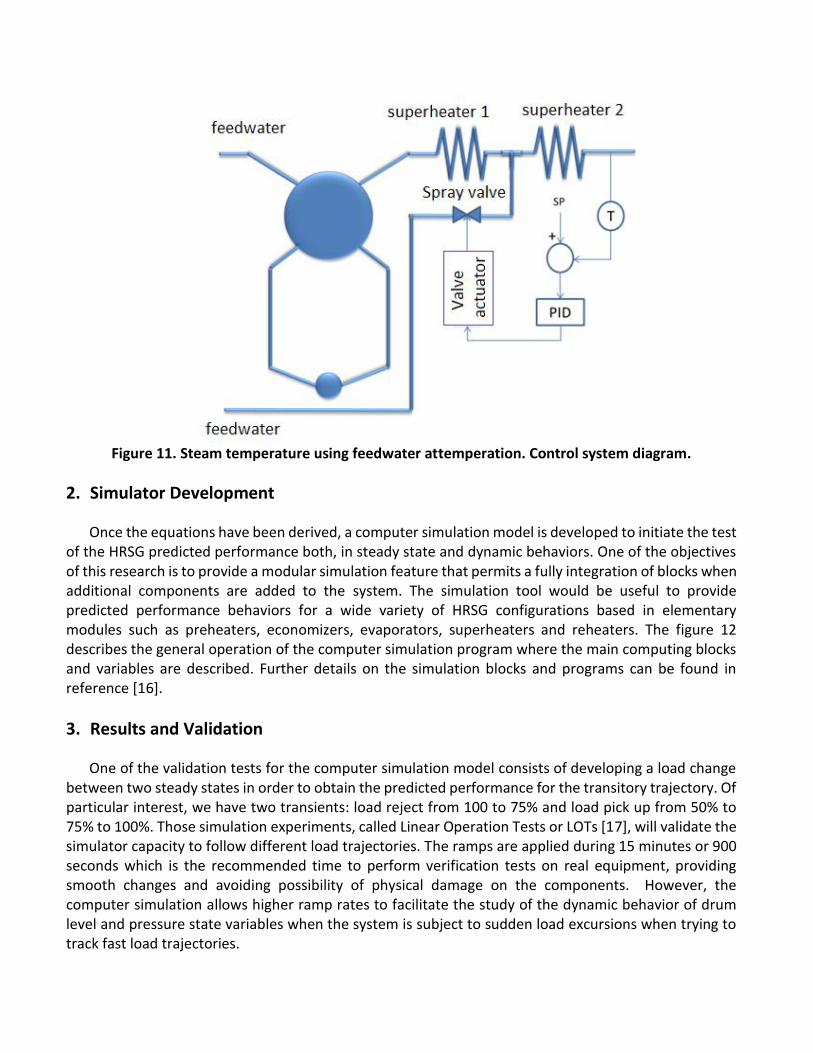
Figure 11. Steam temperature using feedwater attemperation. Control system diagram.
2. Simulator Development
Once the equations have been derived, a computer simulation model is developed to initiate the test of the HRSG predicted performance both, in steady state and dynamic behaviors. One of the objectives of this research is to provide a modular simulation feature that permits a fully integration of blocks when additional components are added to the system. The simulation tool would be useful to provide predicted performance behaviors for a wide variety of HRSG configurations based in elementary modules such as preheaters, economizers, evaporators, superheaters and reheaters. The figure 12 describes the general operation of the computer simulation program where the main computing blocks and variables are described. Further details on the simulation blocks and programs can be found in reference [16].
3. Results and Validation
One of the validation tests for the computer simulation model consists of developing a load change between two steady states in order to obtain the predicted performance for the transitory trajectory. Of particular interest, we have two transients: load reject from 100 to 75% and load pick up from 50% to 75% to 100%. Those simulation experiments, called Linear Operation Tests or LOTs [17], will validate the simulator capacity to follow different load trajectories. The ramps are applied during 15 minutes or 900 seconds which is the recommended time to perform verification tests on real equipment, providing smooth changes and avoiding possibility of physical damage on the components. However, the computer simulation allows higher ramp rates to facilitate the study of the dynamic behavior of drum level and pressure state variables when the system is subject to sudden load excursions when trying to track fast load trajectories.
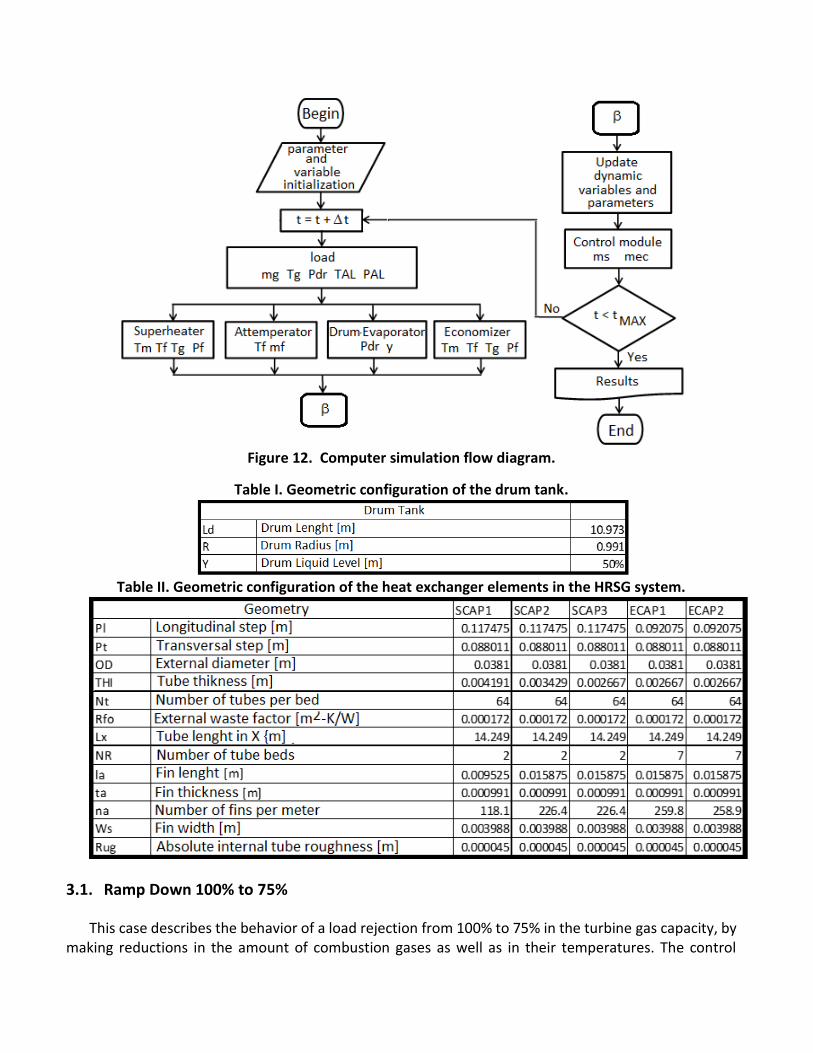
Figure 12. Computer simulation flow diagram.
Table I. Geometric configuration of the drum tank.
Table II. Geometric configuration of the heat exchanger elements in the HRSG system.
3.1. Ramp Down 100% to 75%
This case describes the behavior of a load rejection from 100% to 75% in the turbine gas capacity, by making reductions in the amount of combustion gases as well as in their temperatures. The control
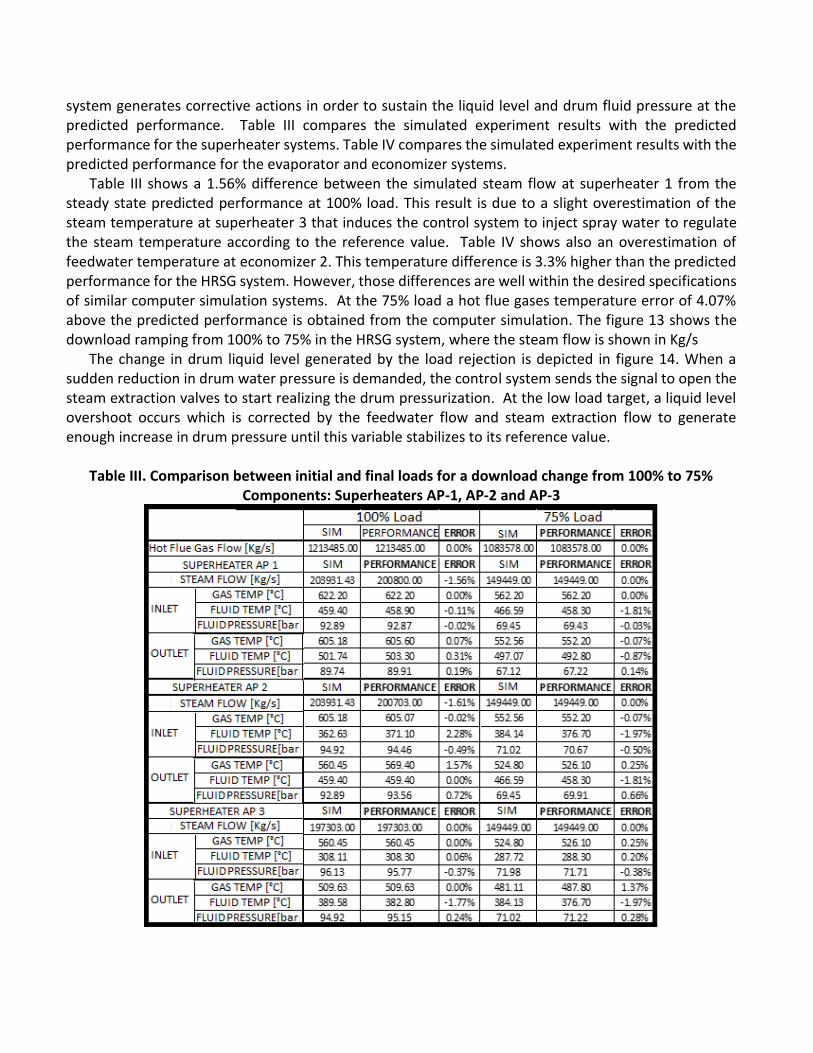
system generates corrective actions in order to sustain the liquid level and drum fluid pressure at the predicted performance. Table III compares the simulated experiment results with the predicted performance for the superheater systems. Table IV compares the simulated experiment results with the predicted performance for the evaporator and economizer systems.
Table III shows a 1.56% difference between the simulated steam flow at superheater 1 from the steady state predicted performance at 100% load. This result is due to a slight overestimation of the steam temperature at superheater 3 that induces the control system to inject spray water to regulate the steam temperature according to the reference value. Table IV shows also an overestimation of feedwater temperature at economizer 2. This temperature difference is 3.3% higher than the predicted performance for the HRSG system. However, those differences are well within the desired specifications of similar computer simulation systems. At the 75% load a hot flue gases temperature error of 4.07% above the predicted performance is obtained from the computer simulation. The figure 13 shows the download ramping from 100% to 75% in the HRSG system, where the steam flow is shown in Kg/s
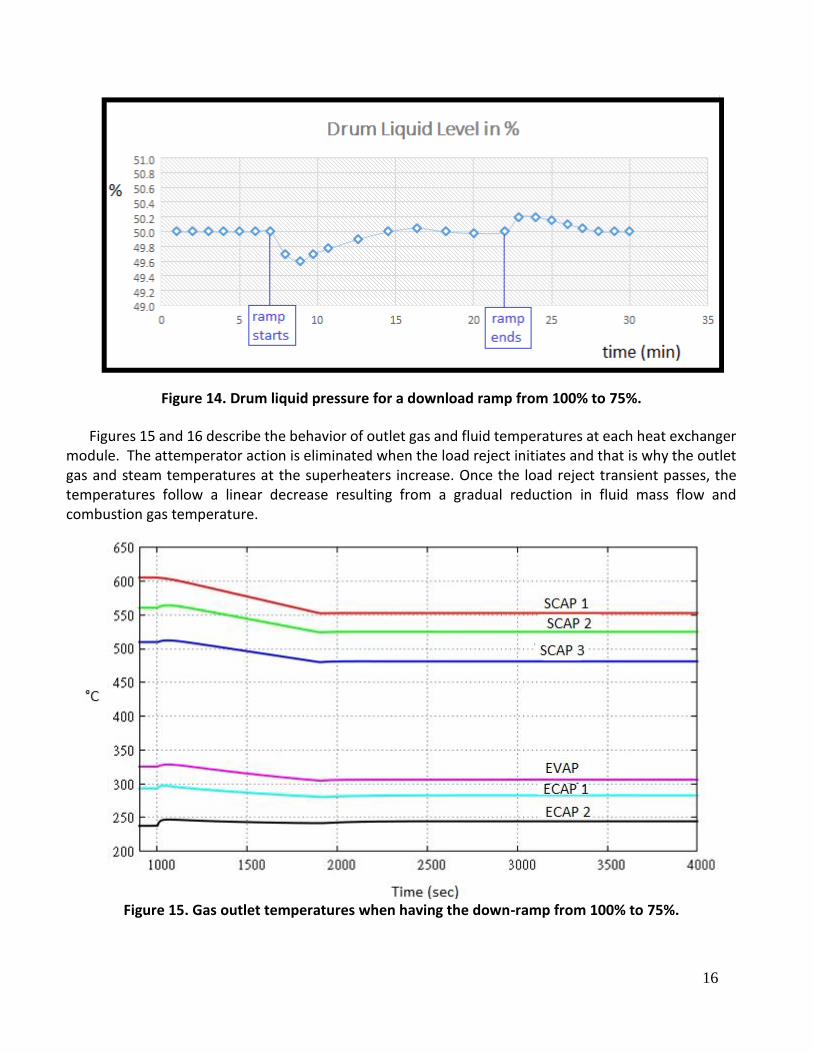
The change in drum liquid level generated by the load rejection is depicted in figure 14. When a sudden reduction in drum water pressure is demanded, the control system sends the signal to open the steam extraction valves to start realizing the drum pressurization. At the low load target, a liquid level overshoot occurs which is corrected by the feedwater flow and steam extraction flow to generate enough increase in drum pressure until this variable stabilizes to its reference value.
Table III. Comparison between initial and final loads for a download change from 100% to 75%
Components: Superheaters AP-1, AP-2 and AP-3

Table IV. Comparison between initial and final loads for a download change from 100% to 75% Components: Evaporator, Economizer AP-1 and Economizer AP-2
Figure 13. Steam flow rate for a download ramp from 100% to 75%.
16
Figure 14. Drum liquid pressure for a download ramp from 100% to 75%.
Figures 15 and 16 describe the behavior of outlet gas and fluid temperatures at each heat exchanger module. The attemperator action is eliminated when the load reject initiates and that is why the outlet gas and steam temperatures at the superheaters increase. Once the load reject transient passes, the temperatures follow a linear decrease resulting from a gradual reduction in fluid mass flow and combustion gas temperature.
Figure 15. Gas outlet temperatures when having the down-ramp from 100% to 75%.
17
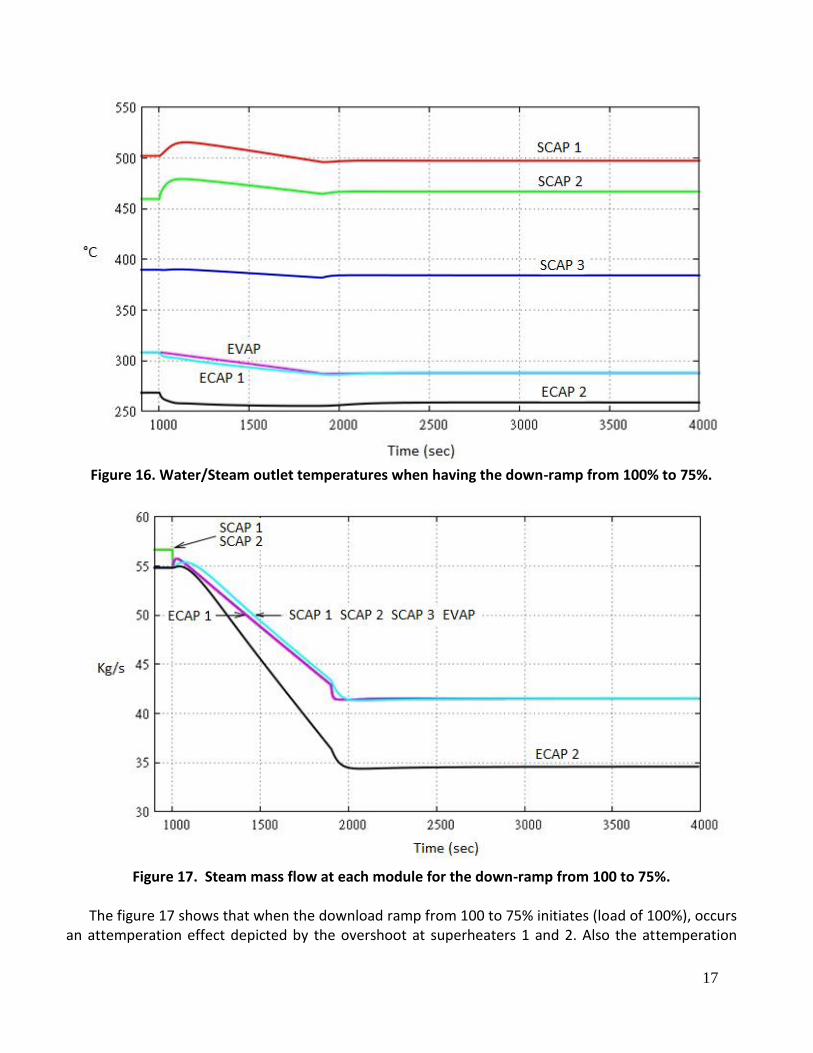
Figure 16. Water/Steam outlet temperatures when having the down-ramp from 100% to 75%.
Figure 17. Steam mass flow at each module for the down-ramp from 100 to 75%.
The figure 17 shows that when the download ramp from 100 to 75% initiates (load of 100%), occurs
an attemperation effect depicted by the overshoot at superheaters 1 and 2. Also the attemperation
18
process is cut when the load reject initiates, and therefore slight temperature increments occur as described previously.
3.2. Ramp Up 50% to 75% to 100% with attemperator failure
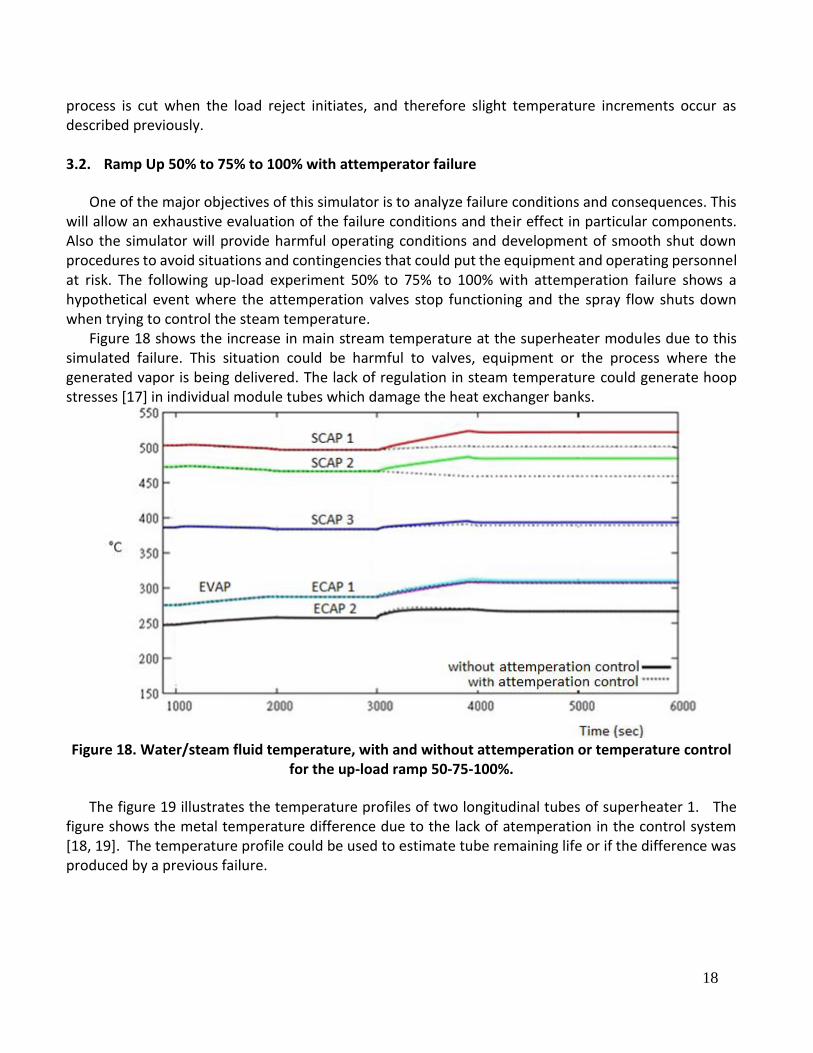
One of the major objectives of this simulator is to analyze failure conditions and consequences. This will allow an exhaustive evaluation of the failure conditions and their effect in particular components. Also the simulator will provide harmful operating conditions and development of smooth shut down procedures to avoid situations and contingencies that could put the equipment and operating personnel at risk. The following up-load experiment 50% to 75% to 100% with attemperation failure shows a hypothetical event where the attemperation valves stop functioning and the spray flow shuts down when trying to control the steam temperature.
Figure 18 shows the increase in main stream temperature at the superheater modules due to this simulated failure. This situation could be harmful to valves, equipment or the process where the generated vapor is being delivered. The lack of regulation in steam temperature could generate hoop stresses [17] in individual module tubes which damage the heat exchanger banks.
Figure 18. Water/steam fluid temperature, with and without attemperation or temperature control
for the up-load ramp 50-75-100%.
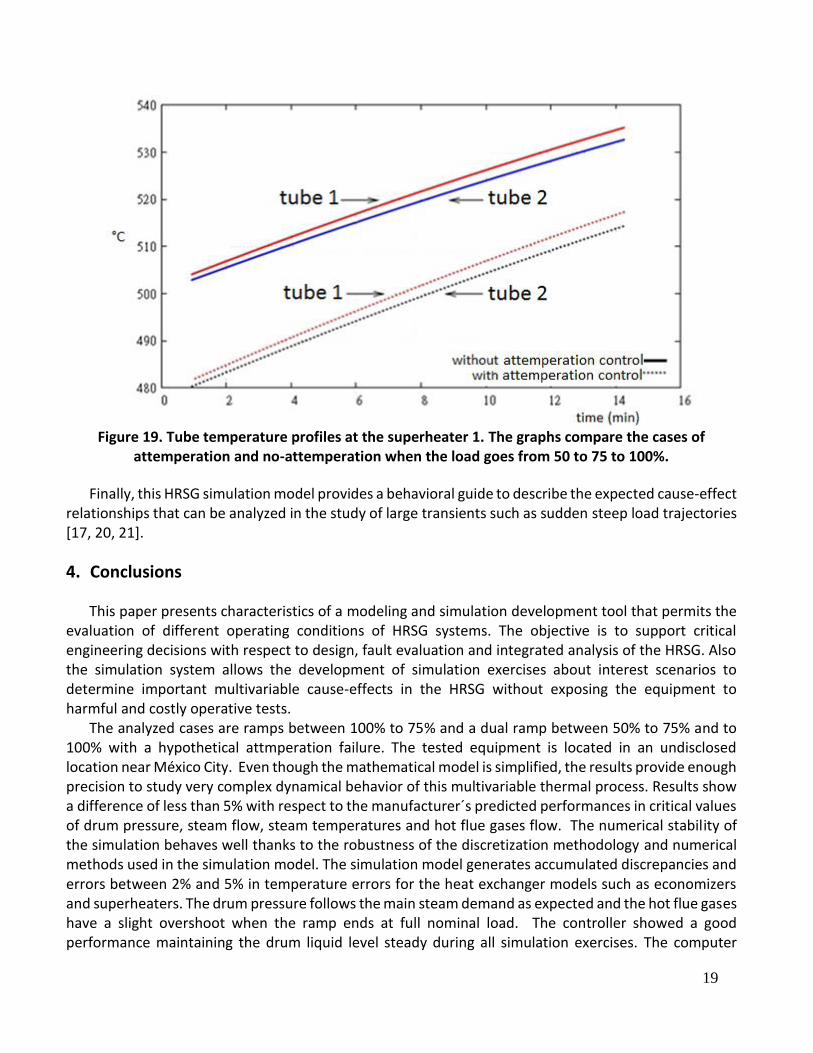
The figure 19 illustrates the temperature profiles of two longitudinal tubes of superheater 1. The figure shows the metal temperature difference due to the lack of atemperation in the control system [18, 19]. The temperature profile could be used to estimate tube remaining life or if the difference was produced by a previous failure.
19
Figure 19. Tube temperature profiles at the superheater 1. The graphs compare the cases of
attemperation and no-attemperation when the load goes from 50 to 75 to 100%.
Finally, this HRSG simulation model provides a behavioral guide to describe the expected cause-effect relationships that can be analyzed in the study of large transients such as sudden steep load trajectories [17, 20, 21].
4. Conclusions
This paper presents characteristics of a modeling and simulation development tool that permits the evaluation of different operating conditions of HRSG systems. The objective is to support critical engineering decisions with respect to design, fault evaluation and integrated analysis of the HRSG. Also the simulation system allows the development of simulation exercises about interest scenarios to determine important multivariable cause-effects in the HRSG without exposing the equipment to harmful and costly operative tests.
The analyzed cases are ramps between 100% to 75% and a dual ramp between 50% to 75% and to 100% with a hypothetical attmperation failure. The tested equipment is located in an undisclosed location near México City. Even though the mathematical model is simplified, the results provide enough precision to study very complex dynamical behavior of this multivariable thermal process. Results show a difference of less than 5% with respect to the manufacturer´s predicted performances in critical values of drum pressure, steam flow, steam temperatures and hot flue gases flow. The numerical stability of the simulation behaves well thanks to the robustness of the discretization methodology and numerical methods used in the simulation model. The simulation model generates accumulated discrepancies and errors between 2% and 5% in temperature errors for the heat exchanger models such as economizers and superheaters. The drum pressure follows the main steam demand as expected and the hot flue gases have a slight overshoot when the ramp ends at full nominal load. The controller showed a good performance maintaining the drum liquid level steady during all simulation exercises. The computer
20
simulation effort was performed to demonstrate and describe the transient behavior when the HRSG is subject to load changes. Finally, the modular approach used can be expanded to include different geometric configurations and operating conditions, as well as different tuning alternatives for the control system.
Acknowledgments
The authors wish to express their gratitude to the Industrial Consortium to Foster Applied Research
and Technological Development at the Tecnológico de Monterrey for their liaison with the enterprise CERREY S.A. de C.V. This strategic alliance generated intellectual and financial support to develop this important research.
Glossary of Terms 𝐴 Area (m2) 𝑐𝑝 Specific heat at constant pressure (J/kg K)
𝑐𝑣 Specific heat at constant volume (J/kg K) 𝐷 Diameter (m) 𝐸 Error as a function of time 𝐺 Transfer function 𝑔 Gravity (m/s2) HRSG Heat Recovery Steam Generator ℎ Entalpy (J/kg) or heat transfer coefficient (W/m2K); 𝑘𝑝 Proportional gain
𝐿 Length (m) 𝑀 Mass (kg) �̇� Mass flow rate (kg/s) 𝑁𝑅 Number of tube beds (or levels) 𝑁𝑇 Number of tubes per bed P Pressure (bar) 𝑃𝑙 Longitudinal step (m) 𝑃𝑡 Transversal step (m) PM Molecular weight (kg/moles) 𝑃𝑟 Prandtl number
�̇� Heat transfer rate (W) 𝑟 Radius (m) 𝑅𝑒 Reynolds number 𝑡 Time (s) 𝑇 Temperature (K) 𝑇𝑖 Integral time constant (s) 𝑇𝑑 Derivative time constant (s) 𝑢 Specific internal energy (J/kg) 𝑉 Velocity (m/s) Or Volume (m3) 𝑣 Specific volume (m3/kg)
21
𝑥 Coordenate x Or vapor quality
𝑌 Volumetric fraction 𝑦 Coordenate y
Or Level (m) 𝑓𝑑 Friction coefficient 𝜀 Roughness (m) 𝜉 Flow resistance coefficient 𝛾 Specific heat ratio, 𝑐𝑝/𝑐𝑣
𝜂 Efficiency ∆ Change 𝜆 Thermal conductivity (W/m K) 𝜌 Density (kg/m3) 𝜇 Dynamic viscosity (Pa s)
Abbreviations EVAP High pressure evaporator ECAP High pressure economizer TEF Inlet fluid temperature TSF Outlet fluid temperature TEG Inlet gas temperature TSG Outlet gas temperature SCAP High pressure super-heater
Sub-indices 𝑐 refers to compound 𝑑𝑐 refers to down-comers 𝑑𝑟 refers to drum tank 𝑒𝑐 refers to economizer 𝑓 refers to internal fluid 𝑓𝑚 refers to the transfer from fluid to metal 𝑔 refers to Gas 𝑔𝑚 refers to the transfer from gas to metal ℎ refers to Hydraulics 𝑖 refers to internal 𝑙 refers to liquid water 𝑚 refers to metal 𝑚𝑖𝑥 refers to a mixture 𝑜 refers to external 𝑟 refers to riser tubes Or refers to reference value 𝑠 refers to super-heater 𝑣 refers to water vapor 𝑤ℎ refers to water header 𝑤𝑠 refers to the main steam valve 𝑤𝑣 refers to the feed-water valve
22
References
1. Cengel, Y. 2006. Mecanica de fluidos fundamentos y aplicaciones. Mexico : McGraw-Hill Interamericana.
2. Starr F. 2003. Background to the design of HRSG Systems and Implications for CCGT plant Cycling. OMNI, Vol. 2.
3. Stultz S. C. and Kitto J.B. Editors, 1992, Steam, Its Generation and Use, “Combined Cycles, Waste Heat Recovery and Other Steam Systems”, 40th Edition, Babcock and Wilcox Co. Barberton OH 1992, 31.1-31.13 4. Mansour F. M. 2003. Combined Cycle Dynamics. IMechE Proc. Instn. Mech. Engrs., Vol. 217 Part A:
J. Power and Energy. 5. Dumont, M-N. 2004, “Mathematical modelling and design of advanced once-through heat recovery steam generator,” Computers and Chemical Engineering, Elsevier, 28: 651:660. 6. Dieck-Assad G. 1990. Development of a State Boiler Model for Process Optimization. SIMULATION,
55: 201-213. 7. Dieck-Assad G. 2006. Modeling and Simulation of a Fuzzy Supervisory Controller for an Industrial
Boiler. Dieck-Assad, SIMULATION, 82: 841-850. 8. Nakamura, S. 1992. Metodos numericos aplicados con software. Mexico : Pearson. 9. Zukauskas, A. 1987. Heat transfer from tubes in cross flow. New York : Wiley Interscience. 10. International Association for the Properties of Water and Steam. IAPWS Industrial Formulation
1997 for the Thermodynamic Properties of Water and Steam. 11. Yaws, C. Yaws' 2003. Handbook of thermodynamic and physical properties of chemical
compounds. s.l. : Knovel. 12. American Society of Mechanical Engineers. 2001 ASME Boiler and Pressure Vessel Code, Section II
- Materials, subpart 2. 13. Crane Co. 2009. Flow of fluids through valves, fittings and pipe. Technical paper No. 410. 14. Incropera, F. 2007. Fundamentals of heat and mass transfer. 6 Edicion. USA : Wiley. 15. Holman, J.P. 1986. Heat Transfer. 6 Edicion. USA : McGraw-Hill. 16. Vega-Fonseca, J. L. 2012. Development of a simulator to study transients in Heat Recovery Steam
Generator HRSG processes. Master´s Thesis. Tecnológico de Monterrey, Monterrey campus, México. 17. Dieck-Assad G. 1984. Midium Scale Modeling and Controller Optimization of a Boiler Turbine
System. Phd Dissertation. University of Texas at Austin, Austin, Texas, USA. 18. Dieck Assad, G. 1992, “Controllability and Optimization of Main Steam Temperature in Boilers with Burner Tilting," IEEE Mexicon 1992, Guadalajara, Jalisco, Mexico. 19. Rovira, V. 2010, “A model to predict the behavior at part load operation of once-through heat recovery steam generators working with water at supercritical pressure,” Applied Thermal Engineering, 30: 1652-1658. 20. Lee, K. 2000, “Analysis of thermal stress evolution in the steam drum during start-up of a heat recovery steam generator,” International Journal of Energy Research, 24: 137:149. 21. Astrom, K.J. Lund, 2000, “Drum boiler dynamics”, Automatica, 36: 363-378.