model of gas flow through upper tundish nozzle refractory …ccc.illinois.edu/s/reports12/liu-r gas...
TRANSCRIPT

Model of Gas Flow through Upper Tundish Nozzle Refractory and Initial Bubble Size
Rui Liu and Brian G. Thomas Department of Mechanical Science and Engineering,
University of Illinois at Urbana-Champaign 1206 W. Green Street, Urbana, IL 61801 USA Phone – (217) 333-6919
Fax – (217) 244-6534 Email: [email protected]
ABSTRACT
Argon flowing through the porous upper tundish nozzle (UTN) refractory forms the gas bubbles which greatly impact the multiphase flow pattern in the SEN and caster, and on defect formation in the final product. Two separate computational models, (pressure-source and porous-flow), were developed and validated to study gas flow through heated UTN refractory including the thermal effects on gas expansion and permeability. A third model predicts the initial bubble size distribution. Simulations revealed an asymmetric gas distribution from the inner surface of a particular UTN design, which was confirmed with observations of a static physical water model. The models were then applied to predict the gas and bubble behavior during commercial caster operation with slide-gate flow control, including the effect of gas leakage.
Key words: Argon gas, pressure-source mode, porous-flow model, UTN refractory, gas leakage, Initial bubble size
INTRODUCTION
During continuous casting of steel, argon gas is often injected via an Upper Tundish Nozzle (UTN) in order to prevent reoxidation and nozzle clogging. This gas also has significant effect on liquid steel flow patterns in the nozzle and mold regions [1]. Extensive research has investigated argon-steel two-phase flow in the nozzle and mold regions, using mixture models [2, 3], multiple-Eulerian models [4] and Eulerian-Lagrangian models [5]. The accuracy of these modeling efforts depends on two key parameters: the volumetric flow rate of argon gas entering the steel in the hot condition, and the initial bubble size distribution entering the nozzle. The total argon flow rate, which is usually measured in the “cold” condition at standard temperature and pressure (STP) in standard liters per minute (SLPM) well before entering the nozzle, is very different from the argon flow rate entering the molten steel in a hot condition through the nozzle walls. Some of the gas escapes through leaks in delivery system, joints and cracks in the refractory, or the seals with its surrounding steel jacket. The remaining gas flows with a nonuniform distribution, and expands as it travels through the heated refractories. The latter effect is accounted for by considering the ideal gas law, derived as follows from [2] to estimate argon flow rate in the hot condition at port exit.
0, ,g hot g cold
n
T pQ Q
T p gLρ∞
∞ ∞
= +
(1)
Qg (m
3/s) is gas flow rate, T0 is the casting temperature (K), T∞ is the ambient temperature (K), p∞ is the ambient pressure (Pa), and Ln is the pressure head of molten steel above the gas injection region (m), taken here to be the jet submergence depth to give the best accuracy in the mold region. The corresponding gas fraction is given by App. II in [2]. Argon bubble size determines the interfacial momentum exchange between the gas and liquid phases, and has a huge impact on the liquid steel flow pattern in the mold region [1], as investigated by Shi [4]. Because argon bubbles are not visually accessible during the casting process, analytical or numerical models are required to predict the initial bubble size distribution. Many models are available
to predict bubble size when argon is injected into relatively stagnant liquid metal, such as applicable in ladle refining processes [6]. Bai and Thomas [7] developed a semi-analytical two-stage model to predict initial bubble formation from a single hole in the nozzle wall, considering the important drag effect of the downward-flowing steel. They calibrated and validated this model to reproduce measurements in air-water systems, and applied it to predict initial bubble size in argon-steel system. Previous modeling studies of argon-steel two phase flows usually fix the gas inlet boundary condition to simple constant values, by converting the measured argon volumetric flow rate into hot condition using a form of Eq. (1), and guessing the bubble size as an input parameter [5]. Attempts have been made to directly compute bubble sizes during water-model or caster two-phase flow simulations using interface-capturing techniques such as the Volume of Fluid (VOF) method [7,8], but this takes so much grid refinement to resolve the surface of each bubble that it cannot be applied in practice to the entire nozzle/mold region, even with the supercomputer power of today. Thus, there is a great need for an accurate modeling approach to predict the amount of argon gas leakage, to calculate the nonuniform gas velocity distribution exiting the UTN nozzle wall surfaces in the hot condition, and to predict realistic initial bubble size distributions entering the molten steel. In this work, two different steady three-dimensional (3-D) computational models, a porous-flow model and a pressure-source model, are developed to simulate gas flow through UTN refractory, taking into account the thermal expansion effect of the heating gas, the change of gas viscosity with temperature, and the drop in pressure through the nozzle wall. These models are validated using a test problem with a known analytical solution and visual observations of a static water test using a commercial UTN. The porous-flow model is then applied to estimate the initial size of bubble formation at the UTN inner surface by combining its results with previous models and correlations [9]. The new model then was applied to estimate the gas leakage during the casting process, making use of the recorded backpressure. Finally, 3-D argon-steel two-phase simulations of flow in the nozzle and mold region were performed, with and without considering gas leakage. The contrasting results demonstrate the importance of including the new porous-flow model approach in future models of two-phase flow in steel continuous casting with argon.
MODEL DESCRIPTION
Two separate models are developed here to simulate gas flow through porous refractory: a pressure source model, and a porous-flow model. In order to incorporate the thermal expansion effect of the gas, a heat transfer model is first developed to calculate the temperature distribution within the nozzle refractory walls.
To model heat transfer across the UTN refractory, the steady state heat conduction equation (2) is solved,
( ) 0k T∇ ⋅ ∇ = (2)
The dependence of gas density on pressure and temperature is given by the ideal gas law, equation (3), where R is the gas constant,
p RTρ= (3)
To satisfy mass conservation, the following continuity equation is solved, which retains gas density for compressibility due to thermal expansion,
( ) 0ρ∇ ⋅ =v (4)
For the pressure-source model, Darcy’s law is adopted to obtain gas velocity from local pressure gradient, which is valid if the flow is laminar. Because the pores are very small, flow is expected to be laminar over a wide range for ceramic refractory materials [10].
DK p= − ∇v (5)
The permeability of gas flow through a porous medium consists of two parts, shown in equation (6): the specific permeability KDS over the gas dynamic viscosity µ. The dynamic viscosity of argon gas is given in equation (7) and varies greatly with temperature. The specific permeability denotes the ability of liquid to flow through the refractory material, which depends on the pore structure of the porous medium, and does not depend on temperature, if thermal expansion is neglected [10].
( )DS
D
KK
Tμ= (6)
where KDS is the refractory specific permeability, given a typical value of 1.01×10⁻¹² m2.
For argon gas, the temperature-dependent viscosity was based on experiments [11], and expressed as:

( ) ( )20.63842lg 6.9365/ 3374.72/ 1.51196
0 10T T T
Tμ μ − − −= ∗ (7)
where µ0 is the argon dynamic viscosity at 20 °C, and has the value of 2.228×10⁻⁵ Pa·s.
Re-organizing equations (3), (4) and (5) yields the final form of the equation solved in the pressure-source model, shown in equation (8). On the left hand side of the equation is in the diffusion term, and on the right hand side of the equation serve are the source terms that account for thermal expansion of the gas, and the permeability change with temperature.
( ) ( )D D
RT pK p K p
p RT∇ ⋅ ∇ = − ∇ ⋅ ∇
(8)
For the porous-flow model, the Navier-Stokes Equations with additional momentum source terms are solved to model flow through porous media. This model is given in Equation (9), and the two extra source terms are in the right-hand side parentheses [12]: the first for viscous momentum loss, and the second for inertial momentum loss, which can be neglected in laminar flows by setting C to zero
( ) ( ) ( ) 1
2p C
t
ρ μρ μ ρα
∂+ ∇ ⋅ = −∇ + ∇ ⋅ ∇ + − +
∂
vvv v F v v v (9)
where 1
DK
μα
= .
The porous-flow model is solved using the commercial CFD package FLUENT [12], distributed by ANSYS Inc. The pressure-source model can be solved using any program that solves the heat conduction equation, and is conveniently solved with an in-house code. In the current work, the pressure-source equation is solved using the User Defined Scalar (UDS) function in FLUENT [12], with the non-linear source term added via a User Defined Function (UDF).
MODEL VALIDATION WITH ANALYTICAL TEST PROBLEMS
The test cases to validate the pressure-source model and porous-flow model are illustrated in Figure 1, using the same three-dimensional numerical approaches developed for the real nozzle. Gas is injected from the outer surface of a piece of refractory tube, with specified pressure P or superficial velocity V. The temperatures are fixed at the inner and outer surfaces, at T1 and T2 respectively, with T2 lower than T1. The two side walls, as well as top and bottom walls, are set to symmetric planes as boundary conditions. The test cases are designed similar to UTN operating conditions during the real process, so that the results can be interpreted and applied to the real system. The test-problem parameters are listed in Table I.
Table I. Parameters for Test Case Boundary Conditions R
1 (m) R
2 (m) P
1 (Pa) P
2 (Pa) T
1 (K) T
2 (K) V (m/s)
0.0375 0.0725 100000 200000 1800 1000 0.0073
The test cases are essentially 1-D problems, and the governing equations can be simplified from equations (2) and (6) using a cylindrical coordinate system in the radial direction, r. Two sets of ODEs are obtained as shown below to study the effects of argon gas thermal expansion and gas viscosity change with temperature on the pressure and gas velocity distributions.
If the effect of argon viscosity change with temperature is ignored and argon thermal expansion is included, the simplified 1-D ordinary differential equations (ODEs) are given in equation (10)
( )
210
10
T PP P
r T P
rTr
′ ′′′ ′+ − + =
′′ =
(10)
When both the temperature-dependent gas viscosity (shown in Figure 2) and thermal expansion are considered, the ODEs follow the form below in equation (11):

( )
210
10
D
D
KT PP P
r T K P
rTr
′′ ′′′ ′+ − + + =
′′ =
(11)
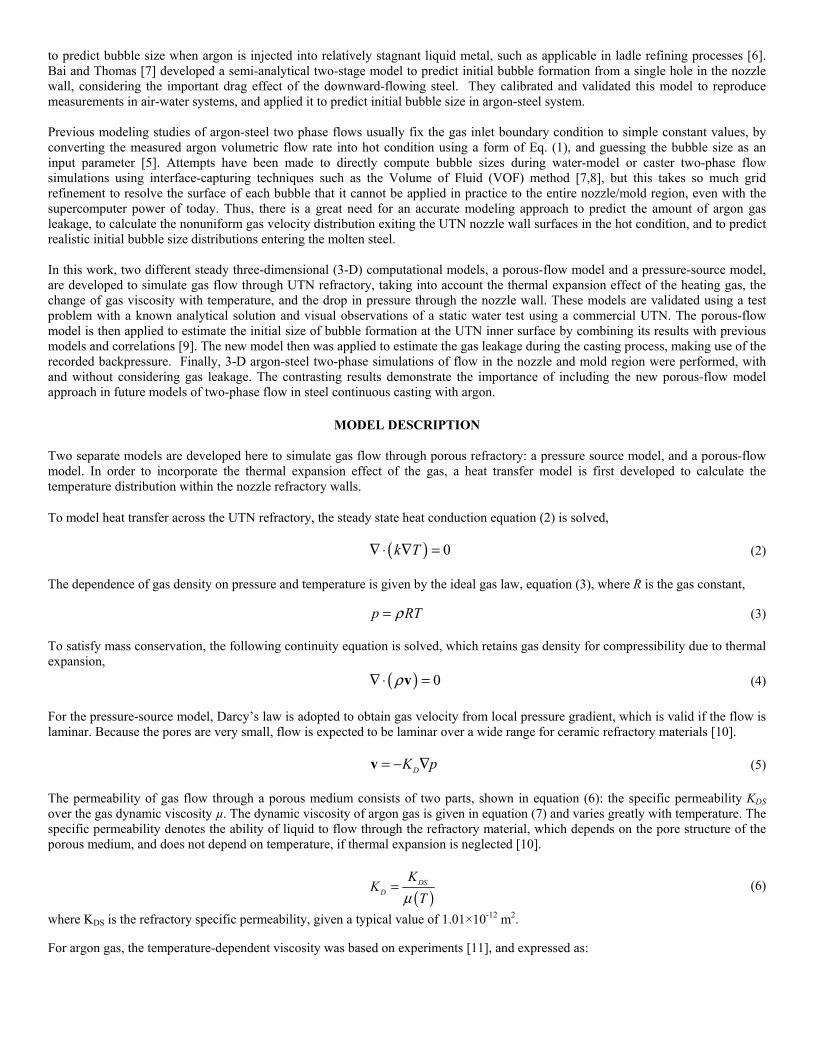
The ODEs shown above are discretized with a 2nd order central differencing scheme and solved on a fine mesh with the Tri-Diagonal Matrix Algorithm. The non-linear term P’2/P in the pressure equation is explicitly updated each iteration. Two problems were simulated, using a fixed pressure or a fixed mass flow rate boundary condition applied at the gas inlet (inside radius surface). The effects of gas thermal expansion, and gas viscosity change with temperature were also tested for each case. Details of the two test problems are listed in Figure 3 and Figure 4, together with corresponding pressure distributions along the radial direction through the refractory wall.
Figure 1. Geometry and Mesh for Test Cases Figure 2. Argon Viscosity Profile along Radial Direction
Results from all three models using the fixed pressure boundary condition are shown in Figure 3, for three different test cases. Three curves each are presented for the 1-D ODE solution, (lines), the porous flow model, (square symbols), and the pressure-source model (circles). It is clear from the comparison that for all three cases, the pressure-source model and porous-flow model match perfectly with each other, and they both match with the 1-D ODE solution. Thus all three models are validated. It can be seen that the cases with either thermal expansion or temperature-dependent gas viscosity produce higher pressures everywhere within the nozzle. Without thermal effects, the pressure distribution is almost flat, with slight upward curvature caused by the surface area difference between the inner and outer surfaces of the curved refractory walls. Figure 4 shows the pressure distributions for the test cases with the fixed argon mass-flow-rate boundary condition. As observed in Figure 3, all three models converge to the same solution for each of four cases, providing further model validation. To achieve a given fixed gas flow rate at the outer surface, the pressure inside the wall must increase to overcome three different effects which combine together, in order of importance: thermal expansion of the gas, increasing gas viscosity with temperature, and difference between inner/outer tube diameter. Increasing temperature towards the inside-radius tube bore causes the gas to expand, and the gas viscosity to increase. Combined with the smaller area of the inner surface, a higher pressure is required to push the same amount of gas through the inner surface of the refractory.
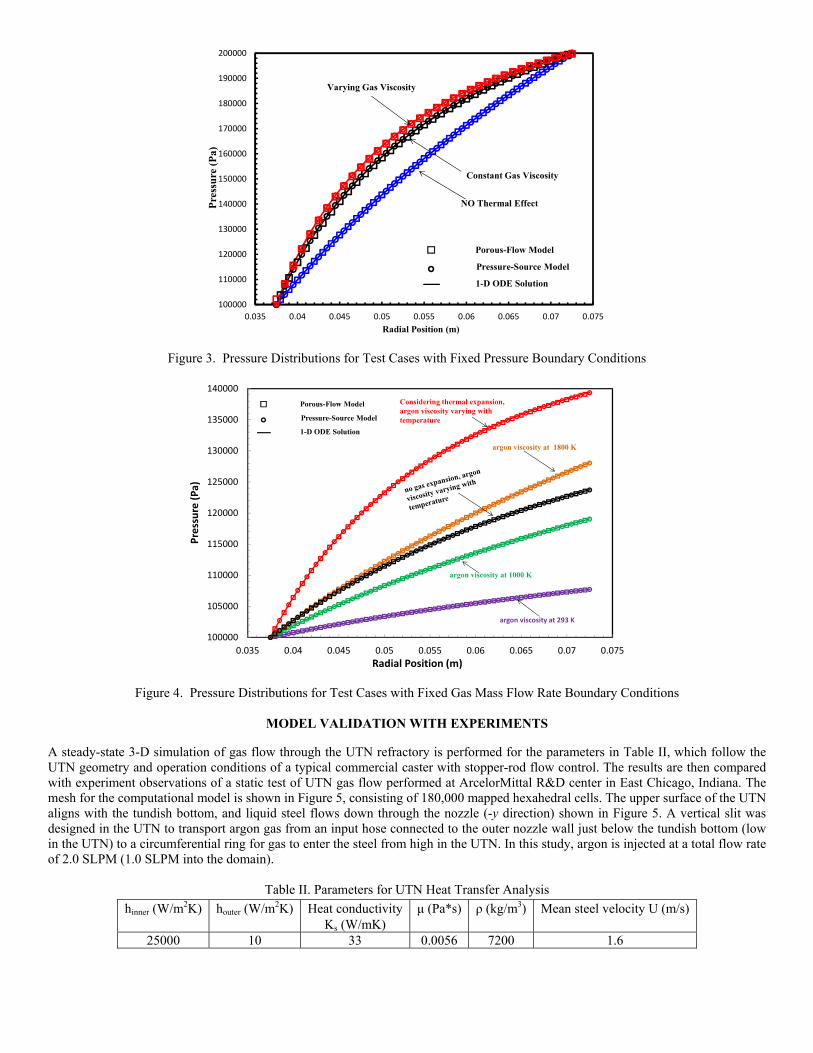
Figure 3. Pressure Distributions for Test Cases with Fixed Pressure Boundary Conditions
Figure 4. Pressure Distributions for Test Cases with Fixed Gas Mass Flow Rate Boundary Conditions
MODEL VALIDATION WITH EXPERIMENTS
A steady-state 3-D simulation of gas flow through the UTN refractory is performed for the parameters in Table II, which follow the UTN geometry and operation conditions of a typical commercial caster with stopper-rod flow control. The results are then compared with experiment observations of a static test of UTN gas flow performed at ArcelorMittal R&D center in East Chicago, Indiana. The mesh for the computational model is shown in Figure 5, consisting of 180,000 mapped hexahedral cells. The upper surface of the UTN aligns with the tundish bottom, and liquid steel flows down through the nozzle (-y direction) shown in Figure 5. A vertical slit was designed in the UTN to transport argon gas from an input hose connected to the outer nozzle wall just below the tundish bottom (low in the UTN) to a circumferential ring for gas to enter the steel from high in the UTN. In this study, argon is injected at a total flow rate of 2.0 SLPM (1.0 SLPM into the domain).
Table II. Parameters for UTN Heat Transfer Analysis
hinner (W/m2K)
houter (W/m2K) Heat conductivity Ks (W/mK)
μ (Pa*s) ρ (kg/m3) Mean steel velocity U (m/s)
25000 10 33 0.0056 7200 1.6
100000
110000
120000
130000
140000
150000
160000
170000
180000
190000
200000
0.035 0.04 0.045 0.05 0.055 0.06 0.065 0.07 0.075
Pre
ssu
re (
Pa)
Radial Position (m)
Porous-Flow Model
Pressure-Source Model
1-D ODE Solution
NO Thermal Effect
Constant Gas Viscosity
Varying Gas Viscosity
100000
105000
110000
115000
120000
125000
130000
135000
140000
0.035 0.04 0.045 0.05 0.055 0.06 0.065 0.07 0.075
Pres
sure
(Pa)
Radial Position (m)
Porous-Flow Model
Pressure-Source Model
1-D ODE Solution
Considering thermal expansion, argon viscosity varying with temperature
argon viscosity at 1800 K
argon viscosity at 1000 K
argon viscosity at 293 K

A heat transfer analysis was first performed for the UTN. The boundary conditions are as follows: convection at the inner and outer surfaces of the UTN; symmetric condition at the plane cutting the nozzle in half; and zero heat flux at nozzle bottom. Convection heat transfer coefficients were calculated from the Nu number, via the Sleicher-Rouse correlation [13] shown in equation (12). The resulting temperature distribution in the half-UTN is shown in Figure 6.
*Nu Kh
D= , 5 0.015Re Pra bNu = + (12)
where 0.24
0.884 Pr
a = −+
, and ( )10.5exp 0.6 Pr
3b = + − , with Pr
μρα
= , and ReUDρμ
=
Figure 5. Geometry and Mesh for UTN Figure 6. Tempreature Distribution in UTN
(a) Pressure Distribution (b) Argon Velocity Distribution
Figure 7. Simulated pressure and argon velocity distributions at UTN symmetry planes The previously-validated porous-flow model was then adopted to calculate pressure and gas velocity distributions through the UTN refractory walls, with results on the symmetric planes shown in Figure 7 (a) and (b). The pressure and velocity distributions both indicate asymmetric flow distribution due to the vertical slit. Figure 7(b) shows that the argon velocity generally decreases with distance away from the slits, because the surface area of all slits is small compared with the UTN inner surface area. As it gets closer
X
Y
Z
17001600150014001300120011001000900
Temperature (K)
Radial Position (m)
UTNHeight(m)
-0.1 -0.05 0 0.05 0.1 0.15
0
0.05
0.1
0.15
0.2
0.25
0.3
0.35
115000114000113000112000111000110000109000108000107000106000105000104000103000102000
Pressure (Pa)
Radial Position (m)
UTNHeight(m)
-0.1 -0.05 0 0.05 0.1 0.15
0
0.05
0.1
0.15
0.2
0.25
0.3
0.35
0.0120.0110.010.0090.0080.0070.0060.0050.0040.0030.002
Velocity Magnitude(m/s)

to the UTN inner surface, both thermal expansion of the argon gas and the curvature effect become significant enough to cause the gas velocity to increase near the UTN inner surface, where it enters the liquid stream. Figure 8(b) shows gas velocity distributions along vertical paths around the circumference of the UTN inner surface. The vertical paths defined by point A at UTN bottom and point B at UTN upper edge are plotted in Figure 8(a) for different slices around the UTN perimeter. The velocity profiles in Figure 8(b) indicate a significant impact of the vertical slit on the gas distribution around the UTN inner surface, especially in the lower part of the UTN. Slices near the vertical slit have higher gas flow, because the refractory thickness is less. Slices far away from the vertical slit have lower gas flow, decreasing to almost identical gas distributions. In this specific case, slices 5, 6 and 7 have almost the same low velocity profile. This asymmetric gas velocity distribution at UTN inner surface may affect local fluid flow in the nozzle, and create detrimental asymmetric flow in the mold.
(a) Path Locations (b) Velocity Profiles
Figure 8. Argon Velocity Profiles along Different Paths at UTN Inner Surface
A static test was performed to validate these model predictions, using the apparatus shown in Figure 9. A real UTN was cut in half, sealed at the cut surface, and placed in a water tank, with the dashed circle in Figure 10 indicating the location of the gas injection point, where the vertical slit starts. The bubbling locations are difficult to observe if the UTN stands straight, due to the blocking effect of the rising bubbles.
(a)
(b)
Figure 9. Schematic of UTN during Casting Practice (a) and in Static Bubbling Test (b)
The UTN was then tilted so the rising bubbles would not block observation of the “active sites” on the refractory inner surface where bubbles emerge. It is worth noting that the UTN in this test was cut in half perpendicular to the cut for the half-nozzle domain used in the simulation. The location of the vertical slit is indicated by red dashed lines in Figure 10(a). Because of the good wettability
0.00 0.05 0.10 0.15 0.20 0.25 0.30 0.35 0.400.000
0.001
0.002
0.003
0.004
0.005
0.006
0.007
0.008
0.009
Ave
rage
Nor
mal
Vel
ocity
at
UT
N I
nner
Sur
face
(m
/s)
Distance from UTN Bottom (m)
slice 1, 0 deg (from center plane) slice 2, 15 deg slice 3, 30 deg slice 4, 45 deg slice 5, 90 deg slice 6, 135 deg slice 7, 180 deg
from Gas Flow Meter& Pressure Gage
Gas Injection
Gas injection point
Gas Path
Stopper Rod
Steel Can
Tundish Floor Molten Steel from Tundish
Upper Tundish Nozzle (UTN)
Submerged Entry Nozzle (SEN)
Tundish Brick
Porous Refractory
from Gas Flow Meter& Pressure Gage
Gas Injection
Gas injection point
Gas Path
Steel Can
Upper TundishNozzle (UTN)
Porous Refractory
Water Tank

between UTN refractory and water and the hydraulic pressure inside the nozzle, and capillary effects, water may enter some of the pores at the UTN inner surface and block the pore exits. Thus, a threshold exists to prevent bubbles from exiting regions of low back pressure. During the experiment, back pressure was increased slowly, so the gas flow rate increased gradually from zero. The porous-flow model predicts a very non-uniform distribution of air velocity over the UTN inner surface, in Figure 10(b). Thus, it appears that local pressure at some low-velocity locations never grew large enough to overcome the threshold. It is important to note that the regions where no bubbles are observed in Figure 10(a) match well with the regions of low predicted gas velocity in Figure 10(b). Similarly, the high-velocity regions match with regions where large bubbles are observed. Thus a reasonable match was found between the simulation and observation from experiments.
(a) Measured Preferential Bubbling Locations (b) Predicted Gas Normal Velocity Distribution
Figure 10. Comparison between Predicted and Measured Gas Flow Rate at UTN Inner Surface
MODEL APPLICATIONS
The validated new models can be used to estimate gas leakage and initial mean bubble size during the continuous casting process. As discussed previously, injected argon flow rate in hot condition and initial bubble size distribution are the most crucial parameters needed in argon-steel two phase flow modeling. Considering the difficulty of measuring these two parameters, the validated porous-flow model is applied to predict them, as described in the following sections.
Gas Leakage Prediction
When argon gas is injected during continuous casting, both the volumetric flow rate of gas in the cold condition (in SLPM) and the back pressure needed to push the gas into the nozzle are measured and recorded. However, only one quantity is required to define this problem and perform simulations. In this section, the measured back pressure is preferred as an input for the boundary condition instead of measured volumetric flow rate. This is because some gas may leak away before entering the nozzle. In this case, the converted hot argon volumetric flow rate would be overestimated in the simulation. Back pressure, on the other hand, measures the true resistance needed to push the heated gas into the liquid-steel stream. Thus, back pressure is a better inlet boundary condition, provided that the specific permeability of the refractory is known. If both the (cold) flow rate and the back pressure are correctly measured, then the actual gas flow rate calculated with the new simulation procedure can be compared with the measured flow rate to find the amount of gas that has leaked. A scenario from the casting practice in ArcelorMittal Indiana Harbor 3SP, East Chicago, is investigated with the porous-flow model for stable plant conditions with a measured argon-gas injection flow rate of 20 SLPM, and back pressure reading of 19 psi (13.1 kPa) [14]. Adopting the back pressure as the inlet boundary condition, the calculation produces a total argon flow rate of 30 LPM in hot condition. Comparing the measured and calculated results, about 75% of the argon is leaked [14]. Simulations of two-phase argon-steel flow in the nozzle and mold were then performed for both cases: Case 1 with the measured 20 SLPM flow rate, (which corresponds to 120
XY
Z
0.0120.0110.010.0090.0080.0070.0060.0050.0040.0030.0020.001
Normal Velocity Magnitude(m/s)
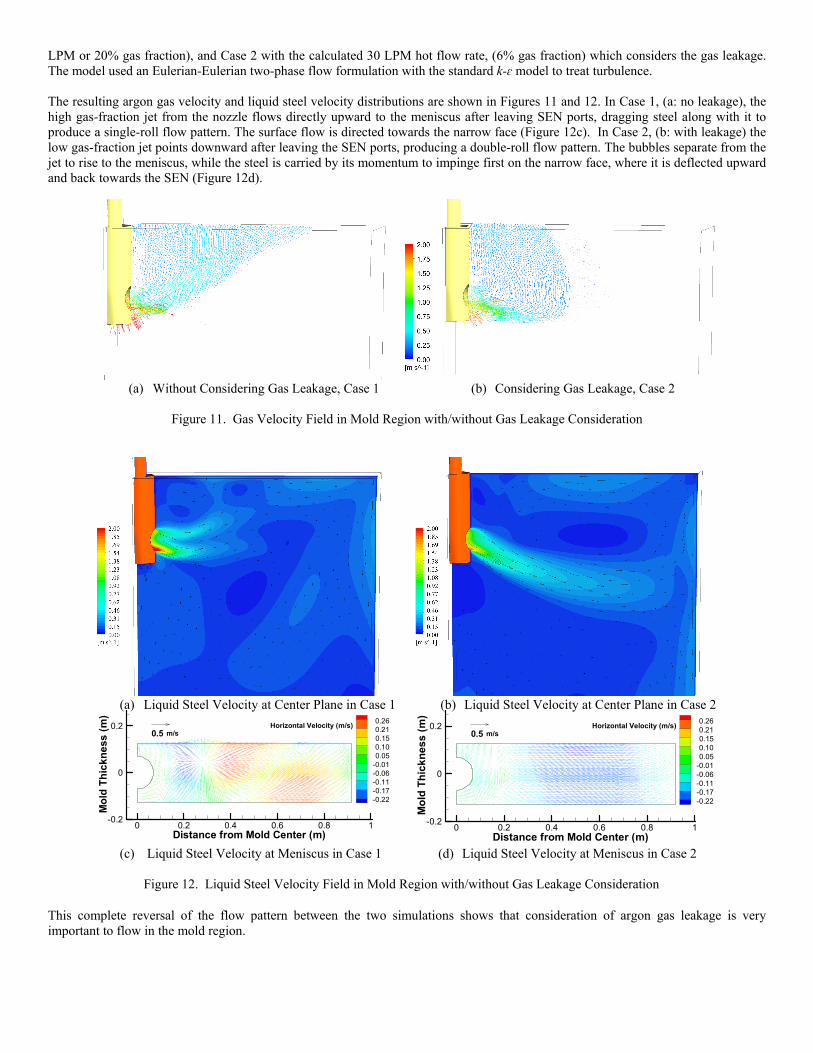
LPM or 20% gas fraction), and Case 2 with the calculated 30 LPM hot flow rate, (6% gas fraction) which considers the gas leakage. The model used an Eulerian-Eulerian two-phase flow formulation with the standard k-ɛ model to treat turbulence. The resulting argon gas velocity and liquid steel velocity distributions are shown in Figures 11 and 12. In Case 1, (a: no leakage), the high gas-fraction jet from the nozzle flows directly upward to the meniscus after leaving SEN ports, dragging steel along with it to produce a single-roll flow pattern. The surface flow is directed towards the narrow face (Figure 12c). In Case 2, (b: with leakage) the low gas-fraction jet points downward after leaving the SEN ports, producing a double-roll flow pattern. The bubbles separate from the jet to rise to the meniscus, while the steel is carried by its momentum to impinge first on the narrow face, where it is deflected upward and back towards the SEN (Figure 12d).
(a) Without Considering Gas Leakage, Case 1 (b) Considering Gas Leakage, Case 2
Figure 11. Gas Velocity Field in Mold Region with/without Gas Leakage Consideration
(a) Liquid Steel Velocity at Center Plane in Case 1 (b) Liquid Steel Velocity at Center Plane in Case 2
(c) Liquid Steel Velocity at Meniscus in Case 1 (d) Liquid Steel Velocity at Meniscus in Case 2
Figure 12. Liquid Steel Velocity Field in Mold Region with/without Gas Leakage Consideration
This complete reversal of the flow pattern between the two simulations shows that consideration of argon gas leakage is very important to flow in the mold region.
Distance from Mold Center (m)
MoldThickness(m)
0 0.2 0.4 0.6 0.8 1-0.2
0
0.20.260.210.150.100.05
-0.01-0.06-0.11-0.17-0.22
0.5Horizontal Velocity (m/s)
m/s
Distance from Mold Center (m)
MoldThickness(m)
0 0.2 0.4 0.6 0.8 1-0.2
0
0.20.260.210.150.100.05
-0.01-0.06-0.11-0.17-0.22
0.5Horizontal Velocity (m/s)
m/s

Initial Bubble Size Estimation
Another contribution from the models presented in this work is to predict initial bubble size of the gas flow entering the nozzle. The two-stage model of Bai and Thomas [7] predicts initial bubble formation from gas injected through a single hole in the nozzle wall into downward-flowing liquid, as shown in Figure 13. The first stage is gas bubble expansion, Figure 13(a), and is followed by an elongation stage, Figure 13(b), prior to detachment. Simple equations describing these stages give the mean bubble size as a function of the gas flow rate, downward liquid velocity, and physical properties [7]. The model reproduces measurements in air-water systems, but extends to argon-steel systems by changing the properties.
In the real process, gas passes through tiny inter-connected pores within the refractory wall, and enters liquid steel stream from active sites distributed over the UTN inner surface. Given the gas flow through each active site, this two-stage model can predict the initial bubble size distribution over the UTN inner surface, if the gas fraction is small enough for the two-phase flow to stay in the “bubbly flow” regime.
Figure 13. Two-Stage Model for Bubble Size Prediction [6] Figure 14. Active Site Number Density vs. Gas Flow Rate [8]
Experiments by Lee et al [9] have correlated the active site density, Nsite, (number per surface area) with local gas flow rate in an air-water system. Since refractory and water are usually wetting, their refractory sample was coated to decrease its wettability to approximate that between refractory and liquid steel. Figure 14 shows how the active site density changes with injected gas flow rate [9] with and without a strong crossflow of water over the refractory surface. For a given flow rate of injected gas, bubbles emit from almost twice as many sites with the cross-flowing water (dashed line) than with stagnant water. This active site density, Nsite, (#/cm2) is given by the following empirical correlation [9],
0.2635 0.85 0.33087g DS
site
Q U KN
θ= (13)
where Qg is the gas injection flow rate (LPM per cm2), U is the mean liquid velocity (m/s), KDS is the refractory specific permeability (nPm), and θ is the contact angle wettability (radians). The gas flow rate per unit area can be treated as the local gas velocity, which is calculated with the argon UTN flow models developed in this work, and given in Figure 10. Combining these local gas velocity results with the active site density distribution from equation (13), gives the gas flow rate through each active site. The initial bubble diameter is then obtained by numerically solving Bai’s two-stage model equations for each active site. The predicted initial bubble size resulting from this procedure is shown in Figure 15(c). This bubble size distribution appears similar to the active sites distribution, Figure 15(a), and the argon gas velocity distribution at UTN inner surface, in Figure 15(b). The largest bubbles appear around the “T” shaped slits junction, where the maximum gas velocity is located. The calculated largest bubble diameter is around 1.7 mm.

(a) Active Site Density (b) Gas Flow Rate per Site (c) Bubble Diameter
Figure 15. Estimation of Bubble Size at UTN Inner Surface
SUMMARY
This work presents a new approach to model two-phase argon-steel flow in continuous casting. Steady-state 3-D computational models were developed and validated to investigate heated gas flowing through porous refractory during gas injection. They include a pressure-source model and a porous-flow model. The following conclusions can be drawn from initial study using this new approach:
1. Model validation using both simple test cases and water-model experiments shows that both models can correctly account for the gas thermal expansion, temperature-dependent gas viscosity, and geometric effects, to accurately simulate gas flow through nozzle refractories, when the gas flow rate is relatively low, in the regime where Darcy’s law holds;
2. By using measured back pressure at the gas injection point as the inlet boundary condition, the new models can predict the argon flow rate that actually enters the liquid steel stream, and further estimate gas leakage, by comparing the simulated and measured total argon flow rates;
3. Argon gas bubble entry into the liquid steel stream from the UTN surface can be very asymmetrically-distributed around the nozzle perimeter, as revealed by both simulations and experimental observations.
4. Results from the models developed in this work can then be used to calculate nonuniform initial bubble size distributions, based on previous correlations of active site number density and a two-stage model of bubble formation into vertical downward flow;
5. These new models can also provide insights into the design of better argon gas distribution systems and nozzle geometries. 6. Results from the models developed in this work can provide better estimates of argon gas flow rates in realistic hot conditions
of commercial operations, and better, nonuniform bubble-size distributions as input conditions for argon-steel two-phase flow simulations. This new approach should enable more accurate prediction of liquid steel flow patterns in the mold region.
ACKNOWLEDGMENTS
The authors would like to thank ArcelorMittal Global R&D and other members of the Continuous Casting Consortium at the University of Illinois at Urbana-Champaign for support of this research. We also want to show our gratitude to Joydeep Sengupta at ArcelorMittal Dofasco and Bruce Forman and Hongbin Yin at ArcelorMittal Global R&D center at East Chicago for their help with the static water-model experiments.
REFERENCES
1. B.G. Thomas, “Chapter 5. Modeling of Continuous Casting”, The AISE Steel Foundation, Pittsburgh, PA, 2003, pp. 1-24.
X
Y
Z
7.56.55.54.53.52.51.50.5
Active Site Density(#/cm^2)
X
Y
Z
0.060.0550.050.0450.040.0350.030.0250.020.0150.010.005
Flow Rate per Active Site(LPM)

2. B.G. Thomas, X. Huang, and R.C. Sussman, "Simulation of Argon Gas Flow Effects in a Continuous Slab Caster", Metallurgical Transactions B, Vol. 25B, No. 4, 1994, pp. 527-547.
3. X. Huang and B.G. Thomas, “Modeling of Transient Flow Phenomena in Continuous Casting of Steel”, Canadian Metallurgical Quarterly, Vol. 37, No. 304, 1998, pp. 197-212.
4. T. Shi and B.G. Thomas, “Effect of Gas Bubble Size on Fluid Flow in Continuous Casting Mold”, Continuous Casting Consortium at University of Illinois at Urbana-Champaign, Report, 2001.
5. H. Yu and M. Zhu, “Numerical Simulation of the Effects of Electromagnetic Brake and Argon Gas Injection on the Three-dimensional Multiphase Flow and Heat Transfer in Slab Continuous Casting Mold”, ISIJ International, Vol. 48 (2008), No. 5, pp. 584–591.
6. R. Clift, J.R. Grace, and M.E. Weber, “Bubbles, Drops and Particles”, Academics Press, Inc., New York, NY, 1978. 7. H. Bai and B.G. Thomas, “Bubble Formation during Horizontal Gas Injection into Downward Flowing Liquid”, Metallurgical
and Materials Transactions B, Vol. 32B, No. 6, 2001, pp. 1143-1159. 8. V. Singh, S.K. Dash, J.S. Sunitha et.al, “Experimental Simulation and Mathematical Modeling of Air Bubble Movement in Slab
Caster Mold”, ISIJ International, Vol. 46, 2006, No. 2, pp. 210-218. 9. G. Lee, B.G. Thomas and S. Kim, “Effect of Refractory Properties on Initial Bubble Formation in Continuous-casting Nozzles”,
Metal and Materials International, Vol. 16(3), 2010, pp. 501-506. 10. G.M. DÄRR, U. Ludwig, “Determination of permeable porosity”, MATÉRIAUX ET CONSTRUCTIONS, Vol. 6, No. 33, 1973, pp.
185-190. 11. R. Dawe and E. Smith, “Viscosity of Argon at High Temperatures”, Science, Vol. 163, 1969, pp. 675-676. 12. FLUENT ANSYS Inc. 2007 FLUENT 6.3-Manual (Lebanon, NH). 13. C.A. Sleicher and M.W. Rouse, “A Convenient Correlation for Heat Transfer to Constant and Variable Property Fluids in
Turbulent Pipe Flow”, International Journal of Heat and Mass Transfer, Vol.18, 1975, pp. 677-683. 14. R. Liu, B.G. Thomas, B. Forman and H. Yin, “Transient Turbulent Flow Simulation with Water Model Validation and
Application to Slide Gate Dithering”, AISTech Conf. Proc., Atlanta, GA, May 7-10, 2012.