model of performance of a regenerative hydrogen chlorine
TRANSCRIPT
Model of Performance of a Regenerative Hydrogen Chlorine Fuel Cell forGrid-Scale Electrical Energy Storage
Jason Rugolo, Brian Huskinson, Michael J. Aziz †
Harvard School of Engineering and Applied Sciences, Cambridge, MA 02138, USA
†Corresponding Author. [email protected]. phone: +1 (617) 495-9884. fax: +1 (617)495-9837.
We develop a model for a regenerative hydrogen-chlorine fuel cell (rHCFC)including four voltage loss mechanisms: hydrogen electrode activation,chlorine electrode activation, chlorine electrode mass transport, and ohmicloss through the membrane. The dependences of each of these losses asa function of two “operating parameters”, acid concentration and temper-ature; and five “engineering parameters”, exchange current densities atboth electrodes, membrane thickness, acid diffusion layer thickness, andcell pressure, are explored. By examining this large parameter space, wepredict the design target and ultimate limitations to the performance char-acteristics of this cell. We identify chlorine electrode activation as thedominant contribution to the loss for low current density, high-efficiencyoperation and membrane resistance as the dominant contribution to theloss at maximum galvanic power density. We conclude that, with furtherresearch, a more optimal cell could be developed that operates at greaterthan 90% voltage efficiency at current densities >1 A
cm2 in both electrolyticand galvanic modes.
Introduction
Inexpensive and efficient electricity storage devices are in growing demand to solve prob-lems associated with managing the modern electrical grid (1). Of particular interest arehigh energy capacity devices suited for balancing the intermittent nature of wind and solarphotovoltaic power production. With most energy storage systems, such as conventionalbattery technologies, both the power and energy components of the system scale together.
1

If an application requires either more power or more energy, one must buy both morepower and more energy. For this reason, it is exceedingly difficult for these types of sys-tems to scale to grid-level storage. In contrast, flow batteries and regenerative fuel cellsmaintain a modular separation between the power elements of the system (the cell stack)and the energy elements of the system (the reactant and product storage tanks). This per-mits independent scaling of the two.
An essential characteristic of any electricity storage technology is its round-trip effi-ciency. Energy is lost both during charging and discharging, making the cell efficiencyparticularly important, because the efficiency is approximately squared for the round-trip.The benefit of developing a regenerative hydrogen-chlorine fuel cell (as opposed to a re-generative fuel cell of another type, e.g. hydrogen-oxygen) lies in the relatively fast kinet-ics at the chlorine electrode. Fundamentally, this occurs because the chloride oxidationreaction is a one-electron process. Fast kinetics allow for very high round-trip efficiencies,and electrode kinetics arguably present the largest technological barrier to the implemen-tation of any specific fuel cell chemistry.
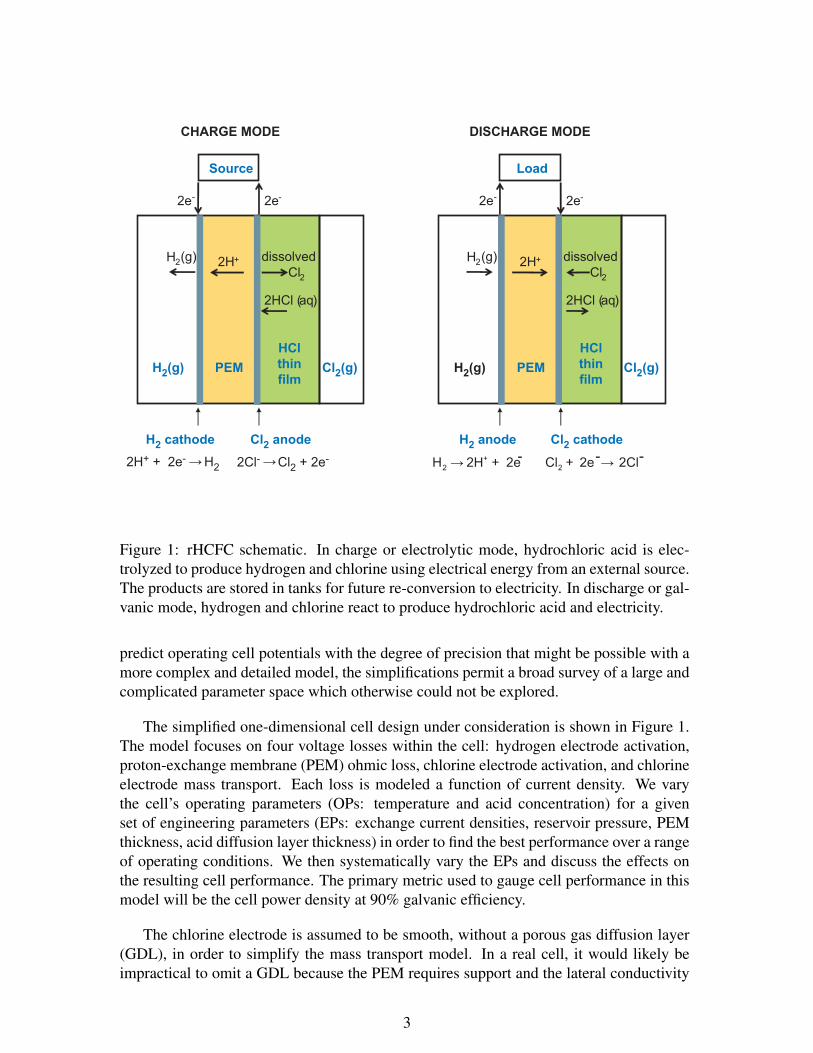
The regenerative hydrogen-chlorine fuel cell (rHCFC) is an electrical energy storagedevice that facilitates the electrochemical reaction H2(g)+Cl2(g) 2HCl(aq). In dis-charge (galvanic) mode, H2 and Cl2 react to produce electricity and HCl(aq). In charge(electrolytic) mode, electricity is consumed to split HCl(aq) into H2 and Cl2, which isthen stored in tanks until the electricity is needed (Figure 1). Compared to most flowbatteries, the energy density of the rHCFC can be higher, and the reactants involved areabundant and inexpensive. Also, it is important to note that there is no solid electrode orstorage medium involved in a change of state, which can lead to dimensional instability(e.g. dendrite growth) and rapid cycle fatigue.
Much of the early research on rHCFCs focused on high-power applications of thesecells, often when cost was not of paramount importance. They were studied for use in theMX missile defense program in the early 1980s (2), and rHCFC studies for space powerapplications were also of interest to NASA (3). In both cases, the high cell potential andcorresponding high energy density of the rHCFC were the important cell characteristicsmotivating this research. During the energy crises of the 1970s, rHCFC storage systemswere also studied for general electricity storage applications such as utility-scale grid stor-age and solar balancing (4-6). In the latter reference, power densities in excess of 300mWcm2 were achieved. The studies provided proof of concept and were promising, but, asenergy costs stabilized in the 1980s, interest in energy technologies declined in general,and rHCFC studies, mostly carried out in industry, were discontinued.
Because fuel cell materials and systems have undergone vast improvements in the in-tervening years, rHCFCs have potential today as viable grid-scale electrical energy storagesystems. Indeed, more recent experimental studies have led to improved cell performance,with power densities now beyond 500 mW
cm2 (7). This paper presents a simplified rHCFCmodel that is intended to provide insight into the relative magnitudes of the cell lossesand therefore to guide rHCFC research and development. To our knowledge, there is noextant model in the literature that explores such a large parameter space, particularly inthe context of high efficiency operation. Different approaches to modeling this or relatedtypes of systems can be found in the literature (4,8,9). Although we do not attempt to
2
H2 anode Cl2 cathode
PEM
2H+H (g)2 dissolvedCl2
2e- 2e-
2HCl (aq)
Load
+2H 2H 2e-→ + 2Cl 2e 2Cl- -+ →
DISCHARGE MODE
H2(g)HClthinfilm
Cl2(g)H2(g)
H2 cathode
HClthinfilm
Cl2 anode
PEM
CHARGE MODE
2H+H2 dissolvedCl2
2e
(g)
Cl2(g)
- 2e-
2HCl (aq)
Source
2H+ + 2e- H2 2Cl- Cl2 + 2e-→ →
Figure 1: rHCFC schematic. In charge or electrolytic mode, hydrochloric acid is elec-trolyzed to produce hydrogen and chlorine using electrical energy from an external source.The products are stored in tanks for future re-conversion to electricity. In discharge or gal-vanic mode, hydrogen and chlorine react to produce hydrochloric acid and electricity.
predict operating cell potentials with the degree of precision that might be possible with amore complex and detailed model, the simplifications permit a broad survey of a large andcomplicated parameter space which otherwise could not be explored.
The simplified one-dimensional cell design under consideration is shown in Figure 1.The model focuses on four voltage losses within the cell: hydrogen electrode activation,proton-exchange membrane (PEM) ohmic loss, chlorine electrode activation, and chlorineelectrode mass transport. Each loss is modeled a function of current density. We varythe cell’s operating parameters (OPs: temperature and acid concentration) for a givenset of engineering parameters (EPs: exchange current densities, reservoir pressure, PEMthickness, acid diffusion layer thickness) in order to find the best performance over a rangeof operating conditions. We then systematically vary the EPs and discuss the effects onthe resulting cell performance. The primary metric used to gauge cell performance in thismodel will be the cell power density at 90% galvanic efficiency.
The chlorine electrode is assumed to be smooth, without a porous gas diffusion layer(GDL), in order to simplify the mass transport model. In a real cell, it would likely beimpractical to omit a GDL because the PEM requires support and the lateral conductivity
3

of a fuel cell electrode is typically unacceptably low. Furthermore, a GDL is responsiblefor evenly transporting reactants from the flow channels to the catalyst layers. In principle,it is possible to achieve support by constantly maintaining a chlorine overpressure and toachieve lateral conductivity by embedding small cross-section conductors in the electrode,but these methods are unlikely to be implemented due to unnecessary complication andcost. In this model, we intend the mass transport modeling to represent a statistically-averaged behavior, understanding that the local real loss behavior on a complicated three-dimensional, porous electrode could lie to one side or the other of the mean mass transportloss computed here. We expect the conclusion of the model – that losses due to masstransport limitations are insignificant compared to other losses when the cell is operatedat low current density for high efficiency – to be unchanged by future work involvingthree-dimensional mass transport.
The model was used to evaluate cell potentials in both charge mode and dischargemode. For the majority of results presented in this paper, we omit the electrolytic, charge-mode behavior. Typically, a cell that shows good performance in discharge mode alsoshows good performance in charge mode (particularly within the confined concentrationrange used in this model), allowing us to simplify the presentation of the model results.
4
Symbols
aCl2 activity of chlorine gasaH2 activity of hydrogen gasaHCl(aq) activity of hydrochloric acidCa capillary numberCbulk
O bulk concentration of oxidized form (Cl2), molcm3
CSO concentration of oxidized form (Cl2) near the electrode sur-
face, molcm3
CbulkR bulk concentration of reduced form (Cl−), mol
cm3
CSR concentration of reduced form (Cl−) near the electrode sur-
face, molcm3
Csat saturated concentration of Cl2 in HCl(aq), molcm3
D diffusion coefficient, cm2
sDCl− diffusion coefficient of Cl− in HCl(aq), cm2
sDCl2 diffusion coefficient of Cl2 in HCl(aq), cm2
sE cell potential, VE ′0 standard cell potential, VEeq equilibrium potential, Vf simplifying parameter in Nernst equation, V−1
H Henry’s law coefficient, gL·atm
h1 aHCl(aq) fit, 0.33866-0.001283Ti cell current density, mA
cm2
iCl0 chlorine exchange current density, mA
cm2
iH0 hydrogen exchange current density, mAcm2
iL cell limiting current density, mAcm2
J diffusive flux of species, molcm2·s
l proton-exchange membrane thickness, cmm molality, mol
kgM molarity, mol
Lp cell power density, mW
cm2
pCl2 chlorine gas partial pressure, atmpH2 hydrogen gas partial pressure, atmT temperature, degrees CelsiusVb bubble velocity, m
sw capillary channel width, cm
Greek lettersα transfer coefficientα′ parameter in Henry’s law coefficient fit, grams-chlorine per
liter/grams-HCl per liter · atmβ parameter in Henry’s law coefficient fit, grams-chlorine per
liter/atmγm activity coefficient of HCl(aq)ε HCl(aq) thin film thickness, cmη cell efficiencyηCl total chlorine electrode activation overpotential (including
mass transport effects), Vη′Cl concentration-independent chlorine electrode activation over-
potential, VηH hydrogen electrode activation overpotential, VηMT chlorine electrode mass transport overpotential, VηR resistive overpotential, Vµ viscosity, mPa · sρH2O density of water, kg
m3
ρHCl density of hydrochloric acid, kgm3
σsurf surface tension, mNm
σ conductivity, Ω−1cm−1
Constants
5
Aρ ρHCl fit, 20.46Aφ aHCl(aq) fit, 0.39205mol−1/2
kg−1/2
a1 membrane conductivity fit, -0.0178a2 membrane conductivity fit, 0.000389Bρ ρHCl fit, -0.09435
B aHCl(aq) fit, 1.4 molkg−1/2
b1 membrane conductivity fit, 0.891b2 membrane conductivity fit, 0.00398b2,γ aHCl(aq) fit, 0.006b3,γ aHCl(aq) fit, -9.7 x 10⁻⁵
Cρ ρHCl fit, 0.00109c1 membrane conductivity fit, 2.58c2 membrane conductivity fit, 2.55Dρ ρHCl fit, -1.227d1 membrane conductivity fit, 4.20d2 membrane conductivity fit, 2.23Eρ ρHCl fit, 0.01269F Faraday’s constant, 96485 C
molFρ ρHCl fit, -0.000198kB Boltzmann’s constant, 8.617 x 10⁻⁵ eV
KMCl2 molecular weight of Cl2, 70.9 g
molMH2O molecular weight of H2O, 0.0180 kg
molMHCl molecular weight of HCl, 36.461 g
molm0 reference molality, 1 mol
kgp0 standard pressure, 1 atmR ideal gas constant, 8.314 J
mol·K
The Model
The purpose of this model is to determine the cell potential, in volts, as a function ofcurrent density, in mA
cm2 , for a given set of OPs and EPs. In this study, we consider the EPsand OPs as well as the dependent physical properties that determine cell losses, such asPEM conductivity and chlorine solubility and diffusivity in HCl(aq). Our objectives areto predict cell efficiency and cell power density p as functions of current density and todetermine how these functions change as we vary both the OPs and the EPs.
The operating efficiency of the cell is a piecewise function of current density i, withone expression for the galvanic direction and a different one for the electrolytic direction.In the galvanic case (which we take as defining positive i), hydrogen and chlorine react toproduce hydrochloric acid and electricity. The efficiency is the electrical energy per chargeproduced (the cell potential E(i)), divided by the electrical energy per charge that couldbe produced reversibly (the equilibrium potential Eeq). In the electrolytic case (negativei), electrical energy is supplied to split HCl(aq) into H2 and Cl2 for energy storage. Here,the efficiency is the maximum possible electrical energy per charge stored, Eeq, divided by
6
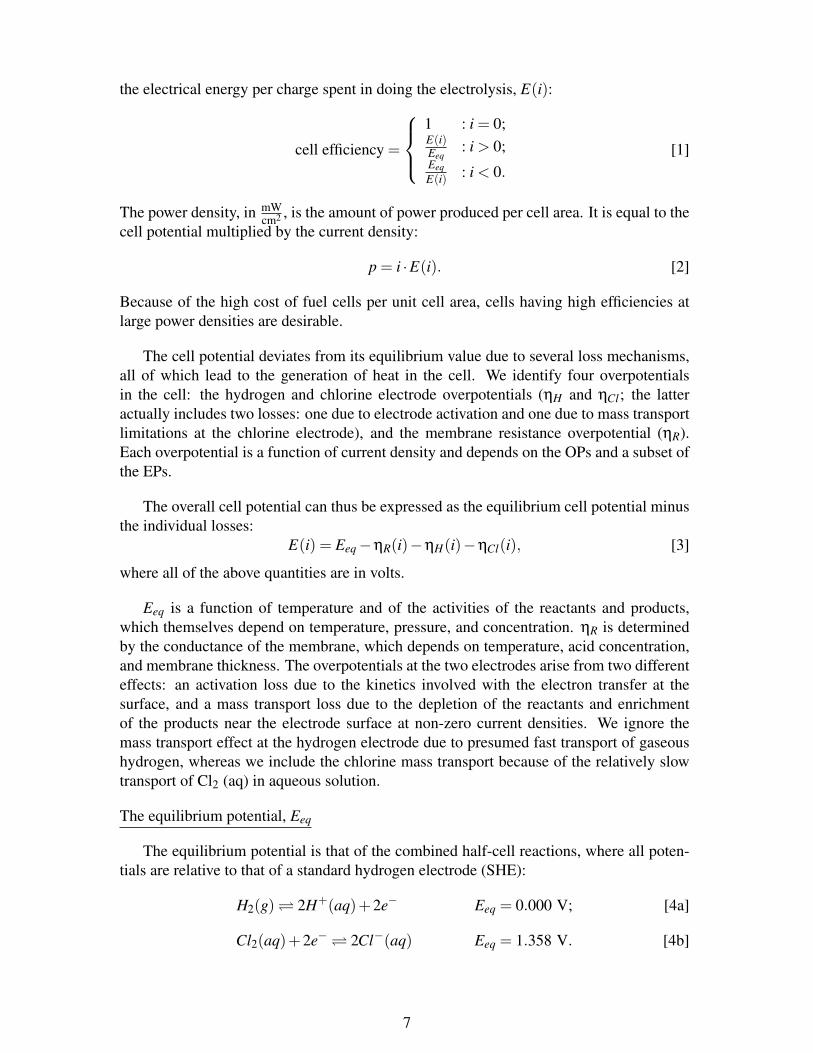
the electrical energy per charge spent in doing the electrolysis, E(i):
cell efficiency =
1 : i = 0;E(i)Eeq
: i > 0;EeqE(i) : i < 0.
[1]
The power density, in mWcm2 , is the amount of power produced per cell area. It is equal to the
cell potential multiplied by the current density:
p = i ·E(i). [2]
Because of the high cost of fuel cells per unit cell area, cells having high efficiencies atlarge power densities are desirable.
The cell potential deviates from its equilibrium value due to several loss mechanisms,all of which lead to the generation of heat in the cell. We identify four overpotentialsin the cell: the hydrogen and chlorine electrode overpotentials (ηH and ηCl; the latteractually includes two losses: one due to electrode activation and one due to mass transportlimitations at the chlorine electrode), and the membrane resistance overpotential (ηR).Each overpotential is a function of current density and depends on the OPs and a subset ofthe EPs.
The overall cell potential can thus be expressed as the equilibrium cell potential minusthe individual losses:
E(i) = Eeq−ηR(i)−ηH(i)−ηCl(i), [3]
where all of the above quantities are in volts.
Eeq is a function of temperature and of the activities of the reactants and products,which themselves depend on temperature, pressure, and concentration. ηR is determinedby the conductance of the membrane, which depends on temperature, acid concentration,and membrane thickness. The overpotentials at the two electrodes arise from two differenteffects: an activation loss due to the kinetics involved with the electron transfer at thesurface, and a mass transport loss due to the depletion of the reactants and enrichmentof the products near the electrode surface at non-zero current densities. We ignore themass transport effect at the hydrogen electrode due to presumed fast transport of gaseoushydrogen, whereas we include the chlorine mass transport because of the relatively slowtransport of Cl2 (aq) in aqueous solution.
The equilibrium potential, Eeq
The equilibrium potential is that of the combined half-cell reactions, where all poten-tials are relative to that of a standard hydrogen electrode (SHE):
H2(g) 2H+(aq)+2e− Eeq = 0.000 V; [4a]
Cl2(aq)+2e− 2Cl−(aq) Eeq = 1.358 V. [4b]
7
The equilibrium potential can be described by the Nernst equation:
Eeq = E′0 +
12 f
ln
(aCl2aH2
a2HCl(aq)
), [5]
where f = F/(R(T + 273.15)) [V-1], R = 8.314 Jmol·K is the universal gas constant, F =
96485 Cmol is Faraday’s constant, and T is the temperature in degrees Celsius. The activities
of Cl2 and H2 are denoted aCl2 and aH2 , respectively.
E′0 is the temperature-dependent equilibrium potential when all activities are unity. E
′0
must be chosen so that Eeq = 1.358 V at the standard temperature, pressure, and concen-tration of 25 C, 1 atm, and 1 M, respectively (10). Assuming the difference betweenreactant and product entropies is independent of temperature, E
′0 is a linear function of
temperature, whose slope is given by the entropy of formation divided by 2 f :
E′0 = 1.7364−0.00126(T +273.15). [6]
aHCl(aq) is the mean ionic activity of aqueous hydrochloric acid, which depends on T andthe concentrations of the ionic species. For dilute or ideal solutions, the activity is directlyproportional to the concentration according to Henry’s law. For non-ideal concentratedsolutions, however, the activity coefficient can vary significantly, and the activity deviatesfrom Henry’s law behavior. In the model, we define the activity in the following way:
aHCl(aq) = γmmm0
, [7]
where γm is the unitless activity coefficient, which depends on temperature and concentra-tion, m is the molality in mol
kg solvent , and m0 is the reference molality of 1 molkg . Partanen et
al. have studied in depth the concentration and temperature dependence of the activity ofhydrochloric acid (11). They present an “extended” Huckel equation that approximates theactivity to a precision corresponding to 3 mV in the equilibrium potential over the molalityrange of 0 to 16 mol
kg , and a temperature range of 0 to 50 C. γm is presented as a functionof the solution molality, m, and temperature, T in Celsius (Eq. 12 in ref. 11):
lnγm =−3Aφ
√m
1+B√
m+h1
(mm0
)+b2,γ
(mm0
)2
+b3,γ
(mm0
)7/2
− ln(1+2MH2Om) , [8]
where MH2O = 0.0180 kgmol is the molecular weight of water, Aφ = 0.39205 (mol ·kg-1)-1/2,
B = 1.4(mol ·kg-1)-1/2, h1 = 0.33866−0.001283T , b2,γ = 0.006, and b3,γ =−9.7×10⁻⁵,where the latter three are unitless.
To convert molality to molarity, M[mol solute
L solution
], we use the following expression:
m =1000M
ρHCl(aq)−MHClM[9]
where MHCl = 36.461 gmol is the molecular weight of HCl, and ρHCl(aq)
[kgm3
]is the density
of the acid solution. The density itself is a function of temperature and concentration, and
8

has been presented in empirical form by Novotny and Sohnel (12):
ρHCl(aq) = ρH2O +AρM+BρMT +CρMT 2 +DρM3/2 +EρM3/2T +FρM3/2T 2, [10]
where the temperature-dependent density of water, ρH2O
[kgm3
], is given by the empirical
expression:ρH2O = 999.65+0.20438T −0.06174T 3/2. [11]
The parameters are as follows: Aρ = 20.46, Bρ =−0.09435, Cρ = 0.00109, Dρ =−1.227,Eρ = 0.01269, and Fρ = −0.000198, each having units necessary to give their respectiveterms density units of kg
m3 . Substituting Equations 8, 9, and 10 into Equation 7 yields aprecise temperature- and molarity-dependent hydrochloric acid activity.
We treat both H2 and Cl2 as ideal gases, resulting in a combined error in Eeq of lessthan 1 mV, whose activities are given by:
aH2 =pH2
p0, [12]
andaCl2 =
pCl2p0
, [13]
where p0 is the standard pressure of 1 atm.
Figure 2 shows Eeq as a function of temperature for several different activity cases.The curve labeled “Standard” refers to the case with the chlorine and hydrogen pressuresset to 1 atm and the HCl(aq) concentration set to 1 M. At 25 Con the standard curve, thestandard chlorine reversible potential of 1.358 V is observed. The envelope bounded bythe high and low curves is the space of equilibrium potentials explored in this study. Givendue consideration to the range of applicability of each component of the model, we willonly study the temperature range 5-75 C, the molarity range 0.5-6 M, and the pressurerange 1-5 atm. The curve labeled “High” is the case in which aCl2 and aH2 are theirhighest (pCl2 = pH2 = 5 atm), and aHCl(aq) is its lowest (at a molarity of 0.5 M), yieldingthe highest equilibrium potentials as a function of temperature explored with this model.The curve labeled “Low” is the opposite extreme case, in which the gas activities are theirlowest (1 atm), and the acid activity the highest (6 M), such that the lowest potentials areobserved.
The membrane resistance overpotential, ηR
The resistive overpotential due to ohmic drop across the membrane takes the followingform:
ηR =lσ
i1000
, [14]
where l [cm] is the membrane thickness, σ[ 1
Ω·cm
]is the membrane conductivity, i
[mAcm2
]is
the current density, and ηR is the resistive overpotential in volts (the factor of 1000 assuresconsistency in units). Commercial DuPont Nafion membranes are typically available inthicknesses ranging from 25 to 250 µm. From a voltage loss perspective, it always helps to
9
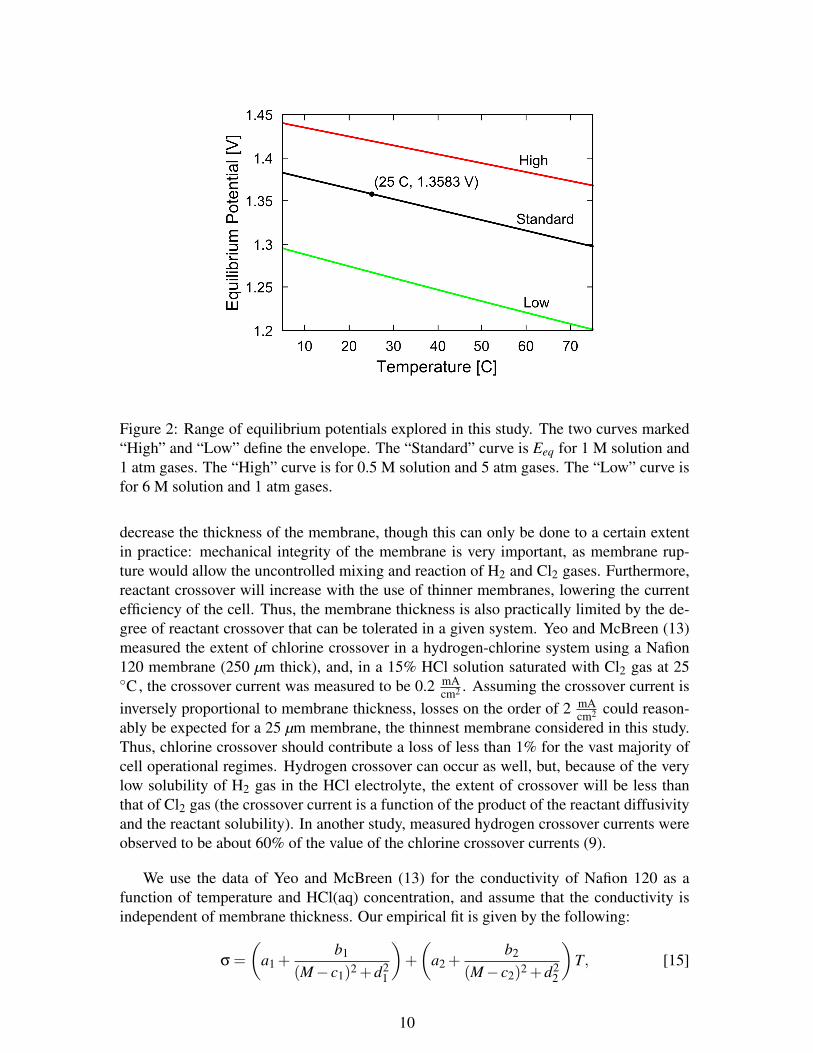
Figure 2: Range of equilibrium potentials explored in this study. The two curves marked“High” and “Low” define the envelope. The “Standard” curve is Eeq for 1 M solution and1 atm gases. The “High” curve is for 0.5 M solution and 5 atm gases. The “Low” curve isfor 6 M solution and 1 atm gases.
decrease the thickness of the membrane, though this can only be done to a certain extentin practice: mechanical integrity of the membrane is very important, as membrane rup-ture would allow the uncontrolled mixing and reaction of H2 and Cl2 gases. Furthermore,reactant crossover will increase with the use of thinner membranes, lowering the currentefficiency of the cell. Thus, the membrane thickness is also practically limited by the de-gree of reactant crossover that can be tolerated in a given system. Yeo and McBreen (13)measured the extent of chlorine crossover in a hydrogen-chlorine system using a Nafion120 membrane (250 µm thick), and, in a 15% HCl solution saturated with Cl2 gas at 25C, the crossover current was measured to be 0.2 mA
cm2 . Assuming the crossover current isinversely proportional to membrane thickness, losses on the order of 2 mA
cm2 could reason-ably be expected for a 25 µm membrane, the thinnest membrane considered in this study.Thus, chlorine crossover should contribute a loss of less than 1% for the vast majority ofcell operational regimes. Hydrogen crossover can occur as well, but, because of the verylow solubility of H2 gas in the HCl electrolyte, the extent of crossover will be less thanthat of Cl2 gas (the crossover current is a function of the product of the reactant diffusivityand the reactant solubility). In another study, measured hydrogen crossover currents wereobserved to be about 60% of the value of the chlorine crossover currents (9).
We use the data of Yeo and McBreen (13) for the conductivity of Nafion 120 as afunction of temperature and HCl(aq) concentration, and assume that the conductivity isindependent of membrane thickness. Our empirical fit is given by the following:
σ =
(a1 +
b1
(M− c1)2 +d21
)+
(a2 +
b2
(M− c2)2 +d22
)T, [15]
10
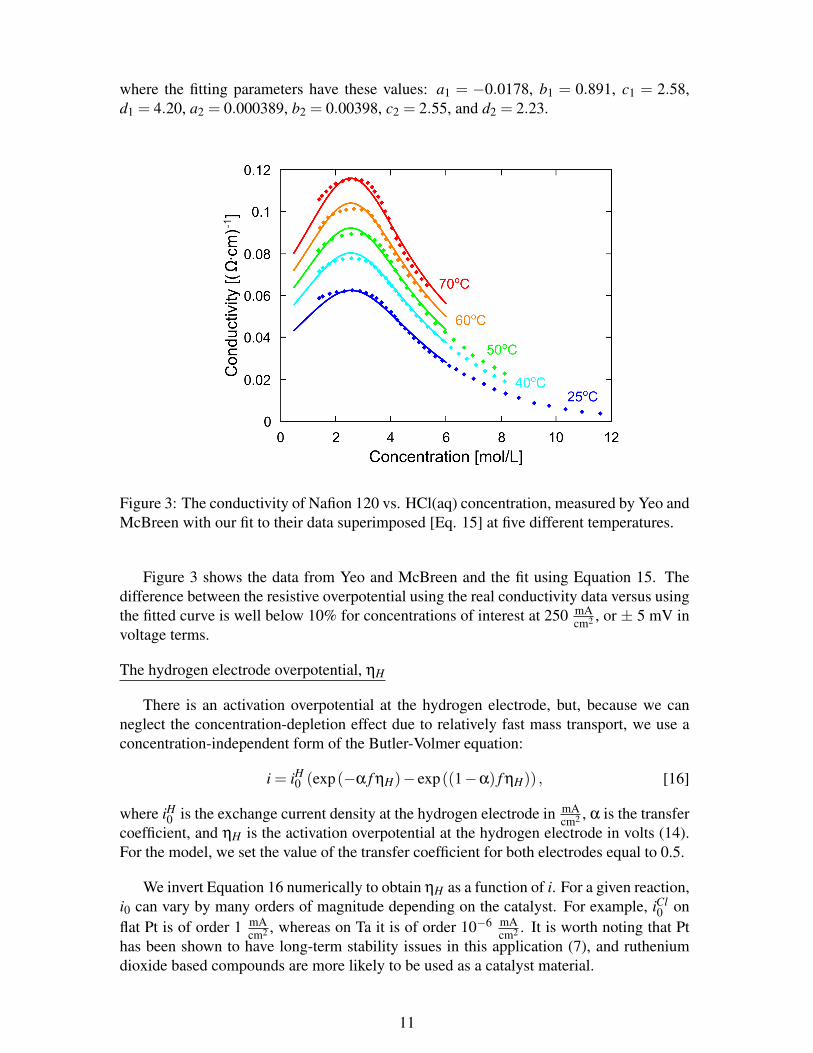
where the fitting parameters have these values: a1 = −0.0178, b1 = 0.891, c1 = 2.58,d1 = 4.20, a2 = 0.000389, b2 = 0.00398, c2 = 2.55, and d2 = 2.23.
Figure 3: The conductivity of Nafion 120 vs. HCl(aq) concentration, measured by Yeo andMcBreen with our fit to their data superimposed [Eq. 15] at five different temperatures.
Figure 3 shows the data from Yeo and McBreen and the fit using Equation 15. Thedifference between the resistive overpotential using the real conductivity data versus usingthe fitted curve is well below 10% for concentrations of interest at 250 mA
cm2 , or ± 5 mV involtage terms.
The hydrogen electrode overpotential, ηH
There is an activation overpotential at the hydrogen electrode, but, because we canneglect the concentration-depletion effect due to relatively fast mass transport, we use aconcentration-independent form of the Butler-Volmer equation:
i = iH0 (exp(−α f ηH)− exp((1−α) f ηH)) , [16]
where iH0 is the exchange current density at the hydrogen electrode in mAcm2 , α is the transfer
coefficient, and ηH is the activation overpotential at the hydrogen electrode in volts (14).For the model, we set the value of the transfer coefficient for both electrodes equal to 0.5.
We invert Equation 16 numerically to obtain ηH as a function of i. For a given reaction,i0 can vary by many orders of magnitude depending on the catalyst. For example, iCl
0 onflat Pt is of order 1 mA
cm2 , whereas on Ta it is of order 10−6 mAcm2 . It is worth noting that Pt
has been shown to have long-term stability issues in this application (7), and rutheniumdioxide based compounds are more likely to be used as a catalyst material.
11
One complicating factor is that the real surface area of the electrode is typically dif-ferent, and sometimes vastly different, than the projected surface area of the electrode.In a PEM fuel cell, electrodes are usually made up of finely dispersed catalyst particles,which have a collective surface area much larger than the geometric area of the electrode.Technically, i0 may also depend on temperature, but we ignore this dependence becausethe uncertainty in the catalytic activity and because the area multiplier is much more sig-nificant.
The exchange current density of real hydrogen electrodes has been studied in detail inthe context of hydrogen-oxygen PEM fuel cells. Neyerlin et al. report that for a structuredfuel cell electrode, the increase in the effective hydrogen exchange current density overthat of a single crystal surface can be as large as a factor of 500 (15). They measured iH0values in the range 250-600 mA
cm2 . For the base case in this study, we set iH0 equal to 250mAcm2 .
The chlorine electrode overpotential, ηCl
In galvanic mode, the consumption of Cl2 and production of Cl- result in a depletion ofCl2 near the electrode and an enrichment of Cl-. The opposite occurs in electrolytic mode.For a given current density, the transport behavior of the system stabilizes at a steady-stateconcentration of reactant and product, so long as there exists a boundary somewhere in thesystem with a stable concentration and enough time is allowed to reach this steady state. Inthis case, we can express the concentrations of Cl2 and Cl- near the electrode as a functionof current density.
The full, concentration-dependent Butler-Volmer equation describes the total chlorineelectrode overpotential:
iiCl0
=Cs
O(i)Cbulk
Oexp(−α f ηCl)−
CsR(i)
CbulkR
exp((1−α) f ηCl) , [17]
where CbulkO and Cbulk
R are the bulk concentrations of the oxidized and reduced forms, re-spectively, and Cs
O(i) and CsR(i) are their respective concentrations near the electrode sur-
face, all in molcm3 . The oxidized form is Cl2 and the reduced form is Cl-.
Measurements in our laboratory indicate that iCl0 on a flat platinum surface is about
half that of hydrogen on the same surface. We are aware of no extensive study examiningchlorine exchange current densities in real, structured chlorine fuel cell electrodes. Mea-surements from Thomassen et al. indicate a value for iCl
0 on smooth RuO2 of 0.01 mAcm2
(16). For a structured, high surface-area electrode, we expect a surface area enhancementfactor (defined as the real electrode surface area over the projected electrode surface area)of about 1000 is reasonably attainable. Consequently, we assume a value of 10 mA
cm2 for thechlorine exchange current density in the “Base Case”, and later we vary this value from 1to 1000 mA
cm2 . We expect this range to include values that will be observed in engineered(i.e. high surface area) fuel cell electrodes.
We are interested in separating the losses that arise from mass transport and thosethat arise from activation of the surface reaction. In order to do this, we define the mass
12
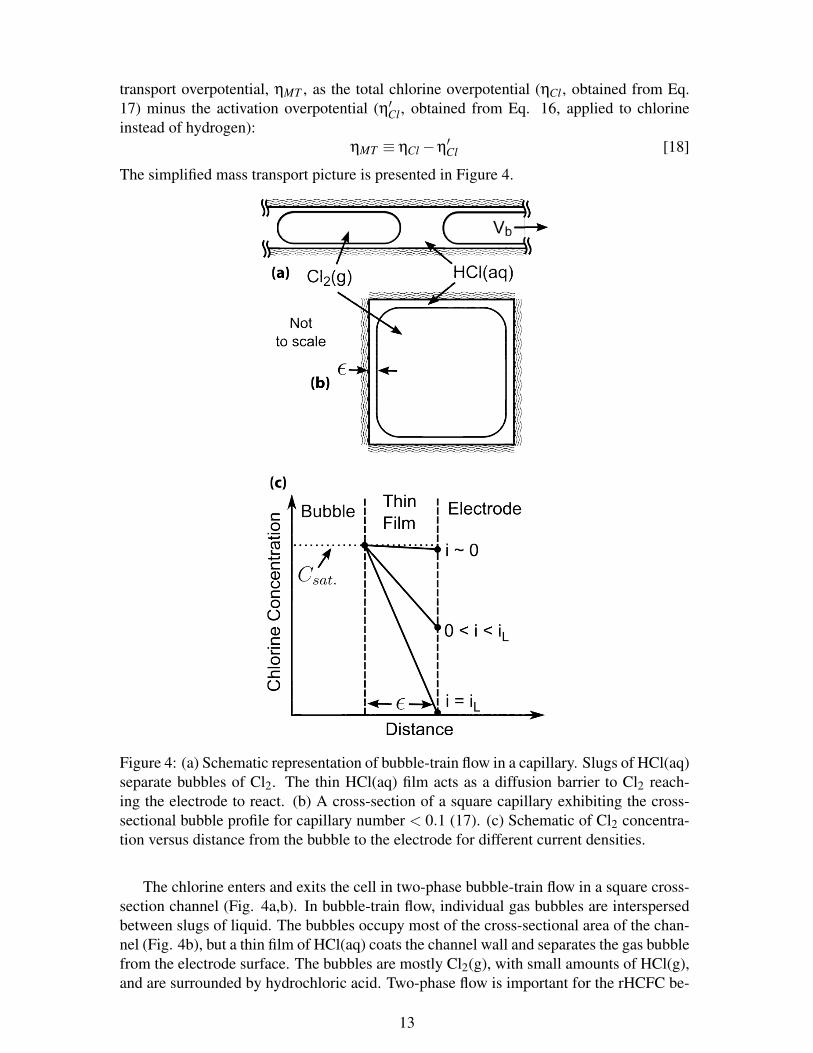
transport overpotential, ηMT , as the total chlorine overpotential (ηCl , obtained from Eq.17) minus the activation overpotential (η′Cl , obtained from Eq. 16, applied to chlorineinstead of hydrogen):
ηMT ≡ ηCl−η′Cl [18]
The simplified mass transport picture is presented in Figure 4.
Figure 4: (a) Schematic representation of bubble-train flow in a capillary. Slugs of HCl(aq)separate bubbles of Cl2. The thin HCl(aq) film acts as a diffusion barrier to Cl2 reach-ing the electrode to react. (b) A cross-section of a square capillary exhibiting the cross-sectional bubble profile for capillary number < 0.1 (17). (c) Schematic of Cl2 concentra-tion versus distance from the bubble to the electrode for different current densities.
The chlorine enters and exits the cell in two-phase bubble-train flow in a square cross-section channel (Fig. 4a,b). In bubble-train flow, individual gas bubbles are interspersedbetween slugs of liquid. The bubbles occupy most of the cross-sectional area of the chan-nel (Fig. 4b), but a thin film of HCl(aq) coats the channel wall and separates the gas bubblefrom the electrode surface. The bubbles are mostly Cl2(g), with small amounts of HCl(g),and are surrounded by hydrochloric acid. Two-phase flow is important for the rHCFC be-
13
cause of the propensity of both Cl2(g) and HCl(g) to dehydrate the membrane, meaningthat continuous delivery of H2O molecules to the membrane is essential. With two-phaseflow, however, it is imperative that the mass transport is handled properly. If the aqueousphase sets up a diffusion barrier that is too large, the cell can become “flooded” and perfor-mance is drastically reduced. This is a problem that the low temperature hydrogen-oxygenfuel cell community has made considerable effort to overcome (18).
In order to understand mass transport through the HCl(aq) thin film bubble wall, weneed to know the film thickness, ε [cm], which is predictable from fluid dynamics (17,19-22). Cl2 from inside the bubble must diffuse across this HCl(aq) thin film to the electrodesurface to react according to Equation 4b. As the reaction goes forward, the thin film be-comes enriched in Cl-. If the current density is sufficiently high that considerable depletionof the reactant and accumulation of the product occurs, then mass transport would limitthe cell performance.
We assume that at the bubble/film boundary the concentration of Cl2 in solution ispinned at Csat., which is the equilibrium concentration of Cl2(aq) dissolved in HCl(aq) forthe actual pressure of Cl2(g). This assumption is justified because the flux of Cl2 towardthe electrode surface is significantly smaller than the impingement rate of Cl2 gas onto thethin film surface (alternatively, one can justify this by realizing that, since the film itselfis quite thin, its surface area to volume ratio is large, meaning that Cl2(g) will be able toquickly equilibrate with the liquid film).
The diffusive flux, J [ molcm2·s ], is given by
J =−DdCdx≈−D
∆C∆x
, [19]
where in the second expression we have made the quasi-stationary, linear concentrationgradient approximation across the thin HCl(aq) film. D is the diffusion coefficient in cm2
s .For diffusion of Cl2 in HCl(aq), we label the diffusion coefficient DCl2 . ∆x is equal toε, the film thickness, and ∆C is the concentration difference across the thin film, namelyCs
O(i)−Csat. in molcm3 . For each mole of Cl2 that diffuses to the electrode surface to react,
2F coulombs of electrons pass through the external circuit for chlorine reduction. Thus,the flux is expressed as a current density according to i = 2FJ ·1000, where the factor of1,000 is necessary for conversion from A to mA. Equation 19 can be solved for Cs
O(i):
CsO(i) =Csat.−
ε
2FDCl2
i1000
. [20]
The film thickness ε [cm] is approximated by the following equation (16):
ε≈ wCa23 , [21]
where w is the width of the capillary channel and the capillary number Ca is a dimension-less number given by
Ca =µVb
σsurf. [22]
14
Here µ is the viscosity in mPa · s, Vb is the bubble velocity in ms , and σsurf is the surface
tension of HCl(aq) against Cl2 in mNm . In our system, we have considerable flexibility in
choosing a value for ε, given that w and Vb are parameters not constrained by any otherpart of the system and are amenable to engineering design.
We bound values of ε by considering the relevant extremes of these parameters. Wemay expect Vb to vary reasonably from 0.001 to 0.1 m
s . Over the temperature and con-centration range presented in work done by Laliberte, the viscosity µ varies from 0.6 to2.4 mPa · s (23, 24). σsurf is assumed to vary similarly to the surface tension of wateragainst air, 62-76 mN
m over 0-80 C(6). With these extremes, Ca varies from a minimumof 7.89×10⁻⁶ to a maximum of 0.00387.
A typical channel width for a fuel cell is one millimeter. We allow the channel widthto vary from 0.5 to 3 mm, in which case Equation 21 yields a range on ε of 0.2 to 74 µm.
The diffusion coefficient of Cl2 in HCl(aq) is fit to the data of Tang and Sandall (25),resulting in
DCl2 = 0.0392exp(
−0.204kB(T +273.15)
), [23]
where kB is Boltzmann’s constant, 8.617 x 10⁻⁵ eVK , the activation energy, -0.204, is in eV,
and the prefactor is in cm2
s . We assume DCl2 is independent of acid concentration.
We take the dependence of the saturated chlorine concentration, Csat. [molcm3 ], from the
work of Hine and Inuta (26). The solubility follows Henry’s law (based on the rapidimpingement argument made previously), with a temperature and concentration dependentcoefficient.
Csat. = H pCl2 ·1
1000MCl2, [24]
where H is Henry’s law coefficient in gL·atm , and the latter factor yields our working units of
molcm3 for Csat., with MCl2 being the molecular weight of Cl2 of 70.9 g
mol . The concentrationand temperature dependence are empirically fit by
H = α′MHClM+β [25]
logα′ =−1.21×10⁻²T −1.603 [26]
β = 2.14×10²T−1.21 [27]
where α′ is in grams-chlorine per liter/grams-HCl per liter · atm, and β is in grams-chlorineper liter/atm.
We model the chloride mass transport in a similar way to the chlorine transport, witha few key differences. As Cl2 is reduced at the electrode, Cl- is produced and the localconcentration, Cs
R(i), increases. Protons also enter through the electrode at the same fluxas the chloride is generated. As the concentrations increase at the electrode surface, theconcentration gradient generates a diffusive flux of Cl- and H+ away from the electrode.We model the concentration of HCl(aq) as pinned at the bubble-thin film interface due toexchange of HCl(g) in the bubble with HCl(aq) in the thin film. The bulk solution molarity
15
sets the equilibrium partial pressure of HCl(g) in the bubble, which in turn maintains thethin film interface concentration at the bulk molarity. We assume the addition of newHCl(g) does not appreciably affect the partial pressure of HCl(g) in the bubble, due tothe bubble’s large volume with respect to the HCl(g) generated and the bubble’s ability toexpand longitudinally to take up any small pressure increase. The surface concentration isthen modeled by:
CsR(i) =
M1000
+ε
FDHCl
i1000
[28]
Note that the sign has changed (relative to Eq. 20) because positive fluxes of Cl- requirenegative current densities. Also, a factor of two is absent from the second term becausethere is one charge per chloride ion, as opposed to two charges per chlorine molecule inthe previous case.
We fit the data of James and Gordon (27) for the diffusion coefficient of Cl- in 0.1 Mhydrochloric acid to an Arrhenius function, resulting in
DCl− = 0.0217exp(
−0.170kB(T +273.15)
), [29]
where the prefactor is in cm2
s and the activation energy is in eV. We assume the diffusioncoefficient is independent of HCl(aq) concentration (27).
Model Results and Discussion
The model calculates the cell potential according to Equation 3, accounting for thevarious effects of concentration, temperature, and pressure on each of the overpotentials.We first consider the variation of the current density-voltage relationship with operatingparameters for “Base Case” engineering parameters: iCl
0 = 10 mAcm2 , ε = 3 µm, l = 0.178 cm
(7 mil), and pCl2 = pH2 = 1 atm. Figure 5a shows calculated cell potentials for the BaseCase EPs for three sets of OPs. The curve labeled “Standard OPs” is the cell potential atstandard conditions of 25 Cand 1 M HCl.
The two most relevant performance characteristics are the cell efficiency-vs.-current-density function and the maximum cell power density. On one hand, high cell efficiency isparamount for energy storage devices because lost energy is lost revenue. It is imperativethat a storage device be able to operate at high efficiencies at reasonable current densities.On the other hand, operating at higher power densities reduces the capital cost for a givenpower-delivery capability, because one may buy less cell area for an equivalent power. Themaximum power density also permits a determination of the minimum membrane area(and associated cost) necessary to achieve a required system power. In any real storagesystem (used to levelize wind power, for example), the cell will operate over a distributionof current densities, constantly ramping up and down, depending of course on how muchpower is being generated by the turbines. Thus, both the maximum power density and thecell efficiency are important, so we explore both of these characteristics in this model.
The maximum power also serves as a convenient scalar proxy for the cell efficiency-vs.-current-density function, as the two performance characteristics are correlated, as is
16
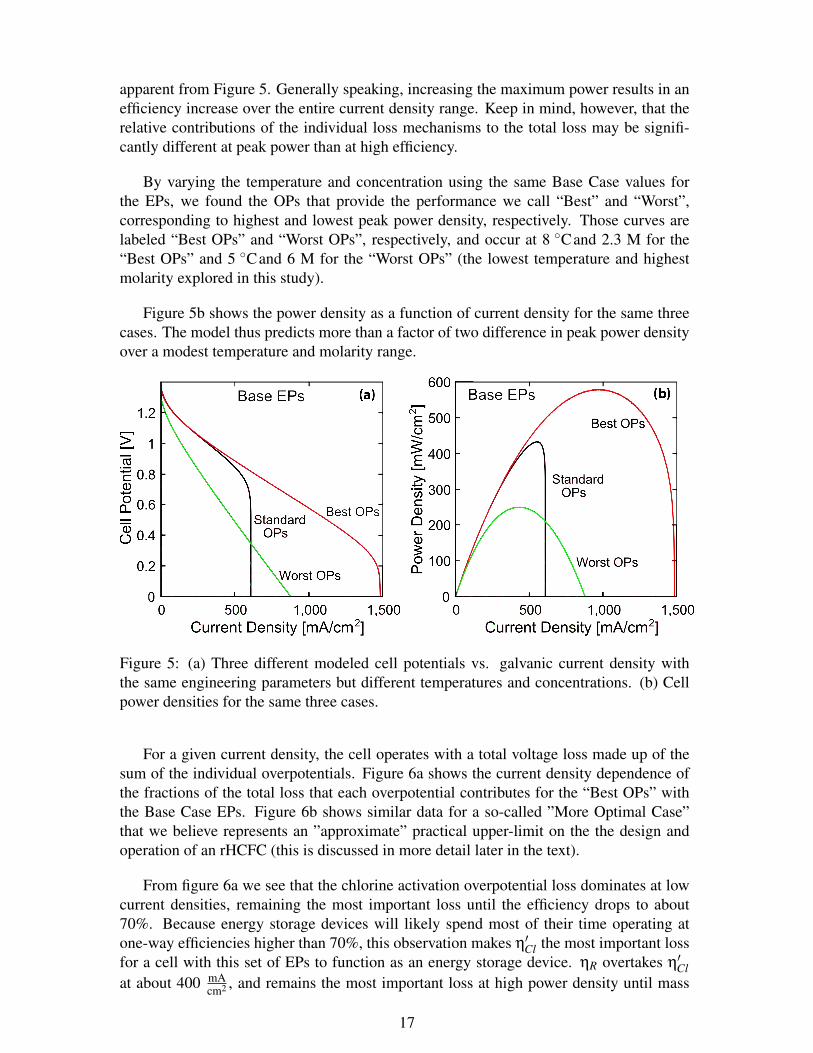
apparent from Figure 5. Generally speaking, increasing the maximum power results in anefficiency increase over the entire current density range. Keep in mind, however, that therelative contributions of the individual loss mechanisms to the total loss may be signifi-cantly different at peak power than at high efficiency.
By varying the temperature and concentration using the same Base Case values forthe EPs, we found the OPs that provide the performance we call “Best” and “Worst”,corresponding to highest and lowest peak power density, respectively. Those curves arelabeled “Best OPs” and “Worst OPs”, respectively, and occur at 8 Cand 2.3 M for the“Best OPs” and 5 Cand 6 M for the “Worst OPs” (the lowest temperature and highestmolarity explored in this study).
Figure 5b shows the power density as a function of current density for the same threecases. The model thus predicts more than a factor of two difference in peak power densityover a modest temperature and molarity range.
Figure 5: (a) Three different modeled cell potentials vs. galvanic current density withthe same engineering parameters but different temperatures and concentrations. (b) Cellpower densities for the same three cases.
For a given current density, the cell operates with a total voltage loss made up of thesum of the individual overpotentials. Figure 6a shows the current density dependence ofthe fractions of the total loss that each overpotential contributes for the “Best OPs” withthe Base Case EPs. Figure 6b shows similar data for a so-called ”More Optimal Case”that we believe represents an ”approximate” practical upper-limit on the the design andoperation of an rHCFC (this is discussed in more detail later in the text).
From figure 6a we see that the chlorine activation overpotential loss dominates at lowcurrent densities, remaining the most important loss until the efficiency drops to about70%. Because energy storage devices will likely spend most of their time operating atone-way efficiencies higher than 70%, this observation makes η′Cl the most important lossfor a cell with this set of EPs to function as an energy storage device. ηR overtakes η′Clat about 400 mA
cm2 , and remains the most important loss at high power density until mass
17
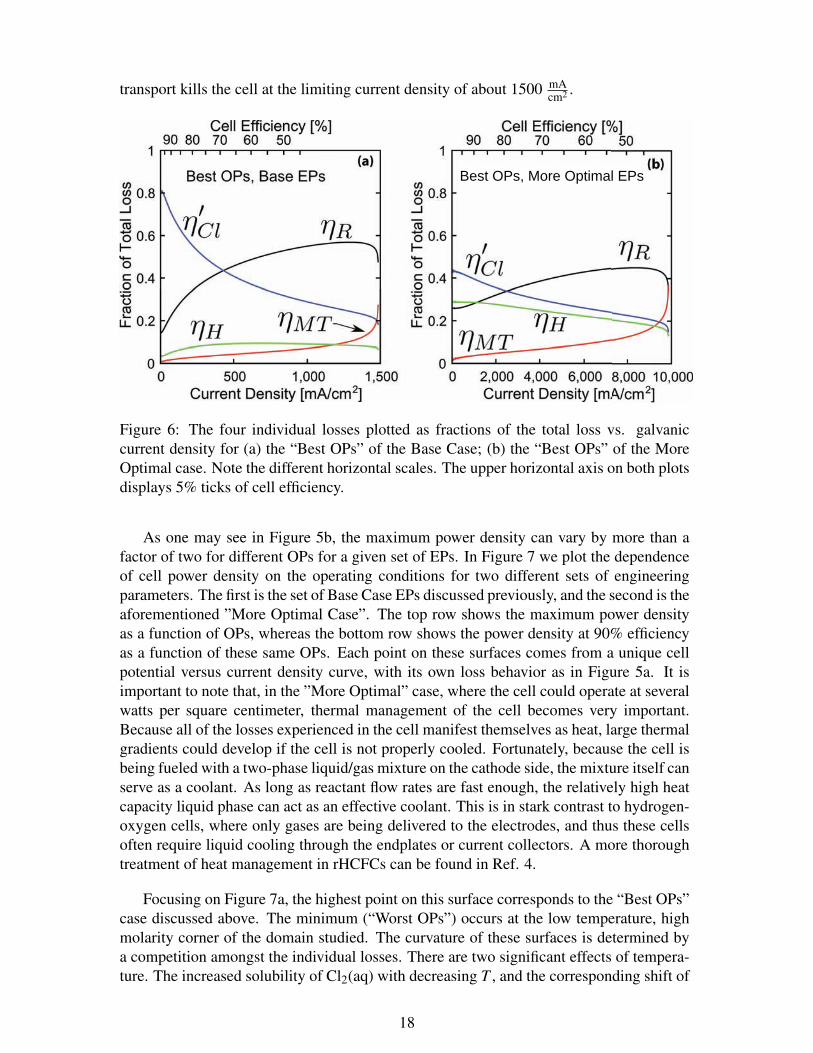
transport kills the cell at the limiting current density of about 1500 mAcm2 .
Best OPs, More Optimal EPs
Figure 6: The four individual losses plotted as fractions of the total loss vs. galvaniccurrent density for (a) the “Best OPs” of the Base Case; (b) the “Best OPs” of the MoreOptimal case. Note the different horizontal scales. The upper horizontal axis on both plotsdisplays 5% ticks of cell efficiency.
As one may see in Figure 5b, the maximum power density can vary by more than afactor of two for different OPs for a given set of EPs. In Figure 7 we plot the dependenceof cell power density on the operating conditions for two different sets of engineeringparameters. The first is the set of Base Case EPs discussed previously, and the second is theaforementioned ”More Optimal Case”. The top row shows the maximum power densityas a function of OPs, whereas the bottom row shows the power density at 90% efficiencyas a function of these same OPs. Each point on these surfaces comes from a unique cellpotential versus current density curve, with its own loss behavior as in Figure 5a. It isimportant to note that, in the ”More Optimal” case, where the cell could operate at severalwatts per square centimeter, thermal management of the cell becomes very important.Because all of the losses experienced in the cell manifest themselves as heat, large thermalgradients could develop if the cell is not properly cooled. Fortunately, because the cell isbeing fueled with a two-phase liquid/gas mixture on the cathode side, the mixture itself canserve as a coolant. As long as reactant flow rates are fast enough, the relatively high heatcapacity liquid phase can act as an effective coolant. This is in stark contrast to hydrogen-oxygen cells, where only gases are being delivered to the electrodes, and thus these cellsoften require liquid cooling through the endplates or current collectors. A more thoroughtreatment of heat management in rHCFCs can be found in Ref. 4.
Focusing on Figure 7a, the highest point on this surface corresponds to the “Best OPs”case discussed above. The minimum (“Worst OPs”) occurs at the low temperature, highmolarity corner of the domain studied. The curvature of these surfaces is determined bya competition amongst the individual losses. There are two significant effects of tempera-ture. The increased solubility of Cl2(aq) with decreasing T , and the corresponding shift of
18

5 15 25 35 45 55 65 75
0.51.5
2.53.5
4.55.5
2000
2500
3000
3500
4000
4500
5000
5500
Temperature [C]
5000450040003500
30002500
Concentration [mol/L]5 15 25 35 45 55 65 75
0.51.5
2.53.5
4.55.5
250
300
350
400
450
500
550
600
Temperature [C]Concentration [mol/L]
550
500450 400
350300
5 15 25 35 45 55 65 75
0.51.5
2.53.5
4.55.5
50
55
60
65
70
75
80
85
90
95
Temperature [C]Concentration [mol/L]
9085
8075
7065
5 15 25 35 45 55 65 75
0.51.5
2.53.5
4.55.5
700
800
900
1000
1100
1200
1300
1400
Temperature [C]Concentration [mol/L]
1200
1300
1000900800
1100
Pow
er D
ensi
ty a
t 90%
Effi
cien
cy [
mW
/cm
2 ]
(a)
(c) (d)
Base Case Maximum Power
Base Case Power at 90% Efficiency More Optimal Case Power at 90% Efficiency
Max
imum
Pow
er [m
W/c
m2 ]
Max
imum
Pow
er [m
W/c
m2 ]
Pow
er D
ensi
ty a
t 90%
Effi
cien
cy [
mW
/cm
2 ]
More Optimal Case Maximum Power(b)
Figure 7: Power density vs. operating parameters. (a) Maximum power density for the cellwith Base Case EPs: iCl
0 = 10 mAcm2 , ε = 3 µm, l = 0.178 cm (7 mil), and atmospheric pressure.
(b) Maximum power density for the cell with More Optimal Case EPs: iCl0 = 400 mA
cm2 , ε = 1µm, l = 0.025 cm (1 mil), 5 atm gas pressures. (c) Power at 90% galvanic efficiency for theBase Case. (d) Power at 90% galvanic efficiency for the More Optimal Case. Contour linesare projected on the temperature-concentration plane. The ”jaggedness” in the bottom-rowplots is due to computational mesh-size limitations and is not a real effect.
the limiting current density to higher values, tends to drive the highest point toward lowerT . The conductivity increase of Nafion with increasing T (see Fig. 3), as well as thermallyactivated electrode kinetics, tend to drive the highest point toward higher T . It is thus clearthat, due to the location of the maximum at 8 Cfor this set of engineering parameters, themass transport consideration is most important for the Base Case Cell. Notice, though,that in the More Optimal Case (Figures 7b and 7d), the temperature dependence is muchless significant, especially above room temperature. This is due to the lessened importanceof mass transport in the More Optimal Case.
Moving back to understanding the curvature of these surfaces, there are two compet-ing effects of changing the acid molarity. High molarity results in a lower equilibrium cellpotential as well as lower Nafion conductivity. Lower equilibrium potentials correspond tolower efficiency in general, because the individual energy losses make up a larger fractionof total chemical energy converted. As the molarity decreases, the equilibrium cell po-
19
tential starts to increase, as does the Nafion conductivity. The conductivity of the Nafionpeaks at about 2.5 M and then starts to fall off again with decreasing molarity, whereasEeq continues to rise. The competition between these two effects after the peak Nafionconductivity results in a maximum at about 2.3 M.
It is also important to note that the maximum power surfaces and the surfaces repre-senting the power density at 90% efficiency are roughly the same shape for both the BaseCase cell and the More Optimal case cell. This intuitively makes sense: operating condi-tions that permit high-efficiency operation will also provide the highest possible maximumpower densities.
In Figure 8, we report the variation of the maximum peak power (the height of thehighest point in Figure 7) as each of the engineering parameters (other than the hydrogenexchange current density, which is fixed at iH0 = 250 mA
cm2 ) is varied away from the BaseCase while keeping the other four EPs fixed. For each set of EPs a surface similar to that inFigure 7 is generated, and the “Best OPs” and “Worst OPs” for that set of EPs are recordedin Figure 8. The latter are included as an indication of the performance sensitivity to OPs.
In Figure 8a we varied iCl0 from the certainly attainable value of 1 mA
cm2 , to the likelyunattainable value of 1000 mA
cm2 . For this set of EPs there are significantly diminishingreturns for efforts to increase iCl
0 beyond the Base Case, but decreasing iCl0 below the Base
Case causes a degradation in performance.
In Figure 8b we show how performance rapidly increases with decreasing membranethickness, due to decreasing membrane resistance. Nafion is currently commercially avail-able in thicknesses from 25 to 250 µm, but engineering a fuel cell with the thinnest mem-brane can be difficult, as it serves as the only separator between two highly reactive gases.As we refer back to Figure 6, we see that, in the absence of significant mass transport loss,the resistance overpotential dominates the other overpotentials at high current densities,including current densities at which the maximum power densities are located.
In Figure 8c we show that the power performance declines considerably for large val-ues of the acid layer thickness ε; this occurs because of small limiting current densities.As ε is decreased, the gain in power is roughly linear until a rapid upturn at about 2 µm.This results from a trade-off between mass transport and resistance loss. For ε > 2 µm,mass transport loss dominates the temperature sensitivity; hence the optimal operatingtemperature is driven down for increased Cl2 solubility. As ε drops below 2 µm, the masstransport loss has become small enough that higher cell temperatures are selected to lowerthe membrane resistance. When ε = 0.5 µm, the optimal temperature has increased to67.5 C, where the membrane conductivity is significantly higher over the entire molarityrange. We thus see that, as mass transport is effectively made less important by decreasingthe size of ε, the optimal temperature for cell operation increases.
In Figure 8d we show how the cell performance depends on the pressure of H2 and Cl2gases (we always maintain pCl2 = pH2). Higher pressure gives a modest boost to the opencircuit potential. However, this effect is dominated by a covariant conductivity increasein the PEM. Increasing the pressure raises the solubility of Cl2(g) proportionally, whichdecreases the need to go to low temperature for solubility enhancement, thereby allowing
20

Figure 8: Dependence of performance on deviation from Base Case engineering parame-ters. Maximum power densities are displayed as a function of each engineering parameterwith the others held at the Base EP values: iH0 = 250 mA
cm2 , iCl0 = 10 mA
cm2 , ε = 3 µm, andl = 0.178 cm (7 mil). (a) Chlorine exchange current density, iCl
0 . (b) Nafion membranethickness, l. (c) Bubble thin film thickness, ε. (d) The cell pressure, pCl2 = pH2 . Base caseis circled. The black (upper) dots represent the ”Best OPs” for a given set of EPs, whilethe red (lower) dots represent the ”Worst OPs” for the same set of EPs.
an increase in temperature for better Nafion conductivity. The optimal temperature startsat 8 Cat 1 atm, and increases steadily until it reaches 68 Cat 5 atm.
The average “Best OP” molarity over the EP space studied in Figure 8 is 2.3 M with astandard deviation of 0.2 M. This suggests that the most dominant concentration effect isthe membrane conductivity, which peaks at around 2.5 M for all temperatures (Fig. 3).
While Figure 8 focuses on the effects of varying the individual engineering parameterson the maximum power density, it is also important to understand how varying the EPswould affect the cell power density at high efficiency. From Figure 6a, it is clear that thedominant loss at 90% galvanic efficiency is the chlorine activation overpotential. Thus,
21
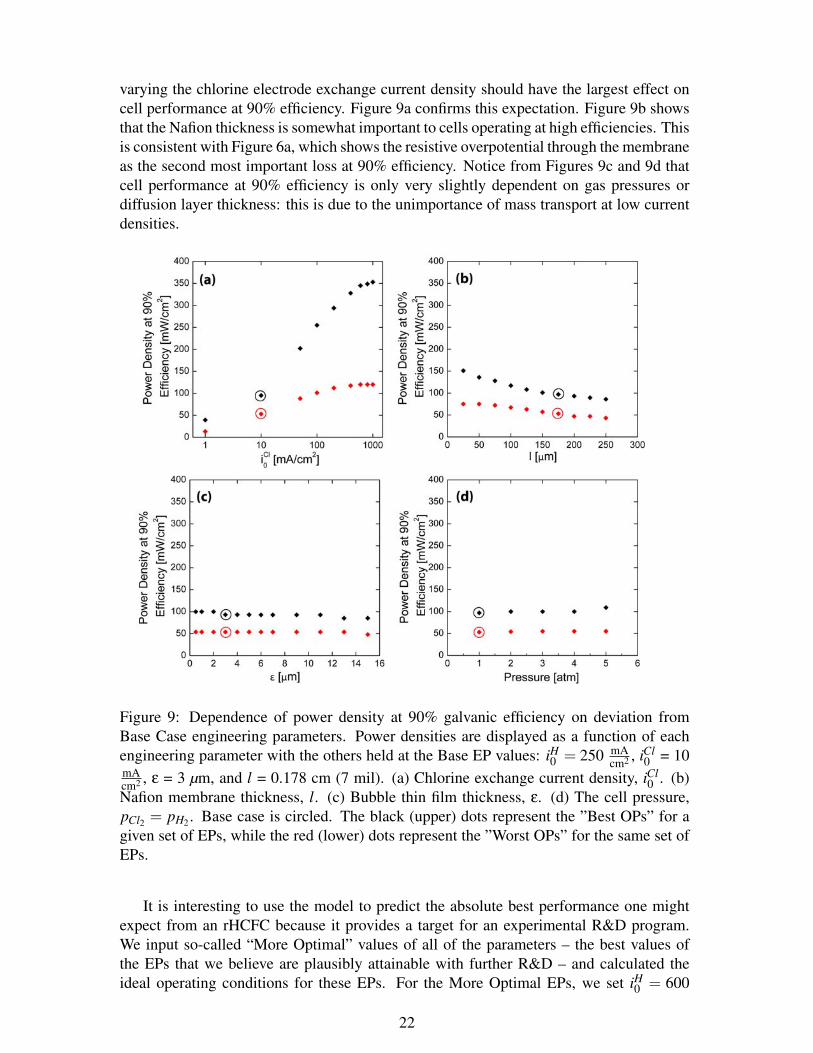
varying the chlorine electrode exchange current density should have the largest effect oncell performance at 90% efficiency. Figure 9a confirms this expectation. Figure 9b showsthat the Nafion thickness is somewhat important to cells operating at high efficiencies. Thisis consistent with Figure 6a, which shows the resistive overpotential through the membraneas the second most important loss at 90% efficiency. Notice from Figures 9c and 9d thatcell performance at 90% efficiency is only very slightly dependent on gas pressures ordiffusion layer thickness: this is due to the unimportance of mass transport at low currentdensities.
Figure 9: Dependence of power density at 90% galvanic efficiency on deviation fromBase Case engineering parameters. Power densities are displayed as a function of eachengineering parameter with the others held at the Base EP values: iH0 = 250 mA
cm2 , iCl0 = 10
mAcm2 , ε = 3 µm, and l = 0.178 cm (7 mil). (a) Chlorine exchange current density, iCl
0 . (b)Nafion membrane thickness, l. (c) Bubble thin film thickness, ε. (d) The cell pressure,pCl2 = pH2 . Base case is circled. The black (upper) dots represent the ”Best OPs” for agiven set of EPs, while the red (lower) dots represent the ”Worst OPs” for the same set ofEPs.
It is interesting to use the model to predict the absolute best performance one mightexpect from an rHCFC because it provides a target for an experimental R&D program.We input so-called “More Optimal” values of all of the parameters – the best values ofthe EPs that we believe are plausibly attainable with further R&D – and calculated theideal operating conditions for these EPs. For the More Optimal EPs, we set iH0 = 600
22
mAcm2 , a value which has already been obtained for the hydrogen electrode in a hydrogen-oxygen fuel cell (12). In light of preliminary indications of fast chlorine kinetics in ourlaboratory, we assume that the chlorine catalysis will be able to almost catch up to thevalue for hydrogen in the future, and we set iCl
0 = 400 mAcm2 . The thinnest Nafion membrane
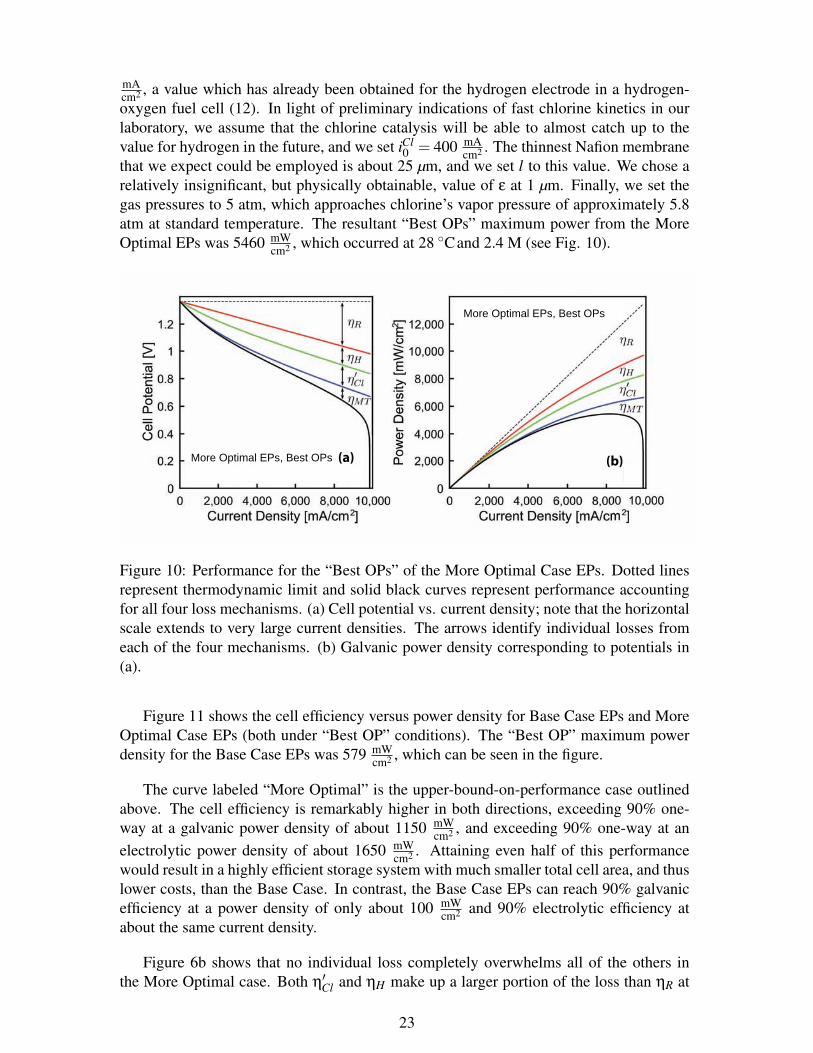
that we expect could be employed is about 25 µm, and we set l to this value. We chose arelatively insignificant, but physically obtainable, value of ε at 1 µm. Finally, we set thegas pressures to 5 atm, which approaches chlorine’s vapor pressure of approximately 5.8atm at standard temperature. The resultant “Best OPs” maximum power from the MoreOptimal EPs was 5460 mW
cm2 , which occurred at 28 Cand 2.4 M (see Fig. 10).
(a) (b)More Optimal EPs, Best OPs
More Optimal EPs, Best OPs
Figure 10: Performance for the “Best OPs” of the More Optimal Case EPs. Dotted linesrepresent thermodynamic limit and solid black curves represent performance accountingfor all four loss mechanisms. (a) Cell potential vs. current density; note that the horizontalscale extends to very large current densities. The arrows identify individual losses fromeach of the four mechanisms. (b) Galvanic power density corresponding to potentials in(a).
Figure 11 shows the cell efficiency versus power density for Base Case EPs and MoreOptimal Case EPs (both under “Best OP” conditions). The “Best OP” maximum powerdensity for the Base Case EPs was 579 mW
cm2 , which can be seen in the figure.
The curve labeled “More Optimal” is the upper-bound-on-performance case outlinedabove. The cell efficiency is remarkably higher in both directions, exceeding 90% one-way at a galvanic power density of about 1150 mW
cm2 , and exceeding 90% one-way at anelectrolytic power density of about 1650 mW
cm2 . Attaining even half of this performancewould result in a highly efficient storage system with much smaller total cell area, and thuslower costs, than the Base Case. In contrast, the Base Case EPs can reach 90% galvanicefficiency at a power density of only about 100 mW
cm2 and 90% electrolytic efficiency atabout the same current density.
Figure 6b shows that no individual loss completely overwhelms all of the others inthe More Optimal case. Both η′Cl and ηH make up a larger portion of the loss than ηR at
23

More Optimal EPs Best OPs
Figure 11: Cell efficiency as a function of power density for the Base Case EPs and MoreOptimal Case EPs, both at “Best OPs”. The transition to a dashed line on the Base Casecurve highlights an undesirable region of operation, as the efficiency decreases with de-creasing power density.
current densities leading to efficiencies exceeding 90%. With increasing current density,ηR eventually overtakes both of the activation losses, and becomes the dominant loss foran extended portion of the current density range. Finally, ηMT kills the cell at the limitingcurrent density of about 10 A
cm2 .
It is interesting to gauge the importance of the individual engineering parameters aswe back them off of their More Optimal values. Decreasing iCl
0 by 25% brings the maxi-mum power down from 5460 mW
cm2 to 5340 mWcm2 . Decreasing iH0 by 25% has the same effect.
Increasing l by 25% takes the maximum power down to 4980 mWcm2 . Increasing ε by 25%
takes the maximum power down to 5100 mWcm2 . Finally, the most significant performance re-
duction came from decreasing the gas pressure by 25%, which brings the maximum powerto 4700 mW
cm2 . None of these individual shortcomings would render the cell performanceunacceptable.
Summary
We have developed a simple model of an rHCFC for a configuration in which thechlorine electrode is exposed to bubble-train flow of reactant Cl2(g) and product HCl(aq).The model analyzes the expected losses from Nafion ohmic loss, Cl2(aq) mass transportthrough the bubble wall, chlorine activation, and hydrogen activation.
We considered the effects of five cell engineering parameters: hydrogen exchangecurrent density, chlorine exchange current density, gas pressure, membrane thickness, and
24
bubble wall thickness. The model predicted the cell potential vs. current density in bothgalvanic and electrolytic directions. For each set of EPs, we varied the OPs over a rangewhere the model approximations hold, and identified the Best OPs for each set of EPs.
We started with “Base Case EPs”, which we believe are technically feasible today: iCl0
= 10 mAcm2 ; ε = 3 µm; l = 0.178 cm (7 mil); and atmospheric pressure. We showed the
contributions to the total loss vs. current density for each of the four loss mechanisms.Chlorine activation overpotential is the largest loss mechanism for low current densities(i < 400 mA
cm2 , η > 0.7), whereas for higher current densities the ohmic loss in the Nafiondominates the losses.
We varied each EP (except for iH0 ) systematically while holding all the other EPs attheir “Base Case” values, found the best and worst OPs for each set of EPs, and report,for the best OPs for each set of EPs, the maximum power density and the power densityat 90% galvanic efficiency. Particularly important to improving high-efficiency operationis increasing the chlorine exchange current density, either by improving chlorine catalysisor by increasing the specific surface area of the chlorine electrode. Particularly importantto achieving high maximum power densities is to safely use as thin of a membrane aspossible. Assuming mass transport is kept insignificant by proper management of thediffusion layer thickness, or by operating the cell at high pressures, then gains in masstransport will not significantly affect operation at peak power or high efficiency.
We identified a set of “More Optimal EPs” representing ambitious targets that webelieve to be attainable with further R&D: iCl
0 = 400 mAcm2 ; ε = 1 µm; l = 25 µm (1 mil);
and 5 atm pressure. This case provides a reasonable estimate of the upper bound on theperformance of a hydrogen-chlorine fuel cell of this type: a cell efficiency exceeding 90%one-way at a galvanic power density of about 1150 mW
cm2 and at an electrolytic power densityof about 1650 mW
cm2 . The maximum power density of such a cell would be about 5400 mWcm2 .
Although these are ambitious figures, we believe that if the performance of a real systemwere to approach even half of these values, regenerative hydrogen chlorine fuel cells couldbecome economically viable electricity storage devices.
Acknowledgments
This research was supported by National Science Foundation grant NSF-IIP-0848366through Sustainable Innovations, LLC. We thank Dr. Trent M. Molter for helpful discus-sions. One of us (B.H.) was supported by an NSF Graduate Research Fellowship.
25
References
1. J. M. Eyer, J. J. Iannucci and G. P. Corey, Energy Storage Benefits and Market AnalysisHandbook, A Study for the DOE Energy Storage Systems Program, in Sandia NationalLabratories (2004).
2. E. N. Balko and J. F. McElroy, in Power Sources Conference, 29th, Atlantic City, NJ,June 9-12, 1980, Proceedings. (A81-49478 24-44) (1980).
3. E. B. Anderson, E. J. Taylor, G. Wilemski and A. Gelb, J. Power Sources, 47, 321(1994).
4. D. T. Chin, R. S. Yeo, J. McBreen and S. Srinivasan, J. Electrochem. Soc., 126, 713(1979).
5. L. J. Nuttall, J. F. McElroy, S. Srinivasan and T. G. Hart, in Alternative energy sources;Proceedings of the Miami International Conference, Miami Beach, Fla., December 5-7,1977. Volume 8. (A79-34106 13-44) (1977).
6. R.S. Yeo, J. McBreen, A.C.C. Tseung, and S. Srinivasan, J. Appl. Electrochem., 10,393 (1979).
7. M. Thomassen, B. Borresen, G. Hagen, and R. Tunold, J. Appl. Electrochem., 33, 9(2003).
8. D.J. Eames and J. Newman, J. Electrochem. Soc., 142, 3619 (1995).
9. M. Thomassen, B. Borresen, K. Scott, and R. Tunold, J. Power Sources, 157, 271(2006).
10. D. R. Lide, CRC Handbook of Chemistry and Physics, 88th Edition (CRC Handbookof Chemistry and Physics), CRC (2007).
11. J. I. Partanen, P. M. Juusola, K. P. Vahteristo and A. J. G. de Mendonca, J. SolutionChem., 36, 39 (2007).
12. P. Novotny and O. Sohnel, J. Chem. Eng. Data, 33, 49 (1988).
13. R. S. Yeo and J. McBreen, J. Electrochem. Soc., 126, 1682 (1979).
14. A. J. Bard and L. R. Faulkner, Electrochemical Methods: Fundamentals and Applica-tions, p. 87, Wiley (2000).
15. K. C. Neyerlin, W. Gu, J. Jorne and H. A. Gasteiger, J. Electrochem. Soc., 154, B631(2007).
16. M. Thomassen, B. Borresen, G. Hagen and R. Tunold, Electrochimica Acta, 50, 1157(2005).
17. W. B. Kolb and R. L. Cerro, Phys. Fluids A, 5, 1549 (1993).
26

18. R. Anderson, L. Zhang, Y. Ding, M. Blanco, X. Bi and D. P. Wilkinsons, J. PowerSources, 195, 4531 (2010).
19. L. W. Schwartz, H. M. Princen and A. D. Kiss, J. Fluid Mechanics, 172, 259 (1986).
20. T. C. Thulasidas, M. A. Abraham and R. L. Cerro, Chem. Eng. Sci., 50, 183 (1995).
21. H. Wong, C. J. Radke and S. Morris, J. Fluid Mechanics, 292, 71 (1995).
22. M. Muradoglu and H. A. Stone, J. Fluid Mechanics, 570, 455 (2007).
23. M. Laliberte, J. Chem. Eng. Data, 52, 321 (2007).
24. M. Laliberte, J. Chem. Eng. Data, 52, 1507 (2007).
25. A. Tang and O. Sandall, J. Chem. Eng. Data, 30, 189 (1985).
26. F. Hine and S. Inuta, Bull. Chem. Soc. Jpn., 41, 71 (1968).
27. W. A. James and A. R. Gordon, J. Chem. Phys., 7, 963 (1939).
27