model user's guide updates and...
TRANSCRIPT

MODEL USER'S GUIDE
UPDATES AND REVISIONS
Product 10.3 Final
1111111111, 11111111111111111
HONOLULU HIGH-CAPACITY TRANSIT CORRIDOR PROJECT ALTERNATIVES ANALYSIS
prepared for: City and County of Honolulu
Mir prepared by: &---7 Parsons Brinckerhoff Quade & Douglas, Inc.
September 2007
AR00064333

OMPO Model Development Project User's Guide to Model Application
User's Guide to Model Application
Revised August 15, 2007
Parsons Brinckerhoff
AR00064334

OMPO Model Development Project User's Guide to Model Application
A. Introduction
Parsons
Introduction Brinckerhoff
AR00064335

OMPO Model Development Project User's Guide to Model Application
A. Introduction 1.1 Overview
This part of the document serves as a user's guide to application of the models. The user's guide includes six sections following this introduction:
B. Transportation System Models
C. Models of Resident Travel
D. Other Transportation Models
E. Network Assignment and Reporting
F. Land Use Models
G. Utility Programs
1.2 Procedures Guide
The models are set up to run via "batch" files for each model component. This document lists the model components that need to be run for each alternative and how to invoke each model component's respective batch file. The batch files should be run in the order specified below. All of the alternative model batch files, controls, and outputs are stored in subdirectories under the "altname" directory. The User's Guide to Model Application should be referenced for additional information on setting up model application controls and interpreting outputs.
Figure 1 depicts the sequence of model procedures in flowchart form.
1.2.1 Highway Network Building
To invoke the highway network build procedure batch file for alternative "zzz" type "hwybldal zzz" at the command prompt from the "hwybld" directory.
1.2.2 Highway Path Building and Skimming
To invoke the highway path build and skim procedure batch file for alternative "zzz" type "skall zzz" at the command prompt from the "hwy" directory.
1.2.3 Transit Path Building and Skimming
To invoke the transit path build and skim procedure batch file for alternative "zzz" type "skall zzz" at the command prompt from the "trn" directory.
1.2.4 Walk and Bicycle Path Building and Skimming
To invoke the auxiliary path build and skim procedure batch file for alternative "zzz" type "skall zzz" at the command prompt from the "axl" directory.
Parsons
Introduction Brinckerhoff
A-1
AR00064336

OMPO Model Development Project User's Guide to Model Application
1.2.5 Trip Generation
To invoke the trip generation procedure batch file for alternative "zzz" type "tgall zzz" at the command prompt from the "tg" directory.
1.2.6 Trip Distribution
To invoke the trip distribution procedure batch file for alternative "zzz" type "tdall zzz" at the command prompt from the "td" directory.
1.2.7 Mode Choice
To invoke the mode choice procedure batch file for alternative "zzz" type "mcall zzz" at the command prompt from the "mc" directory.
1.2.8 Time of Day and Directional Factoring
To invoke the time of day and directional factoring procedure batch file for alternative "zzz" type "dfall zzz" at the command prompt from the "tod" directory.
1.2.9 Airport Access Trips
To invoke the airport access trip batch file for alternative "zzz" type "apall zzz" at the command prompt from the "air" directory.
1.2.10 Visitor Trips
To invoke the visitor trip batch file for the alternative "zzz" type "visnew zzz" at the command prompt from the "vis" directory.
1.2.11 Truck Trips
To invoke the truck trip batch file for the alternative "zzz" type "trkall zzz" at the command prompt from the "trk" directory.
1.2.12 Highway Assignment and Reporting
To invoke the highway assignment and reporting procedure batch file for alternative "zzz" type "asall zzz" at the command prompt from the "hwy" directory.
1.2.13 Transit Assignment and Reporting
To invoke the transit assignment and reporting procedure batch file for alternative "zzz" type "asall zzz" at the command prompt from the "trn" directory.
Parsons
Introduction Brinckerhoff
A-2
AR00064337

OMPO Model Development Project User's Guide to Model Application
1.2.14 Feedback
The OM PO regional model is run using a feedback process, in which the travel times resulting from the highway assignment are used as input to the subsequent iteration of the model. These link travel times affect trip distribution and mode choice results in the next iteration, which in turn results in changed travel demand results, which in turn have an impact on the final assignment and the resulting congested speeds. The feedback process is continued until no further significant changes are apparent between the current model iteration, and the average of subsequent iterations. Change is measured in terms of both link volume and zone-to-zone volume, the latter summarized by district. In this way, equilibrium is assured between the travel times input and the resulting estimated demand.
A program called "feedback" does the comparison between previous and current model iterations. This is a C-based program that compares both link and trip-table based volumes of the current and past iterations. In order to pass, 90 percent of the current set of link volumes and district-to-district volumes must be within 10 percent of the average of the previous iterations' corresponding links or cells. Volumes below a specified minimum are ignored. Both link and trip-table based data must pass before the model is declared converged. If these criteria are not met, the program increments a system variable, called iter, by one. If the criteria are met, the system variable iter is set to 0, and another system variable, liter is set to the last iteration. The liter variable is used in the final highway and transit assignment steps to tell the programs where to find the latest trip table information.
To accommodate the feedback routine, the master program control file, run_ompo.bat has been modified to automatically loop back through the model as long as the feedback program indicates that convergence has not been reached. In addition, after each iteration, reports and output files specific to that iteration are moved to an iteration-specific subdirectory within each major model subdirectory. This iteration-specific subdirectory is named 1, 2, 3, etc, based on the iteration being stored. For example, in the mode choice subdirectory, mc, subdirectories 1,2 and 3 will exist after the model run that converges after 3 iterations. In application, while there is no need to delete these subdirectories for each new alternative run, it is probably a good idea, since all the files will be overwritten, and it will avoid confusion.
Shown below is the main DOS command file used to implement feedback. Note that a maximum of 30 iterations are allowed. The base year model converges after 3 iterations. Also note that the system variable, iter, is initially set to 1, a requirement. The run_ompo.bat file is invoked by typing run_ompo <alt> at a dos prompt, where <alt> is the 3-letter alternative designator.
The final two exhibits show the feedback control file, and a user's guide to the parameters.
Parsons
Introduction Brinckerhoff
A-3
AR00064338

OMPO Model Development Project
User's Guide to Model Application
rem OMPO Travel Demand Models set alt=%1 set iter=1 rem Build Highway Network cd hwybld call hwybldal %1 rem Highway Paths and Skims cd ..thwy call skall %1 rem Transit Paths and Skims cd ..\trn call skall %1 rem Auxiliary Paths and Skims cd call skall %1 rem Trip Generation cd ..\tg call tgall %1 Ibioop rem Trip Distribution cd ..\td call tdall %1 rem Mode Choice cd ..\mc call mcall %1 rem Time of Day cd ..\tod call dfall %1 rem Airport Access Trips cd call apall %1 rem Visitor Trips cd call visnew %1 rem Truck Trips cd ..\trk call trkall %1 rem 2-hr AM and 16-hr off-peak assignment cd ..thwy call asall2 %1 rem feedback processing cd ..\fdb call fdbck %1 if %iter% == 0 goto Mend if %iter% == 31 goto Mend rem re-build highway network with cong speeds call rebuild %1 rem congested skims for highway call skhall %1 rem congested skims for transit call sktall %1 rem Auxiliary Paths and Skims cd call skall %1 goto Thloop :filend • rem Highway Assignment and Reporting cd ..thwy call asall %1 rem Transit Assignment and Reporting cd ..\trn call asall %1 rem MODEL STREAM COMPLETE
Parsons
Introduction Brinckerhoff
A-4
AR00064339

OMPO Model Development Project
User's Guide to Model Application
[FILES] Loaded Network=amLoad.txt InputMatrix=amDist.txt InputPreyiousMatrix=amPrey.txt InputLogFile=curram.log NewSpeedCapacity=.A.Agenericthwy \luxxxxau.def VdfScriptFile=ydxxxxau.con ReportFile=fdbackam.report OutputNetwork=amNext.txt OutputLogFile=nextam.log OutputBatchFile=setIteration.bat
[PARAMETERS] OdPercentComply=90 OdPercentTolerance=10 OdIgnoreLessThan=100 Volume PercentComply=90 VolumePercentTolerance=10 Volume IgnoreLessThan=50 MatrixDimensions=25 NumberFacilityTypes=10
[OPTIONS] Use0d=true UseVolumes=true UseWeights=false UseTollVariables=false PrintPercentRange=5 AyerageAllThenCurrent=true AkcelikVdf=false ConicalVdf=true ReadScriptVdf=false
[WEIGHTS] Weightlteration01=1.00 Weightlteration02=1.00 Weightlteration03=1.00
Weightlteration30=1.00
[AKCELIK] Time Parameter=0.25 JaFacilityType01=0.8 JaFacilityType02=0.8 JaFacilityType03=1.6 JaFacilityType04=3.2 JaFacilityType05=3.2 JaFacilityType06=6.4 JaFacilityType07=12.8 JaFacilityType08=12.8 JaFacilityType09=0.8 JaFacilityType10=12.8
[CONICAL] AlphaFacilityType01=10.0 AlphaFacilityType02=6.5 AlphaFacilityType03=5.2 AlphaFacilityType04=5.2 AlphaFacilityType05=5.2 AlphaFacilityType06=4 AlphaFacilityType07=10.0 AlphaFacilityType08=5.3 AlphaFacilityType09=-10.0 AlphaFacilityType10=10.0
Parsons
Introduction Brinckerhoff
A-5
AR00064340

OMPO Model Development Project
User's Guide to Model Application
[NOTES] 03/01/06 [dto] 0. The "readVdfScript" routine is not yet ready to be used 1. The "weights" only apply to the volumes in the log file. The weight applied to the current iteration, in the loaded network file, is always 1.00. 2. The free-flow speed for each of the links is assumed to be in the "spdc" variable and the feedback program does not see speed changes made during assignment.
Brief User's Guide:
1. Files Section a. Loaded Network -- a text version of the am loaded highway network (produced by outNet.set) b. Input Matrix -- a text version of the O/D matrix used to load the am highway network, compressed into a district-to-
district matrix (produced by outMat.set) c. Input Previous Matrix -- Input Matrix from previous "feedback" runs d. Input Log File -- Input Log File from previous "feedback" runs e. New Speed Capacity -- Input file of MinuTP format updates to speed/capacity table f. VDF Script File -- Input file from assignment script to read VDF functions (not yet ready), vdxxxxau.con g. Output Network -- a text output network, contains the same variables as Loaded Network, with the volume,
congested time, and congested speed replaced with computed values from the successive averages method h. Output Log File --A log file of link volumes (does not contain the output, calculated volume) i. Output Batch File -- MS DOS batch file used to reset the "iter" DOS environment variable j. Report File -- Re-states the input and gives information about the model run
2. Parameters Section a. O/D Percent Comply -- This share of the O/D Matrix cells must meet the Percent Tolerance Criteria b. O/D Percent Tolerance -- Change from one iteration to the next of O/D Matrix cells must be less than
this value to count towards compliance c. O/D Ignore Less Than -- O/D Matrix cells less than this value are not checked for compliance d. Volume Percent Comply -- Same as O/D for the link volumes e. Volume Percent Tolerance -- Same as O/D for the link volumes f. Volume Ignore Less Than -- Same as O/D for the link volumes g. Matrix Dimensions -- Number of Districts, O/D Matrix cells in "Input Matrix" h. Number Facility Types -- Number of Facility types used in the Akcelik section
3. Options Section a. Use O/D -- If "true", the O/D test will be applied b. Use Volumes -- If "true", the volumes test will be applied (Loaded Network still required) c. Use Weights -- If "true", iteration weights, as discussed in next section, will be used d. Print Percent Range -- The report file summarizes the O/D and Volume Errors by this increment,
from 0 to 100 percent e. Average All Then Current -- If "true" (Use Weights must then be false), the volumes of the previous
iterations are averaged, and that value is then averaged with the current volume f. Akcelik VDF If "true", Akcelik vdf functions are used With Akcelik parameters specified in that section g. Conical VDF If "true", Conical vdf functions are used With Conical parameters specified in that section h. Read VDF Script -- If "true", vdf functions are read from the Input scrips (Not yet ready to be used) i. Use Toll Variables -- If "true", the link Files are read and written assuming the toll variables are present,
(in the future year) and not present If false (in the Base Year)
4. Weights Section a. Each of the "WeightlterationXX" variables is applied to the volume in the XX iteration, to allow different iterations to
carry more weights than the others. To implement the weights, b. you will need a separate control file for each of the "feedback.exe" runs, and the batch file, "FDBCK.BAT" would
have to modified. c. The maximum number of weights is 30.
5. Akcelik Section a. Contains the parameters of the Akcelik volume-delay functions. These values may or may not be the same as
those used in the AM Assignment. They will differ if we want to change the feedback speed, to allow for quicker closure.
b. A Ja value of 3.2 is used for facility types greater than Number Facility Types in the parameter section. c. If a negative Ja value is specified, the new congested time will be set to the old congested time.
6. Conical Section a. Contains the parameters of the Conical volume-delay functions. These values may or may not be the same as
those used in the AM Assignment. They will differ if we want to change the feedback speed, to allow for quicker closure.
b. A alpha value of 10.0 is used for facility types greater than Number Facility Types in the parameter section. c. If a negative alpha value is specified, the new congested time will be set to the old congested Time (For fixed Time
Links).
Parsons
Introduction Brinckerhoff
A-6
AR00064341

1 LAND USE
1'
1 f I TRANSIT NETWORK H
I
VEHICLE OWNERSHIP
TRIP GENERATION
TRIP DISTRIBUTION
I VISITORS
I AIRPORT
TRUCK
I
MODE CHOICE _I
I TIME-OF-DAY/ DIRECTION
ACCESS ANALYSIS
OMPO Model Development Project User's Guide to Model Application
Figure 1
r
HIGHWAY NETWORK
I HIGHWAY ASSIGNMENT I I TRANSIT ASSIGNMENT I
LI SPEED CHECK/ UPDATE I I
TRANSIT REPORTING I
I HIGHWAY REPORTING I Legend
Trips and Impedances LogSums
Feedback Loops
Parsons Brinckerhoff A-7
Introduction
AR00064342

OMPO Model Development Project User's Guide to Model Application
1.3 Directory Structure and File Naming
Correct operation of the travel models depends on a specified directory structure and set of file-naming conventions. This directory structure serves to uniquely identify the location of files for each analysis year and alternative. The directory structure is described below and displayed in Figure 2.
Example dir Models
main ModelsIgeneric Modelslaltname Modelslaltnamelzd Modelslaltnamelhwybld ModelslaltnamelhwybldIdata Modelslaltnamelhwybldlatype Modelslaltnamelhwybldlmakeclas Modelslaltnamelhwy Modelslaltnamelhwyldata Modelslaltnameltm Modelslaltnameltmlacc Modelslaltnameltmldata Modelslaltnamelaxl Modelslaltnameltg Modelslaltnameltd Modelslaltnamelmc Modelslaltnameltod Modelslaltnamelair Modelslaltnameltrk Modelslaltnamelvis
Directory models location
common to all application scenarios, including programs specific alternative zonal data highway network records highway link and node data
zonal data highway link records highway networks, skims, assignments, and reports highway network penalty records transit networks, skims, assignments, and reports transit access-link development transit line records auxiliary-mode (walk, bike) networks and skims socioeconomic and trip-generation files trip-distribution files mode-choice files time-of-day/direction files airport access trips files truck trip files visitor trip files
Standard file name: ffttppdd.zzz
where: ff tt pp dd zzz
Extension: .eqv .ctl .rpt
Components
ff nt lu sk pe pp
= file type = time period = trip purpose = details = alternative designator
= equivalency file = application control file = application report file
network (details indicate which kind) look-up table skim (impedances) person-trip ends person-trip table in production/attraction format
Parsons
Introduction Brinckerhoff
A-8
AR00064343

OMPO Model Development Project User's Guide to Model Application
po person-trip table in origin/destination format vp vehicle-trip table in production/attraction format vo vehicle-trip table in origin/destination format zd zonal data kf k-factors tp turn penalties tl trip-length frequency distributions vd volume-delay functions as assignment sl screenline df directional factoring tb transit boards tn transit network ts transit network, sorted
tt am am-peak md mid-day pm pm-peak ev evening tt each time period pk peak periods op off peak periods )o( not time-period-specific
pp wh journey-to/from -work, home-based work wo journey-to/from -work, home-based other wn journey-to/from -work, non-based ww journey-to/from-work, work-based aw journey-at-work, work-based an journey-at-work, non-based nk not-work-related, home-based k-12 school nc not-work-related, home-based college ns not-work-related, home-based shop no not-work-related, home-based other nn not-work-related, non-home-based wp all work-related trip purposes np all non-work-related trip purposes pp each trip purpose )o( not trip-purpose-specific wf worker-flow table
details 01 occupancy 1 02 occupancy 2+ hw/au highway/auto hu highway network - unloaded hl highway network - loaded wb walk-to-bus wr walk-to-rail dt drive-to-transit tr transit mm each mode
Parsons
Introduction Brinckerhoff
A-9
AR00064344

OMPO Model Development Project User's Guide to Model Application
nm non motorized bk bike wk walk kr kiss-n-ride dr drive ca capacity hi household income hs household size hv household vehicle-ownership is household income by size pr production rates ar attraction rates aa attraction rates by area type sq squeezed (district-level) information, not zone-level )o( no details ae accessibility to employment h3 households as joint distribution by size, income, and number of workers
Parsons
Introduction Brinckerhoff
A-10
AR00064345

AR00064346
X
CD
0 0
LU
0
CD
CNA CD s-
i- = < 0
0
CD
LU 0 0
0
0
CD
CD
CD
Use
r's
Gu
ide
to M
ode
l App
licat
ion
OM
PO
Mo
del D
eve
lop
men
t Pro
ject
Intr
odu
ctio
n
i- < 0
MA
KE
CLA
S

OMPO Model Development Project User's Guide to Model Application
1. Highway Network Building
1.1 Purpose
The analyst may wish to build the highway network starting with a non-binary MINUTP network or simply a map. This basic information can be used to build a MINUTP network given a set of programs, described in this section, and some zone level data. This section describes the three programs used in this highway building procedure. It will also describe the batch file process of invoking the programs and the directory structure required for invoking the programs.
The first section discusses program ATYPE, which classifies the traffic analysis zones into 8 categories depending on the population and employment density of the zone.
The second section discusses program MAKECLAS that uses a set of highway link records and the area type definition to produce a set of highway link records with the required data fields required for this set of travel demand procedures.
The third section discusses program procedure ATRHVVY.set with uses the highway link records, from program MAKECLAS, to build a MINUTP binary highway network.
The fourth and final section discusses the directory structure required and the batch file used to run the programs as a complete procedure.
1.2 Program AREA TYPE (ATYPE)
This program reads the land use data and a set of zone level coordinates and produces a zone level file containing the area type of the zone, as described in the Build Highway Procedures section of the documentation.
Input Files:
Area Definition file (ATMAT2.csv) Coordinate file (zone level file) (e.g. BASEXY.dat) Land Use data file (zone level file) (e.g. SUMM764.dat)
Output File: Zone level file with area type (ATYPEYock.bd)
Report File: ATYP E % %. rpt
Program Files: ATYPE.ctl (control file) ATYPE.exe Program (FORTRAN)
Source Code: ATYPE.for
1.2.1 Control File
To run the program the analyst must build a control file. This file can have a set of title records to identify the run. The file must have three logical records (which may be many physical records). These logical records are: (1)a &files record which specifies the input and output files; (2) a &specs record which specifies the parameters and options for the program; and (3) a
Parsons
Transportation System Models Brinckerhoff
Highway Network Building B.1-1
AR00064347

OMPO Model Development Project User's Guide to Model Application
&classes record which specifies the employment and population "breaks" for the density categories. Each of these records must start with an "&files" (or &specs or &classes) and end with a "/". Between the &000( and the / can be many records. Between the &oo( and the / are also the keywords which control the program. The keywords are specific words which the program recognizes and the value after the "keyword = " is the value assigned to the keyword.
The keywords for the &files record are:
1. fn_atdef: This is the name of the area definition file. The name must be enclosed in single quotes.
2. Fn_xycrd: This is the name of the coordinate file.
3. Fn_demog: This is the name of the land use file
4. Fn_out: This is the name of the output file containing the zone level data
5. Fn_rpt: This is the name of the report file.
An example of this logical record is as follows:
&files fn atdef fn xycrd fn—demog fn out fn_rpt
= Tatmat2.csv' = 'basexy.dat' = 'summ764.dat' = 'atype95.txt' = 'atype95.rpt'
The keywords for the &specs record are:
1. Coordcnv: This is the factor to convert the coordinates to miles. The coordinates are divided by this value to obtain coordinates in miles. This value will default to 52.8. Be careful about this parameter. Normally the x and y coordinates are obtained using the MI NUTP coordinates and these may not have any specified units. For example in the base year, the conversion parameter was 790.20.
2. Max_zone: This is the maximum number of traffic analysis zones in the region. For the base year this was 764 zones.
3. Radius: This is the radius (in miles) that will be used to estimate the densities for a traffic analysis zone. For the base year this value was 0.5. Do not change this keyword variable unless the area type model has been revised.
4. Num_class: This is the number of classes for the employment and population densities. In the base year the number of classes was 8. Do not change this keyword variable unless the area type model has been revised.
5. Year: This is the year of the forecast. See the next keyword for a more detailed description.
6. Base: This is the base year. If both these years (year and base) have the same value then employment 1 and population 1 (see land use data file) will be used. If the two years are
Parsons
Transportation System Models Brinckerhoff
Highway Network Building B.1-2
AR00064348

OMPO Model Development Project User's Guide to Model Application
different, then employment 2 and population 2 will be used. Note this was simply a method of allowing the user to place the base year data and the future year data on one file and use the future year data for the analysis. Normally the analyst will simply code both years the same number and use employment and population 1 on the lane use data. The default value for these keywords is 1995.
7. Debug: If this keyword is set to true (t or T) then the report file will contain zone level data. The default is false (F).
An example of this logical record is as follows:
&specs coordcnv = 790.20 max zone = 764 radius = 0.50 num class= 8 year = '1990' base = '1990' debug = F
The keywords for the &classes record are:
1. Eclass: This is a set of eight values (separated by commas) that show the break points for the employment categories.
2. Pclass: This is a set of eight values that show the break points for the population categories.
An example of this logical record is as follows:
&classes eclass = 12. , 93., 397., 1615., 6202., 22630., 78500., 900000. pclass = 0.1, 192., 1623., 4975., 11588., 24000., 42866., 200000.
The values shown on the example should always be used in the application of the program, unless the area type model has been revised.
1.2.2 Input File Descriptions and Formats
Area Definition File (ATMAT2.csv)
This is a card image file containing the area types for each employment density and population density category. There are eight records in this file, one for each employment category. Each record has nine values, separated by a comma. The first value of the record is the employment category. The next eight values of the record are the area type for the eight population density categories, in order. This file should look like this:
Parsons
Transportation System Models Brinckerhoff
Highway Network Building B.1-3
AR00064349

OMPO Model Development Project
User's Guide to Model Application
1,8,8,7,6,4,4,2,1 2,8,8,6,6,4,4,2,1 3,7,7,7,6,4,4,2,1 4,7,7,7,7,4,4,2,1 5,5,5,5,5,5,4,2,1 6,5,5,5,5,5,5,2,1 7,3,3,3,3,3,3,3,1 8,3,3,3,3,3,3,3,1
The employment categories and population density categories that define each area type are as follows:
Area-Type Definitions Based on Population and Employment Densities
Employment Category
(Employees per Square Mile)
1
<12
2
<93
3
<397
4
1,615
5
6,202
6
22,63 0
7
78,50 0
8
>78,50 0
Population Category (Population per Square Mile)
1 0 8 8 7 6 4 4 2 1 2 192 8 8 6 6 4 4 2 1 3 1,623 7 7 7 6 4 4 2 1 4 A,975 7 7 7 7 4 4 2 1 5 11,588 5 5 5 5 5 4 2 1 6 24,000 5 5 5 5 5 5 2 1 7 A2,866 3 3 3 3 3 3 3 1 8 >42,866 3 3 3 3 3 3 3 1
Coordinate File (BASEXY.dat)
This is a card image file containing the coordinates for each zone. There should be one record per zone in this file and each record should have the following data:
Columns Description Format
1-6 Zone Number 16
7-14 MINUTP X coordinate F8.0
15-22 MINUTP Y coordinate F8.0
Land Use Data File (SUMM764.dat)
This is a card image file containing the population, employment and area for each zone. There should be one record per zone in this file. Each record should have the following data:
Parsons
Transportation System Models Brinckerhoff
Highway Network Building B.1-4
AR00064350

"id","xcoor" ycoor","pop","emp","area","pden","eden","atype" 1,32760. , 2812., 714., 25., .5821, 1227., 43., 7 2,32130. , 3103., 1194., 25., .9689, 1232., 26., 7 3,32126. , 2504., 238., 25., .2424, 982., 103., 7
OMPO Model Development Project User's Guide to Model Application
Columns Description Format 1-16 Zone Number 116
17-22 Employment 1 16 23-28 Employment 2 16 29-34 Population 1 16 35-40 Population 2 16 41-50 Area (Sq. Miles) F10.4
There are two employment categories and two population categories. These are intended to be the employment (population) for the base year (category 1) and for the future year (category 2). Only one of these categories will be used in the program and it is suggested that the population and employment for the forecast year be placed in the first category (employment 1 and population 1). The use of the 1 and 2 categories will be described in the keyword section. The area must be in square miles. The format in the program is F10.4 but if the decimal point is coded in the record any number of decimal points is allowed (as long as the total number is within columns 41 to 50.
1.2.3 Output File Description and Format
Zone Level File with Area Type (ATYPE°/e/o.dat)
This is a card image file containing the land use data, coordinates, area, density measures and area type for each zone. The file contains a header record specifying the data on each record, followed by a record for each zone. The zone records contain nine variables that are separated by commas. The nine variables are: (1) zone number; (2) X coordinate; (3) Y coordinate; (4) population; (5) employment; (6) area; (7) population density; (8) employment density; and (9) area type. An example of this file is shown below:
1.2.4 Report File (ATYPE°/e/o.rpt)
The report file will provide the analyst with a summary of the density categories and of the zones in each of the area types. If the analyst sets the keyword debug to true (T), the report will also provide a listing of the zone level data. The report looks like:
Parsons
Transportation System Models Brinckerhoff
Highway Network Building B.1-5
AR00064351

Summary of Results
Area Type Total 1 36 2 65 3 61 4 72 5 275 6 45 7 163 8 45 9 0
10 0 999 0
OMPO Model Development Project
User's Guide to Model Application
1.3 Program MAKECLAS
This program reads a set of highway link records and the area type, by zone, and produces a set of highway link records update with speed and capacity codes.
Input Files: Zone level file with area type (from pgm ATYPE) (ATYP E% % b(t) Highway Network link records Highway Network node files Free Flow Speed Table Capacity Table Congested Speed Table Transit Factor Table
Output File: Updated Highway link records
Report File: MAKECLAS.rpt
Program Files: MAKECLAS.ctl (control file) MAKECLAS.exe Program (FORTRAN)
Source Code: MAKECLAS.for
1.3.1 Control File
To run the program the analyst must build a control file. This file can have a set of title records to identify the run. The file must have two records (which may be many physical records). These logical records are: (1) a &files record which specifies the input and output files; (2) a &options record which specifies the one option for the program,and (3) a ¶ms record which specifies the number of zones and a coordinate conversion factor. Each of these records must start with an "&files" (or &options) and end with a "&end". Between the &)000( and the &end can be many records, containing the keywords which control the program. The keywords are specific words which the program recognizes and the value after the "keyword = " is the value assigned to the keyword.
The keywords for the &files record are:
Parsons
Transportation System Models Brinckerhoff
Highway Network Building B.1-6
AR00064352

&files fatypein ffspdcin fcspdcin facapcin fmdspcin flinkin fnodein flinkout freport
&end
= '..\atype\atype95.txt' = 'fsped.hnl' = 'csped.hnl' = 'acapa.hnl' = 'amdsp.hnl' = '..\data\hnttlink.bas' = '..\data\hnttnode.basf = 'hnttlink.zzz' = 'makeclas.rpt'
OMPO Model Development Project User's Guide to Model Application
1. Fatypein: This is the name of the zone level data with the area code. The name must be enclosed in single quotes. Since this file is normally built by program ATYPE the standard coding for this file is rAATYPDATYPE/0%.b(f
2. Ffspdcin: This is the name of the file for the freeflow speed codes. If the program is applied using the standard approach this file would be coded as `FSPED.hnl'
3. Fcspdcin: This is the name of the file of the congested speed codes. If the program is applied using the standard approach this file would be coded as `CSPED.hnr.
4. Facapcin: This is the name of the file for the capacities codes. If the program is applied using the standard approach this file would be coded as rACAPA.hnr.
5. Fmdspcin: This is the name of the file for the transit factors. If the program is applied using the standard approach this file would be coded as rAMDSP.hnr.
6. Flinkin: This is the name of the file for the input highway network links. If the program is applied using the standard approach this file would be coded as r..\DATA\HNTTLINK.bas'
7. Fnodein: This is the name of the file for the input highway network nodes. If the program is applies using the standard approach this file would be coded as r..\DATA\HNTTNODE.bas'
8. Flinkout: This is the name of the output file for the highway link records. If the program is applied using the standard approach this file would be coded as rl-INTTLINK.%%%'
9. Freport: This is the name of the output file for the report.
An example of this logical record is as follows:
The keywords for the ¶ms record are:
1. max_zon: This identifies the maximum zone number in the network. Currently, it is 764.
2. coordcnv = This is the coordinate conversion factor, used to calculate the zone number of the link, based on node coordinates. It is currently 790.20 and should not be changed.
Parsons
Transportation System Models Brinckerhoff
Highway Network Building B.1-7
AR00064353

OMPO Model Development Project
User's Guide to Model Application
An example of this logical record is as follows:
¶ms max_zone = 764 coordcnv = 790.20
&end
The keyword for the &options record is:
1. Hovfix: This is a logical variable (i.e. either f or t). If the keyword is t, the program will look for the letters HOV in the name field (there can be other letters in the name field) and make the link a facility type 13 link. In which case the analyst must have included speed and capacity values for this facility type in the speed and capacity tables. The normal procedure is to have HOV lanes as facility types 1 (freeways) or 3 (expressways) and limit the vehicles using the limit codes.
An example of this logical record is as follows:
&options hovfix = f
&end
1.3.2 Input File Descriptions and Formats
Zone Level File with Area Type (ATYPE°/e/o.txt)
This is the zone level output file from program ATYPE.
Highway Network Link Records
This is a card image file containing the basic data for the highway links. This is a standard MINUTP link record and the format of the record is shown on Table 1.1
The Free Flow, Capacity, Congested Speed, and Transit Factor Tables
These tables allow the program to insert the speed and capacity codes into the link records based on area type and facility type. These tables are described in more detail below. The user would normally use the tables provided in the base procedures of the model set, unless the assignment procedures have been modified.
Free Flow Speed Table (FSPED.hnl)
The format of the free flow speed table records is as follows:
Field Columns Description Format 1 1 Card Number (always a 1 for free flow speed) II 2 2-6 Facility Type (1 to 13) (for following speed codes) 15
Parsons
Transportation System Models Brinckerhoff
Highway Network Building B.1-8
AR00064354

OMPO Model Development Project
User's Guide to Model Application
3 7-11 Speed code for area type 1 15 4 12-16 Speed code for area type 2 15 5 17-21 Speed code for area type 3 15 6 22-26 Speed code for area type 4 15 7 27-31 Speed code for area type 5 15 8 32-36 Speed code for area type 6 15 9 37-41 Speed code for area type 7 15
10 42-46 Speed code for area type 8 15
Free Flow Speed records used in standard application of model are as follows:
1 01 60 61 61 62 62 63 63 63
1 02 54 57 58 59 60 60 61 61
1 03 25 25 25 37 37 41 45 47
1 04 25 25 25 34 35 40 42 47
1 05 25 25 25 32 33 37 40 47
1 06 25 25 25 30 30 35 39 46
1 07 25 25 25 28 28 33 38 45
1 08 12 17 18 19 20 25 30 32
1 09 50 50 51 51 52 52 55 57
1 10 25 30 30 30 30 35 35 37
1 12 12 17 18 19 20 25 30 32
Note: The MINUTP speed codes have a maximum value of 63. For speeds higher than this, the speeds are entered using the SPED keyword in the assignment setups.
Parsons
Transportation System Models Brinckerhoff
Highway Network Building B.1-9
AR00064355

OMPO Model Development Project
User's Guide to Model Application
Table 1.1 Format of the Highway Record (as a card image)
Name Column Description Source (1) A-Anode 1-5 Standard A node U B-Bnode 6-10 Standard B node U
DIR 12 User specified (not required) U DIST 14-17 Distance of link (implied decimal xxio() U TSIN 18 Speed — Time indicator (T/S/) U
TSVA 19-21 Time (x.xx) or speed (xx.x) U SPDC 23-24 Speed Class P CAPC 26-27 Capacity Class P LANE 29 Number of lanes (maximum of 7) U CNT 31-33 Count on link U REV 35 Reverse indicator (1 for one way) U
FACTYPE 37-38 Facility Type (3) U FNCLASS 40 Function Class(5) U
LANEA 42 Number of lanes in the morning peak U LANEM 44 No. of lanes in the mid-day (off-peak) U LANEP 46 No. of lanes in the evening peak U LIMITA 48 Restrictions for the morning peak (2) U LIMITM 50 Restrictions for the off-peak (2) U LIMITP 52 Restrictions for the evening peak (2) U
SCRNLN 54-56 Screenline number (not required) U NAME 74-93 Name of Highway U
UPD 94-95 U ZONE 96-99 The zone the link is in P
CSPDC 100-102 Congested Speed Table P MDSPC 103-105 Speeds used in the transit network (4) P ATYPE 106-108 The area type the link is in P
(1) The U stands for user input and the P stands for input by programs (such as MAKECLAS). All fields with a U must be coded prior to running program MAKECLAS.
(2) There can be four "legal" restriction values that are: 1 — meaning all vehicles can use link; 2- single occupancy vehicles and trucks are prohibited (i.e. HOV 2+ lanes); 3 — single occupancy vehicles, vehicles with 2 occupants and trucks are prohibited (HOV 3+ lanes and 6 — trucks prohibited. Codes 4, 5, 7, 8, and 9 can be used for links that are not used in the highway skim building or assignment process. For example code 8 is usually used to show roadway links needed for the transit network but not the highway network (transit support links). For the base year code 4 represents bus and transit only links, code 5 represent bus / transit / bike / and walk links, and code 7 represent bike and walk links.
(3) The facility codes are: 1 — Freeways; 2 — Expressways; 3 — Class! arterials; 4 — Class!! arterials; 5 — Class III arterials; 6 — Class! collectors; 7 — Class!! collectors; 8 — local streets; 9 — High speed Ramps; 10— Low Speed Ramps; 12— centroid connectors; 13— HOV lanes.
(4) These speeds were intended to be used as mid-day speeds but are not used in the present application.
(5) The funclass codes are: 1=freeway;2=expressway;3=principal arteria1;4=minor arteria1;5=major collector;6=minor collector;7=local;8=freeway ramp;9=centroid connector
Parsons
Transportation System Models Brinckerhoff
Highway Network Building B.1-10
AR00064356

OMPO Model Development Project User's Guide to Model Application
Congested Speed Table (CSPED.hnl)
To begin the travel demand process, an estimate of congested times is required. In this case, representative speeds, developed from previous analyses, should be used. This table contains these representative congested speeds. The format of the congested speed table records is the same as the free flow speed table records, except to use a "2" in column 1.
Congested Speed records used in standard application are as follows:
2 01 24 30 30 45 45 63 63 63 2 02 22 24 24 30 30 37 37 42 2 03 19 22 22 25 25 37 37 42 2 04 16 17 17 20 20 28 28 40 2 05 14 16 16 18 18 24 24 37 2 06 12 15 15 17 17 21 21 35 2 07 09 12 12 15 15 21 21 31 2 08 09 12 12 15 15 20 20 25 2 09 12 15 15 18 18 24 24 34 2 10 06 09 09 12 12 18 18 28 2 12 09 12 12 15 15 20 20 25
Capacity Table (ACAPA.hnl)
The format of the capacity table records is as follows:
Field Columns Description Format 1 1 Card Number (always a 3 for capacity) II 2 2-6 Facility Type (1 to 13) (for following capacities) 15 3 7-11 Capacity for area type 1 (vehicles / lane / hour) F5.0 4 12-16 Capacity for area type 2 (vehicles / lane / hour) F5.0 5 17-21 Capacity for area type 3 (vehicles / lane / hour) F5.0 6 22-26 Capacity for area type 4 (vehicles / lane / hour) F5.0 7 27-31 Capacity for area type 5 (vehicles / lane / hour) F5.0 8 32-36 Capacity for area type 6 (vehicles / lane / hour) F5.0 9 37-41 Capacity for area type 7 (vehicles / lane / hour) F5.0
10 42-46 Capacity for area type 8 (vehicles / lane / hour) F5.0
Capacity records used in standard application of model are as follows:
3 01 2200 2200 2200 2200 2200 2200 2200 2200 3 02 1500 1550 1550 1550 1600 1650 1750 1850 3 03 1100 1100 1150 1150 1200 1300 1400 1450 3 04 1050 1050 1100 1100 1150 1200 1250 1350 3 05 1000 1050 1050 1050 1100 1150 1200 1300 3 06 850 850 850 850 900 950 1000 1050 3 07 650 700 700 700 750 800 850 950 3 08 650 700 700 700 750 800 850 950 3 09 1600 1700 1800 1800 1900 1900 2000 2000 3 10 400 400 450 450 500 500 600 650 3 12 3150 3150 3150 3150 3150 3150 3150 3150
Note: The capacities on the table are vehicles per lane per hour. The program will divide these capacities by 50 to obtain MINUTP capacity codes.
Parsons
Transportation System Models Brinckerhoff
Highway Network Building BA-11
AR00064357

OMPO Model Development Project
User's Guide to Model Application
Transit Factor Table (AMDSP.hnl)
The format of the transit factor table records is as follows:
Field Columns Description Format 1 1 Card Number (always a 4 for transit factor) 11 2 2-6 Facility Type (1 to 13) (for following factors) 15 3 7-11 Transit Factor for area type 1 F5.0 4 12-16 Transit Factor for area type 2 F5.0 5 17-21 Transit Factor for area type 3 F5.0 6 22-26 Transit Factor for area type 4 F5.0 7 27-31 Transit Factor for area type 5 F5.0 8 32-36 Transit Factor for area type 6 F5.0 9 37-41 Transit Factor for area type 7 F5.0
10 42-46 Transit Factor for area type 8 F5.0
These factors are not used in the normal application procedures. The factors are used in the program MAKECLAS to place a value in the MDSPC field of the highway link, using the formula: MDSPC = ((Factor — 1.0)! 0.025) + 1.5. At one time this was to be the mid-day transit speed, but the present application does not use this formula or this field.
1.3.3 Output File Descriptions and Formats
Updated Highway Link Records (HNTTLINK.zzz)
This is a card image file containing the updated highway link records. It has the same format as the input highway link records, except the area type and the speed and capacity codes have been added to the record. The updated variables are shown with a P in the last column of the list of variables in Table 1.1.
1.3.4 Report File (MAKECLAS.rpt)
The report file will provide the analyst with very little value. It will print out speed and capacity codes that exceed the limit. These error messages will also be printed when a facility type is not included in the input data (such as facility type 11, which is a null facility type). It will always list at least 40 errors that are the specifications for facility type 11. Check the report if there are more than 40 errors.
1.4 Program Procedure ATRHWY.set
This program procedure calls the MINUTP programs netbld and netmrg to build the basic binary MINUTP highway network for the travel demand procedures.
Input Files: Updated Highway Link Record File Node Coordinates
Output File: MINUTP binary highway network
Report File ATRHVVY.prn
Parsons
Transportation System Models Brinckerhoff
Highway Network Building B.1-12
AR00064358

OMPO Model Development Project User's Guide to Model Application
Program Files: NETBLD.exe (MINUTP) NETMRG.exe (MINUTP)
1.4.1 Control File
The control file must be named ATRHVVY.set. It will call the highway link records from directory MAKECLAS and the node list from the HVVYBLD directory. The control file will name the output network hntb000c%%% where "%%%" is the three letter combination used when invoking the batch file.
An example of the control file is shown below:
$>del pcor*.dat >nul $>echo. > pcor07.dat
*pgm netbld 5000,764 lnku makeclas\hnttlink.%alt% xyf hnttnode.bas,n=1-6,x=7-12,y=13-18 def factype=37-38 def fnclass=40 def lanea=42 def lanem=44 def lanep=46 def limita=48 def limitm=50 def limitp=52 defa name=74-93 def upd=94-95 def zone=96-99 def cspdc=100-102 def mdspc=103-105 def atype=106-108
*pgm netmrg hnttxxxx.%alt%,pcor20.dat $ cvf991105 linktype= atypemod*10 + factypemod $ atypemod 1= atype 1,2,3; 2= 4,5; 3= 6,7,8 $ factypemod 1,2,3= factype 1,2,3; 4= 4,5; 5= 6,7,8,9,10,11,12 comp linktype=0 @ atype=1-3 comp linktype=10 @ atype=4-5 comp linktype=20 @ atype=6-8 comp linktype=30 @ factype=1-3 comp linktype=linktype+factype @ factype=4-5 comp linktype=linktype+4 @ factype=6-12 comp linktype=linktype+5 comp t.cnt=1. tab t.cnt,linktype=0-40 $>copy pcor*.prn atrhwy.prn >nul $>del pcor*.prn >nul $>del pcor20.dat >nul
Parsons
Transportation System Models Brinckerhoff
Highway Network Building B.1-13
AR00064359

OMPO Model Development Project User's Guide to Model Application
1.4.2 Input File Descriptions and Formats
Updated Highway Link Record File
This is the updated highway link record file from program MAKECLAS.
Node Coordinates
This is a standard MINUTP node coordinate file.
1.4.3 Output File Descriptions and Formats
Binary Highway Network (HNTTXXXX.°/e/e/o)
This is a MINUTP binary highway network.
1.4.4 Report File
ATRHVVY.prn: This report describes the highway network. It provides a list of the network variables and summary statistics about these variables. It also has a listing of the number of links by area type and facility type, using the following definition:
Link Type Definition for Build Highway Network Tabulation Area Facility Type
Type 1 2 3 4-5 6-12
1 — 3 11 12 13 14 15 4 — 5 21 22 23 24 25 6 — 8 31 32 33 34 35
An example of this listing is as follows:
LINKTYPE T.CNT
11-11 18 12-12 4 13-13 174 14-14 392 15-15 1202 21-21 236 22-22 102 23-23 222 24-24 512 25-25 3126 31-31 76 32-32 76 33-33 92 34-34 202 35-35 1142
7576
Parsons
Transportation System Models Brinckerhoff
Highway Network Building B.1-14
AR00064360

OMPO Model Development Project User's Guide to Model Application
1.5 Batch Application
The programs can be run by typing at the dos prompt "hwybldal %%%; where %%% is the suffix name for the alternative. This command invokes the batch file HVVYBLDAL.bat.
This batch file assumes the following directories and files:
1) That it is in directory HVVYBLD
2) That there are three subdirectories in directory HVVYBLD which are a) ATYPE b) DATA c) MAKECLAS
3) That in directory ATYPE there are the following files with the following names: a) ATYPE.exe — the executable for program ATYPE b) BASEXY.dat — the coordinates of the zones c) SUMM764.dat — the land use data d) ATYPE.ctl — the control file for program ATYPE Note: the user can change the names of BASEXY.dat and SUMM764.dat if the names are also changed in the control file
4) That in directory DATA there are the following files with the following names: a) HNTTNODE.bas — the node coordinate file for use in building the network b) HNTTLINK.bas — the input highway link records for program MAKECLAS
5) That in directory MAKECLAS there are the following files with the following names: a) MAKECLAS.ctl — the control file for program MAKECLAS b) MAKECLAS.exe — the executable for program MAKECLAS c) ACAPA.hnl — the capacity table file d) AMDSP.hnl — the transit factor table file e) CSPED.hnl — the congested speed table file f) FSPED.hnl — the free flow speed table file
6) That in the main directory (HVVYBLD) there will be the following file with this name: a) HVVYBLDAL. bat — the highway network building batch file
Parsons
Transportation System Models Brinckerhoff
Highway Network Building B.1-15
AR00064361

OMPO Model Development Project
User's Guide to Model Application
The main highway network batch file is shown below:
@echo off @echo Build highway base network rem rem set alt designator set alt=%1 rem rem get area type cd atype atype atype.ctl cd cd makeclas makeclas makeclas.ctl ren hnttlink.zzz hnttlink.%1 cd rem network call do atrhwy copy hnttxxxx.%1 ..\hwy\hnttxxxx.%1 @echo.
This batch file first calls program ATYPE, then program MAKECLAS. At this point it renames the network link records to HNTTLINK.%alt% (user specified suffix). It then calls program ATRHVVY. At this point it copies the binary highway network into the directory HVVY for later use.
Parsons
Transportation System Models Brinckerhoff
Highway Network Building B.1-16
AR00064362

OMPO Model Development Project User's Guide to Model Application
2. Highway Path-Building and Skimming
A single MINUTP setup file, HVVY\SKTTXXAU.set, builds best-paths from an input highway network and prepares skim files for use by the demand models. This setup builds six separate paths; for single-occupant vehicles or SOV, two-occupant vehicles or HOV2, and three-or-more-occupant vehicles or HOV3+; for time-periods AM-peak and midday.
2.1 Purpose
Path-building and skimming convert network information, comprised of nodes and links, into matrices of skimmed network characteristics. The models operate on zones and zone-to-zone interchanges. Therefore, network information must be summarized at that level for the models to access it. The path-building step searches the network to find the best paths from each node to each other node, with "best" defined in this case by minimum travel time. The best-path between a pair of zones consists of a series of nodes in the order traversed. The skimming step follows this best-path, accumulating link and node characteristics for each interchange.
The highway network variables skimmed for use by the demand models include travel time and distance. Separate best-paths for SOV, HOV2, and HOV3+ travel are built for each time-period. Characteristics of the AM-peak highway network represent all peak travel, while those of the midday network represent all off-peak travel.
2.2 Control File
2.2.1 Setup for Non-Toll Skims
The setup HVVY\SKTTXXAU.set contains two calls each to modules NETMRG and PTHBLD, and one call to MATRIX. The full text follows of HVVY\SKTTXXAU.set. For a detailed explanation of MINUTP syntax, see the MINUTP manual.
$ Honolulu Models $ hwy path building $ cvf990924
*pgm netmrg hnamxxcs.%alt%,hnttxxxx.%alt% comp lane=lanea @ lane=0 comp lane=1 comp spdc=cspdc *read ..\..\generic\hwy\luxxxxau.def
*pgm pthbld hnamxxcs.%alt%,103,1 *id hwy skims *unit 11=skpkxxau.tmp par impfac=0 $ set limits on links usable: 0= all modes, 1= no walk/bike, 2=hov2+, 3= hov3+ $ 4= bus/trn only, 5= bus/trn/bike/walk only, 6= no trucks, 7= bike/walk only $ 8= trn support link (bus only b/c not on hwy net) par flagvar=limita flagfac 1,0,P,P,P,P,O,P,P,P
Parsons
Transportation System Models Brinckerhoff
B.2-1 Highway Path-Building and Skimming
AR00064363

flagfac 2,0,0,0,P,P,0,P,P,P flagfac 3,0,0,0,0,P,0,P,P,P
penfile tpamxxau.%alt%,list=y,dupl=w,miss=w,form=n
*pgm netmrg hnmdxxfs.%alt%,hnttxxxx.%alt% comp lane=lanem @ lane=0 comp lane=1 comp spdc=spdc *read ..\..\generic\hwy\luxxxxau.def
*pgm pthbld hnmdxxfs.%alt%,103,1 *id hwy skims *unit 11=skopxxau.tmp par impfac=0 $ set limits on links usable: 0= all modes, 1= no walk/bike, 2=hov2+, 3= hov3+ $ 4= bus/trn only, 5= only $ 8= trn support link par flagvar=limitm flagfac 1,0,P,P,P,P,O,P flagfac 2,0,0,0,P,P,O,P flagfac 3,0,0,0,0,P,O,P
penfile tpmdxxau.%alt%,list=y,dupl=w,miss=w,form=n
*pgm matrix *unit 11=skpkxxau.tmp *unit 12=skopxxau.tmp *unit 14=skopxxol.%alt% *unit 15=skopxxo2.%alt% *unit 16=skopxxo3.%alt% *unit 17=skpkxxol.%alt% *unit 18=skpkxxo2.%alt% *unit 19=skpkxxo3.%alt% $ peak get 1,101-109 int 2,-50,c=2 int 3,-50,c=2 int 5,-50,c=2 int 6,-50,c=2 int 8,-50,c=2 int 9,-50,c=2 out 3,701 out 2,702 out 6,801 out 5,802 out 9,901 out 8,902 $ offpeak get 11,201-209 int 12,-50,c=2 int 13,-50,c=2 int 15,-50,c=2 int 16,-50,c=2 int 18,-50,c=2
bus/trn/bike/walk only, 6= no trucks, 7= bike/walk
(bus only b/c not on hwy net)
OMPO Model Development Project
User's Guide to Model Application
Parsons
Transportation System Models Brinckerhoff
B.2-2 Highway Path-Building and Skimming
AR00064364

OMPO Model Development Project
User's Guide to Model Application
int 19,-50,c=2 out 13,401 out 12,402 out 16,501 out 15,502 out 19,601 out 18,602
*>del *.tmp
2.2.2 Setup for Toll Skims
$ Honolulu Models $ hwy path building $ cvf990924 $ srr050724
*pgm netmrg hnamxxcs.%alt%,hnttxxxx.%alt% comp lane=lanea comp spdc=cspdc @ limita=10 tdistl=dist @ limita=11 tdist2=dist @ limita=12 tdist3=dist *read ..\..\generic\hwy\luxxxxau.def
*pgm pthbld hnamxxcs.%alt%,103,1 *id hwy skims *unit 11=skpkxxau.tmp par impfac=0 $ set limits on links usable: 0= all modes, 1= no walk/bike, 2=hov2+, 3= hov3+ $ 4= bus/trn only, 5= bus/trn/bike/walk only, 6= no trucks, 7= bike/walk only $ 8= trn support link (bus only b/c not on hwy net) $ 10= traditional toll, all vehicles tolled, including HOT lanes where all are tolled $ 11= hot lane where DA pays, 2-person and 3+-person autos are free $ 12= hot lane where DA, 2-person autos pay and 3+-person autos are free
$ paths: $ 1 = SOV, non-toll $ 2 = HOV2, non-toll $ 3 = HOV3+, non-toll $ 4 = SOV, toll $ 5 = HOV2, toll $ 6 = HOV3+, toll
par flagvar=limita flagfac 1,0,P,P,P,P,O,P,P,P,P,P,P flagfac 2,0,0,P,P,P,O,P,P,P,P,O,P flagfac 3,0,0,0,P,P,O,P,P,P,P,0,0 flagfac 4,0,P,P,P,P,O,P,P,P,0,0,0 tlagtac 5,U,U,P,P,P,U,P,P,P,U,U,U flagfac 6,0,0,0,P,P,0,P,P,P,0,0,0
AR00064365

OMPO Model Development Project User's Guide to Model Application
$ skim variables: $ to111: toll applied da $ to112: toll applied to $ to113: toll applied to $ tdistl: distance along $ tdist2: distance along $ tdist3: distance along
2-person Autos 3+-person Autos toll facilities applicable to all auto occupancies tolled HOT lanes for DA tolled HOT lanes for DA and 2-Person autos
skim to111,to112,to113,tdistl,tdist2,tdist3
penfile data\tpamxxau.%alt%,list=y,dupl=w,miss=w,form=n
*pgm netmrg hnmdxxfs.%alt%,hnttxxxx.%alt% comp lane=lanem comp spdc=spdc @ limitm=10 tdistl=dist @ limitm=11 tdist2=dist @ limitm=12 tdist3=dist *read ..\..\generic\hwy\luxxxxau.def
*pgm pthbld hnmdxxfs.%alt%,103,1 *id hwy skims *unit 11=skopxxau.tmp par impfac=0 $ set limits on links usable: 0= all modes, 1= no walk/bike, 2=hov2+, 3= hov3+ $ 4= bus/trn only, 5= bus/trn/bike/walk only, 6= no trucks, 7= bike/walk only $ 8= trn support link (bus only b/c not on hwy net) $ 10= traditional toll, all vehicles tolled, including HOT lanes where all are tolled $ 11= hot lane where DA pays, 2-person and 3+-person autos are free $ 12= hot lane where DA, 2-person autos pay and 3+-person autos are free
$ paths: $ 1 = SOV, non-toll $ 2 = HOV2, non-toll $ 3 = HOV3+, non-toll $ 4 = SOV, toll $ 5 = HOV2, toll $ 6 = HOV3+, toll
par flagvar=limitm flagfac 1,0,P,P,P,P,O,P,P,P,P,P,P flagfac 2,0,0,P,P,P,O,P,P,P,P,O,P flagfac 3,0,0,0,P,P,O,P,P,P,P,0,0 flagfac 4,0,P,P,P,P,O,P,P,P,0,0,0 flagfac 5,0,0,P,P,P,O,P,P,P,0,0,0 flagfac 6,0,0,0,P,P,O,P,P,P,0,0,0
$ skim variables: $ to111: toll applied da $ to112: toll applied to 2-person Autos $ to113: toll applied to 3+-person Autos $ tdistl: distance along toll facilities applicable to all auto occupancies $ tdist2: distance along tolled HOT lanes for DA
AR00064366
OMPO Model Development Project User's Guide to Model Application
$ tdist3: distance along tolled HOT lanes for DA and 2-Person autos
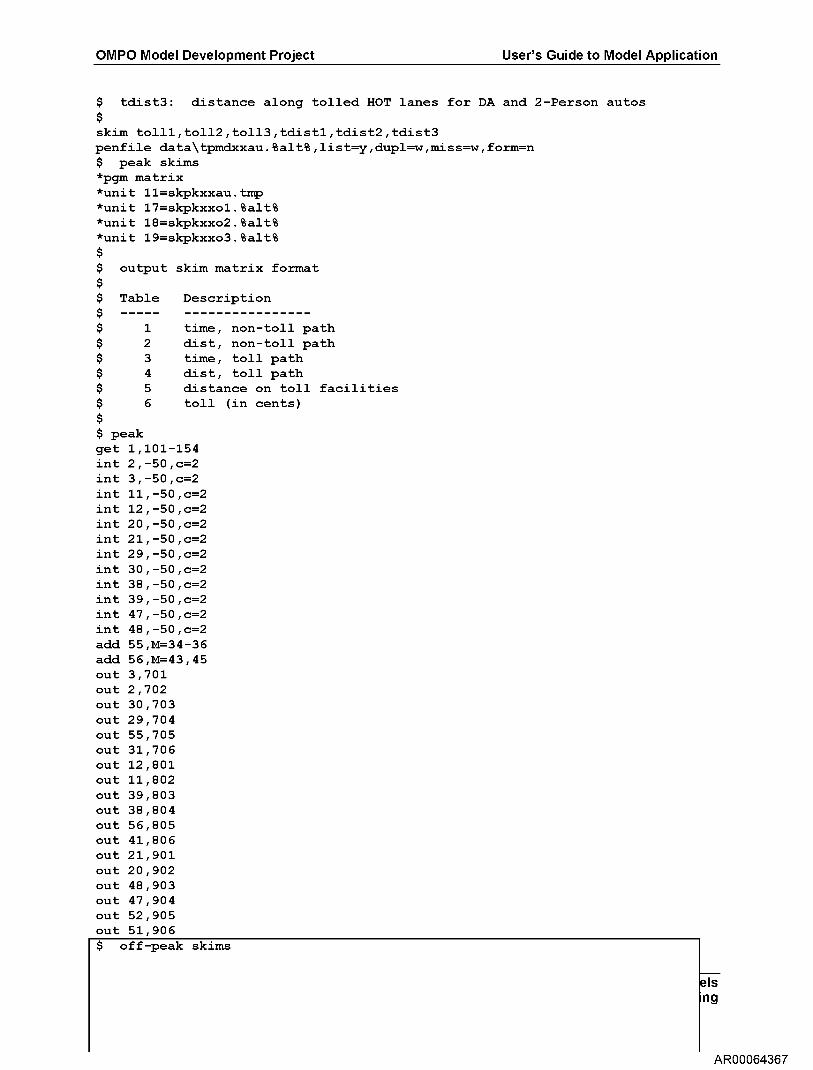
skim to111,to112,to113,tdistl,tdist2,tdist3 penfile data\tpmdxxau.%alt%,list=y,dupl=w,miss=w,form=n $ peak skims *pgm matrix *unit 11=skpkxxau.tmp *unit 17=skpkxxol.%alt% *unit 18=skpkxxo2.%alt% *unit 19=skpkxxo3.%alt%
$ output skim matrix format
$ Table Description
1 time, non-toll path 2 dist, non-toll path 3 time, toll path 4 dist, toll path 5 distance on toll facilities 6 toll (in cents)
$ peak get 1,101-154 int 2,-50,c=2 int 3,-50,c=2 int 11,-50,c=2 int 12,-50,c=2 int 20,-50,c=2 int 21,-50,c=2 int 29,-50,c=2 int 30,-50,c=2 int 38,-50,c=2 int 39,-50,c=2 int 47,-50,c=2 int 48,-50,c=2 add 55,M=34-36 add 56,M=43,45 out 3,701 out 2,702 out 30,703 out 29,704 out 55,705 out 31,706 out 12,801 out 11,802 out 39,803 out 38,804 out 56,805 out 41,806 out 21,901 out 20,902 out 48,903 out 47,904 out 52,905 out 51,906 $ off-peak skims
els ng
AR00064367

OMPO Model Development Project User's Guide to Model Application
*pgm matrix *unit 11=skopxxau.tmp *unit 17=skopxxol.%alt% *unit 18=skopxxo2.%alt% *unit 19=skopxxo3.%alt%
$ output skim matrix format
$ Table Description
1 time, non-toll path 2 dist, non-toll path 3 time, toll path 4 dist, toll path 5 distance on toll facilities 6 toll (in cents)
$ peak get 1,101-154 int 2,-50,c=2 int 3,-50,c=2 int 11,-50,c=2 int 12,-50,c=2 int 20,-50,c=2 int 21,-50,c=2 int 29,-50,c=2 int 30,-50,c=2 int 38,-50,c=2 int 39,-50,c=2 int 47,-50,c=2 int 48,-50,c=2 add 55,M=34-36 add 56,M=43,45 out 3,701 out 2,702 out 30,703 out 29,704 out 55,705 out 31,706 out 12,801 out 11,802 out 39,803 out 38,804 out 56,805 out 41,806 out 21,901 out 20,902 out 48,903 out 47,904 out 52,905 out 51,906
*>del *.tmp
Parsons Transportation System Models Brinckerhoff B.2-6 Highway Path-Building and Skimming
AR00064368

OUT Mat Total
401 1,075,991,994 Off 402 917,124,542 Off 501 1,075,991,994 Off 502 917,124,542 Off 601 1,075,991,994 Off 602 917,124,542 Off 701 1,681,216,201 Peak 702 918,345,389 Peak 801 1,675,169,591 Peak 802 918,720,137 Peak
Peak 1 person/car travel time Peak 1 person/car distance Peak 2 persons/car travel time Peak 2 persons/car distance Peak 3+ persons/car travel time Peak 3+ persons/car distance 1 person/car travel time 1 person/car distance 2 persons/car travel time 2 persons/car distance
OMPO Model Development Project User's Guide to Model Application
2.3 Input Files
The skim-building setup requires a MINUTP-format built highway network with specific link attributes. The network for alternative "zzz" is named HVVY\HNTTXXXX.zzz. The only other required input file, GENERIC\HVVY\LWOOOKAU.def, contains default speed-class definitions.
2.4 Output Files
2.4.1 Output Non-Toll Skims
The setup produces MINUTP matrix-format files of zone-to-zone impedances. Each of the mode-specific files contains two tables, with travel time and distance respectively. The output skim files have standard names for alternative "zzz" of HVVY\SKPKXX01.zzz and HVVY\SKOPXX01.zzz for SOV paths, HVVY\SKPKXX02.zzz and HVVY\SKOPXX02.zzz for HOV2 paths, and HVVY\SKPKXX03.zzz and HVVY\SKOPXX03.zzz for HOV3+ paths. The user should perform quality-of-service (QOS) checks on the skim files produced by these procedures, as well as with all other skims produced.
2.4.2 Output Toll Skims
The output skim file names are the same as the ones for the non-toll skims except that each file contains 6 tables: (1) travel time on non-toll path, (2) distance on non-toll path, (3) travel time on toll path, (4) distance on toll-path, (5) distance on the toll facility, and (6) toll in cents. Again, the user should perform quality-of-service checks on the skim files produced.
2.5 Controls
The setup file contains all necessary controls. Invoke skim-building for the base-year scenario with batch file HVVY\SKALL.bat by entering "skall zzz" at the command prompt.
2.6 Reports
A final step embedded in the setup copies all standard MINUTP report files to the same name as the setup file, retaining suffix .prn. This allows the user to more easily locate the correct output for examining the results of these procedures. This file echoes all commands, gives control totals on all matrices, and reports any problems. A sample listing of the output matrix values is shown below (with comments on the side describing each matrix).
Parsons
Transportation System Models Brinckerhoff
B.2-7 Highway Path-Building and Skimming
AR00064369

OMPO Model Development Project
User's Guide to Model Application
901 1,675,169,591 Peak 3+ persons/car travel time 902 918,720,137 Peak 3+ persons/car distance
2.7 Error Messages
Since the auxiliary skim-building procedures call only MINUTP modules, only standard MINUTP errors are produced. Warnings are denoted (w) and fatal errors (f). See the MINUTP manual for clarification on specific messages. The end of each report file summarizes the maximum severity of all problems encountered, with severity 0 indicating no warnings, 4 warnings but no fatals, and 8 fatals. The user should investigate all messages.
Parsons Transportation System Models Brinckerhoff B.2-8 Highway Path-Building and Skimming
AR00064370

OMPO Model Development Project User's Guide to Model Application
3. Transit Path-Building and Skimming
In the models, transit networks serve two functions: provide service information for mode choice, and provide a basis for assigning trips. This chapter describes the former function, while Section E.2 describes the latter. The application modules covered include MINUTP TRNPTH and NETMRG and programs ACCLINK and NODES.
3.1 Purpose
Path-building and skimming convert network information, comprised of nodes and links, into matrices of skimmed network characteristics. The models operate on zones and zone-to-zone interchanges. Therefore, network information must be summarized at that level for the models to access it. The path-building step searches the network to find the best paths from each node to each other node, with "best" defined in this case by minimum perceived travel time. The best-path between a pair of zones consists of a series of nodes in the order traversed. The skimming step follows this best-path, accumulating link and node characteristics for each zone-to-zone interchange.
The mode-choice model separately examines five transit modes, defined by combinations of access and line-haul modes. For walk access, paths including rail are considered separately from those including only bus, and paths including express bus are considered separately from those including only local bus. For drive access, separate paths are built for parked vehicles and drop-offs, but are not differentiated by line-haul mode. These five path types are designated walk-to-guideway (WG), walk-to-express (VVX), walk-to-local (WL), kiss-n-ride (KR), and park-n-ride (PR).
The overall transit network includes access links representing walk and drive access. All transit trips assume walking from the transit terminus to the final destination; therefore, the walk-access links also represent walk-egress. To build a set of skims, the user designates the access mode(s) to be considered, and weights defining zone-to-zone impedance. The skim-building procedures run independently for these five access modes and for time periods AM-peak and midday (MD).
This document details the skim-building processes for VVX as representative of the five access modes, and for the other three just lists file names and points of difference. Note that WG, and in general the rail line-haul mode, is not available in the base year setting.
Transit skim-building uses the MINUTP module TRNPTH. A custom-built application program named ACCLINK allows the user full control over the development of walk- and drive-access links connecting zone centroids to transit stops. Two applications process network information for use by ACCLINK: a custom-built program named NODES processes transit line cards, and MINUTP NETMRG processes highway networks.
3.2 Control Files
Skim development requires the execution of several program steps in sequence.
1. Convert highway network from MINUTP to ASCII format
Parsons Transportation System Models Brinckerhoff B.3-1 Transit Path-Building and Skimming
AR00064371

OMPO Model Development Project User's Guide to Model Application
2. Convert transit network from MINUTP to NODES format
3. Produce access-links (peak and off-peak)
4. Produce paths and skims (peak and off-peak; walk-local, walk-express, walk-guideway, park-n-ride, kiss-n-ride)
Further sections of this document discuss each step.
Batch file TRN\SKALLBAT controls skim-building for all four transit modes available in the base-year. It takes a single command-line argument, the file-extension denoting the alternative. For alternative "ZZZ", this extension is .zzz, so the transit skim-building process is invoked by navigating to the TRN directory and invoking "skall zzz" at the command prompt.
@echo off @echo Build transit paths & skims for AM, MD rem cvf990923 rem rem set alt designator set alt=%1 rem rem build access links cd acc call accall cd rem rem walk-local call do skamxxwl call do skmdxxwl rem rem walk-express call do skamxxwx call do skmdxxwx rem rem drive-pnr call do skamxxpr call do skmdxxpr rem rem drive-knr call do skamxxkr call do skmdxxkr @echo.
Parsons
Transportation System Models Brinckerhoff B.3-2 Transit Path-Building and Skimming
AR00064372

OMPO Model Development Project
User's Guide to Model Application
Notice that TRN\SKALLBAT calls the access-link development batch file, TRN\ACC\ACCALLBAT.
@echo off @echo Build transit access links for AM, MD rem cvf990924 rem rem set alt designator set alt=%1 rem rem use nodes to dump transit lines to nodes format call nodes tnttxxtr.ctl rem rem use minutp netmrg to dump highway links to ascii call do unbld rem rem use acclink to build transit access links call acclink alamxxtr.ctl call acclink almdxxtr.ctl drvlinks alltransitlinesDrv.ctl python pnrzones.py trndrv am.out alxxxxst.%%% outstat.%%% rem NOTE: Replace %%% with 3-character alternative specification @echo.
3.2.1 Access link development
This section covers control files for steps 1 through 3 in Section 3.2 above.
The models develop two sets of access links, one each to peak-period and off-peak-period transit services. Application ACCLINK produces these access links, based on input descriptions of available highway and transit service, and on user-set parameters. The highway service description consists of links from a "built" MINUTP-format highway network, written to ASCII format using MINUTP NETMRG setup TRN\ACC\UNBLD.SET as shown below. Specified field locations must remain fixed.
$ Honolulu models $ MINUTP NETMRG application to unbuild highway network to ASCII file $ cvf990914
*pgm netmrg nul,..\..\hwy\hnttxxxx.%alt% *id unbuild net to ASCII file lsto 2,hnttlink.%alt% out: file name list a=1-5,b=6-10 out: a, bnode fields list factype=11-14 out: facility type field list dist=15-18 out: distance field list sped=19-22 out: free-flow speed (SPED) field list spdc=23-26 out: speedclass (SPDC) field list name=31-50 out: link name
Note that this and other MINUTP setups use "tokens" imbedded in filenames and other parameters. The user can fix the value of a parameter outside the MINUTP setup (here, for
Parsons
Transportation System Models Brinckerhoff
B.3-3 Transit Path-Building and Skimming
AR00064373

Honolulu Models cvf990920 acclink ctl for am
&fnames fnodes fhlinks fphysical = falinks fnodnames = fscoding = fsdata
'tnttxxtr.%%%' 'hnttlink.%%%' '..\data\stxxxxtr.%%%' 'alamxxtr.%%%' Thnttndnm.%%%' 'alxxxxst.%%%' 'alxxxxsd.%%%'
OMPO Model Development Project User's Guide to Model Application
example, an alternative-designator %alt% equal to ".c9x") and have MINUTP recognize it on the fly. This allows use of unmodified setup files from alternative to alternative, providing such benefits as traceability and flexibility while maintaining fewer unique files. The designation of token values is handled by the controlling batch files TRN\SKALLBAT and TRN\ACC\ACCALLBAT.
The transit service description for ACCLINK consists of transit line definitions, converted from MINUTP-format by the application NODES with the control file TRN\ACC\TNTTXXTR.CTL.
Honolulu models NODES control to write transit lines to ASCII cvf990922
&files fline(1)='..\data\tlttxxbl.%%%' fline(2)='..\data\tlttxxbx.%%%' fline(3)='..\data\tlttxxls.%%%' fnodes ='tnttxxtr.%%%' frpt ='tnttxxtr.rpt'
NOTE: Replace %%% with 3-character alternative specification
¶ms period=0
&options reverse = f splice = f purge = f narr =f
Application ACCLINK must be run twice, to produce access links for peak- and off-peak service. The control file for producing peak access links, named TRN\ACC\ALAMXXTR.CTL, is shown below. The ACCLINK control files employ standard FORTRAN namelist syntax, in which each parameter section begins with &name and ends with / (or optionally &end), and text outside these demarcations is treated as comments. The input sections of the ACCLINK control file include &fnames, ¶ms, &allocs, and &options.
For a details on the access-link construction and selection algorithm, including &options maxnaccp, maxnaccn, and minnacc, see section 3.5 Controls.
Parsons
Transportation System Models Brinckerhoff
B.3-4 Transit Path-Building and Skimming
AR00064374

OMPO Model Development Project
User's Guide to Model Application
freport = &end NOTE: Replace
¶ms
Talamxxtr.rpt'
%%% with 3-character alternative specification
nzones = 764 maxdistl = 50 maxdist2 = 500 maxdistw = 200 capcdist = 25 wspeed = 3.0 debug
&end &allocs maxnode = 5000 maxtlpn = 100 maxhlpn = 10 maxhnpz = 1000 maxnmpn = 5
&end &options period = 1 maxnaccp = 0, 0, 0, 8, 6, 6, 0, 6, 0, 0, 0, 4, 0, 2, 2, 0, 0, 0, 0, 0 maxnaccn = 0, 0, 0, 4, 2, 2, 0, 2, 0, 0, 0, 0, 0, 1, 1, 0, 0, 0, 0, 0 minnacc = 0, 0, 0, 4, 2, 2, 0, 2, 0, 0, 0, 2, 0, 1, 1, 0, 0, 0, 0, 0 noffset = 100, 200
&end
The application DRVLINKS produces the potential drive access links to each park and ride lot. The output files are specified in the control file under ReportFile, and LinkFile in the &Files section. For the LinkFile output, there will be three files output, one each for the three time of day periods (AM, Midday, and PM). The following box is an example of the control file for the DRVLI N KS program.
* DRVLINKS.EXE drive access link program control file for allTransitLines route descriptions
[Files] CentroidFile = ../data/centroids.tno NodeFile = ../data/buspnrnodes.tno TransitFile = ../data/t1ttxxtr.tno StationFile = ../data/stxxxxtr.tno HwyLinkFile = ../data/hnttlink.tno
ReportFile LinkFile
= trnDrv.rpt = trnDrv.out
[Parameters] NumCentroids = 1000 NumNodes = 5000 Distance = Cartesian IndividualSearch = no Averageoistance = no MinDistance = 0.0
AR00064375

OMPO Model Development Project User's Guide to Model Application
MaxDistance = 5.0 NetworkScale = 875.0 MultipleLinks = yes
[Reports] PrintUnconnected = yes PrintConnections = yes
[Centroid Format] CentroidFormat = user Number = 1-8 XCoord = 9-16 YCoord = 17-24 FirstCentroid = 1
[Node Format] NodeFormat = user Number = 1-8 XCoord = 9-16 YCoord = 17-24 FirstNode = 1
[Transit Format] TransitFormat = Minutp
[New Link Attributes] DeleteLinks = no Modes = 1 LinkFormat = MINUTP
The python program PNRZONES then modifies the output station file from the ACCLINK program (ADOOKXST.ZZZ) by changing the range of zones that may have access to each park and ride lot if they meet the specified parameters in skim building. There are two input files needed for this program, (1) the output file from the DRVLINKS application, and (2) the output station file from the ACCLINK application. The third file that is specified is the new modified station file.
To run the PYTHON program, the following command is typed at the DOS prompt:
PYTHON PNRZONES.PY <output from DRVLINKS> <output station file from ACCLINK> <NEW station file name>
3.2.2 Path and skim development
This section covers control files for step 4 in Section 3.2 above.
The MINUTP TRNPTH setups TRN\SKAMXXVVLSET, TRN\SKAMXXVVX.SET, TRN\SKAMXXPR.SET, and TRN\SKAMXXKR.SET control path-building for the AM period (representing peak conditions) for the walk-to-local-bus (WL), walk-to-express-bus (VVX), drive-to-park-n-ride (PR), and drive-to-kiss-n-ride (KR) mode/path combinations, respectively. Similar setups control skim-building for the midday time period, representing offpeak service. (Note that the walk-to-guideway setups are not included, since they don't exist in the base year.) Each
Parsons Transportation System Models Brinckerhoff B.3-6 Transit Path-Building and Skimming
AR00064376

OMPO Model Development Project User's Guide to Model Application
setup makes one call to NETMRG and one to TRNPTH. The NETMRG call simply converts the generic highway network to reflect AM-peak characteristics. The setups follow the standard MINUTP syntax; see the MINUTP manual for more detail. A similar group of setup files governs the creation of midday skims to represent offpeak service.
TRN\SKAIWOONL.SET
$ Honolulu models $ Transit pathbuilding & skimming with TRNPTH $ cvf990920 $ srr021114 factor transit times $ h1f070403 update parameters
*pgm netmrg hnamxxxx.%alt%,..\hwy\hnttxxxx.%alt% comp lane=lanea comp cspdc=10.*cspdc comp spdc=factype
*pgm trnpth hnamxxxx.%alt%,nodes=5000,1inks=10000,time=cspdc,delzon=1000 *par msglev=5 *unit 19=skamxxwl.%alt%
control parameters period=1 use headway hl prntuc=1 list unconnected ij listin=1111
walk access *read acc\alamxxtr.%alt%
walk-access links link 2008-2146,22,45.0
put in freeway link which trnpth could not find pars wlksp=3
walk speed pars wlkdi=1
use only centroid links to build zacc „,8-200,6-200,6-200 „6-200 build walk-access links zono alamxxwl.%alt% nox c,12,12 pars maxdr=0
weights, maximums, and penalties $ walk mfac 2.0,0,11-15 iwalk=250
max walk to jwalk=250
max walk from $ initial wait ifac 2.0,1-10
weight on 1st wait time $ in-vehicle adjc1=-10
composite link avg time used if delta < mfac 1.0,1-10
weight on in-vehicle time mfac 0.9,6
limited stop weight on invehicle time $ transfers xfac 2.0,1-10
weight on xfer wait time xpen=-4
pnity per xfer (-omits from skim) $ total path maxtt=300
max wtd time (min); abandons if longer
AR00064377

OMPO Model Development Project User's Guide to Model Application
line cards, xfer links, etc. fare 54,0,1-10 fares -- change from $.75 to $.45 10/24/02,srr to$.54 hlf linp h1=0.0,h2=0.0,h3=0.0,st=0.17 ST is Stop Time for a node (minutes) *read acc\outstat.%alt% stn coding, use modified station python prog. hlf *read ..\..\generic\trn\luxxxxtf.fdb mdsp values srr 11/14/02 -- factor by factype *read tlttxxbl.%alt%
line cards *read tlttxxls.%alt%
limited stop line cards *read data\xfxxxxtr.%alt%
xfer links
skims, paths, networks, and reports apath=w
build walk-access path patho=w sets paths written to neto mato 19,1(w)=wkt,2(w)=wtt,3(w)=mto, 4(w)=m8,5(w)=m5 mato 19,6(w)=xfe,7(w)=far,8(w)=wti neto t=ntamxxwl.%alt%
output transit network neto p=ptamxxwl.%alt% repo -2,3,6
transit line reports
Parsons
Transportation System Models Brinckerhoff
B.3-8 Transit Path-Building and Skimming
AR00064378

$ Honolulu models $ Transit pathbuilding & skimming with TRNPTH $ cvf990920 $ srr021114 factor transit times $ h1f070403 update parameters
*pgm netmrg hnamxxxx.%alt%,..\hwy\hnttxxxx.%alt% comp lane=lanea comp cspdc=10.*cspdc comp spdc=factype
*pgm trnpth hnamxxxx.%alt%,nodes=5000,1inks=10000,time=cspdc,delzon=1000 *par msglev=5 *unit 19=skamxxwp.%alt%
control parameters period=1 use headway hl prntuc=1 list unconnected ij listin=1111
walk access *read acc\alamxxtr.%alt% link 2008-2146,22,45.0 pars wlksp=3 pars wlkdi=1 zacc „,8-200,6-200,6-200 zono alamxxwp.%alt% nox c,12,12 pars maxdr=0
weights, maximums, $ walk mfac 2.0,0,11-15 iwalk=250 jwalk=250 $ initial wait ifac 2.0,1-10 $ in-vehicle adjc1=-10 mfac 1.2,1-10 mfac 1.0,5 $ transfers xfac 2.0,1-10 xpen=-4 $ total path maxtt=300
line cards, xfer links, etc. fare 54,0,1-10 10/24/02,srr to$.54 hlf linp h1=0.0,h2=0.0,h3=0.0,st=0.17 *read acc\outstat.%alt% python prog. hlf *read ..\..\generic\trn\luxxxxtf.fdb fac type
fares -- change from $.75 to $.45
ST is Stop Time for a node (minutes) stn coding, use modified station
mdsp values srr 11/14/02 -- factor by
walk-access links put in freeway link which trnpth could not find
walk speed use only centroid links to build
„6-200 build walk-access links
and penalties
max walk to max walk from
weight on 1st wait time
composite link avg time used if delta < weight on in-vehicle time bonus weight on express-bus ivtime
weight on xfer wait time pnity per xfer (-omits from skim)
max wtd time (min); abandons if longer
OMPO Model Development Project
User's Guide to Model Application
TRN\SKAMXMVX.SET
Parsons
Transportation System Models Brinckerhoff
B.3-9 Transit Path-Building and Skimming
AR00064379

OMPO Model Development Project
User's Guide to Model Application
*read tlttxxbl.%alt%
line cards *read tlttxxbx.%alt%
line cards *read tlttxxls.%alt%
limited stop line cards *read data\xfxxxxtr.%alt%
xfer links
skims, paths, networks, and reports apath=w
build walk-access path patho=w sets paths written to neto mato 19,1(w)=wkt,2(w)=wtt,3(w)=mto ,4(w)=m8,5(w)=m5 mato 19,6 (w) =xfe , 7 (w) =far , 8 (w) =wti neto t=ntamxxwp.%alt%
output transit network neto p=ptamxxwp.%alt% repo -2,3,6
transit line reports #2, #6
TRN\SKAMXXPR.SET
$ Honolulu models $ Transit pathbuilding & skimming with TRNPTH $ cvf990920 $ srr021114 factor transit times $ h1f070403 update parameters
*pgm netmrg hnamxxxx.%alt%,..\hwy\hnttxxxx.%alt% comp lane=lanea comp cspdc=10.*cspdc comp spdc=factype
*pgm trnpth hnamxxxx.%alt%,nodes=5000,1inks=10000,time=cspdc,delzon=1000 *par msglev=5 *unit 19=skamxxpr.%alt%
control parameters period=1 use headway hl prntuc=1 list unconnected ij listin=1111
access *read acc\alamxxtr.%alt%
walk-access links link 2008-2146,22,45.0
put in freeway link which trnpth could not find pars wlksp=3
walk speed pars wlkdi=1
use only centroid links to build zacc „,8-200,6-200,6-200 „6-200 build walk-access links zono alamxxpr.%alt% nox c,12,12
allow walk-xfer movement pars maxdr=15,drvdi=10
weights, maximums, and penalties $ walk mfac 2.0,0,11-15 iwalk=250
max walk to jwalk=250
max walk from $ initial wait ifac 2.0,1-10
weight on 1st wait time $ in-vehicle
Parsons
Transportation System Models Brinckerhoff
B.3-10 Transit Path-Building and Skimming
AR00064380

OMPO Model Development Project
User's Guide to Model Application
adjc1=-10
composite link avg time used if delta < mfac 1.0,1-10
weight on in-vehicle time $ transfers xfac 2.0,1-10
weight on xfer wait time xpen=-4
pnity per xfer (-omits from skim) $ total path maxtt=300
max wtd time (min); abandons if longer
line cards, xfer links, etc. fare 54,0,1-10
fares -- change from $.75 to $.45 10/24/02,srr to$.54 hlf linp h1=0.0,h2=0.0,h3=0.0,st=0.17
ST is Stop Time for a node (minutes) *read acc\outstat.%alt%
stn coding, use modified station python prog. hlf *read ..\..\generic\trn\luxxxxtf.fdb
mdsp values srr 11/14/02 -- factor by fac type *read tlttxxtr.%alt% line cards *read data\xfxxxxtr.%alt% xfer links
skims, paths, networks, and reports apath=d build path type patho=d sets paths written to neto mato 19,1(d)=wkt,2(d)=wtt,3(d)=mto,4(d)=m8,5(d)=m5 mato 19,6(d)=xfe,7(d)=far mato 19,8(d)=pnr,9(d)=drv,10(d)=did,11(d)=wti neto t=ntamxxpr.%alt% output transit network neto p=ptamxxpr.%alt% repo -2,3,6
transit line reports
TRN\SKAM)OKKR.SET
$ Honolulu models $ Transit pathbuilding & skimming with TRNPTH $ cvf990924 $ h1f070403 updated to compare with most premium WALK to mode
*pgm matrix *unit 11=skamxxwp.%alt% *unit 12=skamxxpr.%alt% *unit 19=skamxxkr.%alt% get 41,101-108 get 21,201-211 $ create kr skim as modified wx skim comp 1=41*0.50 walk-from time is 50% of walk-to/from time comp 2=42 comp 3=43 comp 4=44 comp 5=45 comp 6=46 comp 7=47 comp 8=0. comp 9=41*0.30 drive-to time is 30% of walk-to/from time $ drive-to dist= walk-to/from time * 0.5 * 3.0mph * 1.25factor / 60min/hr comp 10=41*0.5*3.0*1.25/60. drive-to dist is 1.25* walk-to dist
Parsons
Transportation System Models Brinckerhoff
B.3-11 Transit Path-Building and Skimming
AR00064381

OMPO Model Development Project
User's Guide to Model Application
comp 11=48
$ compare to pr skim and replace if pr better comp 51=2.*(1+2+9)+3 kr (based on wx) perceived tot tt comp 52=2.*(21+22+29)+23 pr perceived tot tt comp 53=51-52 pos if pr better, neg if kr/wx better if 53,v=1-9999 if pr better than kr/wx, use pr attribs for kr
comp 1=21 comp 2=22 comp 3=23 comp 4=24 comp 5=25 comp 6=26 comp 7=27 comp 8=28 comp 9=29 comp 10=30 comp 11=31
endif
$ no knr from urban zones $if 3,i=75-76,105-107,110-137,141-246,249-269,274-281,325-327 $ comp 1,0 $ comp 2,0 $ comp 3,0 $ comp 4,0 $ comp 5,0 $ comp 6,0 $ comp 7,0 $ comp 8,0 $ comp 9,0 $ comp 10,0 $endif out 1,901-911
3.3 Input Files
Transit access-link and skim-building requires input files describing the highway network; transit lines and facilities; and transfer and walk links. The highway network required is a built MINUTP binary-format highway network, named HVVY\HNTDOOKX.ZZZ.
Transit lines are described in MINUTP TRNPTH format, including information on routing, stop patterns, headway by period, and mode code. Files TRN\TLTTXXI3L.ZZZ, TRN\TLTTXXLS.ZZZ, and TRN\TLTTXXI3X.ZZZ contain these records for local, limited stop and express buses, respectively. Transit facilities, such as stations, guideways, and formal park-n-ride lots, are described in an input to ACCLINK (named in the ACCLINK control file as &fnames fphysical (typically ACC\SDOOKXTR.ZZZ). For the base-year (alternative "C9X") application of these models, this file only includes four records, describing existing park-n-ride facilities. For future applications, fixed-guideway information would be included, as described in the key and example file (from the Primary Corridor Transportation Project) below.
Parsons Transportation System Models Brinckerhoff B.3-12 Transit Path-Building and Skimming
AR00064382

OMPO Model Development Project
User's Guide to Model Application
TRWACC\SDOOOKTR.C9X
node sta name xcoor ycoor hnol dl hno2 d2 xnol dl xno2 d2 dW dP dK $$$ spcs
2643 HawaiiKai
1 9999 2484 MililMauka
1 9999 2765 Wahiawa
1 9999 2571 RoyalKunia
1 9999
fac# facname anod bnod dist sped
Example facility-definition file from Primary Corridor Transportation Project
node sta name xcoor ycoor hnol dl hno2 d2 xnol dl xno2 d2 dW dP dK $$$ spcs
4514 pearlridge 16650 7890 2052 01 2052 01 1 4515 aloha stad 17157 7019 2007 01 3656 06 2007 01 1 02 4516 radford 17044 5933 1901 01 3425 07 1901 01 1 4517 nimitz 17944 5101 1869 01 1869 01 1872 13 1 4518 puuloa 18956 4899 1852 01 1852 01 1853 09 1 4519 middle st 19856 4888 1664 01 1664 01 1 4520 kalihi 20643 4441 1641 01 1641 01 1 4521 hcc 20812 4208 1727 01 3380 02 1727 01 1 4522 aala park 21043 3626 1468 01 1468 01 1471 12 1 4523 maunakea/k 21082 3440 1456 01 1456 01 3308 05 1 4524 alakea/kg 21229 3194 1405 01 1405 01 1507 01 1 4525 punchbowl 21396 3027 1387 01 1511 01 1387 01 1 4526 cooke/kap 21585 2823 2711 01 2711 01 1342 14 1 4527 ward/kap 21695 2668 1352 01 1340 10 1352 01 1 4528 ala moana 22271 2311 1363 01 3239 07 3240 20 1 4529 cony cntr 22570 2174 1374 01 1374 01 1378 01 1 4530 isen/kap 23105 1992 1164 01 1164 01 1 4531 univ/king 23438 2236 1060 01 1060 01 1 4532 unly/dole 23467 2668 1181 01 1056 15 1181 01 1 2643 HawaliKal 1 0 9999 2484 MilliMauka 1 0 9999 2765 Wahiawa 1 0 9999 2571 RoyalKunia 1 0 9999 2007 Stadium 1 0 800 1416 Block J 1 0 400 2539 Kapolei 1 0 250 2473 Waipahu 1 0 250 4564 An Memori 16932 6587 2003 01
fac# facname anod bnod dist sped
1 LRT-1 4514 4515 169 26 1 LRT-1 4515 4564 58 32 1 LRT-1 4564 4516 77 32 1 LRT-1 4516 4517 176 43 1 LRT-1 4517 4518 114 40 1 LRT-1 4518 4519 109 27
Parsons
Transportation System Models Brinckerhoff
B.3-13 Transit Path-Building and Skimming
AR00064383

OMPO Model Development Project
User's Guide to Model Application
1 LRT-1 4519 4520 117 20 1 LRT-1 4520 4521 34 20 1 LRT-1 4521 4522 75 20 1 LRT-1 4522 4523 27 16 1 LRT-1 4523 4524 28 16 1 LRT-1 4524 4525 25 23 1 LRT-1 4525 4526 36 23 1 LRT-1 4526 4527 22 17 1 LRT-1 4527 4528 80 17 1 LRT-1 4528 4529 38 17 1 LRT-1 4529 4530 65 17 1 LRT-1 4530 4531 52 20 1 LRT-1 4531 4532 50 20
Part 1 contains station and pnr information. Fields include for each station or park-n-ride:
1. Node
2. Sta name
3. Xcoor
4. Ycoor
5. Hno1
6. D1
7. Hno2
8. D2
9. Xno1
10. D1
11. Xno2
12. D2
13. Dw
14. Dp
15. Dk
16. $$$
17. spcs
node number (cols 2-5)
name (7-16)
x-coordinate in MINUTP system (18-22)
y-coordinate in MINUTP system (24-28)
highway-network connection node 1 of up to 2 (30-33)
distance to highway-network connection node 1 of up to 2 (35-36)
highway-network connection node 2 of up to 2 (38-41)
distance to highway-network connection node 2 of up to 2 (43-44)
bus transfer node 1 of up to 2 (46-49)
distance to bus transfer node 1 of up to 2 (51-52)
bus transfer node 2 of up to 2 (54-57)
distance to bus transfer node 2 of up to 2 (59-60)
distance from highway connection to walk-intercept node (62-63)
distance from highway connection to PnR-intercept node (65-66)
distance from highway connection to KnR-intercept node (68-69)
cost of parking in cents (71-73)
number of spaces in PnR lot (75-78)
Note that all distances are in hundredths of a mile, as is the MINUTP standard.
After a single blank line, Part 2 contains guideway facility information, including for each link:
1. Fac# facility number (2-5
2. Facname facility name (7-16)
3. Anod a-end node number (18-21)
4. Bnod b-end node number (23-26)
5. Dist distance or length in hundredths of a mile (28-31)
Parsons Transportation System Models Brinckerhoff B.3-14 Transit Path-Building and Skimming
AR00064384
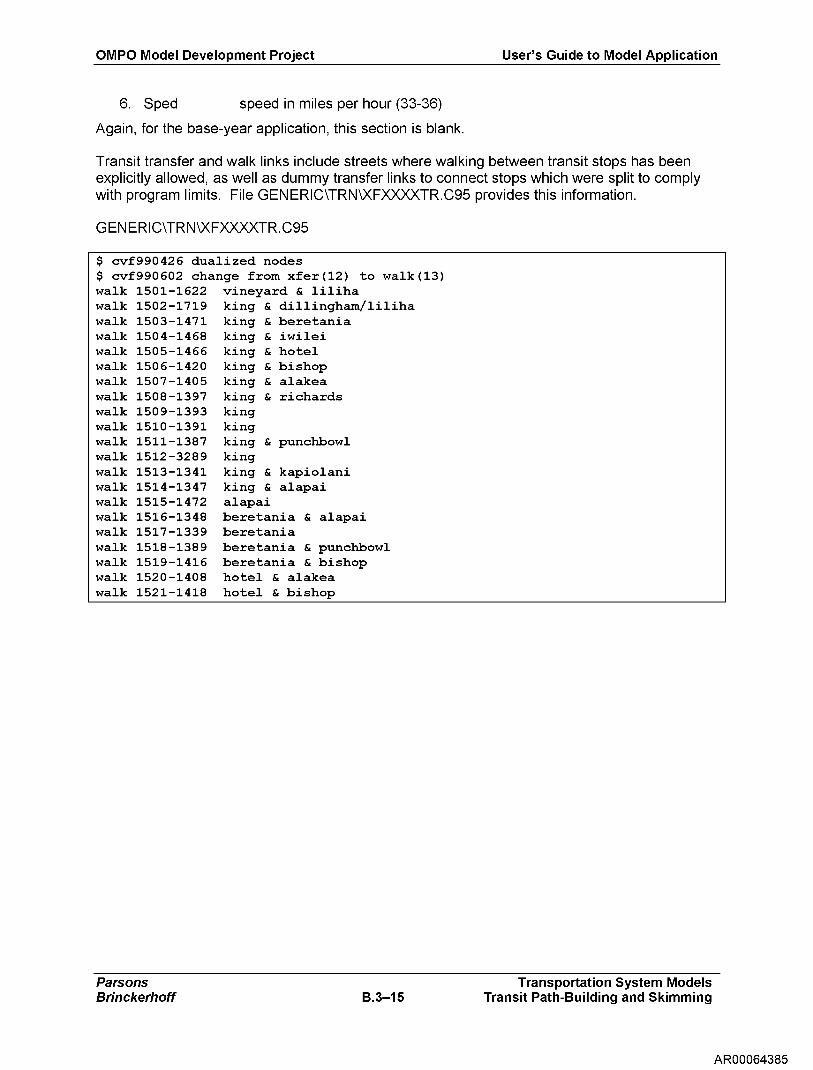
OMPO Model Development Project User's Guide to Model Application
6. Sped speed in miles per hour (33-36)
Again, for the base-year application, this section is blank.
Transit transfer and walk links include streets where walking between transit stops has been explicitly allowed, as well as dummy transfer links to connect stops which were split to comply with program limits. File GENERIC\TRN\XFXXXXTR.C95 provides this information.
GENERIC\TRN\XFXXXXTR.C95
$ cvf990426 dualized nodes $ cvf990602 change from xfer(12) to walk(13) walk 1501-1622 vineyard & liliha walk 1502-1719 king & dillingham/liliha walk 1503-1471 king & beretania walk 1504-1468 king & iwilei walk 1505-1466 king & hotel walk 1506-1420 king & bishop walk 1507-1405 king & alakea walk 1508-1397 king & richards walk 1509-1393 king walk 1510-1391 king walk 1511-1387 king & punchbowl walk 1512-3289 king walk 1513-1341 king & kapiolani walk 1514-1347 king & alapai walk 1515-1472 alapai walk 1516-1348 beretania & alapai walk 1517-1339 beretania walk 1518-1389 beretania & punchbowl walk 1519-1416 beretania & bishop walk 1520-1408 hotel & alakea walk 1521-1418 hotel & bishop
Parsons Transportation System Models Brinckerhoff B.3-15 Transit Path-Building and Skimming
AR00064385

link 0001-3039,025,30.0 link 0001-1764,100,40.8 link 0001-1763,150,42.5 <deleted> link 0762-4617,062,22.5 link 0762-1872,048,22.2 link 0762-1887,149,33.7 link 0762-1662,170,26.8
Centroid Connector KALANIANAOLE HWY KALANIANAOLE HWY
mode for nimitz NIMITZ HWY NIMITZ SPUR MIDDLE ST
& KALANIANAOLE HWY
& RODGERS BLVD
& H-1 WB ON
OMPO Model Development Project User's Guide to Model Application
3.40utput Files
The skim-building setups produce MINUTP matrix-format files of zone-to-zone impedances. Each of the walk-access period-specific files contains eight tables: walk time, wait time, transit in-vehicle time, guideway in-vehicle time (not currently used), and express/premium transit in-vehicle time; number of transfers; fare paid; and initial wait time. Each drive-access skim file contains three other tables: park-n-ride lot number (table 8), drive-access time (table 9), and drive-access distance (table 10). The initial wait time table in the drive-access skim file is the 11 th table, not the 8 th table. For alternative "ZZZ", the skim files have standard file names TRN\SKAIWOONL.ZZZ and TRN\SKMDXXWL.ZZZ for walk-to-local bus; TRN\SKAIWOMPX.ZZZ and TRN\SKMDXXWP.ZZZ for walk-to-express-bus; TRN\SKAMXXPR.ZZZ and TRN\SKMDXXPR.ZZZ for park-n-ride; and TRN\SKAMXXKR.ZZZ and TRN\SKMDXXKR.ZZZ for kiss-n-ride. The user should perform quality-of-service (QOS) checks on the skim files produced by these procedures, as well as with all other skims produced.
Other interim output files are produced in formats required for their input to ACCLINK and TRNPTH. For ACCLINK, inputs include NODES-format transit lines and NETBLD-output highway links as excerpted below. For TRNPTH, inputs include access-links and facility-coding files produced by ACCLINK, also excerpted below.
TRN\ACC\TNTTXXTR.ZZZ, transit lines in NODES format
1 LRT1E 0 8 1 5.0 5.0 5.0 0 .00 19 4514 4515 4516 4517 4518 2 LRT1W 0 8 1 5.0 5.0 5.0 0 .00 19 4532 4531 4530 4529 4528 3 1AE 0 4 1 30.0 34.3 25.0 0 .00 116 1664 1665 1659 1658 1762
<deleted> 275 983W 0 5 1 30.0 40.0 30.0 0 .00 13 3551 3550 3552 3553 2263 276 984E 0 5 1 30.0 40.0 30.0 0 .00 22 2539 2484 2487 3535 2488 277 984W 0 5 1 30.0 40.0 30.0 0 .00 21 2567 3535 3536 3537 2569
TRN\ACC\HNTTLINK.ZZZ, highway links in ASCII
1 3039 12 116 300 30 XXX 2 2638 12 45 300 30 XXX 3 3029 12 42 200 20 KALOHELANI PL
<deleted> 4042 2491 3 4 440 44 FORT WEAVER BUS EXP 4042 4041 3 126 510 51 FORT WEAVER BUS EXP
TRN\ACC\ALAMXXTR.ZZZ, access links
Parsons
Transportation System Models Brinckerhoff
B.3-16 Transit Path-Building and Skimming
AR00064386

OMPO Model Development Project
User's Guide to Model Application
TRN\ACC\ADOOOKST.ZZZ, facility coding
$**** coding for bus PnR HawaiiKai ************** pnr 2643,$=26.43,t=.20,1-764
$**** coding for bus PnR MililMauka ************** pnr 2484,$=24.84,t=.20,1-764
$**** coding for bus PnR Wahiawa **************
pnr 2765,$=27.65,t=.20,1-764
$**** coding for bus PnR RoyalKunia ************** pnr 2571,$=25.71,t=.20,1-764
The ACCLINK application also produces two utility files used by later model steps. A file of node names or descriptions is used to label reports of transit boardings after network assignment. A file of station and park-n-ride data is used by the MC (mode choice) application.
TRN\ACC\HNTTNDNM.ZZZ, node names
1001 KALANIAN+NAWILIWI 1002 CentConn+KALANIAN 1003 KULIOUOU+KALANIAN
<deleted>
TRN\ACC\ADOOOKSD.ZZZ, station and park-n-ride data for MC
2643 9999 0 HawaiiKai 2484 9999 0 MililMauka 2765 9999 0 Wahiawa 2571 9999 0 RoyalKunia
The DRVLINKS application produces three files for the three time periods, AM peak period, Midday, and PM peak period. The next box shows an excerpt of the AM peak period drive access links generated from the program.
TRN\ACC\TRNDRV_AM.OUT
link 0001-2643,397,20.0 link 0002-2643,344,20.0 link 0003-2643,318,20.0 link 0004-2643,286,20.0
The python program PNRZONES produces a modified version of the ADOOOKST.ZZZ file above. It changes the ranges of possible zones that have access to each park and ride lot. The next box shows an example of the modified file called outstat.ZZZ.
Parsons
Transportation System Models Brinckerhoff
B.3-17 Transit Path-Building and Skimming
AR00064387

OMPO Model Development Project
User's Guide to Model Application
$**** coding for bus PnR HawaiiKai ************** pnr 2643,$=26.43,t=.20,1-100
$**** coding for bus PnR MililMauka ************** pnr 2484,$=24.84,t=.20,433-655
$**** coding for bus PnR Wahiawa **************
pnr 2765,$=27.65,t=.20,461-656
$**** coding for bus PnR RoyalKunia ************** pnr 2571,$=25.71,t=.20,422-764
3.5 Controls
A detailed explanation of the access-link development controls follows.
The automated access-link generation procedure operates on one zone at a time. It first builds a list of all transit stop-nodes within maxdistl of the zone centroid, then a list of all transit lines stopping at each of these nodes. For each line stopping at a candidate node, a score is computed. Individual scores for each line stopping at the node are equal to the number of trips per hour for the line. The score is positive for the node nearest the zone centroid and negative for all more distant nodes. The total positive score for a node is the sum of the positive individual scores, ignoring the negative individual scores. For nodes with zero total positive score, the total negative score is the sum of all negative individual scores.
For each transit mode, ACCLINK first generates access links to the nodes with positive total scores, beginning with the nearest node and continuing with more distant nodes until it reaches the maxnaccP limit. It then generates access links to the nodes with negative total scores, again in ascending order by distance, until it reaches the maxnaccN limit.
If for a specific zone the minimum number of connections (minnacc) is not met, ACCLINK searches for candidate nodes further than maxdistl from the zone centroid, until it either meets the minimum connections for a given transit mode or reaches a distance of maxdist2 (for auto-access) or maxdistw (for walk-access).
The controls &options maxnaccp, maxnaccn, and minnacc each take a vector of entries, where the entry's position corresponds to the transit mode to which it applies. Positions 1-10 apply to the MINUTP transit modes 1-10. Positions 12, 14, and 15 apply to MI NUTP transit-support modes: 12 for transfers, 14 for walk-access to stations as defined in the input facility-definitions file &fnames fphysical, and 15 for drive-access to stations as defined in the input facility-definitions file &fnames fphysical. Other positions in these vectors are currently unused.
3.6 Reports
The skim-building procedures also produce several reports, found in .PRN and .RPT files. MI NUTP setups produce report files with the same name as the setup and extension .PRN. Other applications produce report files with names designated in their control files.
Parsons Transportation System Models Brinckerhoff B.3-18 Transit Path-Building and Skimming
AR00064388

OMPO Model Development Project User's Guide to Model Application
3.7 Error Messages
Since transit path-building calls MINUTP modules, standard MINUTP error messages are produced. The end of each report file summarizes the maximum severity of all problems encountered, with severity 0 indicating no warnings, 4 warnings but no fatals, and 8 fatals. The user should investigate all messages and consult MINUTP documentation for details.
Applications NODES and ACCLINK each report errors in their output report files. The error messages note the severity of each error.
Parsons Transportation System Models Brinckerhoff B.3-19 Transit Path-Building and Skimming
AR00064389

OMPO Model Development Project User's Guide to Model Application
4. Auxiliary Path-Building and Skimming
For the auxiliary travel modes walk and bike, a MINUTP setup SK)000(NM.set builds best-paths from an input highway network and prepares skim files for use by the demand models.
4.1 Purpose
The models consider trips made by all modes, including non-motorized. Therefore, skim tables must be built for the non-motorized modes walk and bike to summarize their characteristics on a zone-to-zone basis.
Path-building and skimming convert network information, comprised of nodes and links, into matrices of skimmed network characteristics. The models operate on zones and zone-to-zone interchanges. Therefore, network information must be summarized at that level for the models to access it. The path-building step searches the network to find the best paths from each node to each other node, with "best" defined in this case by minimum distance. The best-path between a pair of zones consists of a series of nodes in the order traversed. The skimming step follows this best-path, accumulating link and node characteristics for each interchange.
The auxiliary network variables skimmed for use by the demand models include only travel time, computed as a function of distance. A single best-distance path gets converted to walk and bike travel times by the user of appropriate average speeds. These travel times apply for all times of day.
4.2 Control File
The setup SK)000(NM.set is a standard MINUTP-format setup (or driver) file containing one call each to modules NETMRG, PTHBLD and MATRIX. The full text of SK)000(NM.set follows. For a detailed explanation of MINUTP syntax, see the MINUTP manual.
SKXXXXN M.set
$ Honolulu models $ MINUTP Walk and Bike Skims $ cvf990924 walk 3mph, bike 7mph, cap at 30 min (1.5m1 w, 3.5m1 b)
*pgm netmrg hnxxxxnm.%alt%,..\hwy\hnttxxxx.%alt% if factype=1,9,10,11 delete link
endif
*pgm pthbld hnxxxxnm.%alt%,102 *id non-mot skims *unit 11=skpkxxnm.tmp par opmat=2 par impfac=0
$ do best-distance paths comp baseimp()=dist
$ can't restrict from limit=1 even tho def says no walk/bike
Parsons
Transportation System Models Brinckerhoff
B.4-1 Walk and Bicycle Path-Building and Skimming
AR00064390

OMPO Model Development Project
User's Guide to Model Application
par flagvar=limita flagfac 1,0,P,P,P,0,0,0,0,0 flagfac 2,0,P,P,P,0,0,0,0,0
$ Scale and order skim matrices for MC *pgm matrix *unit 11=skpkxxnm.tmp *unit 18=skxxxxbk.%alt% *unit 19=skxxxxwk.%alt%
$ bike under 3.5 ml at 7mph get 1,102 if 102,v=350-999999
rep 1,0 end comp f3=1*(60./7.)*1000. comp 4=f3*0.001 comp 5=0. out 5,801 out 5,802 out 4,803 out 5,804 out 5,805 out 5,806 out 5,807 out 5,808 out 5,809 out 5,810
$ walk under 1.5 ml at 3mph get 11,104 if 104,v=150-999999
rep 11,0 end comp f12=11*(60./3.)*1000. comp 13=f12*0.001 out 5,901 out 5,902 out 13,903 out 5,904 out 5,905 out 5,906 out 5,907 out 5,908 out 5,909 out 5,910
*>del *.tmp
4.3 Input Files
The path- and skim-building setup requires as input a highway network, HNTDOOOK.zzz. No other input files are required.
Parsons
Transportation System Models Brinckerhoff
B.4-2 Walk and Bicycle Path-Building and Skimming
AR00064391

OMPO Model Development Project User's Guide to Model Application
4.4 Output Files
The skim-building setups produce MINUTP matrix-format files of zone-to-zone impedances. Each of the mode-specific files contains ten table slots, of which only one is currently used: table three contains travel time. The output skim files have standard names SKXXXXWK.zzz for walk and SKXXXXBK.zzz for bike, for alternative "zzz". The user should perform quality-of-service (QOS) checks on the skim files produced by these procedures, as well as with all other skims produced.
4.5 Controls
The setup file contains all necessary controls. Batch file SKALL.bat calls the skim-building setup, and should be invoked from the command line as "skall zzz" for alternative "zzz" application.
4.6 Reports
A final embedded step copies the standard MINUTP report files to SKXXXXNM.prn. This allows the user to more easily locate the correct output for examining the results of the procedures. The report is a MINUTP report describing path building and skimming of the auxiliary modes of walk and bicycle. The report shows the path building and computational steps used in the procedures and presents the total travel times generated by mode. The walk mode is for distances less than 1.5 miles (at 3 miles per hour) and the bicycle mode is for distances less than 3.5 miles at 7 mph). The report echoes all commands, gives control totals on all matrices, and reports any problems.
4.7 Error Messages
Since the auxiliary skim-building procedures call MINUTP modules, only standard MINUTP errors are produced. Warnings are denoted (w) and fatal errors (f). See the MINUTP manual for clarification on specific messages. The end of the report file SKXXXXNM.prn summarizes the maximum severity of all problems encountered, with severity 0 indicating no warnings, 4 warnings but no fatals, and 8 fatals. The user should investigate all messages.
Parsons
Transportation System Models Brinckerhoff
B.4-3 Walk and Bicycle Path-Building and Skimming
AR00064392

OMPO Model Development Project User's Guide to Model Application
C. Models of Resident Travel
Parsons
Models of Resident Travel Brinckerhoff
AR00064393

OMPO Model Development Project User's Guide to Model Application
1. Trip Generation
Program TG.exe applies the Vehicle-Ownership and Trip Generation models. The trip-ends it produces provide the subsequent Trip Distribution application with information about activity in each zone, by trip purpose and for home-based trips by vehicle-ownership class.
1.1 Purpose
Program TG turns household and employment data into trip-ends for each zone in the region. Two separable steps accomplish this. First, for each zone the Vehicle-Ownership model translates households by size, income, and workers into a distribution of households by size, income, workers, and vehicle-ownership. Second, the Trip Generation model applies production and attraction rates to households and attractors for each purpose, creating the trip-end inputs required by Trip Distribution.
1.2 Control File
Program TG reads a standard Fortran control file from the command line. Standard Fortran control files have input parameters divided into sections between &name and / (or optionally &end). The input sections of the TG control file include &files, ¶ms, &options, and &aocoef.
The typical application will use a control file located in the TG subdirectory and named PEXXPPXX.ctl to control program TG. An annotated version of this file appears below.
OMPO Model Development Project Trip Generation
&files faccess = '..\zd\zdxxxxae.%%%' fhhdist = '..\zd\zdxxxxh3.%%%' fprates = '..\..\generic\tg\luxxpppr.bas' farates = '..\..\generic\tg\luxxppaa.bas' fzdata = '..\zd\zdxxxxxx.%%%'
ftends = 'pexxppxx.%%%' fvo = 'zdxxxxvo.%%%' frpt = 'pexxppxx.rpt' title = 'test the trip generation program'
NOTE: Replace %%% with 3-character alternative specification BAS extension designates modeled rates (SHOULD NOT BE MODIFIED!)
¶ms nzones = 764 nzdata = 33 zinhh = 7 nsdim = 4,4,3 zitype = 31 ntype = 9 ziarea = 33 ziemp = 2
Parsons
Models of Resident Travel Brinckerhoff
Trip Generation
AR00064394

1 246 1 22 91 2 254 1 25 91 3 299 3 28 91 4 273 2 36 88 5 309 3 35 89 6 388 10 42 88 7 393 4 39 90 8 341 4 28 91 9 419 4 28 93
10 424 9 43 89 11 480 10 46 90 12 559 14 50 90 13 446 9 41 90 14 420 3 21 95 15 467 8 41 91
zone Hwy Walk Transit Vehicle Access Access Access Importance
OMPO Model Development Project
User's Guide to Model Application
zipop = 1
&options detail = .f.
&aocoef const = 0.0,-1.00,-2.66,-5.22 denscoef = 0.0,-0.70,-1.83,-1.94 inccoef= 0. , 0. , 0. , 0. ,
0. , 1.38, 1.81, 2.48, 0. , 1.91, 3.45, 4.81, 0. , 1.81, 3.59, 5.58
wrksufcoef= 2.91 othsufcoef= 1.55
In the &files section, the TG control file specifies five input data files, described in detail in section 1.3 below. It also gives names for two output data files, discussed in section 1.4, and one report, discussed in section 1.6. The ¶ms section gives details required for reading the input files and performing vehicle-ownership calculations. The &options section allows the user to specify the level of calculation detail reported via toggle switches. The &aocoef section allows the user to specify the vehicle-ownership model coefficients.
1.3 Input Files
Each of the input data files is in ASCII text format.
File faccess provides zonal accessibility information in a standard ASCII format. Each row is for a zone. The file includes accessibilities to employment for each mode: highway, walk, and transit. The file also includes a vehicle importance measure that is the fraction of the combined highway, walk, and transit accessibility that is due to highway accessibility. An annotated excerpt from faccess= ZEDOOOKAE.c9x follows.
Parsons
Models of Resident Travel Brinckerhoff
Trip Generation C.1-2
AR00064395

OMPO Model Development Project User's Guide to Model Application
The file faccess is output from a MINUTP Matrix setup that computes the vehicle importance measure from the highway skim file, transit skim file, zonal employment, and zonal terminal times. The following steps are performed:
• The highway and transit travel time matrices, terminal times, and employment are read in.
• The terminal times are added to the highway travel time.
• The transit travel time is calculated as 2*out-of-vehicle time + in-vehicle time.
• The highway, transit, and walk impedance for each zone is calculated as the employment at destination/ time 2 summed over all destinations.
• The impedances are dumped into a temporary ASCII format file,
• The temporary impedance file is read in so that vehicle importance measure can be calculated. The vehicle importance measure is calculated as the hwy impedance/ (hwy+transit+walk impedances). The vehicle importance measure for each zone is then output and used as the faccess file in the TG.exe program.
The MINUTP Matrix setup that calculates the vehicle importance measure is shown below:
ZEDOOOKA E.S ET
$Setup to calculate Honolulu auto importance $ Transit out of vehicle times double the weight of in-vehicle travel time *PGM matrix *UNIT 11=..\hwy\skpkxxol.%alt% *UNIT 12=..\trn\skamxxwl.%alt% $read employment data and terminal times zdat ..\zd\zdxxxxxx.c9x,L,Z=1-8,17-24 zdat ..\zd\zdxxxxtc.c9x,L,Z=1-5,2=11-15 $get highway time and add terminal times to it-term times weighted by 2 get 1,101 comp f2= 2.0*(zi2+zj2)+1/100.0 $compute walk time-weighted by 2 comp f3= 2.0*20.0*102/100.0 $compute transit time comp f4= (2.0*201+2.0*202+203)/100.0 $compute highway f to total emp comp f5= zjl/(f2**2.0) comp 15= f5*10.0 $compute walk f to total emp comp f7= zjl/(f3**2.0) comp 17= f7*10.0 $compute transit f to total emp comp f9= zjl/(f4**2.0) comp 19= f9*10.0 $factor and round highway f fac 15,0.1,b $factor and round walk f fac 17,0.1,b $factor and round transit f fac 19,0.1,b $dump trip ends,format=zone,fhwyemp,ftrnemp,fwlkemp
Parsons
Models of Resident Travel Brinckerhoff
Trip Generation C.1-3
AR00064396

Field Format Columns i5 1-5
1 pers 0 wrkr i5 6-10 1 pers 1 wrkr i5 11-15 1 pers 2+ wrkr i5 16-20 2 pers 0 wrkr i5 21-25 2 pers 1 wrkr i5 26-30 2 pers 2+ wrkr i5 31-35 3 pers 0 wrkr i5 36-40 3 pers 1 wrkr i5 41-45 3 pers 2+ wrkr i5 46-50 4 pers 0 wrkr i5 51-55 4 pers 1 wrkr i5 56-60 4 pers 2+ wrkr i5 61-65 5+ pers 0 wrkr i5 66-70 5+ pers 1 wrkr i5 71-75
The key to the fhhdist file follows.
Zone Income 0-20k Income 0-20k Income 0-20k income 0-20k income 0-20k income 0-20k income 0-20k income 0-20k income 0-20k income 0-20k income 0-20k income 0-20k income 0-20k income 0-20k
OMPO Model Development Project
User's Guide to Model Application
tend temp.dat,z=1-8,p15=9-16,p17=17-24,p19=25-32
$read in accessibilities and compute auto imp *PGM matrix zdat temp.dat,L,z=1-8,1=9-16,2=17-24,3=25-32 if i=1-764 if j=1 comp 1=ZI1 comp 2=ZI2 comp 3=ZI3 comp 4=100.0*ZI1/(ZI1+ZI2+ZI3)
end end tend ..\zd\zdxxxxae.%alt%,z=1-8,p1=9-16,p2=17-24 tend p3=25-32,p4=33-40
*>del temp.dat
File fhhdist provides the input household distribution by household size, household income, and number of workers. The household distribution is a three dimensional joint distribution of households. The file is a standard ASCII format file. Each field is 5 columns wide. The first column is the zone number and subsequent columns contain households in each class within the size, income, and number of workers distribution. An excerpt from fhhdist= ZEDOOOKF13.c9x follows.
1 0 100 29 63 29 39 5 65 20 17 27 99 49 0 22 2 64 63 77 94 90 81 82 68 9 73 79 28 75 43 8 3 5 71 58 42 84 75 77 63 32 49 22 76 90 57 4 38 79 97 23 96 30 35 81 51 89 40 33 59 84 40 5 90 8 40 72 77 61 0 79 98 12 23 3 26 52 56 6 52 82 25 84 88 62 92 18 2 87 89 1 32 53 48
Parsons
Models of Resident Travel Brinckerhoff
Trip Generation C.1-4
AR00064397

OMPO Model Development Project User's Guide to Model Application
income 0-20k income 20-40k income 20-40k income 20-40k income 20-40k income 20-40k income 20-40k income 20-40k income 20-40k income 20-40k income 20-40k income 20-40k income 20-40k income 20-40k income 20-40k income 20-40k income 40-75k income 40-75k income 40-75k income 40-75k income 40-75k income 40-75k income 40-75k income 40-75k income 40-75k income 40-75k income 40-75k income 40-75k income 40-75k income 40-75k income 40-75k income 75k+ income 75k+ income 75k+ income 75k+ income 75k+ income 75k+ income 75k+ income 75k+ income 75k+ income 75k+ income 75k+ income 75k+ income 75k+ income 75k+ income 75k+
Field Format Columns 5+ pers 2+ wrkr i5 76-80 1 pers 0 wrkr i5 81-85 1 pers 1 wrkr i5 86-90 1 pers 2+ wrkr i5 91-95 2 pers 0 wrkr i5 96-100 2 pers 1 wrkr i5 101-105 2 pers 2+ wrkr i5 106-110 3 pers 0 wrkr i5 111-115 3 pers 1 wrkr i5 116-120 3 pers 2+ wrkr i5 121-125 4 pers 0 wrkr i5 126-130 4 pers 1 wrkr i5 131-135 4 pers 2+ wrkr i5 136-140 5+ pers 0 wrkr i5 141-145 5+ pers 1 wrkr i5 146-150 5+ pers 2+ wrkr i5 151 -1 55 1 pers 0 wrkr i5 156-160 1 pers 1 wrkr i5 161-165 1 pers 2+ wrkr i5 166-170 2 pers 0 wrkr i5 171-175 2 pers 1 wrkr i5 176-180 2 pers 2+ wrkr i5 181-185 3 pers 0 wrkr i5 186-190 3 pers 1 wrkr i5 191-195 3 pers 2+ wrkr i5 196-200 4 pers 0 wrkr i5 201-205 4 pers 1 wrkr i5 206-210 4 pers 2+ wrkr i5 211-215 5+ pers 0 wrkr i5 216-220 5+ pers 1 wrkr i5 221-225 5+ pers 2+ wrkr i5 226-230 1 pers 0 wrkr i5 231-235 1 pers 1 wrkr i5 236-240 1 pers 2+ wrkr i5 241-245 2 pers 0 wrkr i5 246-250 2 pers 1 wrkr i5 251-255 2 pers 2+ wrkr i5 256-260 3 pers 0 wrkr i5 261-265 3 pers 1 wrkr i5 266-270 3 pers 2+ wrkr i5 271-275 4 pers 0 wrkr i5 276-280 4 pers 1 wrkr i5 281-285 4 pers 2+ wrkr i5 286-290 5+ pers 0 wrkr i5 291-295 5+ pers 1 wrkr i5 296-300 5+ pers 2+ wrkr i5 301-305
Parsons
Models of Resident Travel Brinckerhoff
Trip Generation C.1-5
AR00064398

OMPO Model Development Project
User's Guide to Model Application
File fprates provides per-household trip-production rates for each household size, income, and vehicle-ownership class. An annoatated excerpt from fprates= LLDKXPPPR.BAS follows.
1.052 1.175 .789 .320 P= A=1 INC=1 HHS=1-4 .867 1.564 1.858 2.151 P= A=2 INC=1 HHS=1-4 .897 2.054 2.203 3.468 P= A=3 INC=1 HHS=1-4 .563 1.466 1.812 2.000 P= A=1 INC=2 HHS=1-4 .967 1.293 1.711 1.880 P= A=2 INC=2 HHS=1-4
1.249 1.856 2.283 3.638 P= A=3 INC=2 HHS=1-4 .855 1.793 1.114 1.875 P= A=1 INC=3 HHS=1-4
1.160 1.531 1.806 2.250 P= A=2 INC=3 HHS=1-4 1.125 2.056 2.432 3.104 P= A=3 INC=3 HHS=1-4 .960 1.344 1.293 .558 P= A=1 INC=4 HHS=1-4 .889 1.708 1.838 3.220 P= A=2 INC=4 HHS=1-4
2.835 1.605 2.208 3.451 P= A=3 INC=4 HHS=1-4 99999999
.337 .386 .000 .107 P=jtw-hbnw A=1 INC=1 HHS=1-4
.314 .685 .459 .268 P=jtw-hbnw A=2 INC=1 HHS=1-4
.514 .683 .783 .562 P=jtw-hbnw A=3 INC=1 HHS=1-4
.289 .300 .094 .000 P=jtw-hbnw A=1 INC=2 HHS=1-4
.330 .540 .436 .591 P=jtw-hbnw A=2 INC=2 HHS=1-4
File farates contains per-attractor trip-attraction rates, with one row per combination of attractor-type and area-type. Each row has trip-attraction rates for each of the eleven trip purposes, in order (11f8), followed by the area-type to which it applies (i8) and the field in file fzdata containing the attractor-type to which it applies (i8). An annoatated excerpt from farates= LUXXPPAA.BAS follows.
.000 0.06 .000 0.16 0 6 TOT HOUSEHOLDS
.000 0.00 .000 0.14 0 22 STD: PRI GR13+
.000 0.00 .000 0.14 0 23 STD: PUB GR13+
.000 0.22 .000 0.21 0 24 STD: PRIV K-12
.000 0.22 .000 0.21 0 25 STD: PUBL K-12
.000 0.58 .000 1.83 0 32 retl empl 1.15 0.12 0.34 0.28 0 30 (totemp-ggemp)
99999999 1 2 3 11 atype zi# purpose number
jtw jtw jtw nwr journey-type hbw hbnw wb nhb trip purpose
File fzdata provides data on households and attractors. It contains one row per zone. All fields in this file are 8 columns wide. In section ¶ms, nzdata specifies the total number of fields in fzdata. It includes the following pointers to fields numbers: nitype to area type, zinhh to number of households, zitype to area type, ziarea to zonal area, ziemp to number of employees, and zidistr to area number (for area-specific seed matrices). The key to the fzdata file is shown below.
Parsons
Models of Resident Travel Brinckerhoff
Trip Generation C.1-6
AR00064399

column# columns data zone population total employment (sum of cols 11-20) housing units hotel rooms residential units group quarters residents total households mean persons per household mean household income ($) district (1-23) puma (1-7) military employment government employment hotel employment agricultural employment wholesale, transp., communic., & utilities employment manufacturing employment finance,insurance & real estate employment service employment retail employment construction employment private college students public college students private k-12 students public k-12 students number of schools workers residing in group quarters retail employment: resident-oriented retail employment: visitor-oriented total employment by workers residing in households area type (1-9) retail employment: resident-oriented area of zone (in square miles)
1 -- 1-8 2 1 9-16 3 2 17-24 4 3 25-32 5 4 33-40 6 5 41-48 7 6 49-56 8 7 57-64 9 8 65-72 10 9 73-80 11 10 81-88 12 11 89-96 13 12 97-104 14 13 105-112 15 14 113-120 16 15 121-128 17 16 129-136 18 17 137-144 19 18 145-152 20 19 153-160 21 20 161-168 22 21 169-176 23 22 177-184 24 23 185-192 25 24 193-200 26 25 201-208 27 26 209-216 28 27 217-224 29 28 225-232 30 29 233-240 31 30 241-248 32 31 249-256 33 32 257-264 34 33 265-272
OMPO Model Development Project
User's Guide to Model Application
1.4 Output Files
Program TG produces two output files. Both are named in &fnames as ftends and fvo. The file ftends contains one row per zone. Each row has a zone number (i5) followed by trip productions then trip attractions, in trip purpose order. Home-based trip purposes have a field for each vehicle-ownership class (3i8), while non-home-based purposes have one field (i8). Each purpose has one field of attractions (11i8).
Purpose Columns of Productions
Columns of Attractions
JTW: HBW 1,2,3 24
JTW: HBNW 4,5,6 25
JTW: WB 7 26
JTW: NB 8 27
JAW: WB 9 28
JAW: NB 10 29
Parsons
Models of Resident Travel Brinckerhoff
Trip Generation C.1-7
AR00064400

column# 1 --
columns data 1-8 zone
2 1 9-16 household 3 2 17-24 household 4 3 25-32 Percentage 5 4 33-40 Percentage 6 5 41-48 Percentage 7 6 49-56 Percentage
income category size category of 0 vehicle households of 1 vehicle households of 2 vehicle households of 3+ vehicle households
OMPO Model Development Project
User's Guide to Model Application
Purpose Columns of Productions
Columns of Attractions
NWR: HBK12 11,12,13 30 NWR: HBCol 14,15,16 31 NWR: HBShp 17,18,19 32 NWR: HBOth 20,21,22 33 NWR: NHB 23 34
The file fvo is an ASCII formatted file of vehicle ownership shares calculated by the vehicle ownership model. The file contains several rows per zone, for the various household income and size categories. For each zone, the shares for each household income and household size combination is listed. The following is a key to the fvo file:
1.5 Controls
The sections above define the use of most controls. In addition, section &fnames provides title, which gets written to the report file. Section ¶ms defines nzones as the number of zones and ntype as the number of area types (for area-type specific attraction rates). In section &options, detail allows more calculations written to the report file. Section &aocoef specifies the coefficients for the vehicle-ownership model.
1.6 Reports
The report file includes by default program name, user title, and timing information, along with an echo of the inputs controls and any errors encountered. The detail control in section &options allows inspection of internal calculations.
1.7 Error Messages
Program TG generates error messages for two levels of severity: error, noted (e), and fatal (f). Fatal errors cause TG to terminate immediately. Messages noted with (i) provide information, not error reports.
Rctl errors arise from problems in the control file. Rdata and Rdat3 errors indicate problems interpreting the input data.
mc 9000 (f): stopping because of error(s)
This message sums up all rctl and rdat3 errors encountered.
Parsons
Models of Resident Travel Brinckerhoff
Trip Generation C.1-8
AR00064401

OMPO Model Development Project
User's Guide to Model Application
rctl 9002 (f) error(s) reading &
Section &name has a problem in the control file.
rctl 9003 (f) zinhh not valid
The field number given by zinhh is outside the range (1, nzdata).
rctl 9004 (f) zipop not valid
The field number given by zipop is outside the range (1, nzdata).
rctl 9005 (f) ziarea not valid
The field number given by ziarea is outside the range (1, nzdata).
rctl 9006 (f) ziemp not valid
The field number given by ziemp is outside the range (1, nzdata).
rctl 9007 (f) zitype not valid
The field number given by zitype is outside the range (1, nzdata).
rdata 9007 (e) zditem invalid on record# in
In farates, the attactor-type field number is invalid.
rdata 9008 (e) zone <> record# in rdata 9009 (e) # records <> nzone
-
s in
File fzdata must contain exactly one row per zone, in zone number order.
rdata 9020 (e) zone <> record# in rdata 9012 (e) # records <> nzone
-
s in
File faccess must contain exactly one row per zone, in zone number order.
rdata 9010 (e) zone <> record# in rdata 9011 (e) # records <> nzone
-
s in
File fhhdist must contain exactly one row per zone, in zone number order.
marg 9001 (e): mean > curve upper bound
File fzdata must contain exactly one row per zone, in zone number order.
Parsons
Models of Resident Travel Brinckerhoff
Trip Generation C.1-9
AR00064402

OMPO Model Development Project User's Guide to Model Application
2. Trip Distribution
Program TD.EXE applies the Trip Distribution model, a logit-form destination choice model. Each trip purpose requires a separate application of program TD, including home-based trip purposes which are stratified by vehicle ownership.
2.1 Purpose
Program TD connects trip-production with trip-attractions based on the impedance among zones. The input trip-ends come from the Trip Generation application. Program TD produces zone-to-zone trips for the first time in the model sequence. The trip tables produced by program TD provide the subsequent Mode Choice application with zone-to-zone total trips to apportion among modes.
2.2 Control File
Program TD reads a standard Fortran control file from the command line. Standard Fortran control files have input parameters divided into sections between &name and / (or optionally &end. The input sections of the TD control file include &files, ¶ms, and &options.
The typical application will use a control file located in the TD subdirectory and named (for the home-based work) PPXXVVI-1XX.CTL to control program TD. An annotated version of this file appears below. Further discussion highlights differences between this example and the control files for other trip purposes.
OMPO Model Development Project Control File for Trip Distribution Application TD.EXE Journey-to-Work Home-Based Work Trips
&files ftends = '..\tg\pexxppxx.%%%' fimpeds = '..\hwy\skpkxxol.%%%' fequivs = '..\..\generic\zd\764to23.eqv' ftripo = 'ppxxwhxx.%%%' frpt = 'ppxxwhxx.rpt' fkfac = '..\..\generic\td\kfxxwhxx.bas' title = 'TD for JTW:HBW'
NOTE: Replace %%% with 3-character alternative specification BAS extension designates calibrated data (SHOULD NOT BE MODIFIED!)
¶ms nzones = 764 ndists = 23 nfends = 34 nfProds = 1,2,3 nfAttrs = 24 tabimp = 1 nincr = 1 plbeg = -0.14,-0.17,-0.16 p2beg = 0.0004,0.0013,0.0013
Parsons
Models of Resident Travel Brinckerhoff
C.2-1 Trip Distribution
AR00064403

OMPO Model Development Project
User's Guide to Model Application
maxiter = 30 reltol = 2 abstol = 10 width = 2 nintervs = 50 scale = 100.0 offset = 0.0
&options prtegv = .false. calib = .false.
In the &files section, the TD control file specifies four input data files, described in detail in section 2.3 below. It also gives names for the one output data file, discussed in section 2.4, and one report, discussed in section 2.6. The ¶ms section gives details required for reading the input files and parameters for the Trip Distribution logit model. The &options section allows the user to see the zone-to-district equivalency table and specifies whether program TD should run in application or calibration mode. Only experienced users will need to employ calibration mode.
2.3 Input Files
File ftends contains text-format trip-ends for all trip purposes output by program TG, in one row per zone. Each row has a zone number (i5) followed by trip productions then trip attractions, in trip purpose order. Home-based trip purposes have a field for each vehicle-ownership class (3i8), while non-home-based purposes have one field (i8). Each purpose has one field of attractions (11i8). In section ¶ms, nzones reports the number of rows in ftends and nfEnds the number of data fields.
File fimpeds holds zone-to-zone impedances in MI NUTP matrix format. These impedances can represent travel times, monetary costs, generalized costs, or any other measure of the difficulty of travel from each zone to each other zone. File fimpeds must contain impedances for the number of zones reported in ¶ms nzones. Pointer ¶ms tabimp indicates which matrix number in file fimpeds holds the impedances to be used by program TD.
File fequivs contains a zone-to-district equivalency table, which tells program TD in which district each zone lies. Program TD uses this information to interpret the k-factors. Each row represents a district, and file fequivs needs to have the number of rows shown in ¶ms ndists. Each row starts with the keyword 'DIST' followed by a space and the district number. An equals sign separates the district number from the zone number ranges that comprise it. A section of an example equivalency file follows.
DIST 1=220-228,234-270,274 Downtown DIST 2=176-178,185,187,198-199,202-219,229-233 Kakaako DIST 3=186 Ala Moans. DIST 4=179-184,188-197,200-201 Beretania DIST 5=74-79,271-273,275-285 Makiki DIST 6=105-107,110-137 Waikiki
Parsons
Models of Resident Travel Brinckerhoff
C.2-2 Trip Distribution
AR00064404

OMPO Model Development Project User's Guide to Model Application
File fkfac contains district-to-district k-factors in MI NUTP matrix format for the number of districts given in ¶ms ndists. The trip distribution model can require k-factors for interchanges where the model doesn't fully explain the magnitude of travel in a district interchange. Program TD writes fkfac in calibration mode, and reads fkfac in application mode. A matrix of 1s can fill this slot if the user does not want to apply k-factors.
2.4 Output Files
Program TD produces a single output file, named in &fnames as ftripo. This file contains zone-to-zone trips in MINUTP matrix format for the number of zones given in ¶ms nzones. The file contains one table for purposes not stratified by vehicle ownership and contains three tables for purposes that are stratified by vehicle ownership. If the input productions for a particular purpose are stratified by vehicle ownership and only one set of parameters (one set of p1beg and p2beg) are specified then the program sums the productions across all vehicle ownership classes and applies the TD model to the summed productions. In this situation, the output file contains one table even though the input trip productions are stratified by vehicle ownership.
2.5 Controls
Other sections related to specific file types define the use of many controls. In addition, section &fnames provides title, which gets written to the report file. Section ¶ms defines nfProds as pointers to the fields in file ftends that contain productions for this trip purpose, and nfAttrs points to the field with attractions. The parameters p1beg and p2beg define the coefficients to be used in the Trip Distribution model. Both of these parameters can read a series of three values for purposes that are stratified by vehicle ownership. The nincr switch along with &options calib define whether program TD runs in calibration or application mode. Also in section &options, prteqv turns on and off printing of the equivalency table to the report file.
2.6 Reports
The report file includes by default program name, user title, and timing information, along with an echo of the inputs controls, other informational messages, and any errors encountered.
2.7 Error Messages
Program TD generates error messages for two levels of severity: error, noted (e), and fatal (f). Fatal errors cause TD to terminate immediately. Messages noted with (i) provide information, not error reports.
Rctl errors arise from problems in the control file. Rdata and rdat3 errors indicate problems interpreting the input data. A marg error reports a problem in constructing the marginal distribution from the zonal mean.
td 9002 (i): summary of trial iterations
This message provides a header for calibration results only.
Parsons
Models of Resident Travel Brinckerhoff
C.2-3 Trip Distribution
AR00064405

OMPO Model Development Project
User's Guide to Model Application
td 9003 (i): applying distribution model
This just provides a checkpoint.
td 9004 (i): k factor iteration
This message relates which k-factor iteration is running.
td 9999 (f): stopping because of error(s)
This message sums up all rctl errors encountered.
rctl 9002 (f) error(s) reading &
Section &name has a problem in the control file.
rctl 9003 (f) error(s) need kfac file
Program TD in calibration mode requires fkfac.
rdata 9000 (e) zone <> record# in rdata 9001 (e) # records <> nzones in
File ftends must have one row per zone, in increasing zone-number order.
rdata 9011 (f) nfprods(_) has invalid value
NfProds must lie between 1 and NfEnds.
tdist 9002 (i) impedances reset to max value
All impedances must lie within the valid range for the logit formulation. If any impedances lies outside this range, it is reset to the nearest boundary.
Program TD generates various other informational and error messages in calibration mode. Since the user will only be running in application mode, none of these messages should be encountered.
Parsons Models of Resident Travel Brinckerhoff C.2-4 Trip Distribution
AR00064406

OMPO Model Development Project User's Guide to Model Application
3. Mode Choice
Program MC.EXE applies the Mode Choice model, a nested logit choice model. Each of the eleven trip purposes requires a separate application of program MC.
3.1 Purpose
Program MC assigns trips to modes, paths, and occupancies based on the relative attractiveness of the competing options. The input daily person-trip tables come from the Trip Distribution application. The mode-specific trip tables produced by MC provide the subsequent Time-of-Day application with zone-to-zone trips by mode, path, and occupancy.
3.2 Control File
Program MC reads a standard Fortran control file from the command line. Standard Fortran control files have input parameters divided into sections between &name and / (or optionally &end). The input sections of the MC control file include &files, ¶ms, &options, &selects, and &parms.
Each scenario requires eleven applications of program MC, one for each trip purpose. Files with names of the form MC\PPXXWHMM.ctl control application of MC for each purpose (WH= JTW-HBVV). An annotated version of this file appears below. Further discussion highlights differences between this example and the control files for other trip purposes.
OMPO Travel Forecasting Model Development Project Mode Choice Model Application for base system Purpose JTW-HBW (code wh)
&files title = 'OMPO MC JTW-HEW (wh)' Fzdata = ..\zd\zdxxxxtc.%%%' Fsdata = T..\trn\acc\alxxxxsd.%%%' Ftends = T..\tg\pexxppxx.%%%' Ftrper = ..\td\ppxxwhxx.%%%' Fskocl = ..\hwy\skpkxxol.%%%' Fskoc2 = T..\hwy\skpkxxo2.%%%' Fskoc3 = ..\hwy\skpkxxo3.%%%' Fskwn = ..\trn\skamxxwl.%%%' Fskwp = ..\trn\skamxxwp.%%%' Fskpr = ..\trn\skamxxpr.%%%' Fskkr = ..\trn\skamxxkr.%%%' Fskaw = T..\axl\skxxxxwk.%%%' Fskab = ..\axl\skxxxxbk.%%%' Frpt = 'ppxxwhmm.rpt' Ftrmc = 'ppxxwhmm.%%%'
NOTE: Replace %%% with 3-character alternative specification
¶ms nzones = 764 period = 1 nzdata = 5
Parsons
Models of Resident Travel Brinckerhoff
C.3-1 Mode Choice
AR00064407

OMPO Model Development Project
User's Guide to Model Application
nsdata = 5 pttab = 1,2,3 toler = 0.01 mxiter = 30 calwgt = 2.0 lsoffset= 5.0 lsscale = 650.0 tollmdl = f sllimit = 500
&options dryrun = f debug = f calib = f Tijonly = t geo =f pnrknr = t dacc =t noprem = f firstw = t
&selects = 1,-764 = 1,-764
reports = 1,-3 nfprods = 1,2,3
&parms DCpm = 12.0
Civt = -0.0250 Cwalkt = -0.0500 Cwaitt = -0.0500 Ccost = -0.0042 Cdrat = 0.0000 Clwaitt = -0.0250
Ctsav = 0.271 Ctdst = 0.070 Ctout = -0.070 Ctoll = -0.001
Clsacc = 0.700 Clspath = 0.500 Clslot = 0.500 Clsauto = 0.700 Clsocc = 0.500 Clsaux = 0.700 Clstoll = 0.300 Xferwt = 248
Izda = 0.5280 Izsr2 = 0.0941 Izsr3 = 0.1128 Izwalk = 0.2503 Izbike = 0.0148
Parsons
Models of Resident Travel Brinckerhoff
C.3-2 Mode Choice
AR00064408

OMPO Model Development Project
User's Guide to Model Application
Kocc3 = -3.241 Klsr = -0.840 K2sr = -1.432 Kgdwy = 0.000 Kprem = -0.856 KlKnr = 0.738 K2Knr = 1.195 KPKnr = 1.308 KOdacc = -2.647 Kldacc = -2.115 K2dacc = -1.709 Kauxb = -3.311 KOTrn = 3.513 KlTrn = -0.201 K2Trn = -1.470 KOAux = 5.315 KlAux = 2.027 K2Aux = -0.047
When running a toll alternative, the following files need to be specified. In the &files section, the fltol needs to be specified. In the JTW-HBW purpose, fltol = ppxxwhtl.%%%. In the ¶ms section, tollmdl needs to be set to T for true.
In the &files section, the MC control file specifies eleven input data files, described in detail in section 3.3 below. It also gives names for the one output data file, discussed in section 3.4, and one report, discussed in section 3.5.
The ¶ms section gives details required for reading the input files, writing the output files, and controlling some calculations. Toler is used to specify the minimum calibration tolerance value - absolute relative error, mxiter is used to set the maximum number of iterations in the calibration mode, calwgt is the calibration weight, tollmdl is the on/off switch to run the mode choice model with toll as a choice, and sffimit is the maximum short wait time - the dividing line between short and long wait.
The &options section allows the user to use program MC to just check for the presence of all input file (dryrun), report detailed calculations (debug), run program MC in calibration or application mode (calib), consider only interchanges with trips (tijonly), switch on/off the geographic stratification (geo), switch on/off to allow for the calibration of the knr constant (pnrknr), switch on/off to allow calibration of the drive access constant (dacc), switch on/off to allow calibration of the express bus constant - Kprem (noprem) and switch on/off to use initial wait for transit skims (firstw).
Section &selects chooses which i- and j-interchanges to consider (i, j), which reports to produce (reports), and which fields in file ftends contain productions for this trip purpose (nfprods). Section &parms contains all utility function coefficients (dcpm and c*), all segment-specific constants (k*), and if running in calibration mode all observed shares (s*). Only experienced users will need to employ calibration mode.
Parsons Models of Resident Travel Brinckerhoff C.3-3 Mode Choice
AR00064409

OMPO Model Development Project User's Guide to Model Application
3.3 Input Files
File fzdata contains zonal data required by program MC, in one row per zone with the number of zones given in ¶ms nzones. Each row includes the zone number (i5) and the number of fields given by ¶ms nzdata (in this case five): destination-type indicator (i5) (1=CBD [area type 1], 2=Other Core [area types 2 and 3], 3=Elsewhere [other area types]), auto terminal time in minutes (i5), parking costs for peak and off-peak in cents (2i5), and the percent of the zone that can walk to transit (i5). The period pointer in section ¶ms indicates whether the peak (1) or off-peak (2) parking cost applies for this trip purpose. The box below shows an excerpt from fzdata.
1 3 3 61 61 100 2 3 3 61 61 100 3 3 3 61 61 100 4 3 3 61 61 100 5 3 3 61 61 100 6 3 2 64 64 100
File fsdata describes formal park-n-ride lots, in one row per station/lot. Each row includes the zone number (i5) followed by the number of fields given in ¶ms nsdata (in this case five): highway network node where the lot is located (i5), fixed vehicle capacity (i5), starting vehicle capacity for capacity-restraint (i5), and parking cost in cents (i5). Comments such as the lot name can be included after these required fields. An excerpt is shown below.
1 2643 500 0 50 Hawaii Kai 2 2484 500 0 75 Mililani Mauka 3 2765 500 0 100 Wahiawa 4 2571 500 0 125 Royal Kunia
File ftends contains text-format trip-ends for all trip purposes output by program TG, in one row per zone. Each row has a zone number (i5) followed by trip productions then trip attractions, in trip purpose order. Home-based trip purposes have a field for each vehicle-ownership class (3i8), while non-home-based purposes have one field (i8). Each purpose has one field of attractions (11i8). In section ¶ms, nzones reports the number of rows in ftends and nfProds points to the production columns for this trip purpose.
File ftrper is the trip-table output by program TD for this trip purpose. This file contains zone-to-zone trips in MI NUTP matrix format for the number of zones given in ¶ms nzones.
The remaining input files contain skimmed zone-to-zone impedance information in MIN UTP matrix format, produced by the Transportation System applications. File fskwn includes seven skim tables for the walk-to-nonguideway transit mode, and file fskwg would include the same for the walk-to-guideway mode if it were available in this scenario. The walk-to-transit tables occur in order walk time, wait time, all-modes transit-vehicle time, guideway transit-vehicle time, premium transit-vehicle time, number of transfers, and fare. Files fskkr and fskpr represent kiss-n-ride and park-n-ride travel, respectively, and have the same first seven tables as the walk-transit files, followed by tables containing the parking lot number, drive time, and drive distance. Files fskaw and fskab represent travel by the auxiliary modes, walk and bike respectively. They each have slots for ten tables, but only the third table has non-zero values, total time.
Parsons Models of Resident Travel Brinckerhoff C.3-4 Mode Choice
AR00064410

OMPO Model Development Project User's Guide to Model Application
3.4 Output Files
Program MC produces an output trip file in MI NUTP matrix format, named in &files ftrmc. This file contains ten tables, one for each mode, in order: highway occupancy 1, 2, and 3+; transit walk-to-premium, walk-to-local, walk-to-guideway, park-n-ride, and kiss-n-ride; and auxiliary walk and bike.
When running the toll option, MC produces a file named in &files fltol a matrix with 6 tables in the following order: drive alone non-toll trips, drive alone toll trips, 2-person non-toll trips, 2- person toll trips, 3+ person non-toll trips, 3+person toll trips.
Program MC can also produce two types of LogSum (composite impedance) files, also in MI NUTP matrix format. File flsqos contains six tables, with the LogSum for each composite mode, in order: shared ride, walk-to-transit, drive-to-transit, highway, transit, auxiliary. File flsdst contains three tables, one for each vehicle-ownership class. This information provides the Land Use models with an overall measure of the impedance between two zones. Two parameters in ¶ms, lsoffset and lsscale, govern the range of values for the LogSum outputs. See the Mode Choice model documentation (Guide to Model Form, Chapter C.5) for more details.
3.5 Reports
The report file includes by default program name, user title, and timing information, along with an echo of the inputs controls, other informational messages, and any errors encountered.
3.6 Error Messages
Program MC generates error messages for two levels of severity: error, noted (e), and fatal (f). Fatal errors cause MC to terminate immediately. Messages noted with (i) provide information, not error reports.
Rctl errors arise from problems in the control file. Rdata and rdat3 errors indicate problems interpreting the input data. A marg error reports a problem in constructing the marginal distribution from the zonal mean.
Parsons Models of Resident Travel Brinckerhoff C.3-5 Mode Choice
AR00064411

OMPO Model Development Project
User's Guide to Model Application
mc 9001 (f): stopping because dryrun = true
This message sums up all rctl errors encountered.
mc 9002 (e) lsgoso<0 for iz,jz,t: mc 9003 (e) lsdsto<0 for iz,jz,t:
These messages indicate that the scale and offset applied to LogSums yield values less than zero, which cannot be stored in a MI NUTP matrix.
rctl 9002 (f) error(s) reading &
Section &name has a problem in the control file.
rctl 9003 (f) name blank for file:
A required file has not been correctly designated.
rctl 9004 (f) clsacc, clspath, clsauto, clsocc, or clsaux = 0.0
The LogSum coefficients cannot equal zero.
rctl 9005 (f) obs share = 0 for *,*,m: rctl 9006 (f) obs share = 0 for s,*,m: rctl 9007 (f) obs share = 0 for s,d,m:
Calibration mode requires observed shares greater than zero for all segments for which constants will be calibrated.
rctl 9008 (f) record of fzdata has invalid zone number
File fzdata must have nzones rows in order of increasing zone number.
rctl 9009 (f) record of fzdata has invalid areatype for zone
Only destination-types of 1-3 are allowed.
rctl 9010 (f) record of fsdata has invalid station number
No more than 300 station lots are allowed.
rctl 9011 (f) nfprods( ) has invalid value rctl 9012 (f) record of ftends has invalid zone number
Program MC checks to make sure that file ftends has the format produced by program TG.
filopn 9007 (f) zones not equal to nzones: <> filopn 9008 (f) tabs not equal to ntabs: <>
Each input matrix must have data for nzones zones, and must have the number of tables specified in section 3.3 as produced by the Transportation System applications.
getin 901 (f): table sequence error, unit , izone table gets
An input matrix file has an internal error.
Parsons
Models of Resident Travel Brinckerhoff
C.3-6 Mode Choice
AR00064412

OMPO Model Development Project
User's Guide to Model Application
comp 9007 (e) output <> input (i,j,in,out,diff):
The internal check on conservation of trips has failed.
tran 9003 (e) ij guideway ivt in walk to non-guideway skim
The walk-to-non-guideway path should not include any time spent in a guideway vehicle.
tran 9004 (e) ij
pnr not in stations tran 9005 (e) ij
knr not in stations
Table 8 of one of the drive-to-transit skims has a station number that doesn't appear in fsdata.
kupdate (f) totals are zero
In calibrating constants, the estimated total trips equal zero.
3.7 Listing of Keywords
The control file has a series of Keywords specified in a namelist format. These keywords allow the user to specify the information the program should use. Section 3.2 presents the keywords needed to run the standard mode choice models for the base year. The program can also be used to build the LogSum variables for the land use model and to run the mode choice model using guideway skim trees for a future year scenario. This section presents a complete listing of all the keywords, their meanings, and the default value if any.
For the &files group the Keywords are as follow:
Keyword Description Default value
Title The title for reports (C) 1 None Fzdata The name of the mode choice zone data file (C) 2 None Fsdata The name of the PnR and Station data file (C) None Ftends The name of the trip end file from trip generation None Frpt The name of the output report file None Ftrper The name of the input person trips None Fskoc1 The name of the input Hwy Occ1 skim trees None Fskoc2 The name of the input Hwy Occ2 skim trees None Fskoc3 The name of the input Hwy Occ3 skim trees None Fskwp The name of the input trn walk-prem skim trees None Fskwg The name of the input trn walk-guideway skim trees None Fskwn The name of the input trn walk-local skim trees None Fskpr The name of the input Park and Ride skim trees None Fskkr The name of the input Kiss and Ride skim trees None Fskaw The name of the input walk skim trees None Fskab The name of the input bicycle skim trees None Ftrmc The name of the output modal trip tables None Fltol The name of the output modal toll trip tables None Flsqos The name of the output log sum for level of service None
If a keyword is a character variable, noted by (C), it should be place within single quotes as shown in section 3.2.
2 The name of the data file can include it path, see section 3.2.
Parsons Models of Resident Travel Brinckerhoff C.3-7 Mode Choice
AR00064413

OMPO Model Development Project
User's Guide to Model Application
Keyword Description Default value
Flsdst Fuserbn
The name of the output log sums by car ownership The name of the output user benefit file used in Summit
None None
For the ¶ms group the Keywords are as follow:
Keyword Description Default value
Nzones The number of zones 762 Nzdata Number of fields in the zone data file 5 Nsdata Number of fields in the station data file 4 period Period for the model (1 = peak or 2 = off-peak) 1 Isoffset The offset value for the log sum values 100 Isscale The scale factor for the log sum values 50 Pttab Table numbers for person tables in ftrper (3) 1,0,0 cperocc If true divide costs by occupancy True minratio Minimum allowable transit time to drive to transit time 3 3.0 Mindrv Minimum allowable drive to transit time (minutes) 1.0 mxiter Maximum number of iterations for calibration 1 toler Minimum calibration tolerance value — absolute relative error 0.01 tollmdl On/off switch to run model with toll as a choice True tpurp Name of trip purpose for User benefit file None tday Time of day for User benefit file None altname Alternative name for user benefit file None
For the &options group the Keywords are as follow:
Keyword Description Default value
Dryrun Check input names (T) or run the program (F) False Debug Report details of computation (T) False Calib Apply the model (F) or calibrate constants (T) False Tijonly Only apply model to interchanges with trips (T) 4 True geo On/off switch to run model with geographic stratification False pnrknr On/off switch to allow calibration of the KNR constant True dacc On/off switch to allow calibration of the drive access constant True firstw On/off switch to use initial transit wait time in model True noprem On/off switch to allow calibration of the express bus constant False
For the &selects group the Keywords are as follow:
Keyword
Description Default value
reports Write standard reports 5 Origin zones to be used 6
None None
3 If the ratio is lower than this (for example if transit time is only twice the drive to transit time, then the drive to transit mode is not an acceptable choice.
4 For application of the mode choice model this keyword should be true but for building log sum values the keyword should be false
5 The reports key word was originally set-up to write up to 10 standard reports. The program at the present time though simply writes one set of reports. Please code this keyword as 1,-3.
Parsons
Models of Resident Travel Brinckerhoff C.3-8 Mode Choice
AR00064414

OMPO Model Development Project
User's Guide to Model Application
Keyword Description Default value
.i nfprods userben
Destination zones to be used 6 The field number(s) for the productions in the trip end input data On/off switch output user benefit file for Summit
None None None
The user can specify up to 20 groups of zones. For ranges code the first zone of the zone and the last zone of the range with a minus sign. For example to request zones 1 to 20, zones 100 to 200, and zones 301 and 303, this keyword would be coded as I = 1,-20,100,-200,301,303. Under normal conditions the keyword is coded with the first and last zone (e.g. 1,-764).
Parsons Models of Resident Travel Brinckerhoff C.3-9 Mode Choice
AR00064415

Keyword Default value Description
Dcpm Civt Cwalkt Cwaitt Ccost CLsacc CLspath CLslot CLsauto CLsocc CLaux Ctsav Ctdst Ctout Ctoll CLstollda CLstollsr Cdrat Kocc3 K1 sr K2sr Kgdwy Kprem K1knr K2knr KOdacc K1dacc K2dacc KOcbdtrn KOothtrn KOelstrn Klcbdtrn K1othtrn Klelstrn K2cbdtrn K2othtrn K2elstrn Kauxb KOcbdaux KOothaux KOelsaux K1cbdaux K1othaux Klelsaux K2cbdaux K2othaux K2elsaux KKnr
Operating cost per mile (cents/mile) Coefficient on in-vehicle time Coefficient on walk time Coefficient on wait time Coefficient on cost Nesting coefficient on the LogSum of access nest Nesting coefficient on the LogSum of path nest Nesting coefficient on the LogSum of lot nest Nesting coefficient on the LogSum of auto nest Nesting coefficient on the LogSum of occupancy nest Nesting coefficient on the LogSum of auxiliary nest Coefficient for toll time savings Coefficient for toll road distance Coefficient for toll path excess distance Coefficient for toll cost Nesting coefficient on the LogSum for drive alone toll nest Nesting coefficient on the LogSum for shared ride toll nest Coefficient on drive-access time ratio for park and ride paths Constant on occupancy 3 in occupancy nest Constant on shared ride for 1 car Households in auto nest Constant on shared ride for 2+ car households in auto nest Constant on guideway in path nest Constant on premium transit in path nest Constant on kiss and ride for 1 car households in lot nest Constant on kiss and ride for 2 car households in lot nest Constant on drive access for 0 car households in access nest Constant on drive access for 1 car households in access nest Constant on drive access for 2+ car HHs in access nest Constant on transit for 0 car households for trips to CBD Constant on transit for 0 car HHs for trips to Other Core Constant on transit for 0 car HHs for trips to elsewhere Constant on transit for 1 car households for trips to CBD Constant on transit for 1 car HHs for trips to Other Core Constant on transit for 1 car HHs for trips to elsewhere Constant on transit for 2 car households for trips to CBD Constant on transit for 2 car HHs for trips to Other Core Constant on transit for 2 car HHs for trips to elsewhere Constant on bike in auxiliary nest Constant on auxiliary mode for 0 car HHs for trips to CBD Constant on auxiliary mode for 0 car HHs for trips to Other Core Constant on aux. mode for 0 car HHs for trips to elsewhere Constant on auxiliary mode for 1 car HHs for trips to CBD Constant on auxiliary mode for 1 car HHs for trips to Other Core Constant on aux. mode for 1 car HHs for trips to elsewhere Constant on auxiliary mode for 2 car HHs for trips to CBD Constant on auxiliary mode for 2 car HHs for trips to Other Core Constant on aux. mode for 2 car HHs for trips to elsewhere Constant on kiss and ride
None None None None None None None None None None None None None None None None None None None None None None None None None None None None None None None None None None None None None None None None None None None None None None None None
OMPO Model Development Project
User's Guide to Model Application
For the &parms group the Keywords are as follow:
Parsons Brinckerhoff C.3-10
Models of Resident Travel Mode Choice
AR00064416

OMPO Model Development Project
User's Guide to Model Application
Keyword Description Default value
KPKnr Constant for informal park and ride None KcbdTrn Constant on transit for trips to CBD None KcbdAux Constant on auxiliary mode for trips to CBD None KothTrn Constant on transit for trips to Other Core None KothAux Constant on auxiliary mode for trips to Other Core None KelsTrn Constant on transit for trips to elsewhere None KelsAux Constant on auxiliary mode for trips to elsewhere None KOTrn Constant on transit for 0 car households None KOAux Constant on auxiliary mode for 0 car households None K1Trn Constant on transit for 1 car households None K1Aux Constant on auxiliary mode for 1 car households None K2Trn Constant on transit for 2 car households None K2Aux Constant on auxiliary mode for 2 car households None SIlimit Maximum short wait time None lzda Fixed intrazonal drive alone mode share None Izsr2 Fixed intrazonal shared ride 2 mode share None Izsr3 Fixed intrazonal shared ride 3+ mode share None lzwalk Fixed intrazonal walk mode share None lzbike Fixed intrazonal bike mode share None Mamalk Maximum walk time in hundreds of minutes None Maxbike Maximum bike time hundreds of minutes None Xfe Rut Transfer time weight in hundreds None
Parsons Models of Resident Travel Brinckerhoff C.3-11 Mode Choice
AR00064417

OMPO Model Development Project User's Guide to Model Application
4. Time-of-Day and Directional Factoring
A MINUTP setup, dftboomset, prepares trip tables output from program MC for assignment to the transit and highway networks. This setup factors trip-tables for time-of-day, direction and occupancy, and combines over trip purposes.
4.1 Purpose
The time-of-day setup tod\dftboo(x.set converts trip tables output from the mode-choice component into trip tables usable for network assignment. This involves splitting trip tables into time-of-day categories, combining across trip purposes, and converting from production-attraction format to origin-destination format and from person trips to vehicle trips for private vehicle modes.
4.2 Control File
4.2.1 Control file for Non -toll trip table time of day factoring
MINUTP setup tod\dftboo(x.set, a standard MINUTP control file, controls several applications of modules MATRIX and MATFAC. The following excerpt includes the header information and each call from that setup.
For a detailed explanation of MINUTP syntax, see the MINUTP manual.
$ Honolulu models $ Time of Day & Directional Distribution Model Application $ cvf990512 make sep vt for occ2, occ3+ $ cvf990520 add wg with wb factors $ cvf991019 hov3+, trn pa & pk/op $ cvf991022 drop guideway, keep in dfttxxwg.set
$ ****************************************************************
$ *** NOTE: user must do global search & replace of .ALT with correct alt designator (e.g., a03)
$ ****************************************************************
$ *** NOTE: walk-guideway paths not included in dfttxxxx.set $ ****************************************************************
$ MinUTP setup dfttxxmm. set time-of-day factoring, directional distribution, and occupancy factoring produces o/d vehicle-trips by highway occupancy and time-of-day produces p/a person-trips on transit by path and time-of-day
$ inputs: mc outputs, p/a 24-hour ptt, file per purpose, table per mode
named ppxx mm.ALT, where replaced by two-letter purpose code jtw:hbw wh nwr:hbschool nk jtw:hbnw wo nwr:hbcollege nc jtw:wbnh ww nwr:hbshopping ns jtw:nb wn nwr:hbother no jaw:wb aw nwr:nhb nn jaw:nb an
Parsons
Models of Resident Travel Brinckerhoff
C.4-1 Time-of-Day and Directional Factoring
AR00064418

OMPO Model Development Project
User's Guide to Model Application
mode order is: occl, occ2, occ3+, walk/exp, walk/local, walk/gdwy, pnr,
knr,fringe/walk (walk), fringe/transit (bike) $ outputs: $ o/d vtt by occ by tod
vottxxol.ALT for occl vottxxo2.ALT for occ2 vottxxo3.ALT for occ3
$ p/a ptt on transit by tod (am pk+sh + pm pk+sh, op md+nt) ppttxxwl.ALT, ppttxxwx.ALT, ppttxxwg.ALT, ppttxxkr.ALT, ppttxxpr.ALT
was: o/d ptt on transit by tod (am pk+sh, pm pk+sh, op md+nt) were pottxxwb.ALT, pottxxwg.ALT, pottxxkr.ALT, and pottxxpr.ALT
$ intermediate files not needed, deleted at end vptt ol.ALT vptt o2.ALT vptt o3.ALT, are 11 purps vott ol.ALT vott o2.ALT vott—o3.ALT, are wr & nw pptt wb.ALT pptt kr.ALT pptt pr.ALT, are 11 purps pott wb.ALT pott kr.ALT pott pr.ALT, are wr & nw
$ steps:
$ 1. do time-of-day factoring by purpose, for hwy and tran trips
$ produce vt and pt/t by tod for jtw:hbw $ produce vt and pt/t by tod for jtw:hbnw $ produce vt and pt/t by tod for jtw:wbnh $ produce vt and pt/t by tod for jtw:nb $ produce vt and pt/t by tod for jaw:wb $ produce vt and pt/t by tod for jaw:nb $ produce vt and pt/t by tod for nwr:hbsc $ produce vt and pt/t by tod for nwr:hbco $ produce vt and pt/t by tod for nwr:hbsh $ produce vt and pt/t by tod for nwr:hbot $ produce vt and pt/t by tod for nwr:nhb
$ 2. do directional factoring and summation over purposes
$ produce o/d vt by tod, wr purps, occ 1 $ produce o/d vt by tod, wr purps, occ 2 $ produce o/d vt by tod, wr purps, occ 3+ $ produce o/d vt by tod, nw & all purps, occ 1 $ produce o/d vt by tod, nw & all purps, occ 2 $ produce o/d vt by tod, nw & all purps, occ 3+ $ produce p/a pt/t for wl mode by tod, wr purps $ produce p/a pt/t by tod, nw & all purps $ produce p/a pt/t for wp mode by tod, wr purps $ produce p/a pt/t by tod, nw & all purps $ produce p/a pt/t for wg mode by tod, wr purps $ produce p/a pt/t by tod, nw & all purps $ produce p/a pt/t for kr mode by tod, wr purps $ produce p/a pt/t by tod, nw & all purps $ produce p/a pt/t for pr mode by tod, wr purps $ produce p/a pt/t by tod, nw & all purps
$ 3. delete temp files
Parsons
Models of Resident Travel Brinckerhoff
C.4-2 Time-of-Day and Directional Factoring
AR00064419

Honolulu models Time of Day & Directional Distribution Model Application, with toll cvf990512 cvf990520 cvf991019 cvf991022 srr060617
make sep vt for occ2, occ3+ add wg with wb factors hov3+, trn pa & pk/op drop guideway, keep in dfttxxwg.set generate script for auto -- toll and nontoll
MinUTP setup dfttxxtl.set time-of-day factoring, directional distribution, and occupancy factoring produces o/d vehicle-trips by highway occupancy and time-of-day for toll
and nontoll inputs: mc outputs, p/a 24-hour auto ptt, file per purpose, table per mode
named ppxx_tl.ALT, where replaced by two-letter purpose code jtw:hbw wh nwr:hbschool nk jtw:hbnw wo nwr:hbcollege nc jtw:wbnh ww nwr:hbshopping ns jtw:nb wn nwr:hbother no jaw:wb jaw:nb
aw an
nwr:nhb nn
mode order is: 1. occl nontoll 2. occl toll 3. occ2 nontoll 4. occ2 toll 5. occ3+ nontoll 6. occ3+ toll
outputs: o/d vtt by occ by tod
vottxxol.ALT for occl vottxxo2.ALT for occ2 vottxxo3.ALT for occ3 vtttxxol.ALT for occl vtttxxo2.ALT for occ2 vtttxxo3.ALT for occ3
nontoll nontoll nontoll toll toll toll
intermediate files not needed, deleted at end vptt ol.ALT vptt o2.ALT vptt o3.ALT, vott--ol.ALT vott--o2.ALT vott--o3.ALT, pptt wb.ALT pptt kr.ALT pptt pr.ALT, pott wb.ALT pott kr.ALT pott pr.ALT,
are 11 purps are wr & nw are 11 purps are wr & nw
steps:
1. do time-of-day factoring by purpose, for hwy and tran trips
OMPO Model Development Project
User's Guide to Model Application
4.2.2 Control file for Toll trip table time of day factoring
MINUTP setup tod\dftbod.set, a standard MINUTP control file, controls several applications of modules MATRIX and MATFAC. The following excerpt includes the header information and each call from the time of day toll time of day setup. This setup also only does factoring for the auto person trips. The transit person trips are factored using the non-toll setup.
Parsons
Models of Resident Travel Brinckerhoff
C.4-3 Time-of-Day and Directional Factoring
AR00064420

produce vt by tod for jtw:hbw produce vt by tod for jtw:hbnw produce vt by tod for jtw:wbnh produce vt by tod for jtw:nb produce vt by tod for jaw:wb produce vt by tod for jaw:nb produce vt by tod for nwr:hbsc produce vt by tod for nwr:hbco produce vt by tod for nwr:hbsh produce vt by tod for nwr:hbot produce vt by tod for nwr:nhb
2. do directional factoring and summation over purposes
produce o/d vt by tod, wr purps, occ 1 nontoll produce o/d vt by tod, wr purps, occ 2 nontoll produce o/d vt by tod, wr purps, occ 3+ nontoll produce o/d vt by tod, nw produce o/d vt by tod, nw produce o/d vt by tod, nw produce o/d vt by tod, wr produce o/d vt by tod, wr produce o/d vt by tod, wr produce o/d vt by tod, nw produce o/d vt by tod, nw produce o/d vt by tod, nw
& all purps, occ 1 & all purps, occ 2 & all purps, occ 3+
toll toll toll
3. delete temp files
& all purps, occ 1 & all purps, occ 2 & all purps, purps,
purps, occ 1 occ 2
occ toll toll
3+
purps, occ 3+ toll
nontoll nontoll nontoll
OMPO Model Development Project
User's Guide to Model Application
4.3 Input Files
The time-of-day setup requires as input the output trip files from eleven applications of program MC, one for each trip purpose. These files contain ten tables, one for each mode, in order: highway occupancy 1, 2, and 3+; transit walk-to-premium, walk-to-local, walk-to-guideway, park-n-ride, kiss-n-ride; and auxiliary walk and bike. The standard-name output files from program MC are embedded in the time-of-day setup, requiring no user intervention.
4.4 Output Files
4.4.1 Output file for Non-toll time of day matrices
The following excerpt from the header of file tothdftboomset (also shown above) lists
$ o/d vtt by occ by tod vottxxol.ALT for occl vottxxo2.ALT for occ2 vottxxo3.ALT for occ3
$ p/a ptt on transit by tod (am pk+sh + pm pk+sh, op md+nt) ppttxxwl.ALT, ppttxxwx.ALT, ppttxxwg.ALT, ppttxxkr.ALT, ppttxxpr.ALT
The time-of-day setup produces trip-files ready to assign to the highway and transit networks. Files votbo(o1.alt, votbo(o2.alt, and votbo(o3.alt contain vehicle trips in origin-destination format
Parsons
Models of Resident Travel Brinckerhoff
C.4-4 Time-of-Day and Directional Factoring
AR00064421

OMPO Model Development Project User's Guide to Model Application
for SOV, HOV2, and HOV3+, respectively. Each file contains six trip-tables, one for each time period, in order: AM peak (6-8a), AM shoulder (5-6, 8-9a), midday (9a-2p), PM peak (3-5p), PM shoulder (2-3, 5-6p), and night (6p-5a). Files pptboml.alt, pptbomp.alt, pptbomg.alt, pptbo(kr.alt, and pptbo(pralt contain person trips on transit in production-attraction format for walk-to-local-bus, walk-to-premium-bus, walk-to-guideway, kiss-n-ride, and park-n-ride paths, respectively. Each file contains two trip-tables, one for each combined time period, peak (5-9a, 2-6p), and off-peak (9a-2p, 6p-5a).
4.4.2 Output file for Toll time of day matrices
The following excerpt from the header of file tod\dftbod.set (also shown above) lists
$ o/d vtt by occ by tod vottxxol.ALT for occl nontoll vottxxo2.ALT for occ2 nontoll vottxxo3.ALT for occ3 nontoll vtttxxol.ALT for occl toll vtttxxo2.ALT for occ2 toll vtttxxo3.ALT for occ3 toll
This time-of-day setup produces vehicle trip files ready to assign to the toll highway network. Files votbo(01.alt, votbo(02.alt, votbo(03.alt, vttbo(01.alt, vttbo(02.alt, and vttbo(03.alt contain vehicle trip tables in origin-destination format for SOV non-toll, HOV2 non-toll, HOV3 non-toll, SOV toll, HOV2 toll, and HOV3 toll, respectively. Each file contains six trip tables, one for each time period as in the non-toll skims in section 4.4.1.
4.5 Controls
The setup file contains all necessary controls. The user can invoke the setup via the DOS batch file TOD\DFALLBAT. It takes a single command-line argument, the file-extension denoting the year and scenario. For the base-year application, this extension is .C9X, so the transit skim-building process is invoked by navigating to the TRN directory and invoking "DFALL C9X" at the command prompt.
4.6 Reports
Embedded DOS commands in the setup copy the standard MINUTP report files to file TOD\DFTT)0(XX.PRN or TOD\DFTTXXTL.PRN. This file echoes all commands, gives control totals on all matrices, and reports any problems. The user should be familiar with MINUTP reports.
4.7 Error Messages
Since the time-of-day procedures call MINUTP modules, only standard MINUTP errors are produced. Warnings are denoted (w) and fatal errors (f). See the MINUTP manual for clarification on specific messages. The end of report file dftbo(mm.prn summarizes the maximum severity of all problems encountered, with severity 0 indicating no warnings, 4 warnings but no fatals, and 8 fatals. The user must investigate all messages, as the version of TOD\DFTT)0(XX.SET distributed returns codes of 0.
Parsons Models of Resident Travel Brinckerhoff C.4-5 Time-of-Day and Directional Factoring
AR00064422

OMPO Model Development Project User's Guide to Model Application
D. Other Transportation Models
Parsons
Other Transportation Models Brinckerhoff
AR00064423

OMPO Model Development Project User's Guide to Model Application
I. Airport Access Trips
1.1 Purpose
This set of procedures performs the travel demand modeling steps for air passenger ground access trips. The airport access trip procedures estimate vehicle trips generated by air travelers, to and from the airport. The estimation procedure consists of a trip generation step, a distribution step and a mode choice/time of day step. The trip generation step estimates trip ends for three "purposes" - resident air passenger trips, visitors on tours trips, and independent visitor air passenger trips. The number of daily trips for these three purposes is an exogenous variable and for the calibration year was: (1) 10,000 residential trips; (2) 16,000 visitors on tour trips; and (3) 34,000 independent visitor trips. At the non-airport end of the trip the resident trips are distributed according to the number of households in the zone; the visitors on tour are distributed according to the number of hotel rooms in the zone; and the independent visitors are distributed according to households (a weight of 1) and hotels rooms (a weight of 25).
The distribution model is simply an allocation process for build trip tables from the trip ends since all the non-airport trip ends are "hooked" to the airport trip ends. The mode choice/time of day procedure is more detailed. The mode choice consists of a number of average uses by mode.
For resident travelers these assumptions are:
1. That 80 percent of the resident air travelers will come by private automobile, with half parking at the airport and half being dropped off.
a. The average car occupancy for these trips (air passengers per vehicle) is 1.5
b. That the drop off trips require 2 trips (one from the airport and one to the airport)
2. That 15 percent of the resident air travelers will come by taxi
a. The average car occupancy (air passengers) for these trips will be 2.0
b. That the trips will require 2 trips (one to and one from the airport)
3. That 5 percent of the resident air travelers will come by shuttle van
a. The average car occupancy for these trips will be 4.0
b. The trips will require 2 trips (one to and one from the airport)
For independent visitors the assumptions are:
1. That 25 percent of the independent visitors will come by private automobile
a. The average car occupancy for these trips (air passengers per vehicle) is 2.0
b. The trips will require 2 trips
Parsons Other Transportation Models Brinckerhoff D.1-1 Airport Access Trips
AR00064424

OMPO Model Development Project User's Guide to Model Application
2. That 25 percent of the independent visitors will come by taxi
a. The average car occupancy for these trips is 2.0
b. The trips will require 2 trips
3. That 50 percent of the independent visitors will come by shuttle van
a. The average occupancy will be 4
b. The trips will require 2 trips
For visitors on tours the assumptions are:
1. That 25 percent of the visitors on tour will come by shuttle van
a. The average occupancy for these trips (air passengers per vehicle) is 4.0
b. The trips will require 2 trips
2. That 75 percent of the visitors on tour will come by tour bus
a. The average occupancy for these trips is 15.0
b. The trips will require 2 trips
The occupancy is used to estimate the number of vehicle trips, which is the air passenger trips divided by the occupancy. Therefore taxi, shuttle van and tour buses are included in the vehicle trip table.
The final output of these procedures are a set of air passenger vehicle trip tables; one table for the morning peak period, one table for the evening peak period and one table for the non-peak periods. These tables are used in the highway assignment procedure. There are seven program runs in this procedure. A trip generation program (FORTRAN), three-distribution program runs (FORTRAN), two report runs (FORTRAN) and a time of day program (MIN UTP).
1.2 Control File
There is a control file for each program. The control files for the distribution programs are all the same with the exception of the input trip end file names.
The trip generation program control file uses standard namelist notation. There is a &files logical record, a ¶ms logical record, a &prods logical record, a &attra logical record, and a &options logical record.
For normal operations only the &files record and (for one data item) &prods record need to be modified. The &files record has four keywords with are:
1. Fzdata: This is the zonal data file (ZD .%%%). The same one used in the Trip Generation program (see User's Guide to Model Application, Section 0.1). Note the analyst should change the file extension name to the alternative name.
Parsons
Other Transportation Models Brinckerhoff
D.1-2 Airport Access Trips
AR00064425

OMPO Model Development Project User's Guide to Model Application
2. Ftends: This is the estimated air passenger trip end file, an output file. Its name must be ADOKPP)0(.%%% - where the extension is the alternative name.
3. Fprt: This is the report file, usually named ADOKPP)OCrpt.
4. Title: This is the title of the run (not a file).
The &parms records has five keywords which are:
1. Nzones: This the number of zones (764)
2. Npurposes: This is the number of purposes (3)
3. Nzdata: This is the number of zone data items the program reads (33)
4. Zspec: This is the zone number for the airport. In the base year this was zone 764.
5. Zdind: This is the zone data items that are used with the trip rates. These zone data item numbers are shown on the fzdata file of the trip generation program description. These data items must be in the same order as the rates (described in the discussion on the &prods and &attrs records). These data items should be 4 (hotel rooms) and 7 (households).
The data on the &parms record should never be changed unless major modifications are made to the program and procedure.
The &prods and &attrs records contain the trip rates for each of the air passenger categories (resident, visitors on tour, and independent visitors). The &prods has three keywords which are prates(x), where x is the air passenger category (1 = residence, 2 = tour visitors, 3 = independent visitors).
Each of these keywords has two values after them. The first value is always a 0 (it actually is not used in the program). The second value is the daily air passengers for the air passenger category. This should be changed by the analyst depending on the estimated air passenger trips in the year of the forecast. For the base year (1995) the values were 10,000, 16,000, and 34,000.
The &attrs has three key words (arates1, arates2, and arates3). These are the trip "weights" at the non-airport end of the trip. For the resident category (1) the hotel rooms have a weight of zero and households have a weight of 1.0. For the visitors on tour the hotel rooms have a weight of 1 and the households have a weight of 0. For the independent visitors the hotel rooms have a weight of 25 and the households have a weight of 1. These rates should not be changed.
The &options record has four keywords which are:
1. Detail: This keyword, if set to true (detail = t) will produce detailed reports of the data.
2. Pspec: This keyword specifies which purpose will have special trip end treatment. The specification is 0 for no special treatment and 1 for special treatment. The 0/1 codes should be in order by purpose. In the standard procedure all purposes have a special treatment.
Parsons Other Transportation Models Brinckerhoff D.1-3 Airport Access Trips
AR00064426

OMPO Model Development Project Trip Generation for Airport Access
&files fzdata = '..\zd\zdxxxxxx.c25' ftends = 'aexxppxx.f33' frpt = 'aexxppxx.rpt' title = 'apply airport-acc gen model '
&end
¶ms nzones = 764 npurps = 3 nzdata = 33 zspec = 764 zdind = 4, 7,
&end
zdat type: htlrm hld &prods pratesl = 0., 10000. prates2 = 0., 16000. prates3 = 0., 34000.
&end
&attrs aratesl arates2 arates3
&end
= o . , 1. = 1., 0. = 25., 1.
OMPO Model Development Project User's Guide to Model Application
3. Recto. This keyword specifies for each of the three purposes which trip end (production or attraction) will control the total trip ends. If recto is a 1, then the attractions will be "normalized" to match the production regional total. If recto is a 2, then the productions will be normalized to match the attraction regional total. For the normal procedure, all purposes will have there attractions (non-airport end) trip ends "balanced" to productions (airport trip ends).
4. Aeqp: This keyword specifies for each purpose if the attractions are the same as the productions (which are to be estimated) for each zone. If the value false (f) then the attractions and productions can be different by zone. If the value is true (t) then the attractions and productions will be the same by zone. For the normal procedure, all purposes are coded as false.
An example of the trip generation control file (whose name must be AEXXPP)OK.ctl) is shown in Table 1.1. Note in this example, the areas which must be changed by the user are coded with %%% for file extensions and $$$$ for the airport trip end values. This should facilitate updating this control file.
Table 1.1 Example of the Trip Generation Control file (AEXXPPXX.ctl)
Parsons
Other Transportation Models Brinckerhoff
D.1-4 Airport Access Trips
AR00064427

OMPO Model Development Project
User's Guide to Model Application
&options detail = f, pspec = 1,1,1, recto = 1,1,1, aeqp = F,F,F,
&end detail = f, pspec = 1,1,1, recto = 1,1,1, aeqp = F,F,F,
&end
There are three trip distribution control files, one for each trip purpose. These control files are named:
1. AP)OKRE)0K.ctl - For Resident Air Passengers
2. AP)0(VT)OK.ctl - For Visitors on Tour
3. AP)0(VDOCctl - For Independent Visitors
Each of these files has three logical records. These records are &files, ¶ms; &options. The &files logical record have six keywords which are:
1. Ftends: this is the trip ends from the air passenger trip generation program. Be sure to code the extension as the alternative being used
2. Fimpeds: this is a matrix on ones. This file should always be ones764.tmp and should be in the generic\td directory.
3. Fequivs: this is the district to zone equivalent file found in directory generic\zd
4. Ftripo: this is the output trip table - be sure to code the extension
5. Frpt: this is the output report file
6. Title: this is the title of the run.
These keywords will be the same for each of the three runs, except for the reference to the air passenger purpose name.
The ¶ms record has 14 keywords. These keywords have been described in the Trip Distribution program description in User's Guide to Model Application, Section 0.2. The user should not change any of these keyword values.
The &options record has 2 keywords. These keywords have been described in the Trip Distribution program description in User's Guide to Model Application, Section 0.2. The user should not change any of these keyword values.
An example of the trip distribution control file is shown in Table 1.2.
Parsons Other Transportation Models Brinckerhoff D.1-5 Airport Access Trips
AR00064428

Honolulu models Control File for Trip Distribution Application TD.EXE Airport-Access Trips: Visitors Independent
&files ftends fimpeds fequivs ftripo frpt title
= 'aexxppxx.f33' = '..\..\generic\td\ones764.bas' = '..\..\generic\zd\764to23.eqv' = 'apxxvixx.f33' = 'apxxvixx.rpt' = 'TD for ap acc: vis ind'
¶ms nzones ndists nfends nfProds nfAttrs tabimp nincr plbeg p2beg maxi ter reltol abstol width nintervs scale offset
&options prteqv calib
= 764 = 23 = 6 • 3 • 6 • 1 • 1 • 0.00 • 0.00 • 1 = 0.005 = 10 = 2 = 50 = 100.0 = 0.0
=F =F
OMPO Model Development Project
User's Guide to Model Application
Table 1.2 Example of Airport Access Trip Distribution Control File (APXXVIXX.ctl)
The control file to build the time of day air passenger trips is a MINUTP control file with a name of VOTDOOKX.set. This file adds the three purposes together and allocates 30 percent to the morning peak period, 30 percent to the evening peak period and 40 percent to the off-peak hours. An example of this file is shown in Table 1.3. For the normal procedures, the analyst need not change anything in this control file.
There are two report control files - APXXPPXX.ctl and VOTDOOKX.ctl . These are standard report control files. The first control file produces a district to district report of each of the individual air passenger trip tables while the second one reports the three air passenger vehicle trip tables which will go to the assignment process. The analyst must change the extension on the input files for these reports.
Parsons
Other Transportation Models Brinckerhoff D.1-6 Airport Access Trips
AR00064429

OMPO Model Development Project
User's Guide to Model Application
Table 1.3 Example of the Airport Access Time of Day Control file
(File VOTTXXXX.set)
$ convert per trips to veh trips, to o/d, by tod *pgm matrix *unit 11=apxxrexx.%alt% *unit 12=apxxvtxx.%alt% *unit 13=apxxvixx.%alt% *unit 19=vpxxxxmm.%alt% get 1,101 get 2,201 get 3,301 $ inflate by 100 to keep precision, deflate at end $ inflate all modes (except parked) by 2 for round trips $ assume 50% of res auto trips pick/drop, 50% parked $ residents:auto(80%/1.5occ),taxi(15%/2.0) shuttle van (5%/4.0) comp fl1=1*0.80/1.5*100.*1.5 comp f12=1*0.15/2.0*100.*2.0 comp f13=1*0.05/4.0*100.*2.0 $ Ind. visitors:auto(25%/2.0),taxi(25%/2.0),shuttle van (50%14.0) comp fll=f11+3*0.25/2.0*100.*2.0 comp f12=f12+3*0.25/2.0*100.*2.0 comp f13=f13+3*0.50/4.0*100.*2.0 $ visitors on tour: shuttle van (25%14), tour bus (75%/15) comp f13=f13+2*0.25/4.0*100.*2.0 comp f14=2*0.75/15.0*100.*2.0 $ deflate and write comp 21=f11 fac 21,.01,b comp 22=f12 fac 22,.01,b comp 23=f13 fac 23,.01,b comp 24=f14 fac 24,.01,b comp 25=21+22+23+24 out 21,901-905 *pgm matrix $ convert to o>d, factor by tod *unit 11=vpxxxxmm.%alt% *unit 19=vottaaxx.%alt% $ convert to o>d trnp 1,105 get 2=105 comp 3=1+2 fac 3,.5,b $ factor by time-of-day comp 4=3 comp 5=3 fac 4,0.30,b fac 5,0.40,b out 4,901-902 out 4,903
Parsons
Other Transportation Models Brinckerhoff
D.1-7 Airport Access Trips
AR00064430
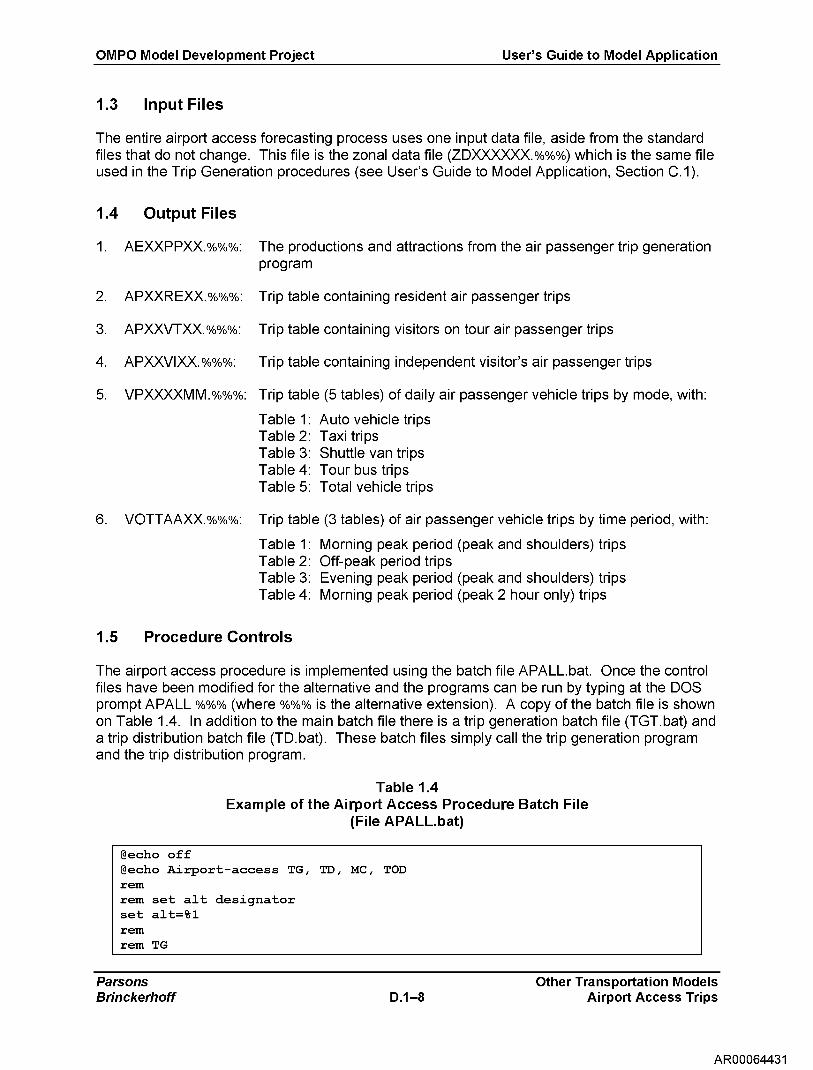
OMPO Model Development Project User's Guide to Model Application
1.3 Input Files
The entire airport access forecasting process uses one input data file, aside from the standard files that do not change. This file is the zonal data file (ZD .%%%) which is the same file used in the Trip Generation procedures (see User's Guide to Model Application, Section 0.1).
1.4 Output Files
1. AEXXPPXX.%%%: The productions and attractions from the air passenger trip generation program
2. APXXIREXX.%%%: Trip table containing resident air passenger trips
3. APXXVTXX.%%%: Trip table containing visitors on tour air passenger trips
4. APXXVIXX.%%%: Trip table containing independent visitor's air passenger trips
5. VPXXXXMM.%%%: Trip table (5 tables) of daily air passenger vehicle trips by mode, with:
Table 1: Auto vehicle trips Table 2: Taxi trips Table 3: Shuttle van trips Table 4: Tour bus trips Table 5: Total vehicle trips
6. VOTTAAXX.%%%: Trip table (3 tables) of air passenger vehicle trips by time period, with:
Table 1: Morning peak period (peak and shoulders) trips Table 2: Off-peak period trips Table 3: Evening peak period (peak and shoulders) trips Table 4: Morning peak period (peak 2 hour only) trips
1.5 Procedure Controls
The airport access procedure is implemented using the batch file APALL.bat. Once the control files have been modified for the alternative and the programs can be run by typing at the DOS prompt APALL %%% (where %%% is the alternative extension). A copy of the batch file is shown on Table 1.4. In addition to the main batch file there is a trip generation batch file (TGT.bat) and a trip distribution batch file (TD.bat). These batch files simply call the trip generation program and the trip distribution program.
Table 1.4 Example of the Airport Access Procedure Batch File
(File APALL.bat)
@echo off @echo Airport-access TG, TD, MC, TOD rem rem set alt designator set alt=%1 rem rem TG
Parsons
Other Transportation Models Brinckerhoff
D.1-8 Airport Access Trips
AR00064431

OMPO Model Development Project
User's Guide to Model Application
call tgt aexxppxx.ctl rem rem TD and report call td apxxrexx.ctl call td apxxvixx.ctl call td apxxvtxx.ctl call report apxxppxx.ctl rem rem MC and TOD and report call do vottxxxx call report vottxxxx.ctl rem @echo.
1.6 Reports
MINUTP Report:
1. VOTDOKXX.prn: This report is a MINUTP report describing the mode choice and time of day procedures for the air passenger model. The report shows the MATRIX commands used and shows the total trips input and output. There are two total trip summaries. The first summary shows the results of the "mode choice" procedure and the second shows the results of the time of day procedure. The first report would look like this:
Wrk Mat
(At end of zone) Total
I/P Mat Total
OUT Mat Total
1 10,000 101 10,000 901 16,500
2 16,000 201 16,000 902 10,000
3 34,000 301 34,000 903 10,752
11 1,650,000 904 1,600
12 1,000,000 905 38,852
13 1,075,000
14 160,000
21 16,500
22 10,000
23 10,752
24 1,600
25 38,852
Where: 1, 2, 3, etc. are Work Matrices; I/P are Input matrices and OUT are Output matrices
The input matrices are: 101: Resident Air Passengers; 201: Visitors on Tour Air Passengers; and, 301: Independent Visitors Air Passengers
The output matrices are 901: Automobile Vehicle Trips; 902: Taxi Vehicle Trips; 903: Shuttle Van Trips; 904: Tour Bus Trips; and, 905: Total Vehicle Trips.
Parsons
Other Transportation Models Brinckerhoff D.1-9 Airport Access Trips
AR00064432

tgt 609 (i) summary of regional reconciliation step purp recto aeqp totprod totattr factor
1 1 F 10000 265636 .038 2 1 F 16000 29982 .534 3 1 F 34000 1015186 .033
OMPO Model Development Project
User's Guide to Model Application
The second report summary shows the total vehicle input and the total vehicle output by time of day. The report looks like this:
Wrk Mat
1 2 3 4 5 6
(At end of zone) Total
38,852 38,852 38,682 11,573 15,464 6,783
I/P Mat
105
Total
38,852
OUT Mat
901 902 903 904
Total
11,573 15,464 11,573 6,783
The input matrix (105) is Total Vehicle Trips.
The output matrices are: 901: Morning Peak; 902: Off-Peak; 903: Evening Peak; and 904: Morning 2 Hour Peak.
FORTRAN REPORTS:
1. A EXXP PXX. rpt: This report is from the trip generation program for air passengers. The report shows the control files used for the program. It also has a small summary line, for each type of passenger, at the end of the report that shows the productions estimated and the initial attractions. It also shows the factors needed to reconcile the attractions to the productions. This summary line looks like this:
Where purpose 1 is resident air passengers, 2 is visitor on tours and 3 is independent visitors.
2. APXXREXX.rpt:
These three reports are the air passenger distribution model reports, where RE is for residents, VI is for independent visitors, and VT is for
3. A PXXVIXX.rpt:
visitors on tour. The report shows the control variables used to run the program. It also has, near the end of the report, a total number of
4. APXXVTXX.rpt:
productions and attractions used by the program. This summary of input attractions and productions looks like this:
rdata 9002 (i) total productions: 16000
total attractions: 16010
5. A PXXP PXX.rpt: This report summarizes the trip ends by district (from the trip generation model) by district (for the trip ends not at the airport). The summary is by resident, visitors on tour, and independent visitors.
6. VOTTXXXX.rpt: This report summarizes the air passenger vehicle trips by district to district movements, for the morning peak, evening peak and off-peak. The trips shown are in thousands of trips.
Parsons
Other Transportation Models Brinckerhoff D.1-10 Airport Access Trips
AR00064433

OMPO Model Development Project User's Guide to Model Application
2. Visitor Trips
2.1 Purpose
The Honolulu Visitor Model is intended to supplement the "standard" four-step demand models, which capture only resident travel.
The MS-DOS batch file VISNEW.BAT executes the Honolulu Visitor Model. In general, the Batch file first prepares input files using MINUTP scripts, and then executes the custom FORTRAN program VISITOR, to apply the Visitor Model. For a detailed description of the model form (applied by VISITOR), the user should refer to the original documentation for VISITPGM, which was developed for a previous study l .
VISITOR is a slightly modified version of the program VISITPGM. VISITOR differs from VISITPGM in its ability to handle up to 2,500 zones, its use of default parameters 2 , and its re-calibration to base year data.
The VISNEW Batch file performs the following steps:
• BLDTOUR.SET - MINUTP script used to prepare a matrix summarizing the cost used for the Tour bus mode, used by the VISITOR software.
• SKTRNVIS.SET - MINUTP script that builds transit skims for the VISITOR software.
• VISITOR - Custom FORTRAN program that applies the Visitor Model.
• VISOBS.SET - MINUTP script, which combines the output from VISITOR with an additional transit trip table of visitor trips not going to the 25 key destinations, and applies time-of-day factors.
Each of these steps is discussed in more detail in the following sections.
2.2 Step 1: BLDTOUR.SET
The MINUTP script BLDTOUR.SET simply puts the "DATA\ZVS_COST.%%%" text file into a MINUTP binary matrix with the name "TOURCOST.MAT". The VISITOR software then uses this file directly.
The input file for Step 1 is:
• ZVS_COST.%%% -- Tour cost from origin zone to visitor site zones. This is a card image file with the following format: origin zone in columns 1-5, visitor site zones in columns 6-10, tour cost (in hundredths of cents) in columns 11-17. Note the base year
1 See "Task 3.03 Service and Patronage Forecasting Methodology" Prepared for the Department of Transportation Services, Office of Rapid Transit, City and County of Honolulu, Prepared by Barton-Aschman Associates, Inc. and Parsons Brinckerhoff Quade & Douglas, Inc., March 1992
2 The previous version required the user to input each of the parameters. The program now uses the default parameters if none are entered.
Parsons Other Transportation Models Brinckerhoff D.2-1 Visitor Trips
AR00064434

OMPO Model Development Project User's Guide to Model Application
file for tour costs has approximately 19,000 records. This data was compiled from tour operators during development of the visitor model for the Rapid Transit Project. This cost represents the average amount charged by a tour operator from selected origins (generally hotel locations) to selected destination (tour venue such as the Arizona Memorial).
The output file for Step 1 is:
• TOURCOST.MAT — The tour cost as a binary MINUTP matrix
• BLDTOUR.PRN — Standard MINUTP report file
2.3 Step 2: SKTRNVIS.SET
This step builds transit skims specifically for the Visitor Model. Two sets of skims are produced, one for the local bus mode and one for the premium transit mode. The skim parameters and input files are identical as those used by the resident models Off-Peak transit skim process.
The input files for this step are:
• SDOOOKTR cYo % cYo — Park-and-Ride station file
• TLTDOKBL'YockcYo — Line cards for local bus routes
• TLTDOTG.(Yock% — Line cards for premium (rapid bus or rail) transit routes
• XF )000KT R cYo % cYo — Non-centroid connector walk links
• H NTDOOOK. cYo % cYo — Binary highway network located in the HVVY directory
• ALM DOKTR cYo cYo % — Mid-day (Off-Peak) access link file for all transit networks
• A DOOOKST. % cYo % — Park-and-Ride lot nodes and parking costs
The output files for this step are:
• SKTRNVIS.ALT — Local bus transit skim
• SKFGVIS.ALT — Premium (rapid bus or rail) transit skim
• SKTRNVIS.PRN — Standard MINUTP report file
Both of the above transit skims are read directly by the VISITOR software, and contain 10 tables with the following time values in each:
• Tables 1-2 — Blank (all zeroes)
• Table 3 — Walk access time and initial wait time (minutes)
Parsons Other Transportation Models Brinckerhoff D.2-2 Visitor Trips
AR00064435

OMPO Model Development Project User's Guide to Model Application
• Table 4 - Transfer wait time (minutes)
• Table 5 - In-vehicle travel time (all segments, expressed in minutes
• Table 6 - Premium transit in-vehicle travel time (minutes)
• Tables 7-10 - Blank (all zeroes)
2.4 Step 3: VISITOR Application
A standard FORTRAN control file operates the VISITOR software. The software applies a combination trip generation-distribution-mode choice model.
The control file uses standard namelist notation and has the following sections:
• FILES - Location of key input and output files
• PARAMS - Global parameters
• OPTIONS - Input/output and computational options
• SELECTS - Zone pair selection
• PARMS - Model parameters
The variables in each of these sections are explained in detail in the following sub-sections.
2.4.1 FILES
The FILES section contains the locations of input and output files. The section must begin with &FILES and end with a slash (/) (see Tables 2.3 and 2.4). The input file names are as follows:
• FZDATA - Zone level data file 3
• FSKLOC - Local Bus skim
• FSKPRM - Premium Bus skim (optional, only required if RAIL is set to true, see OPTIONS)
• FSKHVVY - Highway skim
• FSKFARB - Local Bus fare skim (optional, only required if TFARE is set to true, see OPTIONS)
• FSKFARR - Premium Bus fare skim (optional, only required if TFARE and RAIL are set to true, see OPTIONS)
3 This is the zonal data file developed specifically for the visitor model. The format for this file is contained in Table 2.1. This file should include a record for each zone for consistency and accuracy.
Parsons Other Transportation Models Brinckerhoff D.2-3 Visitor Trips
AR00064436

OMPO Model Development Project User's Guide to Model Application
• FSKTOUR — Tour Bus skim
The output file names are as follows:
• FVSTOUT — Modal trip tables
• FRPT — Report file
As mentioned above, the fare matrices are optional. If no matrix is specified, the fare will be considered constant for all O-D pairs and taken from the FLTFAR variable in the PARMS section.
The file names must be enclosed in a single quote, (e.g. FRPT='report.b(f) and can include path information (e.g. FRPT = rcAdata\vis\report.b(f). The total length of the file name, including the path information, cannot exceed 40 characters.
In application, these FILE variable names refer to the following input files:
• FZDATA = `DATA\ZDOOKVIS.c/oc/oc/o' — This file contains input socio-economic data for the visitors. The format of the file is shown below in Table 2.1.
• FSKLOC = `SKTRNVIS.ALT' — Local bus transit skim, from Step 2: SKTRNVIS.SET
• FSKPRM = `SKFGVIS.ALT' — Premium transit skim, from Step 2: SKTRNVIS.SET
• FSKHVVY = r..\HVVY\SKOP)OKOL.c/oc/oc/o' — Off-peak highway skim. MINUTP binary matrix file containing two tables. The first is highway time in minutes times 100 and the second is highway distance in miles times 10.
• FSKFARB — Not used in the application (must be a MINUTP binary matrix file with one table, the cost in cents).
• FSKFARR — Not used in the application (must be a MINUTP binary matrix file with one table, the cost in cents).
• FSKTOUR = TOURCOST.MAT' — Tour bus matrix, from Step 1: BLDTOUR.SET.
Table 2.1 Format of FZDATA file
Field Columns Format Description 1 1-5 15 Zone number 2 6-13 F8.0 Parking Cost (cents)
3 14-21 F8.0 Origin Terminal Time (minutes) 4 22-29 F8.0 Destination Terminal Time (minutes) 5 30-37 F8.0 Percent of visitors with access to an automobile 6 38-45 F8.0 Percent of visitors on a tour 7 46-53 F8.0 Hotel Rooms 8 54-61 F8.0 Resort/Condo Units
Parsons
Other Transportation Models Brinckerhoff
D.2-4 Visitor Trips
AR00064437

OMPO Model Development Project User's Guide to Model Application
The output files are as follows:
• FPRT = `VISIT.RPT' - Text report file summarizing VISITOR results
• FVSTOUT = `VISITRP.ALT' - Output binary trip table, with the following person trip tables:
o Table 1 - Auto
o Table 2 - Local Bus
o Table 3 - Premium or Guideway Transit (Rapid Bus or Rail)
o Table 4 - Taxi
o Table 5 - Tour
o Table 6 - Walk
2.4.2 PARAMS
The PARAMS section of the VISITOR control file contains only two variables. These keywords are:
• NZONES - Number of traffic analysis zones (TAZ). This number must match the dimensions of the input matrices. The default is 762.
• NZDATA - Number of data items in the input zone data file. The default is 7 and this value should never change.
2.4.3 OPTIONS
The OPTIONS section contains a set of logical variables. These variables can be set to either true (VARIABLE = T) or false (VARIABLE=F). The following keywords are in the OPTIONS section:
• DRYRUN - If true, the program will read in the input data sets and check the control file for errors, but perform no calculations.
• DEBUG - If true, the program will produce a vast amount of output, demonstrating the calculations performed for each I-J pair. The main purpose of this OPTION is to aid programmers in analyzing the performance of the software. When using this option, it is important to limit the zones on which the calculations are performed by using the SELECTS options to avoid creating a very large report file.
• TFARE - If true, the program will read in an input fare matrix, specified by the FSKFARB and FSKFARR (if RAIL is also true) keywords in the FILES section. If false,
Parsons Other Transportation Models Brinckerhoff D.2-5 Visitor Trips
AR00064438

OMPO Model Development Project User's Guide to Model Application
a flat transit fare is used - the FLTFAR variable in the PARMS section. Transit fares should be expressed in cents.
• RAIL - If true, the program will consider the premium transit mode and will expect a premium transit skim to be specified in the FSKPRM variable in the FILES section.
2.4.4 SELECTS
The SELECTS section allows the user to execute the model for a select group of zone pairs. The following two variables are in the SELECTS section:
• REPORTS - When set to 1, a table of trips by mode will be printed to the report file
• 1- Specifies which origin zones will be considered in the model. The form of the input is "first zone,-last zone". For example, if the user wants to execute the model for only zones 1 through 30 and 50 to 100, the variable would be "1= 1,-30,50,-100". A maximum of 10 entries are allowed (the previous example used 4 entries). In a typical application, all zones would be considered. Thus, "1=1,-762" would be used.
2.4.5 PARMS
The PARMS section contains the model parameters. Please refer to the Guide to Model Form document for more information about the model parameters.
• CLOGSUM - Coefficient on the LogSum variable in the Frequency/Destination-Level nest. The estimated value is -0.21710.
• CIVT - Coefficient on the in-vehicle time variable in the Mode Choice-Level nest. The estimated value is -0.02712.
• COVT - Coefficient on the out-of-vehicle time and walk time less MVVTIME minutes, in the Mode Choice-Level nest. The estimated value is -0.05424.
• COCOST - Coefficient on the operating cost in the Mode Choice-Level Nest. The estimated value is -0.0003816.
• CPCOST - Coefficient on the parking cost in the Mode Choice-Level nest. The estimated value is -0.007776.
• CTOUR - Coefficient on a dummy variable for those on a tour, specific to the tour bus mode, in the Mode Choice-Level nest. The estimated value is 1.30300.
• CWALKAD - Coefficient on the walk time over MVVTIME minutes, in the Mode Choice-Level nest. The estimated value is -0.13220.
• KAUTO - Alternative-specific constant for the auto mode in the Mode Choice-Level nest. The calibrated value is -1.95361.
Parsons Other Transportation Models Brinckerhoff D.2-6 Visitor Trips
AR00064439

OMPO Model Development Project User's Guide to Model Application
• KBUS - Alternative-specific constant for the bus mode in the Mode Choice-Level nest. The calibrated value is -5.95.
• KTAXI - Alternative-specific constant for the taxi mode in the Mode Choice-Level nest. The calibrated value is -6.29218.
• KTOUR - Alternative-specific constant for the tour bus mode in the Mode Choice-Level nest. The calibrated value is -4.53682.
• KRAIL - Alternative-specific constant for the premium transit mode in the Mode Choice-Level nest. As this mode is not present in the base year, the constant is set to the same value as KBUS (-5.95).
• RTOUR - Coefficient on a dummy variable for those on a tour, specific to the premium transit mode, in the Mode Choice-Level nest. The default value is 0.0000.
• CCPM - Operating cost per mile, in cents, of the auto mode. The default is 38.2 cents per mile.
• FLTFAR - The flat fare for the transit mode, used if a transit fare matrix is not specified. The default value is 44.0 cents.
• MVVTIME - The walk time "break" point when the coefficient on walk time changes from COVT to WALKAD. The default value is 20.0 minutes.
• WSPD - Assumed speed for the walk mode, in miles per hour. The default value is 3.0 miles per hour.
• TXMIN - The boarding (initial) cost for the taxi mode. The default value is 175 cents.
• TXCPM - The cost per mile for the taxi mode. The default value is 175 cents per mile.
• AUTOCC - The average auto occupancy for the auto mode. The default value is 2.70 persons per vehicle.
• TAXIOC - The average occupancy for the taxi mode. The default value is 3.50 persons per vehicle.
• VISUNT - The average party size staying in hotel rooms and rental units. The default is 2.77 persons per unit.
• ADJUST - Adjustment factor applied to VISUNT. The default value is 0.98035. ADJUST is a calibration factor that was used to calibrate to the total number of non-resident visitor trips to the 25 key destinations.
• CONST(75) - The alternative-specific constants applied to each destination at the Frequency/Destination nest. The calibrated values for the 25 destinations are shown in Table 2.1.
Parsons Other Transportation Models Brinckerhoff D.2-7 Visitor Trips
AR00064440

OMPO Model Development Project
User's Guide to Model Application
Table 2.2 Visitor Sites Used in the Visitor Model
Site Name Site
Number Zone
Number Site
Coefficient
Ala Moana Park 1 207 -2.23384 Ala Moana Center 2 186 -0.78665 Aloha Stadium 3 396 -3.03093 Aloha Tower 4 234 -3.50281 Bishop Museum 5 308 -3.95056 Chinatown 6 260 -2.71094 Diamond Head 7 104 -1.76370 Dole Cannery Square 8 333 -2.43372 Central Business District 9 258 -1.89066 Hanauma Bay 10 14 -1.78691 Honolulu Zoo 11 110 -3.50003 International Marketplace 12 119 -0.39423 lolani Palace 13 226 -3.18971 Kodak Hula Show 14 106 -3.83589 Pearl Harbor 15 390 -1.85926 Arizona Memorial 16 397 -2.21412 Pearlridge Center 17 413 -3.54949 Polynesian Cultural Center 18 668 -2.32195 Punchbowl National Cemetery 19 273 -2.18386 Royal Hawaiian Shopping Center 20 137 -1.75141 US Army Museum - Fort DeRussy 21 134 -4.65630 University of Hawaii 22 65 -3.52679 Waikiki Aquarium 23 106 -3.84432 Waikiki Beaches 24 133 0.44617 Waimea Falls Park 25 664 -2.43219
Two example control files are shown in Table 2.3 and 2.4. The control file in 2.3 allows the program to use all the default values, as described above. The control file in 2.4 specifies each of the parameters and options.
Parsons Other Transportation Models Brinckerhoff D.2-8 Visitor Trips
AR00064441

OMPO Model Development Project
User's Guide to Model Application
Table 2.3 Example Control File Using All the Default Values
&FILES FZDATA =Tdata\zdxxxvis.r25' FRPT ='visit.rpt' FSKLOC ='sktrnvis.alt' FSKPRM ='skfxgvis.alt' FSKHWY ='..\hwy\skopxxol.f55' FSKTOUR=Ttourcost.mat' FVSTOUT='visitrp.alt'
&PARAMS NZONES=764,
&OPTIONS DRYRUN=F, DEBUG=F, TFARE=F, RAIL=T
&SELECTS REPORTS=1, 1=1,-764
&PARMS
Table 2.4 Example Control File with All Keywords Specified
&FILES FZDATA =Tdata\zdxxxvis.r25' FRPT ='visit.rpt' FSKLOC ='sktrnvis.alt' FSKPRM ='skfxgvis.alt' FSKHWY ='..\hwy\skopxxol.f55' FSKTOUR=Ttourcost.mat' FVSTOUT='visitrp.alt'
&PARAMS NZONES=764,
&OPTIONS DRYRUN=F, DEBUG=F, TFARE=F, RAIL=T
&SELECTS REPORTS=1, 1=1,-764
&PARMS
Parsons
Other Transportation Models Brinckerhoff
D.2-9 Visitor Trips
AR00064442

OMPO Model Development Project
User's Guide to Model Application
CLOGSUM = -0.21710, CIVT = -0.02712, COVT = -0.05424, COCOST = -0.0003816, CPCOST = -0.007776, CTOUR = 1.30300, CWALKAD = -0.13220, KAUTO = -1.95361, KBUS = -5.95000, KTAXI = -6.29218, KTOUR = -4.53682, KRAIL = -5.95000, RTOUR = 0.00000, CCPM = 38.20000, FLTFAR = 44.00000, MWTIME = 20.00000, WSPD = 3.00000, TXMIN =175.00000, TXCPM =175.00000, AUTOCC = 2.70000, TAXIOC = 3.50000, VISUNT = 2.77000, ADJUST = 0.98035, CONST(1)= -2.23384, CONST(2)= -0.78665, CONST(3)= -3.03093, CONST(4)= -3.80281, CONST(5)= -3.95056, CONST(6)= -2.71094, CONST(7)= -1.76370, CONST(8)= -2.43372, CONST(9)= -1.89066, CONST(10)=-1.78691, CONST(11)=-3.50003, CONST(12)=-0.39423, CONST(13)=-3.18971, CONST(14)=-3.83589, CONST(15)=-1.85926, CONST(16)=-2.21412, CONST(17)=-3.54949, CONST(18)=-2.32195, CONST(19)=-2.18386, CONST(20)=-1.75141, CONST(21)=-4.65630, CONST(22)=-3.52679, CONST(23)=-3.84432, CONST(24)= 0.44617, CONST(25)=-2.43219,
Parsons
Other Transportation Models Brinckerhoff
D.2-10
Visitor Trips
AR00064443

OMPO Model Development Project User's Guide to Model Application
2.5 Step 4: VISOBS.SET
The final step in the VISNEW batch files performs three processes. The first step adds an additional transit trip table to the output from the VISITOR software. The additional trip table accounts for visitor trips not made to the 25 destinations listed in Table 2.2. A factor is included in the VISOBS.SET to grow this trip table for application in future years. The user can use any factor he/she deems reasonable, and is currently set at 1.0. This trip table is added to the Premium Transit trips to make available the maximum number of transit paths.
The second step converts the auto and taxi person trips into vehicle trips using average occupancies of 2.70 and 3.50, respectively.
The third step prepares the transit and highway trip tables for assignment by performing time-of-day factoring. The factors are as follows:
• Transit Factors
o AM Peak = 0.14
o Off-Peak = 0.54
o PM Peak = 0.32
• Highway Factors
o AM Peak = 0.12
o AM Peak Shoulder = 0.09
o Midday = 0.29
o Night = 0.23
o PM Peak = 0.13
o PM Peak Shoulder = 0.14
The final step converts the 6 highway trip tables from production and attraction format to origin and destination format. Then combines them into 4 tables: AM Peak 4 Hour (AM Peak + AM Peak Shoulder), Off peak (Midday + Night), PM Peak 4 Hour (PM Peak + PM Peak Shoulder), AM Peak 2 Hour.
The input files for VISOBS.SET are as follows:
• VISTRN.OBS - Transit trips not going to 25 key destinations
• VISITRP.ALT - Modal person trip table output from VISITOR
The output files for VISOBS.SET are as follows:
Parsons Other Transportation Models Brinckerhoff D.2-11 Visitor Trips
AR00064444

OMPO Model Development Project User's Guide to Model Application
• VOTTVSXX.%%% - Auto and taxi vehicle trips segmented by time of day
o Table 1 - AM Peak 4-Hour
o Table 2 - Off-Peak 16-Hour
o Table 3 - PM Peak 4-Hour
o Table 4 - AM 2-Hour
Parsons Other Transportation Models Brinckerhoff D.2-12 Visitor Trips
AR00064445

OMPO Model Development Project User's Guide to Model Application
• PPTTVSTR.WYo% - Transit trips segmented by time of day
o Table 1 - Walk to Local AM Peak
o Table 2 - Walk to Local Off-Peak
o Table 3 - Walk to Local PM Peak
o Table 4 - Walk to Premium Transit AM Peak
o Table 5 - Walk to Premium Transit Off-Peak
o Table 6 - Walk to Premium Transit PM Peak
• VISOBS.PRN - Standard MINUTP report file
2.6 Application
The Visitor Model can be applied by typing "VISNEW %%c/o" at a DOS Prompt in the \VIS directory. The "W/ock" is the alternative extension. A copy of the batch file is shown in Table 2.5.
Table 2.5 Example of the Visitor Trip Procedures Batch File
(File VISNEW.BAT)
@echo off @echo Visitor travel rem dto041502 rem set alt designator set alt=%1 call do bldtour call do sktrnvis call visitor visitor.ctl call do visobs @echo
Parsons
Other Transportation Models Brinckerhoff D.2-13 Visitor Trips
AR00064446
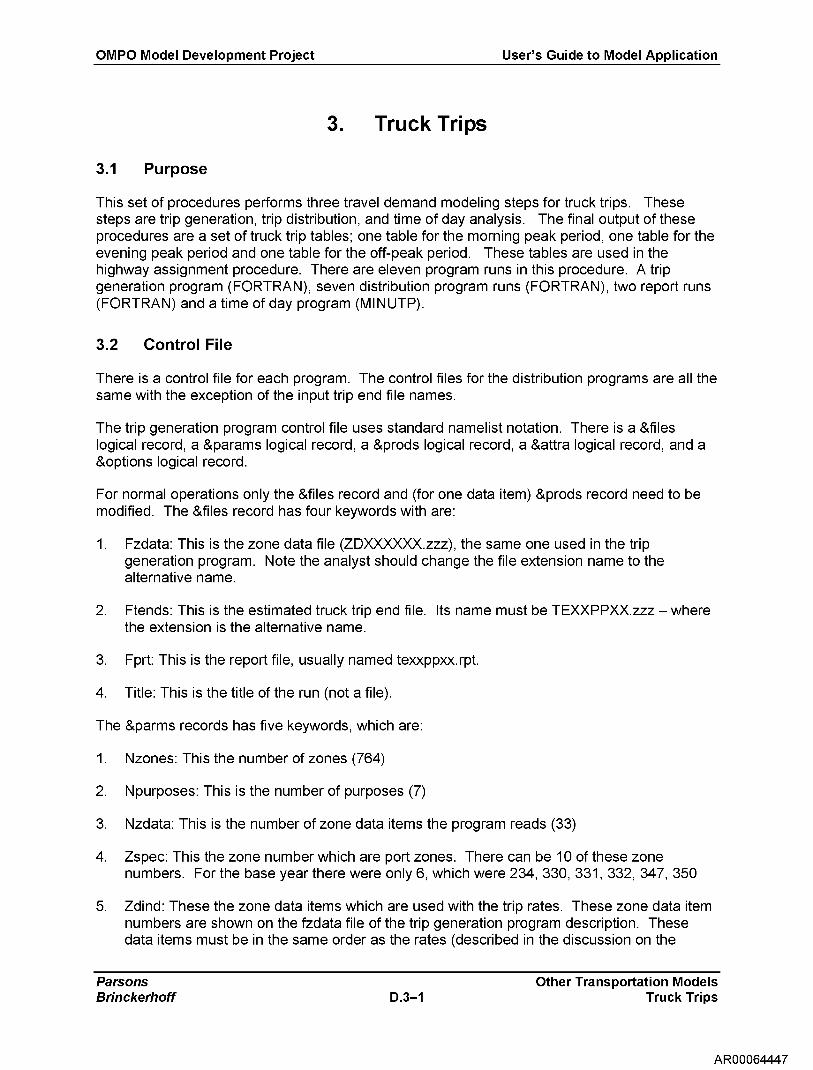
OMPO Model Development Project User's Guide to Model Application
3. Truck Trips
3.1 Purpose
This set of procedures performs three travel demand modeling steps for truck trips. These steps are trip generation, trip distribution, and time of day analysis. The final output of these procedures are a set of truck trip tables; one table for the morning peak period, one table for the evening peak period and one table for the off-peak period. These tables are used in the highway assignment procedure. There are eleven program runs in this procedure. A trip generation program (FORTRAN), seven distribution program runs (FORTRAN), two report runs (FORTRAN) and a time of day program (MI N UTP).
3.2 Control File
There is a control file for each program. The control files for the distribution programs are all the same with the exception of the input trip end file names.
The trip generation program control file uses standard namelist notation. There is a &files logical record, a ¶ms logical record, a &prods logical record, a &attra logical record, and a &options logical record.
For normal operations only the &files record and (for one data item) &prods record need to be modified. The &files record has four keywords with are:
1. Fzdata: This is the zone data file (ZD .zzz), the same one used in the trip generation program. Note the analyst should change the file extension name to the alternative name.
2. Ftends: This is the estimated truck trip end file. Its name must be TE)0(PP)OK.zzz - where the extension is the alternative name.
3. Fprt: This is the report file, usually named te)o(ppocrpt.
4. Title: This is the title of the run (not a file).
The &parms records has five keywords, which are:
1. Nzones: This the number of zones (764)
2. Npurposes: This is the number of purposes (7)
3. Nzdata: This is the number of zone data items the program reads (33)
4. Zspec: This the zone number which are port zones. There can be 10 of these zone numbers. For the base year there were only 6, which were 234, 330, 331, 332, 347, 350
5. Zdind: These the zone data items which are used with the trip rates. These zone data item numbers are shown on the fzdata file of the trip generation program description. These data items must be in the same order as the rates (described in the discussion on the
Parsons Other Transportation Models Brinckerhoff D.3-1 Truck Trips
AR00064447
OMPO Model Development Project User's Guide to Model Application
&prods and &attrs records). These data items should be 2 (total employment), 12 (military employment), 13 (government employment), 14 (hotel employment), 15 (agricultural employment), 16 (transportation employment), 17 (industrial employment), 18 (fiscal employment), 19 (service employment), 20 (retail employment) and 21 (construction employment).
The data on the &parms record should never be changed unless major modifications are made to the program and procedure.
The &prods and &attrs records contain the trip rates for each of the employment categories. The &prods has seven keywords which are prates(x), where x is the truck purpose number. The truck purpose number definitions are as follows:
1. Garage-Based Two Axle Truck Trips
2. Garage-Based Three Axle Truck Trips
3. Garage-Based Four Axle Truck Trips
4. Non-Garage-Based Two Axle Truck Trips
5. Non-Garage-Based Three Axle Truck Trips
6. Non-Garage-Based Four Axle Truck Trips
7. Port Based Truck Trips
Each of these keywords have eleven values after them. These values are the truck trip rates (trip ends per employee) for the eleven employment categories described in the ¶ms record. The one exception to this is the value for purpose 7 (prates7 - port based) for construction employment. This value is the total trip ends at the six port zones, described in zspec keyword. For the base year this value was 6,310. These rates should not be changed with the exception of the value for the total trip ends at the six port zones.
The &attrs has four key words (arates1, arates2, arates3 and arates7). These are the trip rates at the attraction end of the trip and are only calculated for purposes 1, 2, 3, and 7). For purposes 4, 5, and 6, the production rates are used in estimating attractions. These rates should not be changed.
The &options record has four keywords which are:
1. Detail: This keyword, if set to true (detail = t), will produce detailed reports of the data.
2. Pspec: This keyword specifies which purpose will have special trip end treatment. The specification is 0 for no special treatment and 1 for special treatment. The 0/1 codes should be in order by purpose. In the standard procedure only purpose 7 (port based trips) has a special treatment.
3. Recto: This keyword specifies for each of the seven purposes which trip end (production or attraction) will control the total trip ends. If recto is a 0, then no normalization is done. If recto is a 1, then the attractions will be normalized to match the production regional total. If
Parsons Other Transportation Models Brinckerhoff D.3-2 Truck Trips
AR00064448

OMPO Model Development Project User's Guide to Model Application
recto is a 2, then the productions will be normalized to match the attraction regional total. For the normal procedure, purposes 1, 2, 3 and 7 are set to 1 (i.e. production control).
4. Aeqp: This keyword specifies for each purpose if the attractions are the same as the productions (which are to be estimated) for each zone. If the value is false (f), then the attractions and productions can be different by zone. If the value is true (t), then the attractions and productions will be the same by zone. For the normal procedure, purposes 4,5 and 6 are coded as true.
An example of the trip generation control file (whose name must be TEXXIDP)OCCTL) is shown in Table 3.1. Note in this example that the areas which must be changed by the user are coded with three (Yock% for file extensions and $$$$ for the port trip end values. This should facilitate updating this control file.
Table 3.1 Example of the Trip Generation Control file (TEXXPPXX.CTL)
OMPO Model Development Project Trip Generation for Trucks
&files fzdata = '..\zd\zdxxxxxx.%%%' ftends = 'texxppxx.%%%' frpt = 'texxppxx.rpt' title = 'apply truck-trip generation model '
&end
¶ms nzones = 764 npurps = 7 nzdata = 33 zspec = 234, 330, 331, 332, 347, 350 zdind = 2, 12, 13, 14, 15, 16, 17, 18, 19, 20, 21
&end
empl type: total mil gov hotel agr tran ind fisc svc retl const &prods pratesl = 0.0000, 0.0460, 0.0460, 0.0460, 0.0460, 0.0460, 0.0110, 0.0460, 0.0105, 0.0140, 0.0460 prates2 = 0.0037, 0.0014, 0.0037, 0.0037, 0.0037, 0.0037, 0.0037, 0.0037, 0.0000, 0.0001, 0.0000 prates3 = 0.0000, 0.0084, 0.0084, 0.0084, 0.0084, 0.0084, 0.0044, 0.0084, 0.0027, 0.0000, 0.0084 prates4 = 0.0324, 0.0000, 0.0000, 0.0000, 0.0000, 0.0000, 0.0000, 0.0000, 0.0000, 0.0000, 0.0000 prates5 = 0.0039, 0.0000, 0.0000, 0.0000, 0.0000, 0.0000, 0.0000, 0.0000, 0.0000, 0.0000, 0.0000 prates6 = 0.0073, 0.0000, 0.0000, 0.0000, 0.0000, 0.0000, 0.0000, 0.0000, 0.0000, 0.0000, 0.0000 prates7 = 0.0000, 0.0000, 0.0000, 0.0000, 0.0000, 0.0000, 0.0000, 0.0000, 0.0000, 0.0000, $$$$. &end For the base year the value in const prates 7 was 6310. truck trip ends &attrs aratesl = 0.0234, 0.0000, 0.0000, 0.0000, 0.0000, 0.0000, 0.0000, 0.0000, 0.0000, 0.0000, 0.0000 arates2 = 0.0000, 0.0046, 0.0046, 0.0046, 0.0046, 0.0046, 0.0000, 0.0046, 0.0000, 0.0000, 0.0046 arates3 = 0.0000, 0.0136, 0.0136, 0.0136, 0.0136, 0.0136, 0.0000, 0.0136, 0.0000, 0.0000, 0.0136 arates7 = 0.0000, 0.0014, 0.0014, 0.0014, 0.0014, 0.0014, 0.0000, 0.0014, 0.0000, 0.0000, 0.0014 &end
&options detail = f pspec = 0,0,0,0,0,0,1 recto = 1,1,1,0,0,0,1 aeqp = f,f,f,t,t,t,f
&end
Parsons
Other Transportation Models Brinckerhoff
D.3-3 Truck Trips
AR00064449

OMPO Model Development Project User's Guide to Model Application
There are seven trip distribution control files, one for each trip purpose. These control files are named:
1. TPXXGDOCCTL - For Garaged 2 axle trucks
2. TPXXG3)0K.CTL - For Garaged 3 axle trucks
3. TPXXG4)0K.CTL - For Garaged 4 axle trucks
4. TPXXNDOCCTL - For non-garaged 2 axle trucks
5. TPXXN3)0K.CTL - For non-garaged 3 axle trucks
6. TPXXN4)0K.CTL - For non-garaged 4 axle trucks
7. TPXXPCDOCCTL - For port based trucks
Each of these files have three logical records. These records are &files, ¶ms; &options. The &files logical record have six keywords which are:
1. Ftends: these are the trip ends from the truck trip generation program. Be sure to code the extension as the alternative being used
2. Fimpeds: this is the highway skim tree. Again be sure to code the extension.
3. Fequivs: This is the district to zone equivalency file found in directory generic\zd
4. Ftripo: this is the output trip table - be sure to code the extension
5. Frpt: this is the output report file
6. Title: this is the title of the run.
These keywords will be the same for each of the seven runs, except for the reference to the truck purpose number (i.e. 1 to 7).
The ¶ms record has 14 keywords. These keywords have been described in the Trip Generation program description in Section 0.1. The user should not change any of these keyword values.
The &options record has 2 keywords. These keywords have been described in the Trip Distribution program description in Section 0.2. The user should not change any of these keyword values.
An example of the trip distribution control file is shown on Table 3.2.
Parsons Other Transportation Models Brinckerhoff D.3-4 Truck Trips
AR00064450

OMPO Model Development Project, Control File for Trip Distribution Application TD.EXE Truck Trips: Garage-based, 2-axle
&files ftends fimpeds fequivs ftripo frpt title
¶ms nzones ndists nfends nfProds nfAttrs tabimp nincr plbeg p2beg maxi ter reltol abstol width nintervs scale offset
&options prteqv calib
= 'texxppxx.%%%' = '..\hwy\skpkxxol.%%%' = '..\..\generic\zd\764to23.eqv' = 'tpxxg2xx.%%%' = 'tpxxg2xx.rpt' = 'TD for trucks: grg-based, 2-axle'
= 764 = 23 = 14 = 1 • 8 • 1 • 1 = -0.03 = 0.00 = 10 = 0.005 = 10 = 2 = 50 = 100.0 = 0.0
=F =F
OMPO Model Development Project
User's Guide to Model Application
Table 3.2 Example of Truck Trip Distribution Control File
The control file to build the time of day truck trips is a MINUTP control file with a name of TOTDOKXX.SET. This file adds the seven purposes together and allocates 30 percent to the morning peak period, 30 percent to the evening peak period and 40 percent to the off-peak hours. An example of this file is shown in Table 3.3. For the normal procedures, the analyst need not change anything in this control file.
There are two report control files - TPXXPPXX.CTL and TOTDOOKX.CTL. These are standard report control files. The first control file produces a district to district report of each of the individual truck trip tables will the second one reports the three truck trip tables which will go to the assignment process. The analyst must change the extension on the input files for these reports.
Parsons Other Transportation Models Brinckerhoff D.3-5 Truck Trips
AR00064451

OMPO Model Development Project User's Guide to Model Application
3.3 Input Files
The entire truck trip estimation procedure uses two input data files. There is the zone data file (ZD .zzz) which is the same file used in the trip generation procedures. The other file is the peak period highway travel time file (SKPK)0(01.zzz) that is built in the highway path-building and skimming procedures.
3.4 Output Files
The procedure produces 8 output truck trip tables. These tables are:
1. TPXXGDOK.zzz: Garage-Based Two Axle Truck Trips
2. TPXXG3)0(.zzz: Garage-Based Three Axle Truck Trips
3. TPXXG4)0(.zzz: Garage-Based Four Axle Truck Trips
4. TPXXN2)0(.zzz: Non-Garage-Based Two Axle Truck Trips
5. TPXXN3)0(.zzz: Non-Garage-Based Three Axle Truck Trips
6. TPXXN4)0(.zzz: Non-Garage-Based Four Axle Truck Trips
7. TPXXPO)0(.zzz: Port Based Truck Trips
8. TOTT)000(.zzz: Truck Trip table for assignment with table 1 being AM peak 4-hour, 2 is off-peak 16-hour, table 3 is PM peak 4-hour, and table 4 is AM peak 2-hour.
3.5 Procedure Controls
The truck procedure is implemented using the batch file TRKALL.BAT. Once the control files have been modified for the alternative and the programs can be run by typing at the DOS prompt trkall zzz (where zzz is the alternative extension). A copy of the batch file is shown on Table 3.4. In addition, to the main batch file there is a trip generation batch file (tgt.bat) and a trip distribution batch file (td.bat). These batch files simply call the trip generation program and the trip distribution program.
Parsons Other Transportation Models Brinckerhoff D.3-6 Truck Trips
AR00064452

OMPO Model Development Project
User's Guide to Model Application
Table 3.3 Example of the Truck Time of Day Control file
(File TOTTXXXX.SET)
$ Honolulu models $ Time of Day & Directional Distribution Model Application $ Trucks $ produce vt o/d for all purps combined *pgm matrix *unit 11=tpxxg2xx.%alt% garage-based 2-axle *unit 12=tpxxg3xx.%alt% garage-based 3-axle *unit 13=tpxxg4xx.%alt% garage-based 4+axle *unit 14=tpxxn2xx.%alt% non-garage-b 2-axle *unit 15=tpxxn3xx.%alt% non-garage-b 3-axle *unit 16=tpxxn4xx.%alt% non-garage-b 4+axle *unit 17=tpxxpoxx.%alt% port-based 3-axle *unit 19=tpxxppxx.%alt% vt o/d all purps $ sum mats and write to one file get 1,101 get 2,201 get 3,301 get 4,401 get 5,501 get 6,601 get 7,701 comp 8=1+2+3+4+5+6+7 out 1,901-908
*pgm matrix *unit 11=tpxxppxx.%alt% vt o/d all purps *unit 19=tottxxxx.%alt% vt o/d all purps $ balance to o>d trnp 1,108 get 2=108 comp 3=1+2 fac 3,0.5,b $ fac by tod comp 4=3 comp 5=3 fac 4,0.30,b fac 5,0.40,b out 4,901-902 out 4,903
Parsons
Other Transportation Models Brinckerhoff D.3-7 Truck Trips
AR00064453

OMPO Model Development Project
User's Guide to Model Application
Table 3.4 Example of the Truck Procedure Batch File
(File TRKALL.BAT)
@echo off @echo TG & TD for trucks rem set alt designator set alt=%1 rem run app TGT call tgt texxppxx.ctl rem rem run app TD and report call td tpxxg2xx.ctl call td tpxxg3xx.ctl call td tpxxg4xx.ctl call td tpxxn2xx.ctl call td tpxxn3xx.ctl call td tpxxn4xx.ctl call td tpxxpoxx.ctl call report tpxxppxx.ctl rem rem TOD factoring and report call do tottxxxx call report tottxxxx.ctl rem @echo.
3.6 Reports
Each of the programs produces a short report and the two report program runs produce a set of district to district summaries of the truck trip tables.
Parsons Other Transportation Models Brinckerhoff D.3-8 Truck Trips
AR00064454

OMPO Model Development Project User's Guide to Model Application
E. Network Assignment and Reporting
Parsons
Network Assignment and Reporting Brinckerhoff
AR00064455

OMPO Model Development Project User's Guide to Model Application
I. Highway Assignment and Reporting
1.1 Purpose
There are four MINUTP program runs, which form the standard highway assignment procedures. Three assignment program runs perform equilibrium capacity constraint assignments for the morning peak period (from 5 to 9 AM), the evening peak period (from 2 to 6 PM), and the off-peak period. The fourth run is a NETMRG program run, which adds the volumes for the three time periods and outputs a daily volume network.
1.2 Control File
Each of the three assignment program runs consists of two MINUTP programs. The first program is a NETMRG program which simply reads the base highway network, moves the period number of lanes (such as lanea) to the standard lane file, and write a network to be used in the assignment procedure.
The second program is the assignment program (ASSIGN) and this program has several parameters and options in the control file. Five basic parameters are:
1. Par Pctadt=30 - This parameter sets the percent of trips the program will be using to estimate the v/c ratio. In this example, the percent is 30.
2. Par SInk=2 - This parameter tells the program to assign all the trips
3. Par Speed=0 - This parameter tells the program to use the SPED tables values for the link SPDC class
4. Equ tol = 0.0001 - This parameter sets the tolerance for the equilibrium closure to 0.0001
5. Thet 30*0 - This parameter tells the program to run a maximum of 30 iterations, stopping sooner if it reaches closure
The assignment procedure contains some trips that can or cannot use specified links. The links are specified using the limit(x) field in the network. The specification of which links can or cannot be used are made using the flagfac record.
Parsons Network Assignment and Reporting Brinckerhoff E.1-1 Highway
AR00064456

OMPO Model Development Project
User's Guide to Model Application
The format of the flagfac record is as follows:
Field Meaning (1) Values (1)
1 Prohibits for table specified in mati 1 to 9
2 Prohibits for table 1 (P for prohibit) 0 or P
3 Prohibits for table 2 (P for prohibit) 0 or P
4 Prohibits for table 3 (P for prohibit) 0 or P
5 Prohibits for table 4 (P for prohibit) 0 or P
6 Prohibits for table 5 (P for prohibit) 0 or P
7 Prohibits for table 6 (P for prohibit) 0 or P
8 Prohibits for table 7 (P for prohibit) 0 or P
9 Prohibits for table 8 (P for prohibit) 0 or P
10 Prohibits for table 9 (P for prohibit) 0 or P
(1) Meaning and values for these procedures — see MINUTP manual for full description
The parameter record "mati" specifies the table used by the program. For example a mati record of:
mati 101,102,201,202,301,401,501,601,602
says that the first table is the first table from unit 11, the second table is the second table from unit 11, the third table is the first table from unit 12, etc. Using the mati record and the flagfac records, the control cards instruct the program to constrain the trip tables to the specified links.
In this procedure, these instructions are as follows:
1. Table 101: This is the one/car vehicle trips for the morning peak period. These trips can use links with a limit code of 1 (all vehicles permitted) or 6 (trucks prohibited).
2. Table 102: This is the one/car vehicle trips for the morning shoulder period. These trips can use links with a limit code of 1 (all vehicles permitted) or 6 (trucks prohibited).
3. Table 201: This is the two/car vehicle trips for the morning peak period. These trips can use links with a limit code of 1 (all vehicles permitted), 2 (only HOV 2+ permitted) , or 6 (trucks prohibited).
4. Table 202: This is the two/car vehicle trips for the morning should period. These trips can use links with a limit code of 1 (all vehicles permitted), 2 (only HOV 2+ permitted), or 6 (trucks prohibited).
5. Table 301: This is the air access vehicle trips for the morning peak period and shoulder period. These trips can use links with a limit code of 1 (all vehicles permitted), 2 (only HOV 2+ permitted), or 6 (trucks prohibited).
6. Table 401: This is the truck trips for the morning peak period and shoulder period. These trips can only use links with a limit code of 1 (all vehicles permitted).
Parsons Network Assignment and Reporting Brinckerhoff E.1-2 Highway
AR00064457

OMPO Model Development Project User's Guide to Model Application
7. Table 501: This is the vehicle trips for visitors (including taxi trips) for the morning peak and shoulder periods. These trips can use links with a limit code of 1 (all vehicles permitted), 2 (only HOV 2+ permitted), or 6 (trucks prohibited).
8. Table 601: This is the three plus persons per car vehicle trips for the morning peak period. These trips can use links with a limit code of 1 (all vehicles permitted), 2 (only HOV 2+ permitted), 3 (only HOV 3+ permitted), or 6 (trucks prohibited).
9. Table 602: This is the three plus persons per car vehicle trips for the morning shoulder period. These trips can use links with a limit code of 1 (all vehicles permitted), 2 (only HOV 2+ permitted), 3 (only HOV 3+ permitted), or 6 (trucks prohibited).
In addition to these parameters and options, the control file also specifies reading three other files. These files are the turn penalty file, the volume delay function file, and the speed and capacity table file. The turn penalty file is a standard MINUTP turn penalty file and should always be in the directory HVVY and the file name should always be TpoOOKau.zzz - with the initial )o( is am, pm or md (depending on the time period) and the zzz is the alternative.
The speed and capacity files should always be in the Generic/Hwy directory and should have the name of Iw000(au.def:
$ Default SPED & CAPA lookup values sped 01 sped 11 sped 21 sped 31 sped 41 sped 51 sped 61,630,650,680 capa 01 capa 11 capa 21 capa 31 capa 41 capa 51 capa 61 „ ,
In essence these SPED and CAPA records tell the program to use the speed and capacity codes directly coded on the link records as the speed or capacity value (actually the capacity codes are multiplied by 50 to obtain the vehicles per lane per hour), with three exceptions. These exceptions are:
1. For a sped code of 61, use 63 MPH,
2. For a sped code of 62 use 65 MPH and;
3. For a sped code of 63 use 68 MPH.
The volume delay functions are equations that adjust the speed on the links given a volume to capacity ratio and the previous speed. A new class of functions named conical volume -delay functions due to it's geometrical interpretation as hyperbolic conical sections was developed by Heinz Spiess. There are five formulations, for various facility types, plus a general formulation
Parsons Network Assignment and Reporting Brinckerhoff E.1-3 Highway
AR00064458

OMPO Model Development Project
User's Guide to Model Application
and a "do nothing" formulation for centroids. The volume delay functions should always be in the Generic/Hwy directory and should have the name of vth000cau.def:
par adjivar=factype comp tc()=St0*(2.+(10 ^2*(1-Svc) ^2+((2*10-1)/(2*10-2)) ^ 2) ^ 0.5-
10.*(1-Svc)-(2*10-1)/(2*10-2)) comp tc(1)=St0*(2.+(10 ^2*(1-Svc) ^2+((2*10-1)/(2*10-2)) ^ 2) ^ 0.5-
10.*(1-Svc)-(2*10-1)/(2*10-2)) comp tc(2)=St0*(2.+(6.5 ^2*(1-Svc) ^2+((2*6.5-1)/(2*6.5-2)) ^ 2) ^ 0.5-6.5*
(1-$vc)-(2*6.5-1)/(2*6.5-2)) comp tc(3,4)=St0*(2.+(5.2 ^2*(1-Svc) ^2+((2*5.2-1)/(2*5.2-2)) ^ 2) ^ 0.5-5.2*
(1-$vc)-(2*5.2-1)/(2*5.2-2)) comp tc(5)=St0*(2.+(4 ^2*(1-Svc) ^2+((2*4-1)/(2*4-2)) ^ 2) ^ 0.5-
4.*(1-Svc)-(2*4-1)/(2*4-2)) comp tc(6)=St0*(2.+(2 ^2*(1-Svc) ^2+((2*2-1)/(2*2-2)) ^ 2) ^ 0.5-
2.*(1-Svc)-(2*2-1)/(2*2-2)) comp tc(8)=St0*(2.+(5.3 ^2*(1-Svc) ^2+((2*5.3-1)/(2*5.3-2)) ^ 2) ^ 0.5-
5.3*(1-Svc)-(2*5.3-1)/(2*5.3-2)) comp tc(9)=$t0
An example of the highway assignment program, for the morning peak, is presented on Table 1.1
Table 1.1 Example Morning Peak Period Assignment Set-Up (ASAMXXAU.SET)
$ Honolulu models $ AM PEAK-Period (4 hr) Capacity Restrained ASSIGNMENT
*pgm netmrg hnamxxfs.%alt%,hnttxxxx.%alt% comp lane=lanea
*pgm assign hnamxxfs.%alt%„1,1000 *unit 11=..\tod\vottxxol.%alt% vt by tod for occl *unit 12=..\tod\vottxxo2.%alt% vt by tod for occ2 *unit 13=..\air\vottaaxx.%alt% vt by tod for air acc *unit 14=..\trk\tottxxxx.%alt% vt by tod by trucks *unit 15=..\vis\vottvsxx.%alt% vt by tod by visitors *unit 16=..\tod\vottxxo3.%alt% vt by tod for occ3+ *unit 21=hlamxxxx.%alt% loaded network *id AM Peak Per Asnmt (4 hr)
$ Parameters par pctadt=30 pct of trips that occur in capacity pd. par slnk=2 assign all trips par speed=0 use SPED values according to SPDC equi to1=0.0001 equilibrium assignment w/ tolerance factor thet 30*0 number of iterations
$ Trip tables and restrictions for assignment mati 101,102,201,202,301,401,501,601,602 par flagvar=limita specifies multi-user asnmt variable flagfac 1,0,P,P,P,P,O,P,P,P no limit 2345 789 for ol flagfac 2,0,P,P,P,P,O,P,P,P no limit 2345 789 for ol flagfac 3,0,0,P,P,P,O,P,P,P no limit 345 789 for o2 flagfac 4,0,0,P,P,P,O,P,P,P no limit 345 789 for o2 flagfac 5,0,0,P,P,P,O,P,P,P no limit 345 789 for air
Parsons
Network Assignment and Reporting Brinckerhoff
E.1-4 Highway
AR00064459

flagfac 6,0,P,P,P,P,P,P,P,P no limit 23456789 for trk flagfac 7,0,0,P,P,P,O,P,P,P no limit 345 789 for vis flagfac 8,0,0,0,P,P,O,P,P,P no limit 45 789 for o3 flagfac 9,0,0,0,P,P,O,P,P,P no limit 45 789 for o3
$ Turn penalties penf data\tpamxxau.%alt%,form=f
$ SPED & CAPA definitions *read ..\—\generic\hwy\luxxxxau.def
$ VDF definitions *read ..\—\generic\hwy\vdxxxxau.def
$ Output controls repo 1,2,4,14,20 $repo 8 for detailed link calculations
OMPO Model Development Project
User's Guide to Model Application
An example of the highway assignment program, for the morning peak, for a toll model run is presented on Table 1.2
Table 1.2 Example Morning Peak Period Assignment Set-Up (ASAMNTAU.SET)
$ Honolulu models $ AM PEAK-Period (4 hr) Capacity Restrained ASSIGNMENT $ USING TOLL TRIP TABLES
*pgm netmrg hnamxxfs.%alt%,hnttxxxx.%alt% comp lane=lanea $ combine am peak and am shoulders trip tables
$ output table format: $ 1 am-peak occl nontoll $ 2 am-peak occ2 nontoll $ 3 am-peak occ3+ nontoll $ 4 am-peak occl toll $ 5 am-peak occ2 toll $ 6 am-peak occ3+ toll
*pgm matrix *unit 11=..\tod\vottxxolAalt% vt by tod for occl, nontoll *unit 12=..\tod\vottxxo2Aalt% vt by tod for occ2, nontoll *unit 13=..\tod\vottxxo3Aalt% vt by tod for occ3+, nontoll *unit 14=..\tod\vtttxxolAalt% vt by tod for occl, toll *unit 15=..\tod\vtttxxo2Aalt% vt by tod for occ2, toll *unit 16=..\tod\vtttxxo3Aalt% vt by tod for occ3+, toll *unit 19=..\tod\vottamxx.%alt% vt by occ/toll class for 4-hour am pk
comp 1=101+102 comp 2=201+202 comp 3=301+302 comp 4=401+402 comp 5=501+502 comp 6=601+602
save out 1,901-906
*pgm assign hnamxxfsAalt%„1,1000
Parsons
Network Assignment and Reporting Brinckerhoff
E.1-5 Highway
AR00064460

*unit 11=..\tod\vottamxx.%alt% vt by occ/toll class for 4-hr am pk *unit 12=..\air\vottaaxx.%alt% vt by tod for air acc *unit 13=..\trk\tottxxxx.%alt% vt by tod by trucks *unit 14=..\vis\vottvsxx.%alt% vt by tod by visitors *unit 21=hlamxxxx.%alt%
loaded network *id AM Peak Per Asnmt (4 hr)
$ Parameters par pctadt=30
pct of trips that occur in capacity pd. par slnk=2
assign all trips par speed=0
use SPED values according to SPDC equi to1=0.0001
equilibrium assignment w/ tolerance factor thet 30*0
number of iterations
$ Trip tables and restrictions for assignment mati 101,102,201,301,401,103,104,105,106 trip tables to assign par flagvar=limita specifies multi-user asnmt variable flagfac flagfac flagfac flagfac flagfac flagfac flagfac flagfac flagfac
$ Turn penalties penf data\tpamxxau.%alt%,form=f
$ SPED & CAPA definitions *read ..\..\generic\hwy\luxxxxau.def
$ VDF definitions *read ..\..\generic\hwy\vdxxxxau.con
$ Output controls repo 1,2,4,6,14,20 $repo 8 for detailed link calculations
1,0,P,P,P,P,O,P,P,P,P,P,P no limit 2345 789101112 for ol 2,0,0,P,P,P,0,P,P,P,P,0,P no limit 345 78910 12 for o2 3,0,0,P,P,P,O,P,P,P,P,O,P no limit 345 78910 12 for air 4,0,P,P,P,P,P,P,P,P,P,P,P no limit 23456789101112 for trk 5,0,0,P,P,P,O,P,P,P,P,O,P no limit 345 78910 12 for vis 6,0,0,0,P,P,O,P,P,P,P,0,0 no limit 45 78910 for o3 7,0,P,P,P,P,O,P,P,P,0,0,0 no limit 2345 789 for ol 8,0,0,P,P,P,O,P,P,P,0,0,0 no limit 2345 789 for o2 9,0,0,0,P,P,O,P,P,P,0,0,0 no limit 2345 789 for o3+
op, nontoll op, nontoll
op, nontoll op, toll op, toll op, toll
OMPO Model Development Project
User's Guide to Model Application
Once the three assignments are run, the fourth program run (NETMRG) reads the three loaded highway networks, from each period, and produces a highway network with: (1) the volumes totaled; (2) the volumes, v/c ratios, and congested speeds for each of the three networks. This final network also contains the data common to each of the networks, such as the distance. A copy of this program's control file is as follows (ASTTXXAU.SET):
*Pgm netmrg hlttxxxx.%alt%,hlamxxxx.%alt%,hlopxxxx.%alt%,h1pmxxxx.%alt%
comp totvam=totv(1) comp totvop=totv(2) comp totvpm=totv(3) comp totv=totv(1)+totv(2)+totv(3)
comp volam=vol(1) comp volop=vol(2) comp volpm=vol(3) comp vol=vol(1)+vol(2)+vol(3)
comp vcam=vc(1)
Parsons
Network Assignment and Reporting Brinckerhoff
E.1-6 Highway
AR00064461

OMPO Model Development Project
User's Guide to Model Application
comp vcop=vc(2) comp vcpm=vc(3) comp vc=0.
comp cspdam=cspd(1) comp cspdop=cspd(2) comp cspdpm=cspd(3) comp cspd=0.
1.3 Input Files
The "non-toll" assignment programs require a highway network and the vehicle trip tables from the time of day procedures'. The highway network file should always be the basic network generated in either the Highway Network Building procedure (see Section B.1) or developed exogenously. The file name for the highway network should always be HNTDOOK.zzz.
There will be nine trip tables input to each assignment program. These trip tables will be:
1. Vehicle trips for the one/car mode for period one (e.g. the morning peak period).
2. Vehicle trips for the one/car mode for period two (such as the shoulder period).
3. Vehicle trips for the two/car mode for period one.
4. Vehicle trips for the two/car mode for period two.
5. Vehicle trips from the air access model for the assignment period
6. Truck trips for the assignment period
7. Vehicle trips from the visitor model for the assignment period.
8. Vehicle trips for the three plus/car mode for period one
9. Vehicle trips for the three plus/car mode for period two.
Tables 1 and 2 will be in the TOD directory and will be on file VOTT)0(01.zzz. Table 3 and 4 will also be on the TOD directory on file VOTT)0(02.zzz. Table 5 will in the AIR directory on file VOTTAA)0(.zzz. Table 6 will be in the TRK directory on file TOTT)000(.zzz. Table 7 will be in the VIS directory on file VOTTVS)0(.zzz. Tables 8 and 9 will be in the TOD directory and will be on file VOTT)0(03.zzz.
The "toll" assignment program has the 9 trip tables slightly reordered. They are:
1. Non-toll vehicle trips for the one/car mode for particular time period.
2. Non-toll vehicle trips for the two/car mode for particular time period.
1 Some of the time of day procedures are embedded in the modeling procedure, such as the truck and visitor procedures, while the "standard" vehicle trip tables are produced by the Time of Day Procedures previously described.
Parsons Network Assignment and Reporting Brinckerhoff E.1-7 Highway
AR00064462

OMPO Model Development Project User's Guide to Model Application
3. Vehicle trips from the air access model for the assignment period (from AIR directory VOTTAAXX.zzz)
4. Truck trips for the assignment period (from TRK directory TOTTXXXX.zzz)
5. Vehicle trips from the visitor model for the assignment period (from VIS directory VOTTVSXX.zzz)
6. Non-toll vehicle trips for the three plus/car mode for particular time period.
7. Toll vehicle trips for the one/car mode for particular time period.
8. Toll vehicle trips for the two/car mode for particular time period.
9. Toll vehicle trips for the three plus/car mode for particular time period.
A matrix calculation is done prior to the highway assignment to combine the non-toll and toll vehicle trips into one file for each time period. The excerpt shown below shows the matrix calculation for the AM 4 hour time period. Tables 1, 2, 6, 7, 8, 9 are the six tables (in that order) combined in the file VOTTAMXX.zzz
*pgm matrix *unit 11=.. \tod\vottxxol.%alt% vt by tod for occl, nontoll *unit 12=.. \tod\vottxxo2.%alt% vt by tod for occ2, nontoll *unit 13=.. \tod\vottxxo3.%alt% vt by tod for occ3+, nontoll *unit 14=.. \tod\vtttxxol.%alt% vt by tod for occl, toll *unit 15=.. \tod\vtttxxo2.%alt% vt by tod for occ2, toll *unit 16=.. \tod\vtttxxo3.%alt% vt by tod for occ3+, toll *unit 19=.. \tod\vottamxx.%alt% vt by occ/toll class for 4-hour am pk
comp 1=101+102 comp 2=201+202 comp 3=301+302 comp 4=401+402 comp 5=501+502 comp 6=601+602 $ save out 1,901-906
1.4 Output Files
There are two output files from each assignment program run. The first file is produced by program NETMRG and is the highway network for the period with no volumes (for example, HNAMXXFS.zzz, for the am peak period). The second file is produced by program ASSIGN and is the highway network for the period with the volumes (for example, HLAMXXXX.zzz, for the am peak period). The fourth program run (a NETMRG) produces the highway network with the combined volumes and volumes for each time period (HLTDOKXX.zzz).
1.5 Procedure Controls
The setup batch files contains all the necessary controls. The user can invoke the procedure use the DOS batch file HVVY\ASALLBAT. This is a single command line argument with the
Parsons Network Assignment and Reporting Brinckerhoff E.1-8 Highway
AR00064463

OMPO Model Development Project
User's Guide to Model Application
batch file name and the file extension denoting the alternative. For example: >asall zzz. The following is a copy of the batch file for doing a non-toll assignment.
@echo off @echo Highway assignment set alt=%1 call do asamxxau call do aspmxxau call do asopxxau call do asttxxau @echo.
The next box shows a copy of the batch file for doing a toll assignment.
@echo off @echo Highway assignment set alt=%1 rem call do asamntau call do aspmntau call do asopntau call do asttxxau @echo.
1.6 Reports
The assign program produces the standard MINUTP reports. In the standard control file, the reports include: a listing of the SPED table; a listing of the CAPA table; Volume/Capacity report for each iteration; and link volumes for the last iteration.
Parsons Network Assignment and Reporting Brinckerhoff E.1-9 Highway
AR00064464
OMPO Model Development Project User's Guide to Model Application
2. Transit Assignment and Reporting
In the resident travel models, transit networks serve two functions: to provide service information to the mode choice model (program MC), and to provide a basis for assigning trips. This chapter describes the latter function, while Chapter B.3 describes the former.
2.1 Purpose
The Time-of-Day and Directional Factoring procedure generates person-trips on transit by time-of-day and detailed mode/path, ready to assign to transit networks. This requires a simple step of assigning trips to the paths built in the skimming step and saved on the network for this use.
The mode-choice model separately examines five transit paths, defined by combinations of access and line-haul modes. For walk access, three sets of best paths are considered: using only local bus, using some premium bus, and using some guideway service. For drive access, separate paths are built for parked vehicles and drop-offs, but are not differentiated by line-haul mode. These five path types are named and abbreviated: walk-to-local-bus (WL), walk-to-express-bus (VVX), walk-to-guideway (WG), kiss-n-ride (KR), and park-n-ride (PR). Note that WG, and in general the guideway line-haul mode, is not available in the base year setting.
Separate MINUTP TRNPTH setups assign trips to each path-type. Two MIN UTP NETMRG steps combine results from the "loaded" transit networks into one file for each time-period. Program BOARDS then reports peak and off-peak volumes on each bus line, both by line and by stop.
2.2 Control File
Batch file TRWASALLBAT controls transit assignment and reporting for all five transit paths and two time-periods. It takes a single command-line argument, the file-extension denoting the year and scenario. For the base-year application, this extension is .C9X, so the transit skim-building process is invoked by navigating to the TRN directory and invoking "ASALL C9X" at the command prompt.
The main setup file TRN\ASTTXXTR.SET performs ten separate assignments of transit trips to their corresponding paths.
The following box shows this file in its entirety. The first call to MINUTP MATRIX simply adds the visitor trips on transit to the resident trips on transit as required for assignment.
$ Honolulu models $ Transit assignment $ cvf991019 five paths, two periods, no guideway
$ walk-local *pgm matrix *unit 11=..\tod\ppttxxwl.%alt% *unit 12=..\vis\ppttvstr.c91 *unit 19=ppttxxwl.%alt% comp 1=101+201+203 comp 2=102+202
Parsons
Network Assignment and Reporting Brinckerhoff
E.2-1 Transit
AR00064465

OMPO Model Development Project
User's Guide to Model Application
out 1,901-902
*pgm trnpth ntamxxwl.%alt% *par msglev=5 *unit 11=ppttxxwl.%alt% apath=w load 101 neto p=p1pkxxwl.%alt%
*pgm trnpth ntmdxxwl.%alt% *par msglev=5 *unit 11=ppttxxwl.%alt% apath=w load 102 neto p=plopxxwl.%alt%
$ walk-premium *pgm matrix *unit 11=..\tod\ppttxxwp.%alt% *unit 12=..\vis\ppttvstr.%alt% *unit 19=ppttxvwp.%alt% comp 1=101+204+206 comp 2=102+205 out 1,901-902
*pgm trnpth ntamxxwp.%alt% *par msglev=5 *unit 11=ppttxxwp.%alt% apath=w load 101 neto p=p1pkxxwp.%alt%
*pgm trnpth ntmdxxwp.%alt% *par msglev=5 *unit 11=ppttxxwp.%alt% apath=w load 102 neto p=plopxxwp.%alt%
$ park-n-ride *pgm trnpth ntamxxpr.%alt% *par msglev=5 *unit 11=..\tod\ppttxxpr.%alt% apath=d load ,101 neto p=p1pkxxpr.%alt%
*pgm trnpth ntmdxxpr.%alt% *par msglev=5 *unit 11=..\tod\ppttxxpr.%alt% apath=d load ,102 neto p=plopxxpr.%alt%
Parsons
Network Assignment and Reporting Brinckerhoff
E.2-2 Transit
AR00064466

OMPO Model Development Project
User's Guide to Model Application
$ kiss-n-ride *pgm trnpth ntamxxwp.%alt% *par msglev=5 *unit 11=..\tod\ppttxxkr.%alt% apath=w load 101 neto p=p1pkxxkr.%alt%
*pgm trnpth ntmdxxwp.%alt% *par msglev=5 *unit 11=..\tod\ppttxxkr.%alt% apath=w load 102 neto p=plopxxkr.%alt%
$ export transit nets to ASCII *pgm netmrg ,p1pkxxwl.%alt% *id pk loaded nets merge key mode,line comp volab=(vol(1)) comp volba=(volt(1))-volab comp tbrda=(brda(1)) comp tbrdb=(brdb(1)) comp txita=(xita(1)) comp txitb=(xitb(1)) list mode=2-3,$line=5-10,a=11-16,b=17-21,dist=22-25,volab=26-31 list volba=32-37,tbrda=38-42,tbrdb=43-47,txita=48-52,txitb=53-57 lsto 2,p1pkxxwl.asc $ export transit nets to ASCII *pgm netmrg ,p1pkxxwp.%alt% *id pk loaded nets merge key mode,line comp volab=(vol(1)) comp volba=(volt(1))-volab comp tbrda=(brda(1)) comp tbrdb=(brdb(1)) comp txita=(xita(1)) comp txitb=(xitb(1)) list mode=2-3,$line=5-10,a=11-16,b=17-21,dist=22-25,volab=26-31 list volba=32-37,tbrda=38-42,tbrdb=43-47,txita=48-52,txitb=53-57 lsto 2,p1pkxxwp.asc
$ export transit nets to ASCII *pgm netmrg ,p1pkxxpr.%alt% *id pk loaded nets merge key mode,line comp volab=(vol(1)) comp volba=(volt(1))-volab comp tbrda=(brda(1)) comp tbrdb=(brdb(1)) comp txita=(xita(1)) comp txitb=(xitb(1)) list mode=2-3,$line=5-10,a=11-16,b=17-21,dist=22-25,volab=26-31 list volba=32-37,tbrda=38-42,tbrdb=43-47,txita=48-52,txitb=53-57
Parsons
Network Assignment and Reporting Brinckerhoff
E.2-3 Transit
AR00064467

OMPO Model Development Project
User's Guide to Model Application
lsto 2,p1pkxxpr.asc $ export transit nets to ASCII *pgm netmrg ,p1pkxxkr.%alt% *id pk loaded nets merge key mode,line comp volab=(vol(1)) comp volba=(volt(1))-volab comp tbrda=(brda(1)) comp tbrdb=(brdb(1)) comp txita=(xita(1)) comp txitb=(xitb(1)) list mode=2-3,Sline=5-10,a=11-16,b=17-21,dist=22-25,volab=26-31 list volba=32-37,tbrda=38-42,tbrdb=43-47,txita=48-52,txitb=53-57 lsto 2,p1pkxxkr.asc
$ export transit nets to ASCII *pgm netmrg ,plopxxwl.%alt% *id op loaded nets merge key mode,line comp volab=(vol(1)) comp volba=(volt(1))-volab comp tbrda=(brda(1)) comp tbrdb=(brdb(1)) comp txita=(xita(1)) comp txitb=(xitb(1)) list mode=2-3,Sline=5-10,a=11-16,b=17-21,dist=22-25,volab=26-31 list volba=32-37,tbrda=38-42,tbrdb=43-47,txita=48-52,txitb=53-57 lsto 2,plopxxwl.asc $ export transit nets to ASCII *pgm netmrg ,plopxxwp.%alt% *id op loaded nets merge key mode,line comp volab=(vol(1)) comp volba=(volt(1))-volab comp tbrda=(brda(1)) comp tbrdb=(brdb(1)) comp txita=(xita(1)) comp txitb=(xitb(1)) list mode=2-3,Sline=5-10,a=11-16,b=17-21,dist=22-25,volab=26-31 list volba=32-37,tbrda=38-42,tbrdb=43-47,txita=48-52,txitb=53-57 lsto 2,plopxxwp.asc
$ export transit nets to ASCII *pgm netmrg ,plopxxpr.%alt% *id op loaded nets merge key mode,line comp volab=(vol(1)) comp volba=(volt(1))-volab comp tbrda=(brda(1)) comp tbrdb=(brdb(1)) comp txita=(xita(1)) comp txitb=(xitb(1)) list mode=2-3,Sline=5-10,a=11-16,b=17-21,dist=22-25,volab=26-31
Parsons
Network Assignment and Reporting Brinckerhoff
E.2-4 Transit
AR00064468

Honolulu models cvf991019 sort trn net records
&files finame='plpkxxtr.asc' foname='tspkxxtr.asc' fpname='tspkxxtr.rpt'
¶ms pbegcol= 5 pnumcol= 6 sbegcol= 0 snumcol= 0
&options typsrt= 'L'
In: NETMRG output link records Out: sorted link records Out: report
Primary sort key - beginning column Primary sort key - length Secondary sort key - beginning column Secondary sort key - length
Perform line (L) sort
OMPO Model Development Project
User's Guide to Model Application
list volba=32-37,tbrda=38-42,tbrdb=43-47,txita=48-52,txitb=53-57 lsto 2,plopxxpr.asc
$ export transit nets to ASCII *pgm netmrg ,plopxxkr.%alt% *id op loaded nets merge key mode,line comp volab=(vol(1)) comp volba=(volt(1))-volab comp tbrda=(brda(1)) comp tbrdb=(brdb(1)) comp txita=(xita(1)) comp txitb=(xitb(1)) list mode=2-3,Sline=5-10,a=11-16,b=17-21,dist=22-25,volab=26-31 list volba=32-37,tbrda=38-42,tbrdb=43-47,txita=48-52,txitb=53-57 lsto 2,plopxxkr.asc
The following command should be typed at the DOS prompt to combine the ASCII networks together, one each for peak and off peak. Note that when doing a future year scenario, fixed guideway would be added to the following command.
type plpkxxwl.asc plpkxxwp.asc plpkxxpr.asc plpkxxkr.asc > plpkxxtr.asc type plopxxwl.asc plopxxwp.asc plopxxpr.asc plopxxkr.asc > plopxxtr.asc
Preparation for BOARDS reporting includes a run of NODES and two applications of BIGSORT. The NODES run should have already been accomplished in the transit skim-building procedures, and thus is not repeated. Program BIGSORT reorders the output from MINUTP NETMRG by transit line, as required by BOARDS. Two applications of BIGSORT accomplish this for peak and off-peak assignments. The Fortran control file for sorting peak records is shown (TSPK)OKTR.CTL). The off-peak control file (TSOP)OKTR.CTL) differs only in the input and output file names.
Parsons
Network Assignment and Reporting Brinckerhoff
E.2-5 Transit
AR00064469

Honolulu models cvf991019 transit BOARDS reports
&files fnodes= ' fnetpk= ' fnetop= ' fnames= '
names frpts = ' frptl = '
acc\tnttxxtr.c9x' tspkxxtr.asc' tsopxxtr.asc' acc\nodename.c9x'
tbttxxtr.rps' thottxxtr.rpl'
In: NODES output line file In: BIGSORT output peak link file In: BIGSORT output offpeak link file
In: ACCLINK output intersection
Out: short BOARDS report Out: long BOARDS report
&options rptmode= 4, 5 Produce long reports for these
modes scale = 1.0 Scale trips in report
OMPO Model Development Project
User's Guide to Model Application
Program BOARDS then reports boardings by line and stop for peak and off-peak. Both short-and long-format BOARDS reports are produced. The following box shows the control file for BOARDS (T BTTXXT R. CT L).
2.3 Input Files
Transit assignment requires two main types of input files: trip-tables containing person trips on transit for each path-type, and "built" networks containing descriptions of the best transit paths of each type. Assignment uses person trip tables produced by the Time-of-Day and Directional Factoring procedures, with standard names pptbouvl.zzz, pptbomp.zzz, pptbouvg.zzz, pptbo(przzz, and pptbockr.zzz for the five path-types, where "zzz" is the alternative name. The required transit networks are produced by the Transit Path- and Skim-Building Procedures. They have standard names ntamxxwl.zzz, ntamxxwp.zzz, ntamxxwg.zzz, and ntamxxprzzz (replace am with md for midday paths). Note that no set of kiss-n-ride paths exist, as the kiss-n-ride trips are assigned to the best walk-express or walk-guideway paths.
The NETMRG setup in TRN\ASTTXXTR.SET requires only the loaded transit networks output from each transit assignment step as input. Each application of BIGSORT requires as input only the output from NETMRG. Finally, BOARDS reads the NODES and BIGSORT outputs. BOARDS also reads a file of intersection names produced during an ACCLINK application in the skim-building step. The format of both the NODES output file and ACCLINK intersection file are described in the earlier chapter on skim-building.
2.4 Output Files
Each transit assignment setup produces a loaded transit networks, in MINUTP binary format, which is then output to ASCII-format. The TYPE command at the DOS prompt combines these to produce one per time period, and writes link records out to ASCII-format files with standard names plpkxxtr.asc and plopxxtrasc. An excerpt from file plpkxxtr.asc, shown below, contains one record per loaded link with the following information: mode number (columns 2-3), line name (5-10), a-node (11-16), b-node (17-21), distance (22-25), a>b volume (26-31), b>a volume (32-37), boards at a (38-42), boards at b (43-47), exits at a (48-52), and exits at b (53-57).
Parsons Network Assignment and Reporting Brinckerhoff E.2-6 Transit
AR00064470

OMPO Model Development Project
User's Guide to Model Application
11 1 1763 21 8 27 0 0 0 0 15 1 1763 21 0 0 0 0 0 0 11 1 1764 41 0 0 0 0 0 0 15 1 1764 41 0 1 0 0 0 0 15 2 1764 55 0 0 0 0 0 0 15 2 2466 110 0 4 0 0 0 0
4 22AW 1001 1203 39 22 0 0 0 0 4 4 22AE 1001 2893 35 26 0 0 0 0 0 4 1DE 1002 2643 30 15 0 0 0 0 8 4 22AE 1002 2643 30 42 0 0 0 0 15 4 58AE 1002 2643 30 33 0 0 0 0 17 5 82AE 1002 2643 30 269 0 0 0 0 140 4 1DW 1002 2885 9 64 0 0 0 0 51
Program BIGSORT creates files formatted just as the inputs, but sorted by line name.
Program BOARDS produces only reports, detailed in section 2.6 and attachments.
2.5 Controls
The setup and control files have all necessary parameters specified, although the user can refer to section 2.2 above for documentation of each setting. Batch file TRWASALLBAT controls assignment and reporting for all available transit paths and both time periods.
2.6 Reports
At the completion of each assignment run, the standard MINUTP report file is copied to the same name as the setup which created it, maintaining the default extension .prn. This file echoes all commands and reports any problems.
Programs BIGSORT and BOARDS each produce report files, named as specified in the corresponding control file. The report files from BIGSORT echo the input parameters and provide informational and summary messages. Program BOARDS provides both long and short BOARDS reports. These wide ASCII-format files must be printed in landscape mode. Excerpts from the short and long BOARDS reports are shown below.
2.7 Error Messages
Since transit assignment calls MI NUTP modules, standard MI NUTP error messages are produced. The end of each report file summarizes the maximum severity of all problems encountered, with severity 0 indicating no warnings, 4 warnings but no fatals, and 8 fatals. The user should investigate all messages and consult MINUTP documentation for details.
Applications BIGSORT and BOARDS produce error messages which detail any problems they encounter. The most typical BOARDS error message the user might encounter is described below. It indicates a mismatch between the transit network used for assignment and that shown in the NODES file. The usual solution is to produce a NODES output file using the updated transit network information (see User's Guide to Model Application, Section B.3).
boards 9006 (e) peak link not found (name,anode,bnode): linename, anode, bnode boards 9014 (e) offpeak link not found (name,anode,bnode): linename, anode, bnode
Parsons
Network Assignment and Reporting Brinckerhoff
E.2-7 Transit
AR00064471

BO
AR
DS
sho
rt-re
por
t board
sltb
ttxx
trrp
s (e
xcer
pt)
BO
AR
DS
long
-rep
ort
board
sltb
ttxxtr
rpl (e
xcer
pt)
a)
tx 0
0 co
-,-, 0 0
a)
0 0
0 0 CO N CO N
CO N
CO COI 0 0 CO
1 1 1
>1 ctO -.. 0 ctO
a)
tx 0
0 co
1 1 1
ctO
ctO 0 1
0 0
a)
tx 0
0 co
0 0 0
ctO 0 1
a)
0 0
1
a)
tx 0
0 co
0 0 0
ctO 0 1
a)
0 0
0 0 0
1 1 1
ctO
a)
tx 0
0 LE
CO N
—1 LE 0 1
a)
0 0
CO COI 0 CO
CO N
—1 LE 0 1 N-1 -
0 o
ctO CO COI 0 CO
-
a)
0 0
ano
de b
no
de
xrt
•-1 ctO
0
a)
tx 0
0 LE
C--
N N
co co •ol co
ctO
•ot
C-- .
c7 0 c,
SD,
tx
CO CO
0 0
CO Col
0 Op
• CD COI
X 0
t=r, CO
Op 0 Op CX .
ctO 0
oo 0 a)
G) CO CO CO
CD
1 X
SD,
tx •ol 0
CO
0 LE
ctO a)
. . . •71,
N N 0 CO
C, C--
Op CO N 0 0 CO
• • •
N 0 0
+ +
41
41
741639192
N Op 0 0 Op N N CO Op Op 0
N •71,
Op 0 0 Op CO Op
315590 6
30
799
s —
N 0 0
Op
+ +
0 0 0 0 0 0 0
0 0 0 0 0 0 0
0 N N N Col N C-- C-- N
COI 0 C-- 0 COI
Op sx • N
+ +
C-- Op CX
C-- C-- N Op 0 COI
X0 N N
-7P xrt c,
cO
0 tx xt 0
CX CX X0 Op
tDO -7P
M
0 SI—I 0
xrt •71, •71,
N N
' N N CX 0 0
N N _ N
0 3
14
47114
70
77461548
c,
X0 N N
-7P
CO 0 Op Op 0 GS Op Op N
0 CO C-- 0 COI N N c,
LE SD, 1 tx
ctO
0 0 •71, •71, •71,
N N
LE SD, 1 tx
ctO
CX CX X0 Op
tDO -7P
CX 0 0
a) a)
CO 0 N N N GS
N -7P -7P N N N N -7P
3144
711
47
077461548
+ +
0 0 COI CO •71, C-- C-- 1
CO COI 0 1 CD CD Col Col 1 N
CO Op CX COI CO 1 0
Op Op N CO CX 1 COI Col 1 CD
way
sto
ps
N CO Op N 0 N NOHN
way
sto
ps
CO CX N GO Cs Cs C--
CO
0 0 0
Op
NNNNN
— a)
N
N N
0 •
N
N • •
N
CX •
0 0 0 •
CX CO
• •
0 0
•
0
0 0 0 Op 0 0 0
0 0
• 0
• • N
•
co -o
PO 4. .9 co co -o
e e e co°
+ +
AR00064472

OMPO Model Development Project User's Guide to Model Application
F. Utility Programs
Parsons
Utility Programs Brinckerhoff
AR00064473

OMPO Model Development Project User's Guide to Model Application
I. ZONAL DISTRIBUTION PROGRAM (ZDISTRIB.EXE)
1.1 Purpose
This program is designed to distribute any zonal attribute into separate categories. For example, the program can take a forecast of zonal households and distribute them (based on an input base household distribution) into appropriate household size, worker, and income strata. Similarly, the program could take forecasts of zonal employment (i.e. jobs at the workplace) and distribute them into zonal jobs by type (assuming a base input distribution was provided).
The program was specifically written for distributing zonal households into size, worker, and income strata. For the OMPO travel demand models, this distribution will normally be generated from the Land Use models. However, initially this program was not available for the travel demand modelers. Therefore, the base distribution of households was determined from the expanded Household Interview Survey (HIS) data. The zonal distribution program was then used to distribute the census total households into size, worker, and income strata for each zone.
This document describes the Zonal Distribution Program, including its inputs, outputs, and program execution. All example files are from the OMPO household distribution run, which was used to distribute zonal households into size, worker, and income strata.
1.2 Input Files
The Zonal Distribution Program requires 2 input files: 1) Zone attribute file (e.g. total households by zone), and 2) Base distribution file (e.g. base zonal households by size, workers, and income).
1. Zone attribute file: This file contains the zonal data which is to be distributed into categories by the program. The file format is flexible. The program expects to read 2 integer variables: ZONE ID and ATTR, the attribute which is to be distributed. The format is specified in the control file, but the program must have the variables in that order (i.e. zone first).
2. Base distribution file: This file contains the base distribution of zonal attributes, which serves as the seed for the distribution of input zonal attributes. For example, the file could contain the input household distribution by household size, household income, and number of workers. Again, the file format is flexible. The program expects to read a ZONE_ID, ATTR_GROUP1, ATTR_GROUP2, ATTR_GROUP3, etc., where ATTR_GROUPx represents the number of zonal attributes in group (or strata) x. The user can specify how many groups are available, and then specify the corresponding format in the control file. The program is expecting all INTEGER values, and the ZONE_ID must be the first variable in the file.
Parsons Utility Programs Brinckerhoff F.1-1 Zonal Distribution Program
AR00064474

Field Columns 1 1-8 2 9-16 3 17-24 4 25-32 5 33-40 6 41-48 7 49-56 8 57-64 9 65-72 10 73-80 11 81-88 12 89-96 13 97-104 14 105-112 15 113-120 16 121-128 17 129-136 18 137-144 19 145-152 20 153-160 21 161-168 22 169-176 23 177-184 24 185-192 25 193-200 26 201-208 27 209-216 28 217-224 29 225-232 30 233-240 31 241-248 32 249-256 33 257-264 34 265-272
Field Contents Zone Population total employment (sum of cols 11-20) housing units hotel rooms residential units group quarters residents total households (census) mean persons per household mean household income ($) district (1-23) puma (1-7) military employment government employment hotel employment agricultural employment transportation employment industrial employment fiscal employment service employment retail employment construction employment private college students public college students private k-12 students public k-12 students number of schools workers residing in group quarters (census) retail employment: resident-oriented retail employment: visitor-oriented total employment by workers residing in households area type (1-9) retail employment: resident-oriented area of zone (in square miles)
OMPO Model Development Project User's Guide to Model Application
Example Inputs:
1. Zone attribute file = zd)0000m c9x
The file zd)00000cc9x contains data on households and attractors. It contains one row per zone. All fields in this file are 8 columns wide. The key to the zd)00000cc9x file is shown below.
2. Base distribution file = zth000th3.c95
The file zd)000th3.C95 contains the input household distribution by household size, household income, and number of workers. The household distribution is a three dimensional joint distribution of households. The file is a standard ASCII format file. Each field is 5 columns wide. The first column is the zone number and subsequent columns contain households in each class within the size, income, and number of workers distribution. An excerpt from zth000th3.c95 follows:
Parsons
Utility Programs Brinckerhoff F.1-2 Zonal Distribution Program
AR00064475

Field Zone income 0-20k income 0-20k income 0-20k income 0-20k income 0-20k income 0-20k income 0-20k income 0-20k income 0-20k income 0-20k income 0-20k income 0-20k income 0-20k income 0-20k income 0-20k income 20-40k income 20-40k income 20-40k income 20-40k income 20-40k income 20-40k income 20-40k income 20-40k income 20-40k income 20-40k income 20-40k income 20-40k income 20-40k income 20-40k income 20-40k income 40-75k income 40-75k income 40-75k
Format Columns i5 1-5
1 person 0 worker i5 6-10 1 person 1 worker i5 11-15 1 person 2+ worker i5 16-20 2 person 0 worker i5 21-25 2 person 1 worker i5 26-30 2 person 2+ worker i5 31-35 3 person 0 worker i5 36-40 3 person 1 worker i5 41-45 3 person 2+ worker i5 46-50 4 person 0 worker i5 51-55 4 person 1 worker i5 56-60 4 person 2+ worker i5 61-65 5+ person 0 worker i5 66-70 5+ person 1 worker i5 71-75 5+ person 2+ worker i5 76-80 1 person 0 worker i5 81-85 1 person 1 worker i5 86-90 1 person 2+ worker i5 91-95 2 person 0 worker i5 96-100 2 person 1 worker i5 101-105 2 person 2+ worker i5 106-110 3 person 0 worker i5 111-115 3 person 1 worker i5 116-120 3 person 2+ worker i5 121-125 4 person 0 worker i5 126-130 4 person 1 worker i5 131-135 4 person 2+ worker i5 136-140 5+ person 0 worker i5 141-145 5+ person 1 worker i5 146-150 5+ person 2+ worker i5 151-155 1 person 0 worker i5 156-160 1 person 1 worker i5 161-165 1 person 2+ worker i5 166-170
OMPO Model Development Project
User's Guide to Model Application
1 0 100 29 63 29 39 5 65 20 17 27 99 49 0 22
2 64 63 77 94 90 81 82 68 9 73 79 28 75 43 8
3 5 71 58 42 84 75 77 63 32 49 22 76 90 57
4 38 79 97 23 96 30 35 81 51 89 40 33 59 84 40
5 90 8 40 72 77 61 0 79 98 12 23 3 26 52 56
6 52 82 25 84 88 62 92 18 2 87 89 1 32 53 48
The key to the ZDOOOKH3.C95 file is as follows:
Parsons
Utility Programs Brinckerhoff
F.1-3 Zonal Distribution Program
AR00064476

income 40-75k income 40-75k income 40-75k income 40-75k income 40-75k income 40-75k income 40-75k income 40-75k income 40-75k income 40-75k income 40-75k income 40-75k income 75k+ income 75k+ income 75k+ income 75k+ income 75k+ income 75k+ income 75k+ income 75k+ income 75k+ income 75k+ income 75k+ income 75k+ income 75k+ income 75k+ income 75k+
2 person 0 worker i5 171-175 2 person 1 worker i5 176-180 2 person 2+ worker i5 181-185 3 person 0 worker i5 186-190 3 person 1 worker i5 191-195 3 person 2+ worker i5 196-200 4 person 0 worker i5 201-205 4 person 1 worker i5 206-210 4 person 2+ worker i5 211-215 5+ person 0 worker i5 216-220 5+ person 1 worker i5 221-225 5+ person 2+ worker i5 226-230 1 person 0 worker i5 231-235 1 person 1 worker i5 236-240 1 person 2+ worker i5 241-245 2 person 0 worker i5 246-250 2 person 1 worker i5 251-255 2 person 2+ worker i5 256-260 3 person 0 worker i5 261-265 3 person 1 worker i5 266-270 3 person 2+ worker i5 271-275 4 person 0 worker i5 276-280 4 person 1 worker i5 281-285 4 person 2+ worker i5 286-290 5+ person 0 worker i5 291-295 5+ person 1 worker i5 296-300 5+ person 2+ worker i5 301-305
OMPO Model Development Project
User's Guide to Model Application
1.3 Output Files
There are two output files from the Zonal Distribution Program, a report file and a distributed zonal attribute file.
1. Report file: The report file simply contains the date and time various portions of the program were executed. Additionally, it is used to identify any program errors during execution (e.g. an input file wasn't found).
2. Distributed zonal attribute file: This file contains the output distribution of zonal households by required strata. The file has the same format as the input distribution file; however, the output distributed attributes sum to the input total zonal attributes.
Parsons Utility Programs Brinckerhoff F.1-4 Zonal Distribution Program
AR00064477

OMPO Model Development Project
User's Guide to Model Application
Example Outputs:
1. Report file = hh_group.rpt
03/30/00 09:00:51 Reading zonal units
03/30/00 09:00:51 Getting region units
03/30/00 09:00:51 Processing groups
03/30/00 09:00:51 Program Complete
2. Distributed zonal attribute file = zdx)oo(h3.c9x
Format is identical to zth000th3.c95 input file.
1.4 Procedure Controls
The Zonal Distribution Program (ZDISTRIB.EXE) operates in "batch" mode only. That is, the user must use a text editor to create a setup file (also called a control file or driver file). This setup file provides the program with the names of the input and output files, as well as parameters that the user may want to change. The program is executed by typing the following command at a DOS prompt:
ZDISTRIB <SETUP FILE>
Where <SETUP FILE> is the name of the setup file (can be any legitimate DOS filename, which may include drive and path information). This setup file is a generally free-form ASCII file with three control "cards". The control cards are written using the NAMELIST convention; this means that the name of the control card, preceded by an ampersand (&), is the first variable on the record, and the control card ends with a &END statement. The three control cards are the &INFILES, &OUTFILES, &PARAMS, and &FORMATS. The &INFILES card allows the user to specify the input file names; the &OUTFILES card allows the user to specify the output file names; the &PARAMS card allows the user to specify various parameters required in the program; and the &FORMATS card allows the user to specify the formats for reading the input files. NOTE: Each of the file names must be legitimate DOS file names in single quotes, and they may contain drive and path information up to 60 characters.
The &INFILES are specified using the following keywords:
ZONE_ATTR Zonal attribute file which is to be expanded ATTR_DIST Base attribute distribution file which is used as the seed
The &OUTFILES are specified using the following keywords:
REPORT Output report file ZONE_DIST Output zonal attribute distribution file
Parsons Utility Programs Brinckerhoff F.1-5 Zonal Distribution Program
AR00064478

OMPO Model Development Project User's Guide to Model Application
The &PARAMS are specified using the following keywords:
NZONES
Number of zones to be processed (in the input files) NGRPS
Number of groups to be used for the distribution
The &FORMATS are specified using the following keywords:
FMT_ZONE
FMT_DIST
Format for reading the zone attribute file records. Program expects integer values of ZONE ID and ATTRIBUTE, in that order. Width and spacing may vary, but the format cannot be more than 60 characters. Format for the zone distribution data files. Program expects to read integers, with ZONEID first. Width and spacing may vary, but the format cannot be more than 60 characters.
An example setup file (HH_GROUP.CTL) appears below. The file must be edited to specify the correct input files, output files, and parameters.
OMPO HH GROUP Control file Takes zonal landuse data (HH's) and base year distribution of hhs by group and distributes LU hhs into cross-class categories.
&infiles zone attr = 'zdxxxxxx.c9x' attr dist = 'zdxxxxh3.c95'
&end &outfiles
report ='hh group.rpt' zone dist ='zdxxxxh3.c9x'
&end ¶ms nzones = 762 ngrps = 60
&end &formats
fmt zone = '(i8,49x,i8)' fmt dist = '(i5,60i5)'
&end
NOTE: The zone attr file is supposed to have the ZONE & hhs; fmt zone tells the format for how to read zone then hhs
The attr dist file is supposed to have the zone & hhs by group; fmt dist tells the format for reading zone, then hhs in
multiple groups.
In this run, we're using CENSUS HHS from the zone file.
Parsons
Utility Programs Brinckerhoff
F.1-6 Zonal Distribution Program
AR00064479

National Transit Institute Users' Guide for Program REPORT
2. Program REPORT The reporting of information from the travel forecasting procedures is a crucial component of any forecasting task. Without powerful and flexible methods to examine the inputs, intermediate information, and forecasts, even the best forecasting procedures are ineffective as tools that produce information for decisionmaking.
Program REPORT is a dedicated reporting tool that integrates three primary functions into a single, consistent user-interface. First, it can summarize and compare trip tables, aggregating them from the zone level to the district level and preparing district-to-district reports. Second, it can summarize and compare zone attributes, aggregating them to the district level and preparing district summaries. Third, it can perform several analyses that examine and compare network-derived impedance information. The "quality-of-service" analyses include preparation of impedance information for output to thematic mapping (usually GIS) software, development of trip length frequency distributions (TLFDs), and classification of a trip table in to a set of tables that stratify trips by value ranges in a specified impedance table.
The program provides a calculator function that supports the calculation and reporting of working tables and vectors (totals, subtotals, differences, and ratios) that would not otherwise be prepared by the forecasting procedures. The program provides sufficient control on the content and format of its output reports so that the user can print or capture the report file for direct use in documentation of a set of forecasts. Applications of the program can be included within the stream of software steps that are used to apply travel forecasting procedures, thereby producing summaries "on the fly" as intermediate information (impedances, person-trip tables, mode shares) are produced. The ability to generate useful, well-formatted, and timely reports means that there are no excuses for the failure to summarize, review, and distribute the full range of information typically available within a forecast.
2.1. INPUTS
Program REPORT reads files of trip tables, impedance tables, and area (zone) attributes. The file format for area attributes is fixed, using a format that is compatible with most software (database, spreadsheet, and flat ASCII) used to maintain attribute data. File formats for trip tables and impedance tables depend entirely on the transportation software used to produce those files.
The program is intended to work with a broad range of software — both transportation software and geographic information system (GIS) mapping functions. Typically, travel forecasting procedures employ a format for trip tables and impedance tables that is used by a proprietary software package. Similarly, most travel forecasting agencies have access to the mapping functions in a GIS program that expects area attributes in a specific import format. Program REPORT currently works with the MIN UTP transportation software package and any GIS software that can import attributes files in comma-separated-value (CSV) format. Updates of the program will add other formats.
2.2. OUTPUTS
Most output from Program REPORT is written to a report file, formatted for printing and presentation. Depending on the specific application, the report file includes:
Parsons
F.2-1 Brinckerhoff
AR00064480

National Transit Institute Users' Guide for Program REPORT
• Playback of all control settings, both those specified by the user in the control file and those with non-blank default values that assume those default values;
• If the quality-of-service analysis is invoked and a trip table is provided, trip length frequency distributions (TLFDs) that describe the distribution of the trips in the trip table with respect to each of the user-specified impedance tables; and
• If summaries of trip tables are specified, reports summarizing district-to-district movements.
• If stratified trip tables are specified, reports summarizing district-to-district movements stratified by the program using user-specified impedance breakpoints and the first specified impedance table.
Four other output files are also available, generally to provide simply formatted versions of the information included in the report file. These files are useful for importing this information into other software for additional analysis. The four optional output files are:
• A plain text file with the contents of the district-level and/or district-to-district-level reports, useful for importing into a spreadsheet program for additional analysis and formatting;
• A plain text file with the contents of the TLFDs, useful for importing into a spreadsheet program for additional formatting;
• A plain text file with values from specified impedance tables for travel between all zones and a set of zones of interest; and
• A trip-table file containing a set of zone-to-zone trip tables stratified by ranges of values in the user-specified impedance table, written in the format used by the transportation software identified by the user, useful for network assignments.
To generate any of these files, the user simply supplies a filename. Program REPORT automatically invokes processing of the corresponding output information and writes the file.
2.3. CONTROLS
The user controls a specific application of the program through information supplied in a control file. The file is included in the command line when program REPORT is initiated:
CA>report myfile.ctl
Any valid filename can be used in place of "myfile.ctl" in the example. The control file specifies information for the program in several NAMELIST blocks:
• &FNAM ES
• &PARAMS
• &TABLES
identifies all input and output files needed for this application; this block must be provided in all applications.
sets various parameters for this application; this block must be provided in all applications.
specifies the calculation of internal working tables using any of the tables in the input files; either &TABLES or &VECTORS or both must be provided in all applications.
Parsons
F.2-2 Brinckerhoff
AR00064481

National Transit Institute Users' Guide for Program REPORT
• &VECTORS specifies the calculation of internal working vectors using any of the data vectors in the input files; either &TABLES or &VECTORS or both must be provided in all applications.
• &DDRPT specifies the titles and formatting for a single district-to-district report for one of the working tables (a DDRPT report cannot make direct use of an input table, but rather must refer to a working table); up to 30 &DDRPT blocks may appear in any application of the program.
• &DRPT specifies the titles and formatting for a single district report that includes up to 20 working vectors (a DRPT report cannot make direct use of vectors from an input file, but rather must refer to working vectors); up to 30 &DRPT blocks may appear in any application.
• &QOS identifies the working impedance table(s), working trip table, and other parameters necessary to control the various quality-of-service analyses; this block is optional in any application of the program.
• &PAGES groups the reports generated by &DDRPT and &DRPT onto pages in preparation for printing; this block is optional because the pagination of reports defaults to one report per page.
Table 2.3-1 documents the controls available within each of these blocks, including their functions, formats, ranges, and default values.
2.4. SYNTAX FOR &TABLES AND &VECTORS
The specifications for internal working tables and internal working vectors share the same syntax. This syntax permits the user to control the computation of working tables and vectors using information from the input files. The computations are separate: mixing of tables and vectors is not permitted.
Up to 99 working tables (t1 through t99) and 99 working vectors (v1 through v99) are available. The specification for each can refer to input tables and vectors using references in the forms:
Tftt or Vfvv
where T indicates a table reference;
V indicates a vector reference;
f identifies the FTABLEf or FVECTORf file in which the information is located;
tt identifies the table number in FTABLEf that is to be used; and
vv identifies the vector number in FVECTORf that is to be used.
Analogously, specifications can refer to working tables and working vectors by omitting the file number from the reference. The working table or working vector must be defined earlier in the
Parsons
F.2-3 Brinckerhoff
AR00064482

National Transit Institute Users' Guide for Program REPORT
Table 2.3-1(a) Controls for Program REPORT
Files, Parameters, and Internal Calculations
Keyword Type Default Definition &FNAMES Filenames for:
FEQUIV A64 <blank> File of zone-district equivalences
FREPORT A64 <blank> Output file for reports
FTABLEn A64(10) 10 * <blank> Input files of trip tables and/or impedance tables for n = 1 up to 10
FTABLES A64 <blank> Output file for stratified trip tables
FTABTXT A64 <blank> Output file for fixed-formatted version of district reports
FTABQOS A64 <blank> Output file for quality-of-service reports
FTHEMEO A64 <blank> Output file for thematic mapping information
FVECTORn A64(4) 4 * <blank> Input files of area attributes for n = 1 up to 4
&PARAMS Parameter settings for:
COLTEXT 1 6 Number of columns for each column in output file FTABTXT
NDISTS 1 0 Number of districts
NZONES 1 0 Number of zones
PAGEH 1 56 Page-height in lines
PAGEW 1 132 Page-width in columns
PRTEQV L False Print summary of zone-district equivalences
SOFTMAP Al 0 <blank> Software format for output file FTHEMEO
SOFTTRAN Al 0 <blank> Software format for FTABLEn and FTABLES
&TABLES Parameter settings for
Tn A64(99) 99 * <blank> Specifications for internal working tables 1 up to 99
TAn 1(99) 99 * 0 Reference to input or working table that sets availability (available if value <> 0)
&VECTORS Parameter settings for:
Vn A64(99) 99 * <blank> Specifications for internal working vectors 1 up to 99
VNn Al 0(99) 99 * <blank> Vector name for internal working vectors 1 up to 99
Parsons
F.2-4 Brinckerhoff
AR00064483

National Transit Institute
Users' Guide for Program REPORT
Table 2.3-1(b)
Controls for Program REPORT
Reporting and Formatting
Keyword Type Default Definition &DDRPT Settings for district-to-district reports:
COLPCT L False Report as column-percentages
DPLACES 1 0 Number of decimal places in each column
MASKUB R -999999.0 Upper bound of range for which cell values are masked out of the report
MASKLB R 999999.0 Lower bound of range for which cell values are masked out of the report
NOTEn A64(5) 5 * <blank> Text lines for footnotes
PAFMT L False Label districts "production" and "attraction" rather than "origin" and "destination"
PLACES 1 6 Number of places in each column
ROWPCT L False Report as row-percentages
SCALE R 1.0 Multiplicative scale to apply to all cell values
SOURCE A64 <blank> Text line for source footnote
T 1 0 Table number of internal working table for use in this report
TLINEn A64(5) 5 * <blank> Text for title lines
&DRPT Settings for up to 30 district reports:
COLPCT L False Report as column-percentages
DPLACES 1(20) 20 * 0 Number of decimal places in each column
NOTEn A64(5) 5 * <blank> Text lines for footnotes
PLACES 1(20) 6 Number of places in each column
SCALE R(20) 20 *1.0 Multiplicative scale to apply to all vectors
SOURCE A64 <blank> Text line for source footnote
TLINEn A64(5) 5 * <blank> Text for title lines
V 1(20) 20 * 0 Vector numbers of internal working vectors for use in this report
&QOS Settings for quality-of-service analysis:
BPOINTS 1(8) 8 * 0 Breakpoints in impedance values for use in stratifying trip table TTRIP
IZ 1(20) 20 * 0 1-zones of interest for which impedance vectors will be written in FTHEMEO
JZ 1(20) 20 * 0 J-zones of interest for which impedance vectors will be written in FTHEMEO
TIMPS 1(20) 20 * 0 Table numbers of impedance tables for FTHEMEO, FTABLES, and TLFDs
TLFINTVL R 1.0 TLFD interval used as divisor into impedance values in developing TLFDs
TLINEn A64(5) 5 * <blank> Text for title lines
TTRIP 1 0 Table number of trip table for stratification into FTABLES and TLFD development
&PAGES Settings for pagination in FREPORT:
DDPAGEm 1(30) M, 29 * 0 DDRPTs to be printed on page m
DPAGEn 1(30) n, 29 * 0 DRPTs to be printed on page n
Parsons
F.2-5 Brinckerhoff
AR00064484

National Transit Institute Users' Guide for Program REPORT
list of specifications. Consequently, a specification for working table t6 cannot refer to t8 because t8 will be evaluated after t6. Generally, then, working tables and vectors that are used in a specification must have numbers that are less than the number of the specification in which they appear.
The specifications may use any of the four arithmetic operators but may not use parentheses to set the order of calculations. To avoid ambiguity in calculation order, each specification is defined as a set of from one to 20 terms, where each term includes up to three elements combined multiplicatively (either through multiplication or division). A specification that is strictly additive in its table- or vector-references may use as many of the 20 permitted terms as needed. However, a specification that is multiplicative in its references may include only one term.
Some examples illustrate the various computations that can be specified for the working tables and working vectors.
t4 =1101 + t201'
This specification is correct. It has two terms that are added together. Working table 4 is the sum of the first table in FTABLE1 and the first table in FTABLE2.
t2 = '0.02 *t402 + 0.01 *t307
This specification is correct. It has two terms, each with one scalar and one table-reference, that are added together after the scalars are multiplied by the tables. Working table 4 is the sum of 0.02 times the second table in FTABLE4 plus 0.01 times the seventh table in FTABLE3.
v13 = V102 + v103 +v104 + v105/2' v14 = `v13 /v201'
These specifications are correct. The specification for v13 has four terms, three with single vector-references and a fourth with one scalar and one vector-reference. The specification for v14 has one term that includes two vector-references, one to a working vector and one to an input vector.
t1 = 1201 + t202 + t203 + t204' t2 =1401 + t402 + t403 + t404' t3 =12 — t1' t4 = '100 * t3 /t1'
These specifications are correct. Working table 1 has four terms and is the sum of four input tables. Working table 2 also has four terms and is the sum of four input tables. Working table 3 has two terms and is the difference between two working tables previously specified. Working table 4 has one term (the maximum permitted with division) and is 100 times the ratio of two working tables previously defined.
v23= 'v102 * v103 + v104'
This specification is incorrect and will be rejected by the error scan. It has two terms. Because the first is multiplicative in the vector-references, it must be the only term in the specification. A correct approach to these computations is:
Parsons
F.2-6 Brinckerhoff
AR00064485

National Transit Institute Users' Guide for Program REPORT
v23= 'v102 * v103' v24 = `v23 + v104'
The corrected specification for v23 has one term that includes two vector-references, the maximum permitted because it is multiplicative in its vector-references. The new specification for v24 has two terms and is additive.
2.5. FILE FORMATS
In addition to the input control file, Program REPORT deals with two kinds of input files: (1) vector files that typically contain attributes of zones or districts; and (2) table files that typically contain trips or network impedances for travel between zones or districts. The formats of these files are:
Input vector files Each record in a vector file refers to a single zone or district with the (integer) number of the zone or district in the first field and its (real number) attributes appearing in up to 100 additional fields. Gaps are permitted in the numbering of zones or districts but the records must be sorted in ascending order by zone-number or district-number. The first record in the file provides data labels. In its first field, the labels-record includes either the number of zones or the number of districts to identify whether the file provides zone-level or district-level information. In the remaining fields up to 100 fields, the labels-record provides a label for each data vector (column). All 101 fields are 10 spaces wide for both the labels-record and the data records.
Input table files The format of table files is determined entirely by the software package used to create the files and specified in &PARAMS SOFTTRAN.
In addition to the output report file, Program REPORT writes up to four other output files, depending on controls set by the user. The first file is a "plain" version of the table reports and vector reports that are written to the report file. The second is a "plain" version of the trip-length-frequency distributions (TLFDs) also written to the report file. The third is a data file for import to a thematic mapping program. The last output file comprises a set of stratified trip tables. The formats of these files are:
Output table-text file If the user provides a filename, a table-text file is created to record plain versions of all district-to-district reports and district reports. These plain versions include only the interior cell values of the reports. They do not include titles, labels, row-sums, column-sums, or other formatting provided in the report file. All columns are 10 spaces wide. Program REPORT writes the contents of this file in parallel to its writing of the output report file so that the order of its contents matches that of the report file.
Output TLFD file If the user provides a filename, Program REPORT creates a TLFD file to record plain versions of the TLFD reports. These plain versions include only the interval values and the cell values of the TLFDs. They do not include titles, labels, or other formatting provided in the report file. All columns are 10 spaces wide. Program REPORT writes the contents of this file in parallel to its writing of the TLFDs in the report file so that the order of the TLFDs is the same.
Parsons
F.2-7 Brinckerhoff
AR00064486

National Transit Institute Users' Guide for Program REPORT
Output theme file
Output trips file
If the user provides a filename, Program REPORT creates a file that provides information for importing to a thematic mapping program. The file contains an initial record that provides a label for each vector (column) followed by one record for each zone in ascending order. The first field on each record is the zone number. The remaining vectors are sorted (1) all IZ and then all JZ, and (2) TIMPS impedance tables. For example, if TIMPS = 1, 2, 3 and IZ = 100, 200 and JZ = 150, 250, 350 then the first three data fields on the first data record would be travel impedance from working tables 1, 2, and 3 from IZ 100 to zone 1. The next three fields would be the travel impedances from the same three working tables from IZ 200 to zone 1. The next three fields would be the travel impedances from the same three working tables to JZ 150 from zone 1. Two additional sets of three fields would provide the analogous information for travel to JZ 250 and JZ 350.
If the user provides a filename, Program REPORT creates a file to record the zone-to-zone stratified trip tables that result from the classification of trips in the TTRI PS trip table according to ranges set by BPOINTs in the first impedance table identified in TIM PS. The format of the output table file is compatible with the software package specified in &PARAMS SOFTTRAN.
2.6. OPERATIONS
Operation of Program REPORT includes up to ?? steps, depending on the control setting provided by the user.
1. Read controls
The program reads the control file, interprets all values, and set the controls for this application using the user-supplied values and, where appropriate, the default values.
2. Scan files
The program opens and scans all input files to determine the level of aggregation (zones or districts) and the number of tables or vectors provided for each file.
3. Read equivs
If equivalences are needed, the program reads, checks, and stores to memory the zone-district equivalences
4. Scan for errors The program checks the internal consistence among user-provided control settings and the consistence between these settings and the properties of user-identified files.
5. Do zone specs
The program applies the specifications (excluding division operations) for working tables and/or working vectors to the input zone-level files and aggregates the results to working tables and/or vectors at the district level. During this step, the program also accumulates information into TLFDs, stores information for the thematic mapping file, and writes the stratified trip-table output file if the user requests these analyses.
Parsons
F.2-8 Brinckerhoff
AR00064487

National Transit Institute Users' Guide for Program REPORT
6. Do district specs The program applies the specifications for working tables and/or working vectors to the input district-level files and the aggregated working tables and/or vectors.
7. Prepare reports The program formats the district-level reports of the selected working tables and/or working vectors as well as the TLFDs and writes these reports to a temporary file. During this step, the program also writes the table-text file, the TLFD file, and the thematic mapping file if the user requests these files.
8. Paginate
The program reads the temporary file and writes the final report file using the pagination specified by the user in &PAGES.
2.7. ERROR MESSAGES
Program REPORT applies a number of consistency checks to the control settings before initiating an application. Each message has one of three possible levels of severity. Warnings (w) identify conditions that may be incorrect but do not, by themselves, affect completion of the application. Errors (e) identify conditions that are incorrect, permit continuation of the error scan, but lead to termination of the application after the error scan is completed. Fatal (f) messages identify conditions that are incorrect and that prevent any further processing.
2.7.1 CHKFILES
Messages generated by CH KFI LES deal with problems in the availability or properties of files needed for the operation of Program REPORT.
chkfiles 6601(e) file not found: <filename>
An input file is not in the location specified. Check the spelling of the filename and the path identified for the file.
chkfiles 6602 (e) f<type><n> used in &<type> but no filename given
F<type> is either Ftables or Fvectors and &<type> is either &tables or &vectors. A specification makes reference to a table or vector in file <n>, but the corresponding ftablen or fvectorn is not provided in the control file. Correct the file reference in the specification or add the appropriate filename.
2.7.2 CHKLOGIC
Messages from CH KLOGIC identify problems in the internal consistency of settings in the control file.
chklogic 6601 (e) spec for <type><n> uses undefined internal <type><n>
<Type> is either t or v. A specification for either a table or a vector makes reference to an internal table or vector that is not defined. Check that the specification refers to tables or vectors that are defined earlier in the list of specifications.
Parsons
F.2-9 Brinckerhoff
AR00064488

National Transit Institute Users' Guide for Program REPORT
chklogic 6602 (e) spec for <type>rpt<n> uses undefined internal <type><n>
Either &DDRPT or &DRPT makes reference to an internal table number that is not defined in &TABLES or &VECTORS. Check the reference number or provide the specification.
chklogic 6603 (e) <zz> not in ascending order')
In &QOS, either the IZ list or the JZ list is not in ascending order. Revise the order.
chklogic 6604 (e) ttrip <n> invalid for qos tasks'
In &QOS, the ttrip entry does not refer to a defined internal table number.
2.7.3 INFIELD
Messages generated by INFIELD deal with problems in the syntax of specifications for &TABLES, &VECTORS, and zone-district equivalences. Field numbers are counted from left to right and are delineated by commas and the four math operators.
infield 6601 (e) illegal field # <n>
The field is blank and must not be. Check the syntax and placement of operators.
infield 6602 (e) uninterpretable field # <n>
The field is inconsistent with the required syntax and cannot be interpreted.
2.7.4 OPENFILES
Messages from OPEN FILES deal with inconsistencies in the properties of input files.
open file 6601(e) data-labels missing in <filename>
The first record of a vector file is not a data-labels record. Add the record, with the level of aggregation (number of zones or districts) in the first column and a data-label of up to 10 characters in each of the data columns.
open file 6602 (e) #areas <n> invalid in <filename>
The highest zone number found on a record in the file exceeds the number of zones specified in the control file. Check the NZONES setting and the zone-numbers in the data file.
open file 6603 (e) #items<m> < max item# <n> needed in <filename>
A specification in &TABLES or &VECTORS refers to a table or data-vector in this file that exceeds the number of tables or vectors found in the file.
2.7.5 RDCTL
Messages from RDCTL identify errors that prevent continuation of the error scan and therefore cause immediate termination of the application.
rdctl 6601 (t) error opening control file <ermum>
The program could not find the control file. Check the spelling and path of the control file named when REPORT is invoked at the prompt.
Parsons
F.2-10 Brinckerhoff
AR00064489

National Transit Institute Users' Guide for Program REPORT
rdctl 6602 (0 nzones and ndists cannot both be zero
In the control file, both the number of zones and the number of districts are specified as zero or are unspecified. One or the other, or both, must be greater than zero.
rdctl 6603 (0 report file not provided
In the control file, no filename is provided for FREPORT. Provide a name for the output file that will include all messages and reports written by the program.
2.7.6 RDEQUIV
Messages from RDEQUIV identify problems in the interpretation of the zone-district equivalences.
rdequiv 6601 (w) rec# <n> in fequiv is blank
A record in the equivalence file is entirely blank. Make sure that this record is not an error.
rdequiv 6602 (e) rec# <n> in fequiv is not an equivalence
The program could not find the keyword 'dist' (or DIST') in the first four spaces on the record. Make sure that the keyword appears in the first four spaces of every record in the equivalence file (except for records with a dollar sign in the first space to denote a comment record).
rdequiv 6603 (e) rec# <n> in fequiv has no district #
On the identified record, the program could not find an equal sign following the keyword 'dist' and separated from the keyword by at least one blank space. Make sure that an equal sign is included.
rdequiv 6604 (e) rec# <n> in fequiv has invalid district # <d>
On the identified record, the field immediately following the equal sign contains an entry that is either unreadable as an integer number, an integer number that is less than one, or an integer number greater than the value of NDISTS in &PARAMS. Correct the district number provided on the identified record in the equivalence file.
rdequiv 6605 (e) rec# <n> in fequiv has unreadable zone # <z>
The record has a field that should be a zone number that cannot be read as an integer. Correct the syntax.
rdequiv 6607 (e) rec# <n> reuses zone # <z>
The identified record assigns a zone to this district that has already been assigned to a previous district. Resolve the redundant assignment.
rdequiv 6606 (e) rec# <n> in fequiv has invalid zone # <z>
The identified record has a zone number that is either zero or greater than the value of NZONES in &PARAMS. Correct the zone number.
Parsons
F.2-11 Brinckerhoff
AR00064490

National Transit Institute Users' Guide for Program REPORT
rdequiv 6608 (w) <n> zone(s) not used in equivs: <z1, z2, ....>
At least one zone number less than or equal to NZONES has not been assigned to a district. Make sure that any omissions are intended.
rdequiv 6609 (w) <n> districts not used in equivs: <dl, d2, ....>
At least one district number less than or equal to NDISTS has not been defined as a set of zones. Make sure that any omissions are intended.
rdequiv 6612 (f) stopping with <n> fequiv errors
Program REPORT is terminating this application because of errors found in the equivalence file. Correct these errors (and any other errors detected during the error scan) and rerun the application.
2.7.7 RDSPEC
Messages from RDSPEC deal with problems in the interpretation of the specifications provided in &TABLES for individual tables and &VECTORS for individual vectors.
rdspec 6601 (e) spec has illegal operator <a> following field <n>
The operator following the identified field is not in the dictionary of operators within REPORT. Make sure that all operators are one of: plus sign, minus sign, asterisk (for multiplication), slash (for division), and comma.
rdspec 6602 (e) spec is multiplicative but has more than one term
The specification is multiplicative (using either multiplication or division of two tables or vectors) and has more than one term. Where multiplication or division of two tables or vectors is needed, specify a working table or vector to include only one term, where a term has two references to tables or vectors and may include a scalar. A specification 't2 = 0.1* t101 / t105' is acceptable. However, a specification 't3 = 0.1* t101 /t105 + 0.1* t201' is not because it contains two terms.
rdspec 6603 (e) term in field #s <m> to <n> has more than one numeric factor
The identified term has more than one scalar. Make sure that each term includes no more than one scalar and no more than two references to tables or vectors.
rdspec 6604 (e) element in field # <n> has an invalid alpha character <a>
The specification includes an alphabetic character that is not 't' or 'v' in either lower or upper case. Make sure that the specification contains only number, decimal places, operators, and the characters or 'v' (either lower case or upper case).
rdspec 6605 (e) division cannot make direct use of input item <innn>
At least one of the tables or vectors used in a division is an input item. Revise the specifications to first capture the input items as working tables or vectors and then refer to these working items in the division.
Parsons
F.2-12 Brinckerhoff
AR00064491

National Transit Institute Users' Guide for Program REPORT
rdspec 6606 (e) spec undefined: <inn>
A reference is made to the identified working table or vector, but that working table or vector has not previously been defined.
rdspec 6607 (e) uses divide result: <inn>
The identified reference is a working table or vector that divides one table or vector by another. A specification that divides tables or vectors cannot be used in later specifications.
rdspec 6608 (e) uses district info: <inn>
The identified reference is an internal working table or vector that applies at the district level; it cannot be used in a later specification. Specifications that make district-level calculations must be the final calculations in the sequence of working tables or vectors.
rdspec 6609 (e) term in field #s <m> to <n> has more than two references
The term defined in the identified fields has more than two references to tables or vectors. Revised the specification to comply with the syntax that permits each term to have up to one scalar and up to two references to tables or vectors.
rdspec 6610 (e) element in field # <n> is not interpretable
Program REPORT can not interpret the entry in the identified field. Correct the syntax.
2.7.8 SOFTWARE
The message from SOFTWARE indicates that the program is not able to interpret one or both of the software packages identified.
software 6603 (t) software not recognized: <software name>
Program REPORT does not recognize the value provided for SOFTTRAN or SOFTMAP in &PARAMS. Check the spelling and ensure that the current version of REPORT is compatible with the specified software.
2.7.9 WRTCTL
Messages from WRTCTL identify problems with the ability of Program REPORT to read successfully the settings for &FNAMES, &PARAMS, &TABLES, &VECTORS, &DDPRT, and &DRPT.
wrtctl 6601 (e) &<namelist> has error <ermum>
A basic syntax error has occurred in the identified namelist block. Check for misspelling of one or more of the variables, for character variables that are assigned integer or real values, for logical (true/false) variables that are assigned integer or real values, and for missing close-quotes on character strings.
wrtctl 6602 (e) spec for &ddrpt <n> has error <ermum>
A basic syntax error has occurred in the identified &DDPRT block. Check for misspelling of one or more of the variables, for character variables that are assigned integer or real values, for
Parsons
F.2-13 Brinckerhoff
AR00064492

National Transit Institute Users' Guide for Program REPORT
logical (true/false) variables that are assigned integer or real values, and for missing close-quotes on character strings.
wrtctl 6603 (e) spec for &drpt <n> has error <ermum>
A basic syntax error has occurred in the identified &DPRT block. Check for misspelling of one or more of the variables, for character variables that are assigned integer or real values, for logical (true/false) variables that are assigned integer or real values, and for missing close-quotes on character strings.
wrtctl 6699 (f) stopping with error(s): in &fnames,¶ms,&tables,&vectors,&qos: <n> in &ddrpt: <n> in &drpt: <n> in table specifications: <n> in vector specifications: <n> in control settings: <n> in file properties: <n>
total: <n>
The error scan has detected at least one error in the identified part of the control settings, as identified in an earlier detailed message. Application of Program REPORT terminates immediately after this message is written.
Parsons
F.2-14 Brinckerhoff
AR00064493

OMPO Model Development Project User's Guide to Model Application
G. Examples of Uses of the Models
Parsons
Examples of Uses of the Models Brinckerhoff
AR00064494

OMPO Model Development Project User's Guide to Model Application
1. Application Examples
1.1 Introduction
This chapter describes a few examples of applications of the model to address specific questions or support various analyses. These applications are among those presented in the training session presented to OMPO and State planning staff on December 4 and 5, 2003 in PB Honolulu offices.
The examples presented here include
Section 1.2: Selected Link Analysis
Section 1.3: Difference Plots
Section 1.4: Air Quality Analysis
Section 1.5: Time Contours
1.2 Selected link Analysis
It is often useful to identify trips that traverse a link or set of links in order to determine their influence on other parts of the network, and their relative magnitude in relation to other trips. For example, selecting a link on a proposed new roadway will tell the analyst something about the geographic market for this facility. A selected link analysis is used to identify such trips. The user must identify the link or links for which traffic will be tracked. During the assignment phase, the program can then keep track of all trips that traverse these links, including their origin and destination and, to some degree, their paths.
To implement a selected link assignment, the user must have the following:
• An unassigned network
• The trip table(s) providing the demand for the scenario and time period being tested
• A list of the desired selected links in terms of anode and bnode
A normal assignment is then run, using the standard MINUTP setup, with the addition of keywords and parameters that tell the program to track trips that traverse the selected links, and the specification of the selected link set itself. An example of a selected link script is shown below:
Parsons G.1-1 Examples of Uses of the Models Brinckerhoff
AR00064495

OMPO Model Development Project
User's Guide to Model Application
$ OMPO Model Development $ PM PEAK-Period (4 hr) Capacity Restrained ASSIGNMENT $ cvf990504 adapted from asamxxau.set
*pgm netmrg hnpmxxfs.%alt%,hntbcxxx.%alt% comp lane=lanep @ lane=0 lane=1
*pgm assign hnpmxxfs.%alt%„1,1000 *unit 11=..\tod\votboco1.%alt% vt by tod for occ1 *unit 12=..\tod\votboco2.%alt% vt by tod for occ2+ *unit 13=..\air\vottaaxx.%alt% vt by tod for air acc *unit 14=..\trk\totboax.%alt% vt by tod by trucks *unit 15=.Avis\vottysxx.%alt% vt by tod by visitors *unit 16=..\tod\votboco3.%alt% vt by tod for occ3+ *unit 21=hIpmxxxx.%alt% loaded network *id AM Peak Per As nmt (4 hr)
$ Parameters par pctadt=30
pct of trips that occur in capacity pd. par sInk=1
assign all trips par speed=0
use SPED values according to SPDC aqui to1=0.001
equilibrium assignment w/ tolerance factor thet 30*0
number of iterations
$ Trip tables and restrictions for assignment mati 104,105,204,205,303,403,503,604,605 trip tables to assign par flagyar=limitp specifies multi-user asnmt variable flagfac 1,0,P,P,P,P,0,P,P,P no limit 2345 789 for o1 flagfac 2,0,P,P,P,P,0,P,P,P no limit 2345 789 for o1 flagfac 3,0,0,P,P,P,0,P,P,P no limit 345 789 for o2 flagfac 4,0,0,P,P,P,0,P,P,P no limit 345 789 for o2 flagfac 5,0,0,P,P,P,0,P,P,P no limit 345 789 for air flagfac 6,0,P,P,P,P,P,P,P,P no limit 23456789 for trk flagfac 7,0,0,P,P,P,0,P,P,P no limit 345 789 for vis flagfac 8,0,0,0,P,P,0,P,P,P no limit 45 789 for o3 flagfac 9,0,0,0,P,P,0,P,P,P no limit 45 789 for o3
$ Turn penalties penf data\tppmxxau.%alt%,form=f
$ SPED & CAPA definitions *read .A.Ageneric\hwy\luxxxxau.def
$ VDF definitions *read .A.Ageneric\hwy\vdxxxxau.def
$ Select link analysis par subscale=100 par sink=2 sink sipmnu1 alnk 1,n=1,1705-1706
$ Output controls varo vol,vc,cspd
variables to be included in output net repo 1,2,4,6,20
Parsons
G.1-2 Examples of Uses of the Models Brinckerhoff
AR00064496

OMPO Model Development Project User's Guide to Model Application
Note the four statements near the end of the script:
par subscale=100 par sink=2 sink sipmnu1 alnk 1,n=1,1705-1706
The first statement identifies a multiplier which is applied to trips stored in the selected link trip table. Since fractions of trips are often involved, and MINUTP stores selected link trips as integers, this is helpful to maintain accuracy and prevent loss of trips in the resulting trip table.
The second statement tells the program that a selected link assignment is requested. A value of 0 may be used in all-or-nothing assignment to generate a network with selected link loadings assigned. Otherwise, a value of 2 must be used with multiple iterations to generate only a selected link trip table.
The third statement identifies the name of the selected link trip table, with an extension "Mii" where ii is the associated assignment iteration.
Finally, the alnk command is shown. This command specifies the selected link set. The 1 is the set identifier and should increase by one for each set of selected links. The n=1 parameter indicates that table 1 will be used in this case on the selected matrix output file. Finally the last set of numbers indicate the anode and bnode of the selected link. More than one link may be specified. The alnk keyword indicates that a trip must pass through all links identified to be selected. An alternative keyword, olnk, may be used to select a trip that passes through any of the links listed.
Though MINUTP does not allow direct link report of multiple-iteration selected link assignments, an approximation may be obtained through one of several techniques:
1. Assigning the trip table in an all-or nothing manner to a network with loaded speeds from an earlier, standard assignment with par sInk=0
2. Assigning just the selected link trip table to a network with loaded speeds in an all-or-nothing manner using a standard assignment. Further refinement may be made by selectively increasing impedance on links adjacent to the selected link to force trips through the selected link or set of links.
3. Simulate the equilibrium assignment with a series of all-or-nothing assignments that build upon each other. In each all-or-nothing assignment, run a selected link run with par sInk=0, and sum up the weighted assigned networks when complete.
Parsons G.1-3 Examples of Uses of the Models Brinckerhoff
AR00064497

OMPO Model Development Project User's Guide to Model Application
1.3 Difference Plots
Difference plots are very useful in comparing the effects added capacity, new connections or other localized network improvements or localized developments. It is not well suited to evaluate system-wide changes, such as transit fare changes or parking cost increases. The analysis simply subtracts the loaded volumes of one network from another. The resulting network shows where volume changes occur and their magnitude, since the resulting volumes are simply the difference (if any) between the two initial loadings. Typically, this is used to compare build and no-build conditions.
To generate a difference plot, the analyst will need to loaded networks. Make sure that the difference between these networks is well defined and not to extensive. These networks may be the result of two complete model runs, or simply the result of assigning the same demand to a base and slightly modified network. The latter will typically give "cleaner" results, since even with very similar networks, full model runs will generate some meaningless differences that are well removed from the associated network change.
A MINUTP script is shown below that will generate a difference plot from two loaded networks.
$ OMPO Model Development $ SAMPLE MINUTP SETUP -DIFFERENCE IN VOLUME $ AM Peak Period (2-hour) Volume difference
*PGM NETMRG HL1ADIFF.A00,HLA2OOOK.A00,HLA2XXXX.D00
titl 2 OMPO Regional Model Year 2000 Alt A - 2000 Base
comp altav=vol(1) comp basev=vol(2) comp vdiff=vol(1)-vol(2) if vdiff=0-1000000 comp vpdiff=vol(1)-vol(2)
else comp vndiff=vol(2)-vol(1)
endif
Note that positive and negative differences are stored in separate link attributes. This allows both to be represented as positive values, and allows more reasonable display of bandwidths through VIPER. Both bandwidths may be displayed simultaneously, since either vpdiff or vndiff will always be 0.
An example of difference plots may be seen in Chapter F, Sensitivity Testing of the Travel Models, in the Guide to Model Form.
Parsons G.1-4 Examples of Uses of the Models Brinckerhoff
AR00064498

OMPO Model Development Project User's Guide to Model Application
1.4 Air Quality Analysis
Regional air quality analyses are often required as a part of regional transportation plans and to demonstrate compliance with Federal and State environmental standards. Since vehicle volume and speed data are required to compute emissions loadings, travel demand models typically called upon to provide input to these analyses.
The basic inputs required by the MOBILE model are Vehicle-Miles of Travel (VMT) by type of vehicle and speed range. The OMPO model can be easily used to generate this data by summing up volume and speeds by link, and making assumptions regarding the vehicle mix by facility type. The only input necessary is an assigned network.
The MINUTP script below illustrates how the VMT may be summarized.
$ Honolulu Travel Demand Model Development $ Air Quality VMT
*pgm netmrg test.tmp,hltboom %aft% *id vmt by speed comp vmtam=dist*volam/100.0 comp vmtop=dist*volop/100.0 comp vmtpm=dist*vol pm/100.0 comp AM_SPEED=cspdam/10.0 comp OP_SPEED=cspdop/10.0 comp PM_SPEED=cspdpm/10.0 tab vmtam=02,AM_SPEED=0-80-5 tab vmtop=02,0P_SPEED=0-80-5 tab vmtpm=02,PM_SPEED=0-80-5
In the example shown above, the vmt is summarized by speed range in 5 mph increments. Optionally, a second stratification may be added to the "tab" statements that would include facility type, (FACTYPE attribute of the link). A portion of the output report is shown below:
The VMT by vehicle type may be generated by using pre-determined factors of auto and truck VMT by facility type, or by using only auto or truck assignments initially. Note that the speeds used in this analysis are based on the volume-delay functions of the model. More precise speed estimates are sometimes obtained by post-processing the assigned volumes and capacities to more accurately reflect queuing and other delays experienced at high congestion levels.
Parsons G.1-5 Examples of Uses of the Models Brinckerhoff
AR00064499

OMPO Model Development Project
User's Guide to Model Application
NETMRG 07-15-03 15:05 VMT BY SPEED Page 460
Tab AM_SPEED VMTAM
0-4 11,949 5-9 28,801 10-14 95,606 15-19 118,940 20-24 122,865 25-29 213,226 30-34 416,711 35-39 438,027 40-44 166,341 45-49 214,197 50-54 66,358 55-59 57,003 60-64 421,732 65-69 849,581
3,221,337 Tab OP_SPEED VMTOP
0-4 2,867 5-9 10,177 10-14 12,781 15-19 120,769 20-24 121,355 25-29 271,479 30-34 529,397 35-39 545,103 40-44 186,655 45-49 210,283 50-54 91,757 55-59 31,702 60-64 800,578 65-69 1,507,791
4,442,694 Tab PM_SPEED VMTPM
0-4 10,748 5-9 50,715 10-14 36,442 15-19 134,530 20-24 127,624 25-29 261,425 30-34 469,097 35-39 442,398 40-44 160,357 45-49 179,123 50-54 59,725 55-59 38,846 60-64 533,707 65-69 1,005,187
3,509,924
Parsons
G.1-6 Examples of Uses of the Models Brinckerhoff
AR00064500

OMPO Model Development Project User's Guide to Model Application
1.5 Travel Sheds
Travel sheds are depictions of accessibility from or to specific locations. They help display how accessible major attractors or producers may be, and can also be used to show how new transportation capacity might affect the accessibility of certain locations in the network. Travel contours show areas that are accessible within "bands" of travel time increments, such as 0-10 minutes, 10-20 minutes, 20-30 minutes, etc.
To generate travel time contours, load an assigned network into VIPER. The follow these steps:
1. Select "Path" from the top row menu
2. Select the "Build" option
3. Type in the desired impedance, using a link attribute name. For example, "ctim" is the loaded impedance, in hundredths of minutes. Optionally, you may also use a second attribute as an additional trace value that will be summed along with the primary impedance. Note that paths will be built only based on the primary impedance.
4. Press the "Done" button
5. In the Origin box, type a zone number of node number you wish to use as the accessible point from which the time contours will be built. You may also use the mouse to select this point from the network graphically.
6. In the destination box, type a range of zones and/or nodes that you wish to be included in the time contours. A good set is 1-762, which will include all network zones.
7. Check the "Isochrome" box to the left of the menu bar.
8. Fill in the "Increment" field (just below the lsochrome box) with the impedance increment you wish to use to display the time contours. Remember that this must be in the same units as your impedance, so if you used ctim, the congested time in hundredths, a value of 500 in this box would result in a map with 5 minute increments.
9. Press the "Display" button
The screen will then display the selected time contours (or isochromes) by coloring each link that is on a shortest path to the destination zone with a color depending upon the time band within which it is contained. Figure 1 below shows an example from zone 76 (identified by a triangle) to all zones with 5 minute increments.
Parsons G.1-7 Examples of Uses of the Models Brinckerhoff
AR00064501
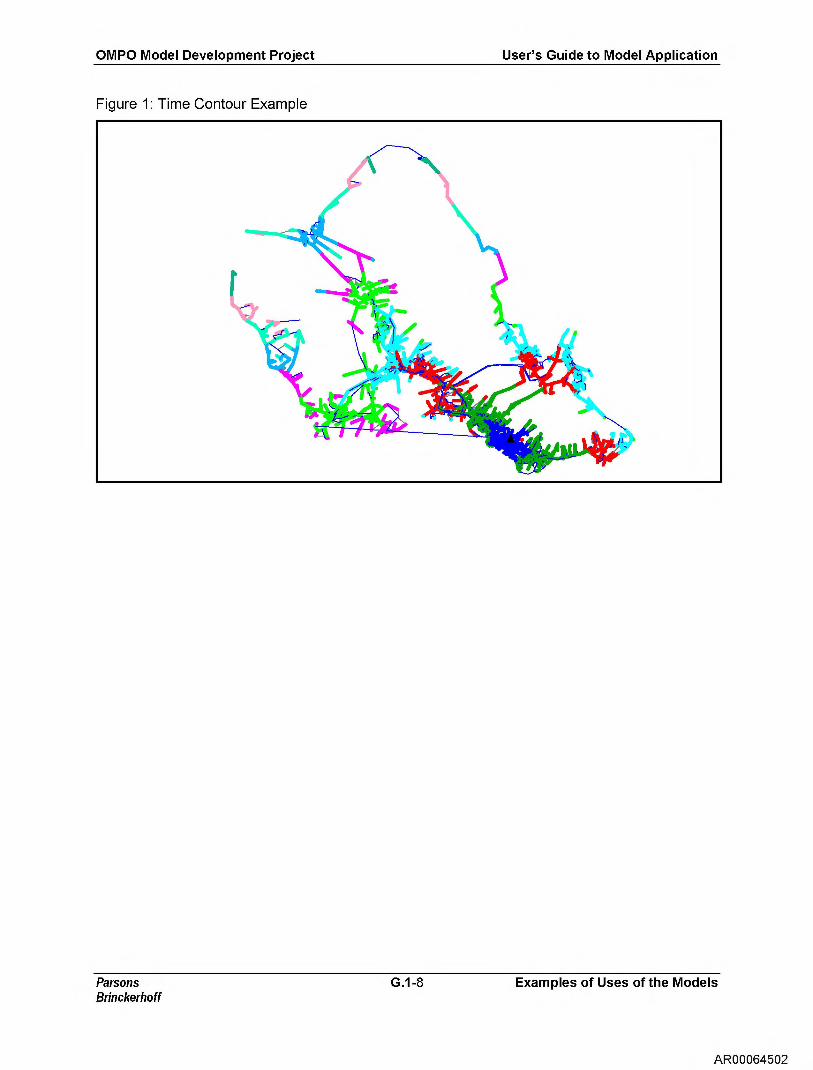
OMPO Model Development Project
User's Guide to Model Application
Figure 1: Time Contour Example
Parsons G.1-8 Examples of Uses of the Models Brinckerhoff
AR00064502