modeling and control of smart actuators: integrating nano
TRANSCRIPT

AC 2008-814: MODELING AND CONTROL OF SMART ACTUATORS:INTEGRATING NANO/BIO TECHNOLOGY INTO THE ME CURRICULUM
Ying Wu, Iowa State University
Stephanie Culter, Virginia Commonwealth University
Qingze Zou, Iowa State University
Gina Pannozzo, Virginia Commonwealth University
Kam Leang, Virginia Commonwealth University
Santosh Devasia, University of Washington
© American Society for Engineering Education, 2008
Page 13.900.1

Modeling and Control of Smart Actuators: Integrating
Nano/Bio Technology into the ME Curriculum
Abstract
A recent projection noted that over 7 million jobs will be created in the nano and bio-related field
world wide by 2015. The expected growth of such jobs suggests a critical need to prepare and
train the workforce for these emerging fields. This paper describes a collaborative approach
between three universities to integrate nano/bio technology into the mechanical engineering
(ME) undergraduate curriculum by incorporating teaching modules into core ME courses. The
teaching modules focus on the fundamental concepts in modeling and control of smart material
based actuators (or smart actuators), and they were designed for ME courses in system dynamics,
controls, and mechatronics. The piezoelectric actuator, a type of smart actuator, has become
increasingly important because of its ability for precision positioning (actuation) or sensing in
nano and bio-related technologies. The developed modules use the piezoactuator as an example
smart actuator. First, students are taught the fundamental concepts of modeling the input-to-
output behavior of piezoactuators. This component begins with a discussion of the piezoelectric
effect, followed by the modeling of the vibrational dynamics effects based on the frequency
response concept. Students are also introduced to hysteresis, a nonlinear behavior inherent in
piezoactuators and other smart actuators. Second, to complement the topics in modeling, lectures
were developed to convey the state-of-the-art in high-precision control of piezoactuators for
various nanopositioning applications, such as scanning probe microscopes. Four experiments
were designed to provide students with hands-on experience with modeling and control of
piezoactuators. The teaching materials were implemented at the three universities and
preliminary assessment results are presented to demonstrate the initial impact of the project.
Particularly, the results of the pre and post tests, surveys, and focus group studies in the context
of the expected learning outcomes are presented. In general, the results suggested that student
learning and perceptions were positively impacted by the developed teaching materials.
Introduction
Emerging nano and bio technologies1 has prompted the need to prepare the future work-force
with the knowledge, understanding, and skills necessary for tackling problems in these
professional fields. It is projected that by the year 2015 over 7 million jobs will be created in the
nano/bio-related field world wide2. Such growth of jobs and technologies will have a profound
impact on all sectors of the economy (as well as society)3. To prepare the future work force with
the necessary skill set, this paper focuses on a collaborative approach which involves three
universities to develop, integrate, and assess a teaching module on smart actuators for three
different courses in the ME undergraduate curriculum: system dynamics and controls,
mechatronics, and capstone design. The teaching module is specifically designed to address the
important aspects of modeling, control, and design of smart actuator-based systems. In particular,
the module consists of lecture and laboratory components, and each component can be easily
integrated into a course in part or whole.
Page 13.900.2

Smart actuators such as piezoelectric actuator (piezoactuator), shape memory alloy (SMA)
actuator, and magnetostrictive based devices are important because they are widely used in a
multitude of emerging nano and bio technologies. For example, piezoactuators are used in
atomic force microscopy (AFM) to image and manipulate samples at the nanoscale4 — AFM is
one of the most important instruments in nanotechnology; and SMA actuators are used in micro-
pumps5 and minimum invasive surgical tools in biomedical applications
6. Thus, smart actuators
are critical and their role in micro and nanoscale systems is as important as the electric motor is
for common macro-scale devices and systems such as home appliances and automobiles. But
contrast to the well-established coverage of electric motors in the ME curriculum, modeling and
control of smart actuators has not yet been systematically integrated into core ME courses. For
instance, electric motors are covered several ME texts7,8
and the subject is tightly woven into
core ME classes such as system dynamics and mechatronics. But the study of smart actuators in
core courses is currently few and far between. To take a lead in integrating the material into core
courses, and to expose students to the fundamentals and importance of smart actuators, we
exploit a collaboration between three universities to develop, integrate, and assess a teaching
module that focuses on the modeling, characterization, and control of smart actuators.
Developing a module was preferred over creating a new core course because modular teaching
material can be easily integrated into a core course and it easier to create than a new course. The
traditional mechanical engineering curriculum is often full and accommodating a new core
course requires approval at the department as well as the school and university level. Therefore,
developing a module was a more favorable solution to expose students to new concepts and
technologies. It can be argued that a technical elective course can be easily created; however
such courses impact a smaller number of students compared to core courses. By integrating a
module into an appropriate core course, a larger number of students are impacted and the module
can be easily tailored to meet the specific learning objectives of the course.
Mechanical engineering programs throughout the country have integrated nanotechnology
related topics into the undergraduate curriculum, for example, the “Nano-to-Macro Transport
Processes” course at MIT, the “Nanomanufacturing and MEMS Technology” (ME 528) course
at ISU, the “Micro/Nano Science and Engineering” (ME 495) course at Northwestern University,
and the “Micro/Nano-Robotics” (ME 24779-A) course at Carnegie Mellon University (CMU).
These courses address critical issues in nanotechnology-related fields, such as manufacturing,
design, and control. In contrast, the proposed module specifically addresses the fundamentals of
smart actuators, a topic that has not been considered.
The remainder of this paper is organized as follows. An overview is presented which briefly
describes the collaboration and the expected learning outcomes. Next, the components of the
piezoactuator module are presented in detail. Afterwards, the next section describes how the
teaching materials were implemented. Preliminary assessment results are also presented in the
same section. Finally, project challenges and concluding remarks are included at the end of the
article.
Page 13.900.3
Overview of the Module
The Collaboration
The components of the piezoactuator module was developed between Iowa State University
(ISU), Virginia Commonwealth University (VCU), and The University of Washington (UW).
The benefits of the collaboration include: (1) maximizing the number of students involved in the
project, (2) impacting a larger student population, (3) sharing of ideas to improve the quality of
the module, and (4) obtaining a larger data set for assessment. First, it was
decided that the module should focus on one type of smart actuator, the piezoactuator. The
piezoactuator was chosen because the collaborators had extensive experience with modeling
and control of piezoactuators in their own research9. Future work will focus on developing
modules for other smart actuators, such as shape memory alloys and electroactive polymers. The
three components of the module were divided and the collaborator at each university was
responsible for developing and integrating a component of the module at their location. After the
initial development and implementation, the teaching materials were then shared between the
collaborators and improved accordingly. This paper describes the results of the first development
and implementation phase.
The collaborator at UW led the development of the design component. This component focuses
on how design-related issues should be addressed and how best to involve students in design
projects with piezoactuators and various smart actuators. The modeling component was
developed and implemented at ISU. Finally, the control of piezoactuators component was
developed and implemented at VCU. The three collaborators shared information during the
development and assessment process. The results from all three schools were compiled and
analyzed by the collaborator at VCU and an expert from the Education Department at VCU. The
results were then communicated with the other two collaborators to further refine the
components for the next development and implementation phase.
The Expected Learning Outcomes
After being exposed to the piezoactuator module, students should be able to: (a) understand the
fundamental concepts of modeling and control of piezoactuators, (b) transfer the knowledge to
solve engineering problems at higher levels of abstraction, (c) recognize mechanical engineering
concepts in nano and bio technologies, and (d) perform experiments. The piezoactuator module
consists of three main components: modeling, control, and design. Each component consists of a
set of lectures and laboratory experiments, where the latter gives students hands-on experience
with piezoactuators, as well as teaches them commonly-used experimental techniques for system
identification.
The Piezoactuator Module
Characterization and Modeling
Piezoactuators are devices made from piezoelectric materials that respond by changing their
dimensions when voltage is applied. When the materials are stressed, they produce a measurable
Page 13.900.4

voltage. The former behavior is exploited to produce piezoactuators and the latter is used for
sensors. Students were taught the piezoelectric effect, a behavior that enables piezoelectric
materials to be used as actuators and sensors. In particular, this component teaches the modeling
of the input-to-output behavior of piezoactuators. The input is the applied voltage and the output
is the displacement of the actuator. The input-to-output behavior of a piezoactuator consists of
three effects: creep, hysteresis, and vibrational dynamics.
Lecture LM1: The Piezoelectric Effect and Constitutive Relationships
In this lecture, a PowerPoint presentation was present that showed examples to illustrate the
importance of piezoelectric materials in nano and bio technology. The examples included
scanning probe microscopes, micro-machining, and pressure sensors.
Following the brief PowerPoint presentation, the concept of the piezoelectric effect was
presented, where the quartz crystal model was used to describe the effect. This model was first
developed by Lord Kelvin in 189310,11
, and it is a simple 2D model based on the unique
characteristic of certain crystalline lattices that deform under pressure. As a result, the centers of
gravity of the positive and negative charges separate, creating a dipole moment (product of
charge value and their separation). The resulting dipole moment induces an electric charge that
can be measured across the surface of the material. This behavior explains the sensing ability of
piezoelectric material. Conversely, an applied voltage induces a mechanical strain in the
crystalline lattice10
. Figure 1 shows the 2D model which was presented in class, where (a)
represents the sensing and (b) represents the actuating ability the piezoelectric material. This
discussion was also linked to students’ background in physics and material engineering (e.g., the
concept of charged particles and the crystalline structure of materials such as ceramics12
).
Next, the linear constitutive relationship which describes the electromechanical properties of the
piezoelectric material was presented. We began with Hooke’s Law, which was familiar to
students, relates strain (h) to the compliance (c) and stress (j) for everyday metals and plastics,
that is,
h = c j. (1)
Because piezoelectric materials have electrical properties, we also explained the basic
constitutive equation for common dielectrics. The equation relates the electric displacement (D)
to the permittivity (g) and electric field (E),
D = gE. (2)
Then the two basic constitutive equations (1) and (2) were combined and the following
relationship was explained to students
,Edc T
E -? uf (3)
.EdD ugu -? (4)
Page 13.900.5

We emphasized that Eqs. (3) and (4) are in general matrix equations because of the anisotropic
nature of piezoelectric materials, and the subscript E indicates a zero, or constant, electric field;
the subscript j indicates a zero, or constant, stress field; the superscript T stands for transposition
of a matrix; and d is piezoelectric modulus, the ratio of strain to applied field or charge density to
applied mechanical stress. We also mentioned that in order to describe or model piezoelectric
materials, one must have knowledge about the material’s mechanical properties (compliance or
stiffness), its electrical properties (permittivity), and its piezoelectric coupling properties
(piezoelectric modulus). This first lecture was covered in a one-hour period.
+
-
-
+ +
-
+
-
-
+ +
-
+ + + + + + + + +
- - - - - - - - - - -
(a) (b)
+
-+
-
Piezo actuator
G(jω)Huv
y
(c)
Input OutputHysteresis
Creep &
Vibration
Mechanical-to-electrical
(Sensing ability)
Electrical-to-mechanical
(Actuating ability)
Figure 1: A two-dimensional model of a unit cell for a quartz crystal illustrating the
piezoelectric effect. The large solid circles in (a) and (b) represent positively charged ions and
the small solid circle represents their center of gravity. Likewise, large open circles represent
negatively charged ions, and their center of gravity is represented by the small open circle. (a)
Mechanical stress induces an electric dipole – separation of centers of gravity for positive and
negative ions and (b) applied field produces mechanical strain. (c) Block diagram model of
hysteresis, creep, and vibrational dynamics.
Lecture LM2: Physics-Based Modeling of Creep and Vibrational Dynamics
When an input voltage is applied to a piezoactuator, the actuator’s output displacement exhibits
the combined effects of hysteresis, creep, and vibration13
. These three effects are coupled and the
degree by which they appear in the output response depends on the input frequency and output
range. This is an importance concept when designing with piezo-based devices. The approach to
modeling the three effects was to decoupled them into two main components: a hysteresis
element (input nonlinearity) cascaded with a linear dynamics element that captures the creep and
vibration effects. The block diagram of the decoupled model presented in class is shown in Fig.
1(c).
Hysteresis is significant when the range of motion of a piezoactuator is large. At high operating
speeds, the effect of the vibrational dynamics becomes noticeable. On the other hand, when a
piezoactuator operates over long periods of time, then creep is significant. Several combinations
Page 13.900.6

of these behaviors are depicted in Fig. 2. Students were first taught how to model the creep and
vibrational dynamics using linear models13
.
Gv(jω)
Piezo actuator:
[u]
Hysteresis Vibrational
dynamics
Large-range, High-speed motion
Gc(jω)[u]
Hysteresis Creep
dynamics
Large-range, Slow-speed motion
Gv(jω)Vibrationaldynamics
Small-range motion
Gc(jω)Creep
dynamics
(low-speed) (high-speed)
(a) (b) (c)
Piezo actuator: Piezo actuator:
u(t) y(t)v(t) y(t)u(t) v(t)v(t) y(t)
Figure 2. The cascade model for creep Gc(jの), hysteresis H[u(jの)], and the vibrational dynamics
Gv(jの) effects in piezoactuators: (a) the large-range, high-speed motion; (b) the large-range, low-
speed motion; and the small-range motion.
It has been shown that the creep and vibrational dynamics effects can be modeled by using mass,
spring, and damper elements. This approach to modeling goes hand-in-hand with key concepts in
modeling of mechanical systems in the ME undergraduate curriculum. Likewise, this concept
aligns with the topic of vibration modes of mechanical systems14
. The transfer function model
for creep in terms of the spring and damper elements is13,15
,11
)(
)()(
10
Â? -
-??N
i ii
creepkscksv
sysG (5)
where ki and ci are the spring and damper constants, respectively [see Fig. 3(a)]. Similarly, a
simplified model of the vibrational dynamics can be obtained by performing a force balance on
the spring-mass-damper system shown in Fig. 3(b). The transfer function model is,
./)/(
/
2)(
)()(
222
2
mksmcs
m
ssA
sv
sysG
nn
n
vibration --?
--??
cyzy
y (6)
Piezoelectric
Force, ,
y (+)
F P
k1 k2
c 1 c 2
k0v
kn
c n
Creep Model
Kelvin-Voigt elements
Elastic
deflection
(a)
k
c
(b)
m
Input
voltage
Output
displ.
y (+)
proportional to voltage
Figure 3. Modeling the dynamic behavior of a piezoactuator: (a) creep model and (b) a one-
dimensional vibrational dynamics model.
Page 13.900.7

Both models were derived in lecture. Using these models, students were asked to simulate the
creep and dynamics behavior in Matlab in a homework assignment. They were asked to
investigate the piezo's response to slow time-varying signals (creep behavior) as well as rapid
signals like a step, ramp, and triangle input. By doing the homework exercise, they were able to
identify the slow drift effect caused by creep and the oscillations in the output due to the
dynamics at high frequency.
Lecture LM3: Hysteresis Behavior
Hysteresis is believed to be attributed to the energy loss caused by micro-scale domain wall
interactions [16], and this concept was explained to students. Hysteresis was also compared to
plastic deformation in materials12
. Then the properties of hysteresis such as the local memory
property, rate-independence, and range-dependence17
were discussed. Additionally, students also
learned various methods to quantify and characterize the hysteresis behavior and several
examples were given in class. Students were informed that hysteresis effect is significant when
piezoactuators displace over relatively large range18, 19
, causing large positioning errors in
applications such as AFM20, 21
.
Experiment EM1: Modeling Linear Vibrational Dynamics using Frequency Response
This experiment provides students with first-hand experience in observing, measuring, and
experimentally determining a dynamics model for the piezoactuator. The experiment was
implemented in a standard 3-hour lab period; likewise, each experiment described below was
implemented in a 3-hour lab period.
An experimental system was designed for the laboratory activities and two examples are shown
in Fig. 4. Both experiments consist of a bimorph piezoactuator, an inductive displacement
sensor, a low-cost infrared sensor, a high-voltage amplifier (not shown) to drive the
piezoactuator, and a PC with a data acquisition card (not shown).
In this experiment, students modeled the linear vibrational dynamics using the swept-sine
method, where the “industry-standard” Matlab software and a data acquisition card were used.
First, students were asked to build a Simulink block diagram to implement the swept-sine
method by using the Matlab command ‘chirp’. The command generates an appropriate input
signal. Figure 5 shows one example of the Matlab Simulink model used for collecting data (with
the DAQ card). Other types of DAQ systems can be implemented in a similar manner. Then,
students were asked to apply the chirp input signal, followed by measuring the output response
of the piezobimorph actuator. An example of the graphical user interface using dSPACE
software is shown in Fig. 6. Next, students were asked to build a Matlab program (M-code) to
process the measured input-output data to create the frequency response. The frequency response
curves were then curve-fitted to obtain the transfer function model (6). An example frequency
response and a transfer function model obtained by students are compared in Fig. 8. Finally, the
step response was measured and recorded for post-processing and analysis. To further instill the
modeling concept, post-lab work was given where students were asked to compare the transfer
function model to the measured step response. An example Matlab program for this step is
shown in Fig. 7.
Page 13.900.8

Sensor and power
connections
Piezo
bimorph
actuator
IR proximity sensor
Inductive
sensor
High-voltage
connectorRapid-prototyped
platform
x
Inductive sensor
Infrared sensor
Bimorph piezo actuator
Fixture
x
y
z
(b)(a)
Figure 4. Photographs of two modular piezoactuator experiments for laboratory activities. (a)
The parts for this experimental platform were machined from Delrin plastic and aluminum. (b)
The piezobimorph fixture was made using a rapid prototyping machine.
2
Out2
1
Out1
Sens or
To Workspac e
Sens or Sc ope
RT I Data
0. 1
Gain 2
1
Gain 1
10
Gain
DAC
DS1104DAC_C 1
AD C
DS1104ADC_C5
Chir p S ignal
Ac tuator Sc ope
Figure 5. The Matlab-Simulink block diagram for measuring the frequency response of the
piezobimorph actuator.
Page 13.900.9

Figure 6. The graphical user interface of dSPACE for data acquisition.
Experiment EM2: Modeling Linear Vibrational Dynamics using Transient Response
An alternative method to determine the numerical coefficients for the creep and vibrational
dynamics model is to estimate them from the measured step response22
. In this experiment,
students were asked to measure the step response of the piezoactuator over two regimes: (1) over
a long period of time (approximately 10 minutes) and (2) less than 500 ms. The coefficients for
the creep model (5) were determined by curve fitting an exponential function to the transient
response over the 10-minute period. The coefficients of the vibrational dynamics model (6) were
found by estimating the percent overshoot, 2% settling time, rise time, and log-decrement value,
then using these values to determine the damping ratio こ and natural frequency のn for the
standard second-order model22
.
Experiment EM3: Measuring, Quantifying, and Modeling Hysteresis
This experiment was designed to give students hands-on experience with measuring, quantifying,
and modeling hysteresis in piezoactuators. Students were asked to build a Simulink diagram
similar to the example shown in Fig. 5. The Simulink module was used to measure the input and
output response of the experimental piezoactuator. The procedure asked students to apply a
Page 13.900.10

triangle signal with different amplitudes to actuate the piezoactuator. Afterwards, they were
asked to plot the measured output with respect to the applied input signal. The input versus
output plots revealed hysteresis curves. From the curves, they were asked to quantify the amount
of output hysteresis by simply calculating the difference between the measured output between
the ascending and descending hysteresis curve. The calculated value was then compared to the
range of the actuator, and typically the maximum measured hysteresis in the output varies
between 10 and 20% of the range. Finally, students were asked to construct two simple models
for hysteresis: a polynomial model (e.g., quadratic model) which related the input to the output
signal; and a look-up-table model. These models can then be used to compensate for hysteresis
behavior19, 23, 24
.
% Step 1: Load in the measurement data;
a=load(’wholespectrum’);
wholespectrum=a.wholespectrum ;
output1=wholespectrum.Y(1).Data;
input1=wholespectrum.Y(2).Data;
% Step 2. Use the MATLABsystem identification
% toolbox to obtain the frequency response data;
zsw1 = iddata ( output1’, input1’, 0.0001 );
zswd1 = detrend ( zsw1 );
%specify the frequency range
f_range = ( 1 : 600 ) . * 2 * pi;
zf_sw1 = spafdr ( zswd1, [], f_range );
rd ( : , : ) = zf_sw1 ( 1 , 1 , : ).ResponseData;
fre q = zf_sw1 ( 1 , 1 , : ).Frequency;
New_rd = interp1 ( freq, rd, f_range, ’linear’ );
% Step 3. Use curve fitting method to obtain
% the transfer function model;
[ num, den ] = invfreqs ( New_rd, f_range,5,7);
My_TF = tf ( num, den );
% Obtain the simulated frequency response of the model;
My_FreqResp = freq s ( num, den, f_range );
Figure 7. An example of the main portion of the Matlab code for obtaining the transfer function
model of the piezobimorph actuator.
Page 13.900.11

Figure 8. The experimentally measured frequency response (‘experimental’) compared with the
model response (‘fitted’), obtained by the students.
Control of Piezoactuators
The application of piezoactuators requires the design of controllers that can account for
hysteresis, creep, and vibration behavior. Feedback control, for example proportional-integral-
derivative (PID), is standard in industry for controlling a multitude of dynamic systems such as
robots, machining tools, and piezopositioners used in scanning probe microscopes. A set of
lectures and laboratory experiments were developed to teach the fundamentals of feedback
control, as well as introduce the concept of model-based feedforward control22
. These
instructional materials provided students with the theoretical foundation as well as hands-on
skills for designing controllers for piezoactuators.
Lecture LC1: Notch Filter Design
It has been recently shown that a challenge with applying feedback control to piezoactuators is
the issue of low-gain margin inherent in these systems25
. This is primarily due to low structural
damping and the effects of additional dynamics. To address this issue, a lecture was developed to
describe a simple method where a notch filter is added to improve the gain margin of a
piezoactuator. The notch filter simply includes two zeros which cancels the effect of the two
resonant modes of the system model Eq.(6). The notch filter is
Page 13.900.12

,))((
))(()(
21
21
psps
zszsksD D //
//? (7)
where kD is the filter gain and the zeros and poles are given by zi and pi. The pair of poles at p1
and p2 is used to make D(s) proper, and they help attenuate high frequency noise. To illustrate
gain margin improvement, an example Matlab program was presented which compares the gain
margin of the original open-loop system with the notch filter and the open-loop system using the
function ‘margin’. The improvement is typically over 20 dB. The notch filter can be made using
analog op-amp circuits26
and an example circuit was presented in the lecture. Students were also
reminded the connection between the gain margin and the closed-loop stability, key concepts in
feedback control design.
Lecture LC2: Feedback Control
This lecture focused on designing traditional feedback controllers such as a proportional-integral
(PI), proportional-derivative (PD), lead-lag, and PID for piezoactuators. For the PI, PD, and PID
discussion, the following controller transfer function was described
,)(
)()(
s
kskk
se
susC i
dp --?? (8)
where the proportional, derivative, and integral gains are kp, kd, and ki, respectively. For each
controller, a Matlab simulation example was shown in class (see Fig. 9), and students were
reminded that PI control is typically used to achieve zero steady-state error; PD control dampens
the output response; and PID combines the benefits of both methods.
2
Out21
Out1
Scope
RT I Data
Puls eGenerator
num(s )
s+.5
PI Contro l
num(s )
den(s)
Notch F ilter
butter
Low-pas s F ilter
0
Gain 2
10
Gain 1
.1
Gain
tri_wave_20
FromWorkspace1
DA C
DS1104DAC_C 2
DA C
DS1104DAC_C 1
AD C
DS1104ADC_C5
Figure 9. A Matlab-Simulink diagram of the feedback control for the piezobimorph actuator
using a notch filter and a PI controller.
Experiment EC1: Feedback Controller Design
This experiment follows the modeling Experiments EM1 and EM2, where students use the
vibrational dynamics model obtain from those experiments to design a feedback controller. To
enable the use of feedback control, they were first asked to design the notch filter D(s) discussed
above. The design involved tuning the parameters of the notch filter using Matlab and comparing
Page 13.900.13

the gain margin before and after by analyzing the measured frequency response. Finally, they
were given the task of designing a feedback controller of their choice to improve the transient
and steady-state response of the piezoactuator. The design objective was to reduce the settling
time by at least 70% and to minimize the steady-state error due to a step input. One example step
response obtained by the students is shown in Fig.10, and it compares the uncompensated result
with the controller response. Students were also asked to evaluate their design by observing and
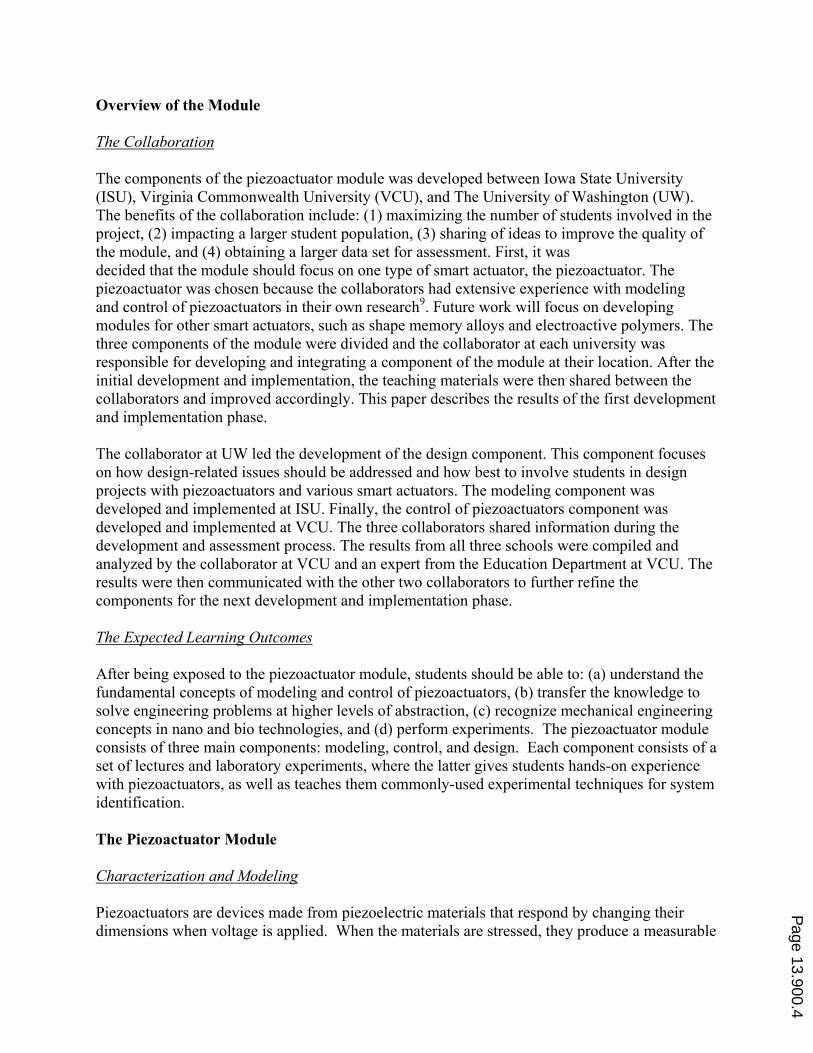
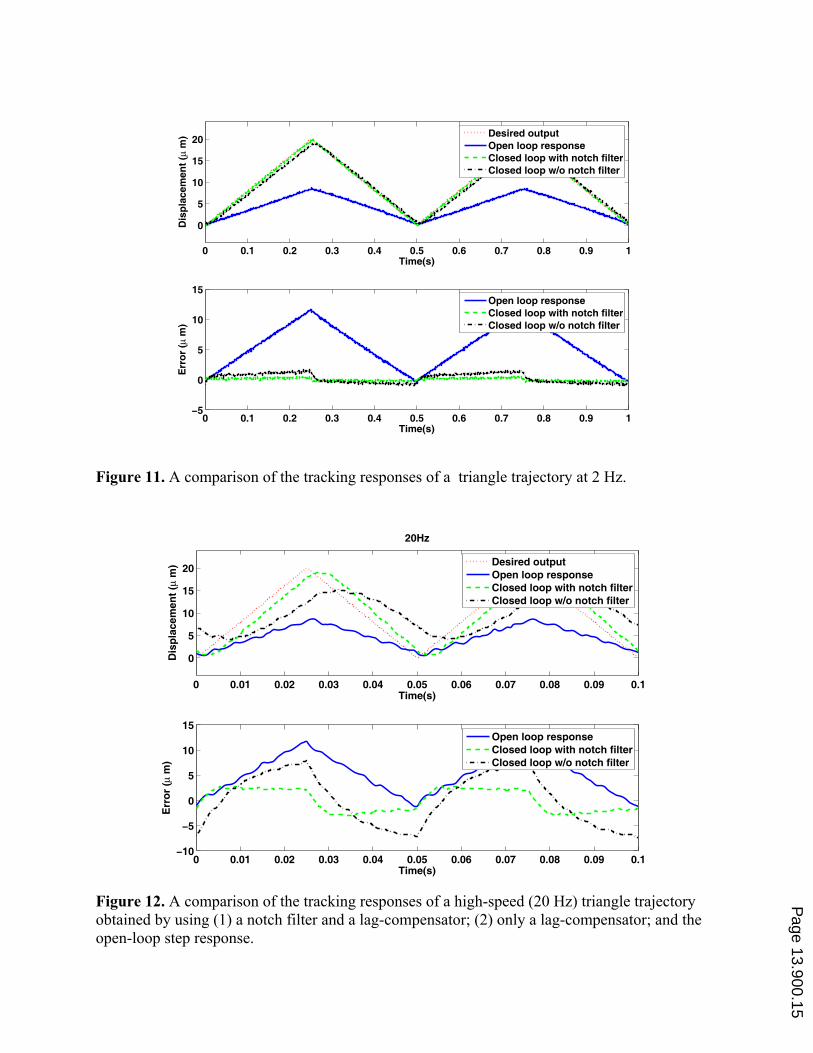
measuring the performance of tracking a triangle trajectory at both low-speed (2 Hz) and high
speed (20 Hz). An example result is illustrated in Figs.11 and 12 (for 2 Hz and 20 Hz tracking,
respectively). The comparison allows students to see the limitations of the feedback controller
when the scanning speed increases.
0 0.05 0.1 0.15 0.2 0.25 0.3 0.35 0.40
5
10
15
20
25
30
Time(s)
Dis
pla
ce
me
nt
(µ m
)
Step Input
Open loop response
Closed loop with notch filter
Closed loop w/o notch filter
Figure 10. Example results for the feedback control experiment. The plot compares the step
responses of the open-loop and closed-loop system.
Page 13.900.14
0 0.1 0.2 0.3 0.4 0.5 0.6 0.7 0.8 0.9 1
0
5
10
15
20
Time(s)
Dis
pla
cem
en
t (o
m)
0 0.1 0.2 0.3 0.4 0.5 0.6 0.7 0.8 0.9 1タ5
0
5
10
15
Time(s)
Err
or
(o m
)
Desired output
Open loop response
Closed loop with notch filter
Closed loop w/o notch filter
Open loop response
Closed loop with notch filter
Closed loop w/o notch filter
Figure 11. A comparison of the tracking responses of a triangle trajectory at 2 Hz.
0 0.01 0.02 0.03 0.04 0.05 0.06 0.07 0.08 0.09 0.1
0
5
10
15
20
Time(s)
Dis
pla
cem
en
t (o
m)
20Hz
0 0.01 0.02 0.03 0.04 0.05 0.06 0.07 0.08 0.09 0.1タ10
タ5
0
5
10
15
Time(s)
Err
or
(o m
)
Desired output
Open loop response
Closed loop with notch filter
Closed loop w/o notch filter
Open loop response
Closed loop with notch filter
Closed loop w/o notch filter
Figure 12. A comparison of the tracking responses of a high-speed (20 Hz) triangle trajectory
obtained by using (1) a notch filter and a lag-compensator; (2) only a lag-compensator; and the
open-loop step response.
Page 13.900.15
Experiment EC2: Hysteresis Control using Look-Up-Table Model
This experiment uses the hysteresis model obtained from Experiment EM3 above to compensate
for hysteresis behavior. To do this, the input versus output measurements were inverted such
that for a given desired output value, a corresponding input value was found by using a look-up-
table with the input versus output data and interpolation. This input was then applied to the
piezoactuator, and the resulting output is the desired output value. This is a simple example of
model-based feedforward control to address hysteresis-caused positioning error in
piezoactuators.
Module Implementation
The lecture and laboratory materials described above were developed at ISU and VCU. Recently,
a pilot-implementation was done using the developed materials in three courses related to
dynamics and control at these two schools. The courses included the junior-level Process and
System Dynamics course (PSD), the senior-level Mechatronics course, and the senior-level
Automatic Control course.
At VCU, the Process and System Dynamics course contained 66 students and the Mechatronics
course contained 79. The PSD course focused on modeling and analysis of dynamic systems
with no laboratory component. In PSD, Lectures LM1, LM2, and LM3 were delivered shortly
after the treatment of mechanical and electrical systems modeling. A group project on modeling
the experimental piezobimorph experiment was assigned in that same class to give students
hands-on experience with modeling the piezoactuator. In the Mechatronics course, Lectures LC1
and LC2 were implemented during the semester the course was taught. This course consisted of
a weekly lab where students spent 3 hours per week working on lab experiments. In
Mechatronics, Experiments EM1 and EM2 were incorporated into the twelfth-week of
instruction, shortly after the lectures on piezoactuators were presented.
At ISU, the materials were tested in the technical-elective automatic control course containing 9
students. (This course usually contains 10 to 20 students). The course focused on classical
control theory. The laboratory components are a crucial part of the course. Students were
grouped pairs and they worked on 6 experiments throughout the semester, and each experiment
ran two weeks with two hours laboratory time per week. The experiments covered dynamics
modeling, notch-filter design and implementation, and classical lead-lag, PID controller design
and implementation, as described above. The experiments were synchronized with the lecture
discussions to strengthen students' understanding and ability to link theory with real-world
application. Lecture materials LM2, LC1, and LC2, and experiment materials EM1, EM2, and
EC1 were incorporated into this course.
The design component was implemented at UW in a senior capstone design course, where
several student-design teams used piezoactuators, as well as shape memory alloy actuators
(SMA), in their design project. For example, one team designed an SMA-based robot and other
group focused on designing a piezo-based nano positioning system.
Page 13.900.16
Preliminary Assessment Results
Both formative and summative assessments were implemented as a means of gauging student
response to the instructional modules and in order to provide information to course instructors to
guide modifications of the modules. Questionnaires were administered to students at the three
schools on four separate occasions across the semester – beginning of the semester, immediately
prior to the implementation of the teaching module, immediately following the end of the
instructional module, and at the end of the semester. The questionnaires asked students about
general content knowledge, as well as their perceptions about the importance and usefulness of
nano and bio technologies involving smart actuators. In addition, students’ homework, project
and exam scores were recorded as summative data to investigate the impact of the modules on
student learning/achievement. Finally, focus groups were conducted with students at VCU in
order to gain additional insight and feedback regarding students’ perceptions of the instructional
modules. All assessment procedures followed IRB protocol to ensure participant anonymity and
confidentiality.
Preliminary results from pre-post module questionnaires and focus groups at VCU are reported.
In total, 51 students completed pre-module questionnaires, while 22 students completed post-
module questionnaires.
First, students were asked to rate their general level of excitement about nanotechnology-related
fields on a scale of 1 to 10 with 10 being the most excited. Figure 13 shows a comparison of
students’ responses prior to and after the modeling and laboratory components were
implemented. Overall, students were moderately excited about nanotechnology at both pre-test
(Mean = 6.31, STD = 2.47) and post-test (Mean = 6.18; STD = 2.36). Interestingly, both pre-and
post-questionnaire responses show multi-modal distributions, suggesting there may be separate
sub-groups of students with lower and higher levels of excitement. While there were no
substantial changes in students’ level of excitement after being exposed to the instructional
materials, this may be due to the fact that far fewer students completed the post-survey; and there
was no way to link individual students’ pre- and post-questionnaire responses. Future analyses
will include greater examination of what may influence students’ level of excitement because
pre-and post-questionnaire responses will be linked with homework, project, and exam scores
which will allow for direct comparisons across the semester.
On the post-module questionnaire, students were asked to rate how important they believed
piezoactuators to be in nano and bio technology on a scale of 1 to 10, with 10 being extremely
important. The majority of students (81.9%) rated this item at 7 or higher with a mean of 8.18
and a STD of 1.68, identifying that they felt that piezoactuators were very important (Fig. 14a).
When students were asked to rank their understanding of piezoactuators on a scale of 1 to 10, the
graph in Fig. 14(b) shows a degree of variability in students’ responses, again with somewhat
distinct groups of students who rated their understanding as “low” or “moderate” (mean = 4.23;
STD = 2.65). However, it is interesting to note that approximately 27.0% of students indicated
they believed they had a moderately high (7 or 8 out of 10) understanding. Given that this
question was not asked at pre-test, at this time it is impossible to evaluate if the module had a
direct impact on students' responses to this particular item. The broad variability in students’
responses might be related to the fact that this was many students' initial exposure to the
Page 13.900.17
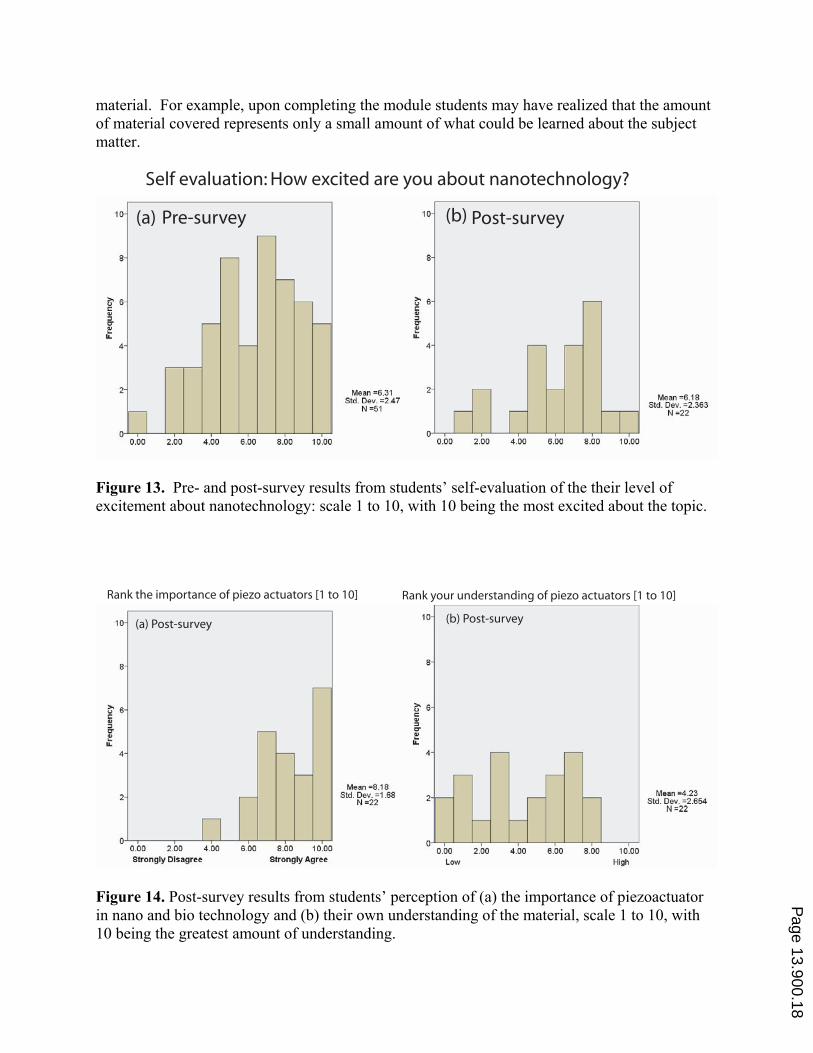
material. For example, upon completing the module students may have realized that the amount
of material covered represents only a small amount of what could be learned about the subject
matter.
Self evaluation: How excited are you about nanotechnology?
(a) (b) Pre-survey Post-survey
Figure 13. Pre- and post-survey results from students’ self-evaluation of the their level of
excitement about nanotechnology: scale 1 to 10, with 10 being the most excited about the topic.
(a) Post-survey
Rank the importance of piezo actuators [1 to 10] Rank your understanding of piezo actuators [1 to 10]
(b) Post-survey
Figure 14. Post-survey results from students’ perception of (a) the importance of piezoactuator
in nano and bio technology and (b) their own understanding of the material, scale 1 to 10, with
10 being the greatest amount of understanding.
Page 13.900.18

Finally, students were asked four specific questions to gauge their understanding of basic content
related to nanotechnology and piezoactuators at both pre- and post-test. Figure 15 shows a
comparison of students’ responses with regard to their understanding of: nanotechnology, the
piezoelectric effect, piezoactuators, and applications in nano/bio technology that use
piezoactuators. Interestingly, the majority of students were able to describe nanotechnology
regardless of being exposed to the teaching components that provided various examples of nano-
and bio-related applications. On average, students earned scores of 4.27 (pre-survey) and 4.30
(post-survey) out of 5.0 possible points for this item. For each of the other three items, the
average score for students who completed the post-survey was higher than the average score for
students who completed the pre-survey. In general, students scores were approximately 0.25 to
0.64 points higher (based on a scale of 0 to 5 points). Students who completed the post-survey
demonstrated somewhat greater understanding than students who completed the pre-survey of
the piezoelectric effect (post-mean = 3.68, pre-mean = 3.04) and the importance of
piezoactuators (post-mean = 3.14, pre-mean = 2.53).
0 5
Pre-survey
Post-survey
4.30 (1.22)
4.27 (1.08)
3.04 (1.66)
3.68 (1.73)
2.53 (1.67)
3.14 (1.70)
1.76 (1.92)
2.10 (2.18)
Pre-survey
Post-survey
Pre
Post
Pre
Post
Enrollment: 76; N = 51 (pre); N=22 (post)
a) What is nanotechnology?
b) What is the piezoelectric effect?
c) What is a piezo actuator
and why is it important?
d) Identify nano/bio
applications using piezos
Figure 15. Pre- and post-survey results and comparisons.
In general, preliminary results suggest that student learning and perceptions were positively
impacted by the developed lecture and laboratory components. However, these results need to
be interpreted cautiously as we have not assessed change in understanding at this time, but
expect to do so with additional data currently being collected.
At VCU a total of six students participated in voluntary focus groups and provided additional
information regarding their perceptions of the lecture and laboratory components that were
developed. Overall, with the exception of one student, most students expressed that this was
their first formal experience with this material; and that prior to this they had encountered topics
related to nano and bio technologies primarily through their own independent reading or
investigation. Students echoed students' responses on the questionnaires, commenting that they
Page 13.900.19

found the material “very interesting” and were “excited” to learn more and broaden their
understanding of applications related to piezoactuators. In terms of the lecture and laboratory
materials themselves, students suggested that having the opportunity to "spend more time" and
get “more information” in “greater depth” would be extremely useful. Participants indicated that
having additional opportunities to “play with the technology,” and “have visuals to see how it
works” in combination with substantive feedback on their assignments would greatly enhance
their learning. Students also expressed an interest in being provided with additional information
regarding the materials themselves, what they cost, where they can be purchased or accessed.
Finally, students suggested that given how new and rapidly expanding this area is both in terms
of application and research, providing an introduction earlier in the program would increase
student interest, as would advanced topics seminars devoted to this material.
Benefits and Challenges
One of the benefits of this project is the collaboration which enabled the sharing of ideas on how
to best develop the module, its contents and how to implement them. Additionally, it allowed
the distribution of work, and in the end a library of teaching materials was created with
teamwork. Some challenges include finding ways to streamline the content so that it can be
easily integrated into a course without it affecting other material that needs to be taught. The
other challenge is the training of laboratory TAs to be proficient in conducting the lab. This
process requires time and patient mentoring by the faculty member. Additionally, because the
laboratory experiments were custom-made for this project, one foreseeable challenge is creating
enough experimental systems at the reasonable cost to support a larger student population and for
sustainability.
Conclusions
This paper focused on the development and implementation of a teaching module on modeling
and control of piezoactuator. Collaborators from three universities came together to create
lecture and laboratory components. The developed teaching materials were recently
implemented and preliminary survey results were presented. In general, the results suggested
that student learning and perceptions were positively impacted by the developed teaching
materials.
Acknowledgement
Authors gratefully acknowledge the support of National Science Foundation DUE Grant
#0633098.
Page 13.900.20

Bibliography
1. National Nantotechnology Initiative. Investment mode 2: NNI grand challenge areas.
Technical report, 2004.
2. M. C. Roco and W. S. Bainbridge. Societal implications of nanoscience and nanotechnology.
Technical report, National Science Foundation, 2001.
3. M. C. Roco. Broader societal issues of nanotechnology. J. Nanoparticle Res., 5:181–189,
2003.
4. R. Wiesendanger. Scanning probe microscopy and spectroscopy. Cambridge University
Press, Cambridge, 1994.
5. J.-H. Park, K. Yoshida, and S. Yokota. A piezoelectric micropump using resonance drive:
proposal of resonance drive and basic experiments on pump characteristics. In Proc. of the
1997 ASME Inter. Mech. Eng. Congress and Exposition: The Fluid Power and Systems
Technology Division, volume 4, pages 77–82, Dallas, TX, 1997.
6. J. M. Stevens and G. D. Buckner. Actuation and control strategies for miniature robotic
surgical systems. ASME Journal of Dynamic Systems, Measurement, and Control, 127:537 –
549, 2005.
7. W. J. Palm. System dynamics. McGraw Hill, Boston, 2005.
8. D. G. Alciatore and M. B. Histand. Introduction to mechatronics and measurement systems.
McGraw Hill, Boston, 2nd edition, 2003.
9. Q. Zou, K. K. Leang, E. Sadoun, M. J. Reed, and S. Devasia. Control issues in high-speed
AFM for biological applications: collagen imaging example. Asian Journal of Control,
6(2):164–178, 2004.
10. W. P. Mason. Quartz crystals for electrical circuits. pages 11–56, New York, 1946. D. Van
Nostrand Co., Inc.
11. A. Ballato. Piezoelectricity: history and new thrusts. In IEEE Ultrasonics Symposium, pages
575–583, 1996.
12. W. D. Callister. Materials science and engineering: an introduction. John Wiley and Sons,
Inc., New York, 1994.
13. D. Croft, G. Shed, and S. Devasia. Creep, hysteresis, and vibration compensation for
piezoactuators: atomic force microscopy application. ASME J. Dyn. Syst., Meas., and
Control, 123:35–43, 2001.
14. K. Ogata. System dynamics. Prentice Hall, fourth edition, 2004.
15. L. E. Malvern. Introduction to the mechanics of a continuous medium. Prentice-Hall,
Englewood Cliffs, NJ, 1969.
16. D. C. Jiles and D. L. Atherton. Theory of ferromagnetic hysteresis. J. Magnetism and
Magnetic Materials, 61:48–60, 1986.
17. I. D. Mayergoyz. Mathematical models of hysteresis. Springer-Verlag, New York, 1991.
18. R. C. Smith, S. Seelecke, M. Dapino, and Z. Ounaies. A unified framework for modeling
hysteresis in ferroic materials. Journal of the Mechanics and Physics of Solids, 54:46 – 85,
2006.
19. P. Ge and M. Jouaneh. Tracking control of a piezoceramic actuator. IEEE Trans. Contr. Syst.
Tech., 4(3):209–216, 1996.
20. K. K. Leang and S. Devasia. Design of hysteresis-compensating iterative learning control for
piezo positioners: application to atomic force microscopes. Mechatronics, 6(3-4):141 – 158,
2006.
Page 13.900.21

21. R. C. Barrett and C. F. Quate. Optical scan-correction system applied to atomic force
microscopy. Rev. Sci. Instr., 62(6):1393–1399, 1991.
22. G. F. Franklin, J. D. Powell, and A. Emani-Naeini. Feedback control of dynamic systems. 5th
edition, 2006.
23. J. F. Jorgensen, K. Carneiro, L. L. Madsen, and K. Conradsen. Hysteresis correction of
scanning tunneling microscope images. J. Vac. Sci. Technol. B, 12(3):1702–1704, 1994.
24. K. Dirscherl, J. Garnaes, L. Nielsen, J. F. Jogensen, and M. P. Sorensen. Modeling the
hysteresis of a scanning probe microscope. J. Vac. Sci. Technol. B, 18(2):621–625, 2000.
25. K. K. Leang and S. Devasia. Feedback-linearized inverse feedforward for creep, hysteresis,
and vibration compensation in AFM piezoactuators. IEEE Trans. Contr. Syst. Tech., 5(5):927
– 935, 2007.
26. H. Y-F. Lam. Analog and digital filters: design and realization. Prentice-Hall, New York,
1979.
Page 13.900.22