modeling and prediction of surgical procedure times modeling and prediction of surgical procedure...
TRANSCRIPT
1
Modeling and prediction of surgical procedure times
Pieter S. Stepaniak 1, Christiaan Heij 2, and Guus de Vries 3
Econometric Institute Report EI2009-26
Abstract
Accurate prediction of medical operation times is of crucial importance for cost
efficient operation room planning in hospitals. This paper investigates the possible
dependence of procedure times on surgeon factors like age, experience, gender,
and team composition. The effect of these factors is estimated for over 30 different
types of medical operations in two hospitals, by means of ANOVA models for
logarithmic case durations. The estimation data set contains about 30,000
observations from 2005 till 2008. The relevance of surgeon factors depends on the
type of operation. The factors found most often to be significant are team
composition, experience, and daytime. Contrary to widespread opinions among
surgeons, gender has nearly never a significant effect. By incorporating surgeon
factors, the accuracy of out-of-sample prediction of case durations of about 1,250
surgical operations in 2009 is improved by up to more than 15 percent as compared
to current planning procedures.
Keywords and phrases
Operation room, surgeon factors, lognormal distribution, ANOVA model, planning,
European hospital, health care management, current procedure terminology (CPT)
1 Corresponding author; Institute of Health Policy and Management, Erasmus University Rotterdam,
P.O. Box 1738, 3000 DR Rotterdam, The Netherlands, email [email protected] 2 Econometric Institute, Erasmus School of Economics, Erasmus University Rotterdam 3 Institute of Health Policy and Management, Erasmus University Rotterdam

2
1 Introduction
Operating rooms (OR’s) are among the most expensive surgical resources in
hospitals (Vissers and Beech, 2005). In an era of cost-constrained health care,
efficiency increases if a larger number of surgical operations can be performed within
the available OR time (Stepaniak et al, 2009b). The OR management of medical
institutions needs to balance the costs of reserving too much time, with resulting idle
time of the OR, against the costs of reserving too little time. In the last case, the OR
schedule must be modified, resulting in an increased demand for anesthesiologists,
nurses, and support staff. Therefore, accurate prediction of case durations helps in
effective OR scheduling, it reduces waiting times for patients and idle times of
medical and other staff, and thereby it improves the quality of health care delivered
in other services throughout the hospital.
Surgical procedure times are inherently unpredictable, and the amount of
uncertainty varies greatly among different types of operations. Hospitals employ
standard classifications of operations, in terms of so-called current procedure
terminologies (CPT’s). Apart from the CPT, surgeon factors are the primary source
of variation in case durations, as shown in Strum et al (2000a, 2000b).
The purpose of this paper is to quantify the effect of surgeon factors on case
durations and to exploit these factors to improve case duration predictions. The
empirical analysis is based on extensive data bases of surgical operations in two
teaching hospitals in The Netherlands. The OR management in these two hospitals
often receives arguments brought forward by surgeons, anesthetists, and OR staff,
as to why surgical cases should be planned shorter or longer than usual due to a
range of factors. The factors mentioned most frequently to slow down procedure
times are the following: composition of the surgical team (presence of residents, that
is, physicians receiving specialized clinical training), lack of experience (low recent
work rate for this CPT), gender (female surgeons would be more precise and more
careful, and hence slower), age (younger surgeons are less experienced), and time
of the day (fatigue in the afternoon). Some of these factors have been analyzed
before for hospitals in the US, for instance, in Strum et al (2000b). As labor
3
regulations and working habits are quite different in Europe, it is of interest to study
the effect of these factors within a European setting.
The main results are the following. For several CPT’s, some of the factors
contribute significantly (at the 1% significance level) to operation times. This holds
true most notably for relatively complex surgical operations, for instance, those
involving endoscopic and laparoscopic procedures. Team composition, work rate,
and daytime are the most commonly relevant factors. Age matters only for two
CPT’s, and gender for none of the CPT’s (and at the 5% significance level only for a
single CPT, cataract in hospital A, where female surgeons work faster than their
male colleagues). The practical relevance of these factors is demonstrated by
improved out-of-sample prediction of case durations for 2009. As compared to
current OR planning procedures, which are based on the last ten cases of each
CPT, the accuracy is improved by 10-15%. Even if the more advanced three-
parameter lognormal model for case durations is taken as benchmark, incorporation
of significant surgeon factors leads to improvements of the same order of magnitude.
The paper has the following structure. Section 2 presents the data, and
Section 3 discusses the statistical model for case durations. The results in terms of
relevant factors and the gains in predictive accuracy are described in Section 4, and
Section 5 concludes.
2 Data
2.1 Surgical procedure times
The data are obtained from surgical databases of two large teaching hospitals in The
Netherlands, covering about 100,000 operations in the period from January 2005 till
August 2009. The data from 2005 till 2008 are used in estimation, leaving out the
data of 2009 for predictive evaluation purposes. The two hospitals, that will be
labeled as A and B, differ in several aspects, such as covered specializations,
organizational structure, OR protocols, OR logistics, and intensity of teaching.
Therefore, the two hospitals will be analyzed separately, but with similar methods.
4
For each operation, the database contains information on the type of
operation (the CPT-anesthesia combination), on the procedure and surgical times,
and on several surgeon factors (as will be discussed in the next subsection). The
procedure time is defined as the time passing from entry into the operating suite until
leaving the OR, This includes the surgical time, that is, the time passing from incision
to closure of the wound. The attention will be focused on procedure times, as these
are the relevant durations for OR planning. These times will also be denoted as
surgical procedure times, indicating that these times include the surgical operation
itself as well as the required OR procedures preceding and following the operation.
For the period 2005 till 2008, the database of hospital A contains over 44,000
cases for nearly 1,200 CPT-anesthesia combinations, with total OR time of about
50,000 hours. For various reasons, the actually employed dataset is much smaller
and contains 17,516 cases for 29 CPT-anesthesia combinations and a total OR time
of about 20,000 hours. The main reason for this data reduction is that CPT’s are
excluded if they occur relatively infrequently or if they are always performed under
similar circumstances. More precisely, in order to be included in the analysis, a CPT-
anesthesia combination should exhibit sufficient variation in surgeon factors to allow
for an analysis of the effect of these factors. Therefore, for every CPT-anesthesia
combination, the imposed minimal requirements are at least 150 cases in total and at
least 25 cases for every surgeon involved. Further, about 15% of the cases consist
of composite operations involving multiple CPT’s. These operations are excluded to
avoid possible confounding factors, following Strum et al (2000a). Composite
operations do not only occur rather infrequently in a fixed composition, but other
factors such as the order of the operations may also affect the composite case
durations. Minor other reasons for exclusion are operations with incomplete data
(less than 1%), and special operations like donor procedures and operations not
started or not completed (less than 0.1%).
A similar data selection strategy is followed for hospital B. This database
contains about 42,000 cases for about 1,000 CPT-anesthesia combinations, with
total OR time of about 45,000 hours. The actually employed dataset, after applying
the selection strategy discussed before, contains 12,030 cases for 25 CPT-
anesthesia combinations and a total OR time of about 16,000 hours.
5
The total number of included CPT-anesthesia combinations in hospitals A and
B is 32, with 22 common ones for hospitals A and B, 7 for hospital A alone, and 3 for
hospital B alone. Table 1 shows the included CPT’s and contains information on the
procedure times. The last four columns show the total number of surgeons and
residents involved in each CPT, as well as the number of cases performed in the
morning and in the afternoon.
<< Table 1 to be included around here >>
2.2 Surgical factors
The literature review of Dexter et al (2008) identifies 48 papers reporting significant
factors affecting the perioperative time, that is, the total time required for a patient's
surgical procedure, including ward admission, anesthesia, surgery, and recovery.
There are multiple reports of the effects on OR times of operative procedures,
perioperative team composition including primary surgeon, type of anesthetic, and
patient characteristics, in this sequence of importance. Strum et al (2000a, 2000b)
mention surgeon factors as the single most important source of variability in surgical
procedure times. Other, secondary sources of variability mentioned in their study are
the type of anesthesia, age and gender of the patient, and American Society of
Anesthesiologists risk class. The age of the surgeon is mentioned in Van
Houdenhoven (2007).
As described in the Introduction, several of these surgeon factors were also
brought forward by surgeons, anesthetists, and OR managers in hospitals A and B.
In total, the following five factors will be taken into account.
Gender
A popular belief is that female surgeons are more precise and more careful in
performing operations, resulting in longer case durations. The gender of the surgeon
is indicated by the dummy variable ‘Female’ (with value 1 for females and 0 for
males). For the CPT’s of Table 1, the total numbers of female and male surgeons in
6
hospital A are respectively 7 and 23, and in hospital B these numbers are
respectively 7 and 18.
Age
In general, older surgeons are more experienced and they may therefore work more
efficiently. This effect is mentioned, for instance, in Van Houdenhoven (2007). It
could also be that surgeons work fastest in the middle period of their career, as older
surgeons may become tired more quickly. However, because of the limited number
of surgeons, a distinction in two age categories is preferred. The age of surgeons
who are active in hospitals A and B ranges between 30 and 60 years. The two age
groups are indicated by the dummy variable ‘Age’, with value 1 if 45 or above and 0
if younger than 45. For the CPT’s of Table 1, the total numbers of surgeons above
and below 45 years of age are respectively 14 and 16 in hospital A, and in hospital B
these numbers are respectively 13 and 12. For a team of surgeons performing an
operation, the age is defined as the age of the oldest surgeon in the team.
Workrate
For a given CPT and surgeon, the work rate is related to the number of similar
operations that this surgeon has performed in the recent past. A higher work rate
means that the surgeon is more experienced in this kind of operation and that case
durations may become shorter (Strum et al, 2000a). Again, because of the limited
number of surgeons, a distinction in two classes of work rate is preferred. The work
rate is defined to be high if the surgeon performed a similar CPT at most three
weeks ago, and it is defined to be low if this was more than three weeks ago. This
rate is indicated by the dummy variable ‘Work rate’, with value 1 for a high rate and 0
for a low rate. For the CPT’s of Table 1, the percentage of operations with a high
work rate is 81 for hospital A and 84 for hospital B. For a team of surgeons
performing an operation, the work rate is defined as work rate of the leading surgeon
of the team.

7
Team
For all procedures of Table 1, the OR surgeon team always consists of a surgeon
who is assisted by at least one other surgeon or a resident. Residents are surgeons
who receive specialized clinical training in the hospital. It is common belief that the
presence of a resident has an increasing effect on case durations, because the
resident receives on the job training during the operation. The team composition is
indicated by the dummy variable ‘Team’, with value 1 if the team consists of
surgeons only and 0 if a resident is part of the team.
Daytime
Some people work better in the morning, others in the afternoon, in the evening, or
at night. A recent study (Tamm et al, 2009) shows differences in brain excitability,
that is, people who say that they feel best during a certain part of the day tend to
have a brain that is most easily excitable during that part of the day. As an operation
is a team effort of the involved surgeons and assisting staff, it is not easy to combine
the daytime effect for each individual in a joint team effect. Still, it is of interest to
know whether the time of the day has an effect on case durations. The time of an
operation is indicated by the dummy variable ‘Daytime”, with value 1 for the
afternoon (operations starting at 12.00 PM or later) and 0 for the morning (operations
starting before 12.00 PM). It might be that case durations are longer in the evening
and at night, due to less availability of surgeons and staff. However, such operations
are very rare in the two hospitals under consideration, and there is insufficient
information to test for separate evening and night effects. Therefore, operations
taking place during the evening or at night are excluded due to insufficient data.
3 Model for surgical procedure durations
3.1 Distribution of case durations
The literature on surgical procedure times deals nearly exclusively with the situation
in the US. Early results report a lognormal distribution for OR waiting times (Rossiter
8
and Reynolds, 1963) and a normal (Barnoon and Wolfe, 1968) or lognormal
(Hancock et al, 1988) distribution for OR case durations. Insight in the distribution of
case durations has advanced markedly in the past decade (Strum et al, 2000a,
2000b, 2003, May et al, 2000, Spangler et al, 2004). The empirical study of Strum et
al (2000a) indicates a lognormal distribution of surgical procedure times. Strum et al
(2003) consider composite operations consisting of two different surgical procedures
and conclude that the lognormal distribution fits such case durations better than the
normal distribution.
As surgical procedures require a positive start-up time, the shifted lognormal
distribution (also called the three-parameter lognormal, written as 3-logN) is used in
Strum et al (2000a) and, within an European context, in Stepaniak et al (2009a). For
the far majority of CPT’s, this distribution provides a better fit than the normal and
lognormal distributions. Let the procedure time (in minutes) of a given CPT be
denoted by T, then the 3-logN distribution for can be written as
log(T - ) = + ε , ε ~ N(0, 2).
Here > 0 is the shift parameter, and ε denotes an unobserved random error term
causing unpredictable variation. Stated otherwise, after shifting by , the logarithmic
procedure times are normally distributed with mean and standard deviation . The
procedure time is always larger than , and the median is equal to + exp().
The effect of surgeon factors on case durations is modeled by replacing in
the above model by parameters depending on the factors, similar to what is done in
analysis of variance (ANOVA) models. If all five factors discussed in Section 2.2 are
included, the model becomes
log(T - ) = PT + ε , ε ~ N(0, 2),
PT = 0 + 1Gender + 2Age + 3Workrate + 4Team + 5Daytime.
We call this the ANOVA model. This model is estimated for each CPT and each
hospital separately, allowing for different surgeon factor effects according to the

9
hospital and the type of surgical procedure. Although it may be possible to cluster
some of the CPT’s in Table 1 in groups with identical parameters, this will not be
pursued here, because the OR planning system is based on individual CPT’s. For a
given CPT and hospital, the error terms associated with all corresponding case
durations in the database are assumed to be independent and identically distributed.
The various hypotheses on surgeon factors discussed in Section 2.2 can be
expressed in terms of the following hypotheses on the parameters of the above
model:
1 > 0 , 2 < 0, 3 < 0 , 4 < 0 .
Further, it is expected that surgeon factors become more important as the complexity
of surgical procedures increases. A procedure is complex if it requires highly trained
OR staff performing very specific operational procedures and if the risk of
perioperative complications is larger than what is usual for routine procedures.
3.2 Estimation and prediction
For each CPT of Table 1, the ANOVA model for procedure times is estimated for
both hospitals separately, using data from the period 2005-2008. Factors that do not
vary are removed from the model. For instance, if all surgeons for a CPT are male,
then the effect of gender can not be estimated for this CPT. To start, all factors that
do vary for the CPT are included in the model. Next, backward elimination is used for
stepwise removal of insignificant factors. In the end, if all remaining factors are
significant, each of the other factors is tested once more for significance when added
to the other factors. In addition, the significance of interaction effects between the
factors is tested (as none of these interactions is significant, these results will not be
reported). All tests employ the same significance level, which is 10%, 5%, or 1%.
To evaluate the practical relevance of the identified significant surgeon
factors, the models that are estimated with data for 2005-2008 are used to predict
the case durations in the period from January till August 2009. The prediction model

10
is kept fixed, even though the parameters could be re-estimated after each relevant
CPT operation in 2009. This choice conforms to practical planning constraints, which
demand that models are kept fixed, for instance, for periods of twelve months. The
forecast study is restricted to the CPT’s for which at least one factor is significant at
the 1% significance level.
Three prediction methods are compared. The first is the method that is
currently employed in the OR management of both hospitals. The predicted time is
simply the average of the ten most recent durations of this CPT. The second method
predicts the procedure time to be the median of the 3-logN distribution (without
factors), that is, + exp(). The third method predicts the case duration to be equal
to the median of the ANOVA model, that is, + exp(0 + j jjF ), including only
those factors Fj for which the estimate of j is significant (at the 1% level). Predicted
case durations are compared with the actual procedure times, and the accuracy is
evaluated in terms of absolute prediction errors (in minutes). The significance of the
difference in mean absolute errors of two methods is tested by the paired t- test.
4 Results
4.1 Surgeon factors
For each hospital and CPT, the significant surgeon factors are obtained by the
backward selection strategy described in Section 3.2. The results are summarized in
Table 2, which shows how often each factor is found to be significant for significance
levels of 10%, 5%, and 1%. For instance, in hospital A, the effect of the factor
‘Gender’ can be analyzed for 22 CPT’s, as for the other 7 CPT’s the gender does not
vary among the surgeons. The gender effect is significant (and negative) for 3 CPT’s
at the 10% level (with a median effect of -1.8%), for 1 CPT at the 5% level (with a
median effect of -8.2%), and never at the 1% level. In hospital B, gender is never
found to be significant, not even at the 10% level. This means that there is no
support whatsoever for the commonly expressed opinion that female surgeons would

11
work slower. The gender effect is very weak, and at most it indicates faster work of
female surgeons.
Age effects are found to be often significant at the 5% level, mostly with faster
work of older surgeons, but the effect is significant at the 1% level only for two CPT’s
(with a time reduction of about 10% for older surgeons). Work rate effects are
significant in several cases, with varying sign at levels of 10% and 5%, but with a
consistent time saving effect at the 1% level (of about 5%) for high work rates. The
team composition is significant in many cases, and in the far majority of cases the
presence of a resident in the team causes longer procedure times (of about 15%, at
the 1% level). Daytime effects are significant in many cases, mostly with slower work
in the afternoon.
<< Table 2 to be included around here >>
Table 3 shows the estimated surgeon factor effects for each CPT separately, 29 for
hospital A and 25 for hospital B. The effects are shown only if they are significant at
the 10% level. The number of significant factors varies among CPT’s. For each of
the 22 CPT’s that are performed at both hospitals, the sign and size of the effects
are often quite the same in both hospitals, even though the effects of some factors
cannot be estimated at both hospitals, that is, if the factor does not vary for the CPT
under consideration. For instance, for the CPT ablatio mamma, the age affect in
hospitals A and B is respectively -1.9% and -3.5%, the team effect is -12.9% and -
12.5%, the daytime effect is 8.6% and 7.4%, and the work rate effect is significant
only for hospital A (at the 5% level) and not for hospital B (at the 10% level).
Age and Daytime are the factors found most often to be significant. Work rate
and team composition are also significant in many cases, and the largest percentage
effects are found for these two factors. Gender is nearly never of any importance.
The only significant gender effect at the 5% level is for cataract in hospital A, where
female surgeons work 8% faster than male surgeons. The CPT’s that have at least
two significant factors at the 1% level correspond to relatively complicated surgical
procedures requiring special skills: ablatio mamma, open appendectomy,
endoscopic appendectomy, endoscopic total prostatectomy, laparoscopic
12
cholestectomy, and laparoscopic sterilization. For many of these complicated
procedures, the work rate and team composition effects on procedure times are
considerable, up to 20%. As compared to less demanding CPT’s, complex
procedures require more time both for on the job training of residents and for
activating specialized skills if the surgeon did not practice these skills within the
preceding three weeks.
<< Table 3 to be included around here >>
Summarizing, the largest effects are obtained for work rate and team composition for
complicated CPT’s. In most cases (and at the 1% level always), procedure times are
relatively shorter for older surgeons, for a high work rate, and for teams without
resident. Gender has hardly any effect. In most cases, procedure times are shorter in
the morning than in the afternoon, but for some CPT’s this effect is reversed.
The mixed daytime effect can be due to the fact that this effect is measured
jointly for the full OR team involved in the operation and without information on the
time preference of the members of the team. A small-scale study was performed to
investigate this further. Ten surgeons of hospital A and also ten surgeons of hospital
B were asked whether they have any preference for performing operations in the
morning or in the afternoon. Of these 20 surgeons, 9 prefer the morning, 10 the
afternoon, and one surgeon has no preference. In total, the 19 surgeons with a
preference are active in 64 CPT’s. For each surgeon and CPT, the average case
duration in the morning is compared with that in the afternoon. Of the 64 surgeon-
CPT combinations, the fastest work was delivered in 48 cases in the preferred
daytime and in 16 cases in the non-preferred daytime. This effect of preferred
daytime on case durations is significant (the p-value according to the binomial
distribution with a success probability of 50% is smaller than 0.01%). For hospital A
(B), the fastest work was delivered in 23 (25) cases in the preferred daytime and in 7
(9) cases in the non-preferred daytime, corresponding to a p-value for the absence
of daytime effects of less than 1% in both cases.
As daytime preferences are not known for many of the surgeons involved in
the CPT’s of Table 1, this factor could not be incorporated in the analysis of surgeon
13
factor effects in Tables 2 and 3. However, the small-scale study indicates that it may
help to incorporate surgeon preferences in OR planning.
4.2 Prediction
In order to evaluate the practical usefulness of surgeon factors in predicting case
durations, the attention is restricted to CPT’s for which at least one surgeon factor is
significant at the 1% level. This holds true for eight CPT’s in hospital A and seven
CPT’s in hospital B, five of which occur at both hospitals. The ANOVA models,
estimated with the data of 2005-2008 and with the estimated factor effects of Table 3
that are significant at the 1% level, are used to predict the procedure times for the
period from January till August 2009. The total number of predicted case durations is
683 for hospital A and 575 for hospital B.
Table 4 summarizes the results of three prediction methods, that is, the
current method (average of last ten cases), the three-parameter lognormal model
without factors (3-logN), and the ANOVA model. The table shows the mean and
standard deviation of the absolute prediction errors, that is, the differences between
the predicted time and the actual case duration. The differences in mean absolute
prediction errors of the three methods are evaluated both in absolute terms (in
minutes) and in relative terms (as percentage of the median procedure time for each
CPT over the prediction period).
As an illustration, Figure 1 shows the absolute prediction errors and the
differences of these errors of the three prediction methods for the 71 endoscopic
appendectomy operations that took place in hospital A between January and August
2009. The current method predicts the procedure time as the average of the last ten
case durations of this CPT, and this estimate is updated after each operation in
2009. The 3-logN predictions are obtained from the ANOVA model without factors,
estimated with data from 2005 till 2008 and with fixed parameters for 2009. Finally,
the ANOVA predictions are also obtained from a model estimated with data from
2005 till 2008 and with fixed parameters for 2009. This model includes factors only if
they are significant at the 1% level. Table 3 shows that the included factors are work
14
rate (with coefficient -0.073) and team composition (with coefficient -0.137). Figure 1
shows that the smallest prediction errors are obtained for ANOVA, and that 3-logN is
second-best. The predictions of ANOVA are better than the current method in 67 out
of 71 cases, and they are better than 3-logN in 53 out of 71 cases. The differences in
absolute forecast errors of the three methods are all significant (at the 5% level)
when tested by the paired t-test.
<< Figure 1 to be included around here >>
Table 4 shows that, in all of the considered 15 CPT’s in hospitals A and B, the
3-logN predictions are more accurate than the currently employed method. The
same holds true for the ANOVA predictions, except for transurethral resection of the
prostate in hospital A. As compared to the current method, the forecast
improvements of 3-logN are up to 10%, and those of ANOVA are up to 18%. The
ANOVA predictions are better than the 3-logN predictions in the far majority of cases
(11 out of 15), with gains of up to 15%. For three CPT’s in hospital B, 3-logN is
slightly better than ANOVA (up to 2%), and for one CPT in hospital A, 3-logN is 6%
better than ANOVA. The paired t-test finds that, for hospital A, ANOVA improves
significantly on 3-logN (at the 5% level) for 7 out of 8 CPT’s, and the reverse holds
true for the remaining CPT. For hospital B, ANOVA is significantly better than 3-logN
for 4 out of 7 CPT’s, and the difference is not significant for the other 3 CPT’s.
When averaged over the eight considered CPT’s in hospital A, the gain in
prediction accuracy is 5 minutes (5%) for 3-logN as compared to the current method,
10 minutes (11%) for ANOVA as compared to the current method, and 5 minutes
(7%) for ANOVA as compared to 3-logN. For hospital B, the prediction gains are 4
minutes (4%) for 3-logN as compared to the current method, 8 minutes (8%) for
ANOVA as compared to the current method, and 4 minutes (4%) for ANOVA as
compared to 3-logN. On average, the standard deviation of the prediction errors is
smallest for ANOVA (3.7 minutes in hospital A and 4.1 minutes in hospital B), as
compared to 3-logN (4.7 in A and 4.5 in B) and the current method (5.9 in A and 5.2
in B). Although these differences are not large, reduction of uncertainty is important
in OR planning. It is a nice finding that the improved prediction accuracy of ANOVA,

15
which is based on more elaborate models involving surgeon factors, is combined
with reduced forecast uncertainty. Stated otherwise, the smaller prediction bias of
ANOVA comes without any cost of increased variance.
<< Table 4 to be included around here >>
5 Conclusion
Depending on the type of operation (CPT) and on the hospital, procedure times may
depend on several surgeon factors. In particular, for complex operations, factors like
relevant work rate experience of the surgeon and composition of the surgical team
may have large effects. The effect of team composition goes up to 20%, and when
combined with work rate, the total effect goes up to 30%. Other relevant factors are
age of the surgeon and time of the day. Gender has nearly never any effect, and the
only effect that is significant (at the 5% level) is found for cataract, where female
surgeons work 8% faster than male surgeons. A predictive out-of-sample analysis for
case durations in 2009 shows that surgeon factors help in predicting case durations.
As compared to the methodology currently employed in both hospitals, mean
absolute prediction errors are reduced by up to 18 minutes and up to 18% of the
median procedure time.
The most significant gains are obtained for relatively complex CPT’s,
especially those involving endoscopic and laparoscopic procedures. As the
complexity of surgical procedures shows an ever increasing trend, surgeon factors
may become even more important in the future.
The practical implementation of (ANOVA or other) prediction models is done
best after consultation of surgeons, OR management, and other staff involved in the
operation room activities. As hospitals differ widely in aspects like surgical
experience with different specializations, organizational structure, OR protocols and
OR logistics, the effect of surgeon factors will differ among hospitals. Therefore, it
may be best to estimate separate models for each hospital. The results of this paper
16
show several differences between the two considered hospitals, although the type of
effect is quite the same in many cases, especially for complex procedures.
The achieved improved forecast accuracy can be of great help for operation
room planning. Reduction of case duration uncertainty will have positive benefits in
terms of patient health care and human resource planning in hospitals.
References
Barnoon, S., and H. Wolfe (1968), Scheduling a multiple operating room system: A
simulation approach, Health Services Research 3, 272-285.
Dexter, F., E.U. Dexter, D. Masursky, and N.A. Nussmeier (2008), Systematic review
of general thoracic surgery articles to identify predictors of operating room case
durations, Anesthesia Analgesia 106, 1232-1241.
Hancock, W.M., P.F. Walter, R.A. More, and N.D. Glick (1988). Operating room
scheduling data base analysis for scheduling. Journal of Medical Systems 12, 397-
409.
May, J.H., D.P. Strum, and L.G. Vargas (2000), Fitting the lognormal distribution to
surgical procedure times, Decision Sciences 31, 129-148.
Rossiter, C.E., and J.A. Reynolds (1963), Automatic monitoring of the time waited in
out-patient departments, Medical Care 1, 218-225.
Spangler, W.E., D.P. Strum, L.G. Vargas, and J.H. May (2004), Estimating
procedure times for surgeries by determining location parameters for the lognormal
model, Health Care Management Science 7, 97-104.
Stepaniak, P.S., C. Heij, G.H.H. Mannaerts, M. de Quelerij, and G. de Vries (2009a),
Modeling procedure and surgical times for CPT-anesthesia-surgeon combinations
17
and evaluation in terms of case-duration prediction and operating room efficiency,
Anesthesia Analgesia 109, 1232-1245.
Stepaniak, P.S., G.H.H. Mannaerts, M. de Quelerij, and G. de Vries (2009b), The
effect of the operating room coordinator’s risk appreciation on operating room
efficiency, Anesthesia Analgesia 108, 1249-1256.
Strum, D.P., J.H. May, A.R. Sampson, L.G. Vargas, and W.E. Spangler (2003),
Estimating times of surgeries with two component procedures: Comparison of the
lognormal and normal models, Anesthesiology 98, 232-240.
Strum, D.P., J.H. May, and L.G. Vargas (2000a), Modeling the uncertainty of surgical
procedure times: Comparison of log-normal and normal models. Anesthesiology
92,1160-1167.
Strum, D.P., A.R. Sampson, J.H. May, and L.G. Vargas (2000b), Surgeon and type
of anesthesia predict variability in surgical procedure times, Anesthesiology 92,
1454-1466.
Tamm, A.S., O. Lagerquist, A.L. Ley, and D.F. Collins (2009). Chronotype influences
diurnal variations in the excitability of the human motor cortex and the ability to
generate torque during a maximum voluntary contraction, Journal of Biological
Rhythms 24, 211-224.
Van Houdenhoven, M. (2007), Healthcare logistics: The art of balance, PhD Thesis,
Erasmus University Rotterdam, Scriptum Publishers, Schiedam.
Vissers, J., and R. Beech (2005), Health operations management: Patient flow
logistics in health care, Routledge, Abingdon, Oxon.

Table 1.A : Data of hospital A (2005-2008)
Cases Procedure time (minutes) Surgeons Residents AM PMCPT (#) Mean Median SD Min Max (#) (#) (# cases) (# cases)
Ablatio mamma 152 85 73 18,5 12 198 5 7 79 73Acetabuloplastic 675 91 83 14 26 166 5 5 286 389Appendectomy, open 462 73 63 24 32 240 7 12 201 261Arcomion resection 774 69 62 13 19 199 5 0 388 386Arthroscopic knee and surgery 722 43 40 15 18 163 5 0 293 429Arthroscopic nettoyage of the knee 417 40 35 11 20 87 5 0 183 234Arthroscopic total or partial menisectom 1,248 41 35 12 15 147 5 0 608 640Bi/trimalleolar fracture 189 88 91 11 7 132 6 6 77 112Cataract 3,219 28 35 8 12 86 3 0 1537 1,682Diagnostic D & C / Hysteroscopy 426 44 40 21 3 108 5 0 198 228Endoscopic appendectomy 154 98 88 21 48 172 7 6 59 95Endoscopic total prostatectomy 294 237 189 39 55 383 3 3 150 144Femur fracture 342 67 64 9 18 99 7 11 186 156Genisis total knee 952 73 66 31 11 131 5 0 514 438Hemicolectomy 152 182 188 17 83 426 5 5 67 85Hernia inguinalis 764 71 62 20 31 155 7 12 340 424HNP lumbale 613 74 64 20 40 219 3 0 251 362Ileus surgery 167 99 94 15 43 177 4 3 109 58Laminectomy lumbale 340 87 76 22 40 222 2 0 171 169Laparoscopic cholestectomy 800 123 103 35 53 340 4 11 443 357Laparoscopic sterilisation 182 61 48 16 5 94 5 5 71 111Mammareduction both sides 431 102 89 34 55 227 4 0 198 233Manual placenta removal 281 40 45 22 12 236 6 4 108 173Scopic decompresion shoulder 401 45 40 9 11 37 5 0 179 222Sectio caesarea 961 60 54 14 26 171 6 7 393 568Total hip arthroplasty 1,221 98 84 25 15 332 5 0 577 644Transurethral resection of the prostate 533 69 64 23 5 121 4 0 278 255Ureterorenoscopy 212 78 71 35 20 221 3 0 89 123Uterus extirpation 432 98 91 19 12 154 5 2 191 241
Total 17,516 30 19 8,223 9,293

Table 1.B : Data of hospital B (2005-2008)
Cases Procedure time (minutes) Surgeons Residents AM PMCPT (#) Mean Median SD Min Max (#) (#) (# cases) (# cases)
Ablatio mamma 687 82 78 21 13 201 8 6 358 329Acetabluloplastic 804 97 89 17 38 169 5 5 194 610Appendectomy, open 547 91 80 21 4 171 8 11 202 345Arcomion resection 678 64 60 15 13 187 7 4 498 180Arthroscopic knee and surgery 200 40 35 18 18 4 5 0 103 97Arthroscopic nettoyage of the knee 214 37 35 12 35 17 5 0 120 94Arthroscopic total or partial menisectom 300 47 43 15 23 103 3 0 161 139Bi/trimalleolar fracture 156 98 88 13 6 210 7 6 90 66Cataract 1,541 26 25 10 32 70 4 0 639 902Cholestectomy open 1,110 87 81 15 6 198 7 6 698 412Colon resection 430 169 150 14 10 201 4 2 199 231Diagnostic D & C / Hysteroscopy 688 47 44 18 5 101 4 0 310 378Endoscopic appendectomy 269 89 78 17 15 163 6 5 127 142Endoscopic total prostatectomy 301 243 171 31 9 375 3 0 125 176Femur fracture 298 108 95 32 8 222 5 0 129 169Hernia inguinalis 268 75 71 22 4 124 7 10 151 117Ileus surgery 151 108 100 17 11 191 4 8 67 84Laminectomy lumbale 294 86 80 19 20 125 2 7 139 155Laparascopic cholestecomy 305 120 104 25 20 218 4 6 128 177Mammareduction both sides 564 114 100 14 12 227 4 0 291 273Manual placenta removal 405 51 45 26 9 117 6 4 233 172Scopic decompresion shoulder 401 45 40 9 11 137 5 0 179 222Small bowel resection 684 101 89 21 16 242 5 3 385 299Transurethral resection of the prostate 414 64 61 25 14 162 3 0 221 193Uterus extirpation 321 102 96 23 19 172 5 0 140 181
Total 12,030 25 12 5,884 6,146
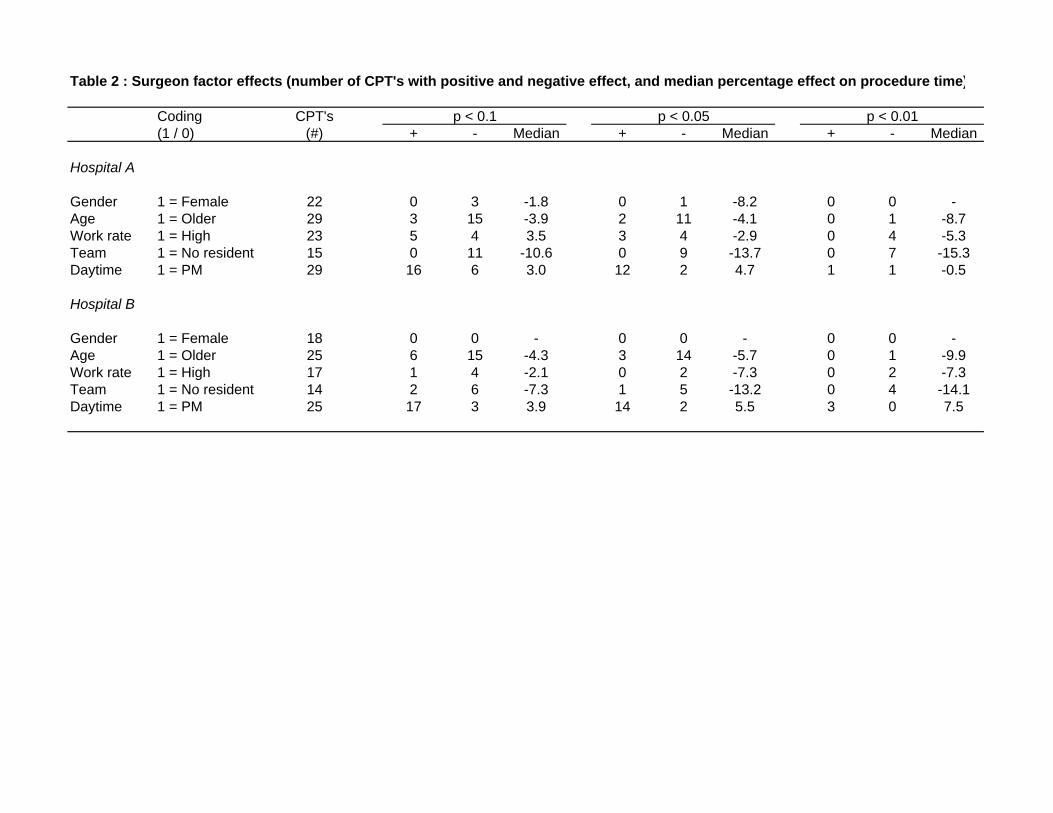
Table 2 : Surgeon factor effects (number of CPT's with positive and negative effect, and median percentage effect on procedure time)
Coding CPT's p < 0.1 p < 0.05 p < 0.01(1 / 0) (#) + - Median + - Median + - Median
Hospital A
Gender 1 = Female 22 0 3 -1.8 0 1 -8.2 0 0 -Age 1 = Older 29 3 15 -3.9 2 11 -4.1 0 1 -8.7Work rate 1 = High 23 5 4 3.5 3 4 -2.9 0 4 -5.3Team 1 = No resident 15 0 11 -10.6 0 9 -13.7 0 7 -15.3Daytime 1 = PM 29 16 6 3.0 12 2 4.7 1 1 -0.5
Hospital B
Gender 1 = Female 18 0 0 - 0 0 - 0 0 -Age 1 = Older 25 6 15 -4.3 3 14 -5.7 0 1 -9.9Work rate 1 = High 17 1 4 -2.1 0 2 -7.3 0 2 -7.3Team 1 = No resident 14 2 6 -7.3 1 5 -13.2 0 4 -14.1Daytime 1 = PM 25 17 3 3.9 14 2 5.5 3 0 7.5

Table 3.A : Percentage effect of significant surgeon factors on procedure time (hospital A) (shown only if significant at 10%; * and ** denote significance at 5% and at 1%)
CPT Cases Gender Age Work rate Team Daytime (#) (1 = Female) (1 = Older) (1 = Higher) (1 = No res) (1 = PM)
Ablatio mamma 152 - -1.9 9.2* -12.9** 8.6 ** Acetabuloplastic 675 - -3.2* - - -7.0*Appendectomy, open 462 -0.7 -8.7 ** - -10.6** 2.5*Arcomion resection 774 - -4.1* - - 5.0*Arthroscopic knee and surgery 722 - -2.9* - - 1.0Arthroscopic nettoyage of the knee 417 - -4.1* - - -3.1Arthroscopic total or partial menisectomy 1,248 - - - - 6.2*Bi/trimalleolar fracture 189 - - - -8.6 4.1*Cataract 3,219 -8.2* - - - -Diagnostic D & C / Hysteroscopy 426 - -2.5 - - -0.4Endoscopic appendectomy 154 - -3.9* -7.3** -13.7** 8.1*Endoscopic total prostatectomy 294 - - -8.9** -20.3** 8.5*Femur fracture 342 - - 6.1* -4.1 3.4Genisis total knee 952 - - - - 3.6Hemicolectomy 152 - 3.1 - -4.3* 2.5*Hernia inguinalis 764 - -6.2* - -3.8* 2.4HNP lumbale 613 - -9.2* - - 4.4*Ileus surgery 167 - - 6.3 - 1.7*Laminectomy lumbale 340 - - 3.5 - 6.8*Laparoscopic cholestectomy 800 - -7.6* -3.2** -19.2** -3.3Laparoscopic sterilisation 182 -1.8 -8.5* -2.9** -15.3** -Mammareduction both sides 431 - -3.8 - -16.8** -5.3Manual placenta removal 281 - - - - 5.4*Scopic decompresion shoulder 401 - 5.4* - - -Sectio caesarea 961 - 4.3* - - -Total hip arthroplasty 1,221 - -2.4* - - -Transurethral resection of the prostate 533 - - 4.1* - -9.6**Ureterorenoscopy 212 - - - - -Uterus extirpation 432 - -9.2 - - -
Total / Percentage of cases with factor = 1 17,516 21.0 48.2 81.2 14.9 53.1
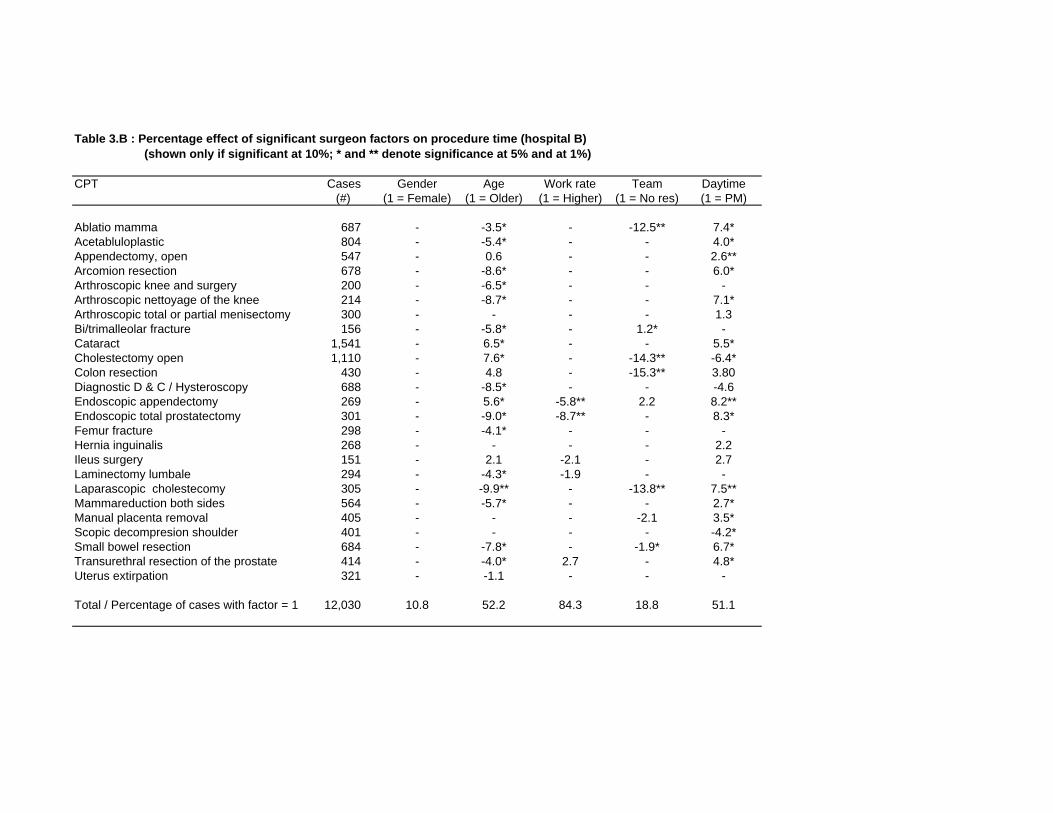
Table 3.B : Percentage effect of significant surgeon factors on procedure time (hospital B) (shown only if significant at 10%; * and ** denote significance at 5% and at 1%)
CPT Cases Gender Age Work rate Team Daytime (#) (1 = Female) (1 = Older) (1 = Higher) (1 = No res) (1 = PM)
Ablatio mamma 687 - -3.5* - -12.5** 7.4*Acetabluloplastic 804 - -5.4* - - 4.0*Appendectomy, open 547 - 0.6 - - 2.6**Arcomion resection 678 - -8.6* - - 6.0*Arthroscopic knee and surgery 200 - -6.5* - - -Arthroscopic nettoyage of the knee 214 - -8.7* - - 7.1*Arthroscopic total or partial menisectomy 300 - - - - 1.3Bi/trimalleolar fracture 156 - -5.8* - 1.2* -Cataract 1,541 - 6.5* - - 5.5*Cholestectomy open 1,110 - 7.6* - -14.3** -6.4*Colon resection 430 - 4.8 - -15.3** 3.80Diagnostic D & C / Hysteroscopy 688 - -8.5* - - -4.6Endoscopic appendectomy 269 - 5.6* -5.8** 2.2 8.2**Endoscopic total prostatectomy 301 - -9.0* -8.7** - 8.3*Femur fracture 298 - -4.1* - - -Hernia inguinalis 268 - - - - 2.2Ileus surgery 151 - 2.1 -2.1 - 2.7Laminectomy lumbale 294 - -4.3* -1.9 - -Laparascopic cholestecomy 305 - -9.9** - -13.8** 7.5**Mammareduction both sides 564 - -5.7* - - 2.7*Manual placenta removal 405 - - - -2.1 3.5*Scopic decompresion shoulder 401 - - - - -4.2*Small bowel resection 684 - -7.8* - -1.9* 6.7*Transurethral resection of the prostate 414 - -4.0* 2.7 - 4.8*Uterus extirpation 321 - -1.1 - - -
Total / Percentage of cases with factor = 1 12,030 10.8 52.2 84.3 18.8 51.1
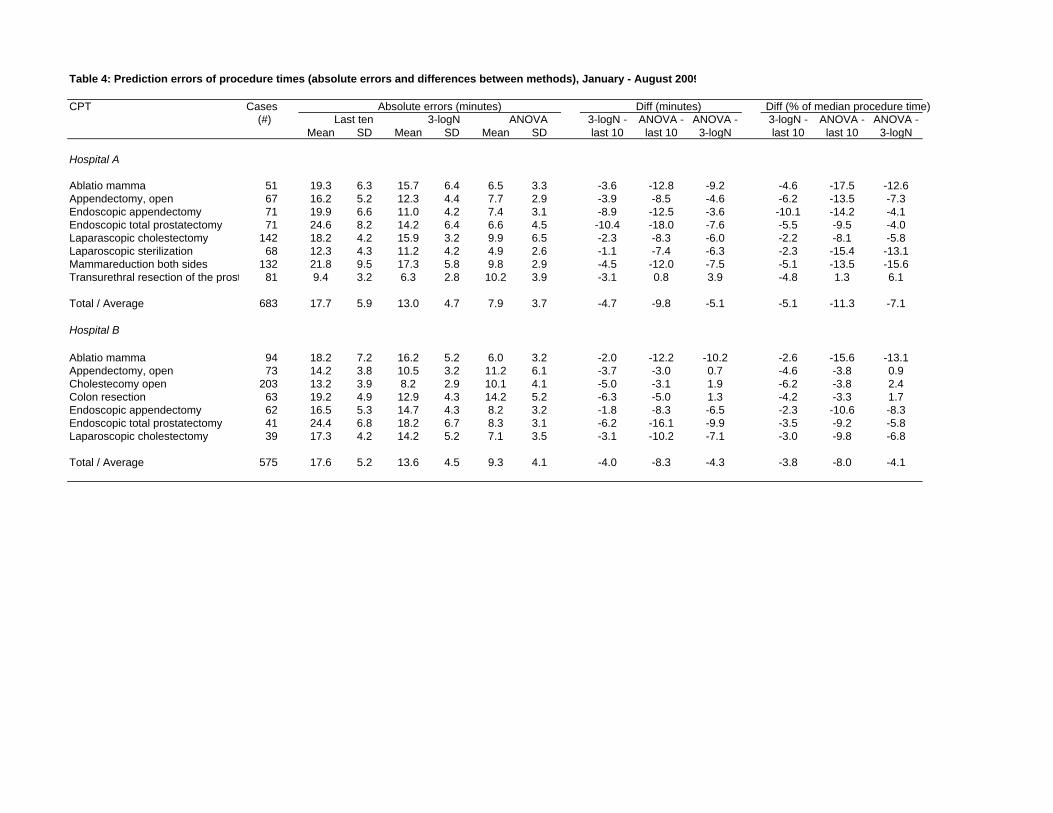
Table 4: Prediction errors of procedure times (absolute errors and differences between methods), January - August 2009
CPT Cases Absolute errors (minutes) Diff (minutes) Diff (% of median procedure time) (#) Last ten 3-logN ANOVA 3-logN - ANOVA - ANOVA - 3-logN - ANOVA - ANOVA -
Mean SD Mean SD Mean SD last 10 last 10 3-logN last 10 last 10 3-logN
Hospital A
Ablatio mamma 51 19.3 6.3 15.7 6.4 6.5 3.3 -3.6 -12.8 -9.2 -4.6 -17.5 -12.6Appendectomy, open 67 16.2 5.2 12.3 4.4 7.7 2.9 -3.9 -8.5 -4.6 -6.2 -13.5 -7.3Endoscopic appendectomy 71 19.9 6.6 11.0 4.2 7.4 3.1 -8.9 -12.5 -3.6 -10.1 -14.2 -4.1Endoscopic total prostatectomy 71 24.6 8.2 14.2 6.4 6.6 4.5 -10.4 -18.0 -7.6 -5.5 -9.5 -4.0Laparascopic cholestectomy 142 18.2 4.2 15.9 3.2 9.9 6.5 -2.3 -8.3 -6.0 -2.2 -8.1 -5.8Laparoscopic sterilization 68 12.3 4.3 11.2 4.2 4.9 2.6 -1.1 -7.4 -6.3 -2.3 -15.4 -13.1Mammareduction both sides 132 21.8 9.5 17.3 5.8 9.8 2.9 -4.5 -12.0 -7.5 -5.1 -13.5 -15.6Transurethral resection of the prost 81 9.4 3.2 6.3 2.8 10.2 3.9 -3.1 0.8 3.9 -4.8 1.3 6.1
Total / Average 683 17.7 5.9 13.0 4.7 7.9 3.7 -4.7 -9.8 -5.1 -5.1 -11.3 -7.1
Hospital B
Ablatio mamma 94 18.2 7.2 16.2 5.2 6.0 3.2 -2.0 -12.2 -10.2 -2.6 -15.6 -13.1Appendectomy, open 73 14.2 3.8 10.5 3.2 11.2 6.1 -3.7 -3.0 0.7 -4.6 -3.8 0.9Cholestecomy open 203 13.2 3.9 8.2 2.9 10.1 4.1 -5.0 -3.1 1.9 -6.2 -3.8 2.4Colon resection 63 19.2 4.9 12.9 4.3 14.2 5.2 -6.3 -5.0 1.3 -4.2 -3.3 1.7Endoscopic appendectomy 62 16.5 5.3 14.7 4.3 8.2 3.2 -1.8 -8.3 -6.5 -2.3 -10.6 -8.3Endoscopic total prostatectomy 41 24.4 6.8 18.2 6.7 8.3 3.1 -6.2 -16.1 -9.9 -3.5 -9.2 -5.8Laparoscopic cholestectomy 39 17.3 4.2 14.2 5.2 7.1 3.5 -3.1 -10.2 -7.1 -3.0 -9.8 -6.8
Total / Average 575 17.6 5.2 13.6 4.5 9.3 4.1 -4.0 -8.3 -4.3 -3.8 -8.0 -4.1

Figure 1: Histograms of absolute forecast errors (top) and differences in absolute forecast errors (bottom)
for 71 procedure times of Endoscopic appendectomy
Last ten 3-logN ANOVA
3-logN – last ten ANOVA – last ten ANOVA – 3-logN