modeling and validation of a fuel cell hybrid vehicle · modeling and validation of a fuel cell...
TRANSCRIPT

2000-01-1566
Modeling and Validation of a Fuel Cell Hybrid Vehicle
Michael J. Ogburn and Douglas J. NelsonMechanical Engineering, Virginia Tech
Keith Wipke and Tony MarkelNational Renewable Energy Laboratory
ABSTRACT
This paper describes the design and construction of afuel cell hybrid electric vehicle based on the conversionof a five passenger production sedan. The vehicle usesa relatively small fuel cell stack to provide averagepower demands, and a battery pack to provide peakpower demands for varied driving conditions. A model ofthis vehicle was developed using ADVISOR, anAdvanced Vehicle Simulator that tracks energy flow andfuel usage within the vehicle drivetrain and energyconversion components.
The Virginia Tech Fuel Cell Hybrid Electric Vehicle wastested on the EPA City and Highway driving cycles toprovide data for validation of the model. Vehicle dataand model results show good correlation at all levels andshow that ADVISOR has the capability to model fuel cellhybrid electric vehicles.
BACKGROUND
Hybrid electric vehicles (HEV’s) combine the benefits ofseveral propulsion components in an attempt to producea more efficient vehicle. A common approach to hybridvehicle design takes a conventional vehicle drivetrainand combines it with components commonly found in anelectric vehicle. In this type of vehicle, a gasoline enginemight be augmented by an electric motor. In a fuel cellhybrid a different approach must be taken to harness the
electrochemical energy produced by the fuel cell. In thiscase, hydrogen is converted into electrical energy thatdrives the wheels of an electric vehicle. In a fuel cellhybrid vehicle the power generation system does notcompletely replace the battery pack but rather serves tosupply the average power demands of the vehicle. Thisallows for a smaller fuel cell than in a non-hybrid ‘pure’fuel cell vehicle. As a flurry of recent developments hasshown, such as 68 mpg by the hydrogen-fueled FordP2000, fuel cells have the potential to provide highefficiency, high vehicle fuel economy, and very lowemissions for hybrid electric vehicles.
The purpose of the research outlined in this paper is toprovide vehicle-level validation of modeling performedusing ADVISOR, a Matlab/Simulink based vehiclesimulation package, on Virginia Tech’s 1999 entry intothe FutureCar Challenge, a 5-passenger fuel cell hybridvehicle. Developed by engineering students for aDepartment of Energy student competition, it consists of100kW (134hp) electric vehicle drivetrain, 324V sealedlead acid battery pack, and on board power generationprovided by am Energy Partners 20kW PEM hydrogenfuel cell. (Figure 1)
InverterFuel Cell
Contactor BoxA/C Compressor
Fuel Cell Heat ExchangerInverter Heat Exchanger
Boost ConverterFuel Cell Cooling Pump
DC/DC ConverterAir Compressor
Controller
Charge Controller
Charger Filter BoxH2 Fuel Tanks
Buck ConverterBattery Pack
Transaxle AC Induction Motor
Humidification Pump Deionized Water ReservoirAir Compressor
Figure 1. Virginia Tech FuelCell Hybrid Electric Vehicle

INTRODUCTION
The National Renewable Energy Laboratory hasdeveloped ADVISOR, an Advanced Vehicle Simulatorthat is a very useful computer simulation tool for analysisof energy use and emissions in both conventional andadvanced vehicles. By incorporating various vehicleperformance and control information into a modularenvironment within Matlab and Simulink ADVISORallows the user to interchange a variety of components,vehicle configurations, and control strategies.Modification of data files to represent new or uniquevehicle components is straightforward and a userfriendly graphical user interface (GUI) allows for easymanipulation of input files, test routines, and outputplots. Other unique and invaluable features ofADVISOR include the ability to quickly performparametric and sensitivity studies of vehicle parameterson overall performance and economy.
However, no simulation tool is complete without beingvalidated against measured vehicle data to ensure thereliability of its predictions. This paper outlines avalidation study recently completed using the VirginiaTech Fuel Cell Hybrid Chevrolet Lumina that placed firstand second, respectively, at the 1998 and 1999FutureCar Challenges. A 3-D packaging layout is shownin Figure 1.
The work was focused on two areas: testing of the fuelcell stack and related subsystems, and modeling of thesystems and their controls in Simulink. Afterconstruction, the vehicle was subjected to EPA city andhighway driving cycles in controlled conditions at anemissions dynamometer facility. The data acquired fromthe vehicle test and the output of the ADVISOR model ofthe vehicle were compared to judge the accuracy andvalidity of the model.
TESTING AND MODELING
ADVISOR is a simulation package based on Simulinkblock diagrams and supported by Matlab data files thatcontain vehicle configuration, control, and performancedata. Unlike other simulation packages which are set uponly as executable code, these files are by their naturethe source code for the simulation. Because of theirgraphical nature and straightforward construction theblock diagrams are almost self-documenting, makingmodification relatively easy. This also makes ADVISORwell suited to collaboration between researchers and fordistribution to the public. The graphical user interface(GUI) is shown in Figure 2.
Figure 2. ADVISOR GUI, Vehicle Setup Screen
ADVISOR 2.2 incorporates many drivetrain typesincluding conventional Internal Combustion Engine(ICE), electric, series and parallel hybrid, and fuel cellhybrid models. (Cuddy, Wipke, Burch, 1998) The fuelcell model that is integrated into ADVISOR 2.1 providesa temporary way of including a fuel cell hybrid simulationcapability in a modeling package originally designed forICE hybrids. However, this is not an ideal method toaccurately represent the behavior of a fuel cell system.A major goal of this modeling effort is to improve theability of ADVISOR to predict the energy flow and fuelusage of a fuel cell hybrid electric vehicle
DATA ACQUISITION
To acquire data about a vehicle for the purposes ofcharacterizing its operation often requires an off-boardcomputer and many additional sensors. Since it wasknown prior to the test that these facilities would not beavailable, other methods had to be developed. Thevehicle control system, developed by undergraduateengineering students at Virginia Tech, serves to monitoroperating parameters of the fuel cell system and of thevehicle level components and then to make decisionsthat allow the vehicle to function properly. This systemconsists of sensors and student-built signal conditionersthat are fed into the input channels of a microprocessorcontrol board. The secondary purpose of the controlsystem is to support the research and analysisdiscussed here by also operating as a data loggingsystem. After this information is used to make controldecisions, it is sent out over a serial data line to anonboard computer that logs the 60 channels of sensorinformation whenever the vehicle is on.
Data on vehicle power flows are collected using a dataacquisition system that tracks energy generation by thefuel cell system and energy flow to and from thebatteries. After collection this information is streamed tothe main onboard computer. When operating, thesystem makes measurements and decisions at varyingsample rates and output the information to a data file ona second by second basis.

Uncertainties in this data acquisition system are believedto be <5%, because nearly all measurements are directreadings of reliable sensors. Measurements taken onpower usage are particularly accurate, because theseportions of the system are commercially designed andmanufactured. The remainder of the system channelswere calibrated by VT engineers over the ranges seenduring normal operation of the fuel cell system. Overall,this system has proven to be accurate for all practicalpurposes, but it should be noted that the system doesnot respond quickly to transient events. For this reason,there is noticeable transient data scatter in several of theplots throughout this paper. The major data channelsare summarized in Table 1.
Table 1. Main Sensor ChannelsBattery Pack Units Measurable Range
Voltage V 0-500VCurrent A +/- 400ACumulative Charge A-h n/aEnergy Use kW-h n/a
Fuel Cell System Ouput:Current A +400ACumulative Charge A-h n/aEnergy Use kW-h n/a
Fuel Cell System Parameters:27 cell group voltages, total: 110 q 0-5V eachTotal Stack Current A 0-350AFuel Cell Power W n/aAir Inlet Temperature C 5-70CAir Inlet Humidity RH% 0-100%Air Inlet Pressure Kpa (psi) 101-234kPa (0-20psig)Air Compressor Current Used A 0-20AHydrogen Inlet Temperature C 5-70CHydrogen Inlet Humidity RH% 0-100%Hydrogen Inlet Pressure Kpa (psi) 101-235kPa (0-20psig)Hydrogen Intermediate Pressure Kpa (psi) 101-2164kPa (0-300psig)Hydrogen Tank Pressure Kpa (psi) 0-27.6mPa (0-4000psig)Hydrogen Flow Rate slpm 0-500slpmCoolant Temp In C 5-70CCoolant Temp Out C 5-70CCoolant Inlet Pressure psi 101-235kPa (0-20psig)
FUEL CELL SUBSYSTEMS
The goal of an ADVISOR model is to produce acomputer simulation of the energy storage, energygeneration, and energy flow within the vehicle that isused to propel it along a particular speed vs. time trace.Figure 3 shows the systems that store and generateenergy aboard the VT FC-HEV and that are incorporatedinto the modified ADVISOR model (figure 12).
Fuel Cell Hybrid Electric Vehicle Energy UsageFuel In
AirIn
Fan Fan
HydrogenStorage
BatteryPack
Boost Converter
Off BoardBatteryCharger
ElectricityIn
HeatRejection
Fuel Purge
AirExhaust
FuelAirElectrical
DC/DCConv
HVACComp
Inv
TractionMotor/
Inverter
AirComp
InvHVACLoad
Figure 3. Energy Flow on the VT FC-HEV
Fuel Cell Stack
Fuel cell stack performance testing was completed byEnergy Partners (EP) before shipping and was verifiedby system tests and on-vehicle testing (IN HEV). (SeeFigure 4)
40
50
60
70
80
90
100
110
0 200 400 600 800 1000 1200CURRENT DENSITY (mA/cm^2)
STACK
VOLTAGE
@170kPa (EP)@170kPa (IN HEV)
Date: 5-19-99 H2/air stoic: ~1.5/2.5# of cells: 110 Temp. (deg. C): 60Active area (cm^2): 292 H2/air humid (deg. C): 60
Figure 4. Polarization Curve, manufacturer vs. FC-HEV
Although the stack did not perform as well in the vehicleas it did in the laboratory, the differences can beexplained by quality of reactant streams as well as minordamage to the stack that occurred prior to testing in thevehicle.
Reactant Supply System
To function at peak performance, a proton exchangemembrane fuel cell such as the 20 kW Energy Partner’sstack in Virginia Tech’s fuel cell hybrid requires reactantstreams that are under pressure and are humidified. Onthe fuel side of the fuel cell stack, pressurized hydrogenfrom tanks requires no additional energy as it flowsthrough pressure regulators into the 170 kPa (10 psig)fuel lines and recirculation loop. The oxidant for this fuelcell is air, supplied at 1415 slpm (50 cfm) by a 7000 rpmscrew compressor. Initial testing demonstrated that 4 to5 kilowatts of electrical power would be needed at theinput to the Air Compressor Motor Controller to create a239 kPa (20 psig) air stream. This is nearly 25% of thefuel cell’s total output. While this high pressure allowed

improved fuel cell performance over 10 psig operation,the overall system efficiency was lowered due to thehigh parasitic energy demand. Because of this, theoperating pressure of the stack was chosen to be 70 kPa(10 psig), allowing for more efficient operation overall.
Energy StorageSystem
250-400VDC
Buck Converter150V regulated
Motor Controller100-200VDC
DC-BrushlessMotor Drive
Fuel Cell Stack
ScrewCompressor
Figure 5. Air Compression System Power Flow
As seen in figure 5. the air compressor used on the VTFC-HEV vehicle must incorporate a regulating powersupply called a buck converter to step vehicle batteryvoltage down to a level acceptable to the motorcontroller. This means that power must flow first throughthe buck converter, then the motor controller, and finallyinto the electric motor before entering the air compressoras mechanical power. This string of components doesnot contribute favorably to the overall efficiency of thesystem but it is required due to the limited availability ofsuitable components to operate a fuel cell system.Testing of the Air Compression System treats this entiresystem as one unit, measuring the input power used atthe input to the buck converter to produce the requiredair flows at the output of the air compressor. Thistesting, verified by data recorded on board the vehicle,showed that the system needed 3.65 kW to supply theairflow needed at full fuel cell power.
Any time the fuel cell system is operating the aircompressor operates at its full 3.65 kW load to ensurethat adequate oxidant is supplied to the fuel cell stack. Ifthe Fuel Cell is operating at full power, this amount of airflow meets the manufacturers recommendedstoichiometric ratio of 2.5 times the required oxygen. Asfuel cell power decreases, the air flow may alsodecrease to lighten parasitic loading as long as thestoichiometric ratio is greater than or equal 2.5. Due tosystem complexity constraints, the VT FC-HEV did notemploy this “load following” technique to the fuel cellreactant supply systems and therefore suffers a systemefficiency penalty when the system is producing lessthan peak power.
Other Accessory Loads
In addition to fuel and air supply, the Virginia Techsystem required several other support systems,including thermal control through a water cooling loopwith pump and fans, humidification control and waterrecovery using 2 small pumps, as well as fans to providefor electronic cooling. These constant loads were
lumped into an accessory power block (Figure 6) inaddition to existing vehicle accessories
1
Power draw from buss
acc_losses
To Workspace3Sum
Product
air_compressor_pwr
Air Comp Power Usage (W)
DC_DC_pwr
13.8 V DC/DC Power Usage (W)(pumps, fans, electronic loads)
1On signal from Control Strat.
Figure 6. Accessory Load Block
The accessory block shows how the air compressorpower is incorporated as a simple constant loadaccessory of the fuel cell system. This block alsoincorporates the additional 12V loads incurred by pumpsand fans that are mentioned above.
Power Processing – Design Philosophy
A component unique to the design of the Virginia TechFuel Cell Hybrid Electric Vehicle is a power electronicdevice know as a boost converter. The boost converterused in this design serves two important purposes in theVirginia Tech Fuel Cell Hybrid Electric Vehicle (VT FC-HEV). First, it boosts the low voltage output of the fuelcell to match the voltage of the vehicle’s battery pack,which varies widely with state of charge (SOC) andvehicle load. Secondly, it incorporates a load followingportion of the vehicle control strategy to the fuel cellsystem, supplying a higher power level to the vehiclewhen it is under higher load. By sensing battery packvoltage, the boost converter allows the fuel cell tooperate efficiently at low power when the vehicle seeslight loads, while still supplying it with adequate power tomaintain adequate SOC when vehicle power demand ishigh or to return power to the battery pack when it isdischarged. Figure 7 shows a plot of this load followingfunction.
Boost Converter Power Curves
0
2500
5000
7500
10000
12500
15000
17500
20000
22500
240 260 280 300 320 340 360 380Bus Voltage (V)
Oup
ut P
ower
(Wat
ts)
System Test Data
Manuf. Data
Vehicle Test Data
Figure 7. Boost Converter Power Transfer Curve
Safety comes first in any design. Human safety isincorporated into the boost converter by isolating thehigh voltage electronics of the system from the vehiclechassis and from the environment. However, In thedesign of this component’s function and performance, itwas safety of the fuel cell stack itself that was mostimportant. The fuel cell provided by Energy Partnerswas made possible through a one-time grant from theDepartment of Energy that did not include any warranteecoverage or extra monies for repair. Failure to carefullyplan measures that would protect the stack could doomthe success of a 2 year project. There are two types oflimits in place to protect the stack, a maximum currentlimit set to 300 amps, and a minimum voltage limit of60V, both recommended by the manufacturer. With aproper reactant supply system installed and these limitsin place, the fuel cell is properly protected from beingoverloaded. Regardless of fuel cell voltage, the boostconverter will not allow higher currents under anycondition. Should fuel cell voltage drop below 60V it canbe inferred that inadequate reactants are available forthe power requested. In this case, the power drawnfrom the stack is scaled back until voltage rises again. Iffuel cell voltage should fall to 55V or less, the boostconverter completely shuts down.
When specifying the operating controls of the boostconverter in the preliminary design phases, the bestavailable example of a successful hybrid control strategywas that of ANIMUL, the vehicle built by students atVirginia Tech that placed first in the nation in 1996. Thisseries propane hybrid had a constant speed alternatorwith an open circuit voltage of about 400V under noload. When connected to the battery pack used inANIMUL, the generator produced about 10kW at 350V.When the vehicle was under high load and the batterypack was at 250V, the generator produced about 20kW.This configuration proved effective in maintaining batterypack state of charge in ANIMUL during city and highwaydriving.
Since the fuel cell’s open circuit voltage is 110V,operation by direct connection to the battery pack wasnot an option. The boost converter provided a way toboost the power of the fuel cell up to the voltage of the
battery pack. Since a system that provided full power ataround 250V and no power at 400V was so successful inthe past, it was decided that an attempt to make a fuelcell system operate in a similar manner would give thebest chance for success. Based on this assumption andadditional information about the fuel cell system, theboost converter was designed to give full power at anyvoltage below 300V, and give zero power transfer at380V. This range is slightly tighter than before, butassures that energy transfers at a rate fast enough tomaintain battery state of charge while allowing the fuelcell to operate at medium to light loads a majority of thetime. Because fuel cells are more efficient at light loadsthan engines, operation in this region allows for higherfuel economy.
To define this operation, we developed a “power transfercurve” for the boost converter. By watching the voltageon the battery pack, the boost converter demands acertain load from the fuel cell stack and processes thispower from the low voltage of the fuel cell up to thebattery pack voltage at that moment. See Figure 7.
The boost converter needed to be a simple device froman external control standpoint. Because of thecomplexity of the other systems on the vehicle and theteam’s limited experience with fuel cells, control wasembedded within as many subsystems as possible. Thisincluded the boost converter, as it was the single mostcontrol-intensive fuel cell system in the vehicle. Anotherreason for this was that the fuel cell controller was not aparticularly powerful package and its microprocessorwas heavily taxed with other operations even withoutconsideration of load control. Simplicity in integrationalso mattered and led to a design that was constructedto meet the space constraints within the vehicle. Theend result was a boost converter that fit into the vehicle,operated on a pre-programmed ‘power transfer curve,’and was turned on and off by a single 12V on/off signal.
Power Processing – Design Realization
Power Curves for the Boost Converter were producedfrom 2 test runs and are displayed with in vehicle testdata in Figure 7. The first test was relatively noisy data
2
Power RequiredFrom Fuel Cel l
1
Boost Convoutput power onto bus (W)
l imit to max and min
cs_ pwr
bc_pwr_out_aTo Workspace9
bus_voltage
To Workspace4bc_eff
To Workspace3fc_pwr_out
To Workspace1
Product2
Product1
Product
???
Look-Up Table - Output Pwr given bus_voltage
???
Look-Up TableIn:bus_voltage Out: eff%
Limit CurrentOutput of Boost
[bus_voltage]
From<ess>
BlockNOTES
>=0
1
On/Off signal from control strategy
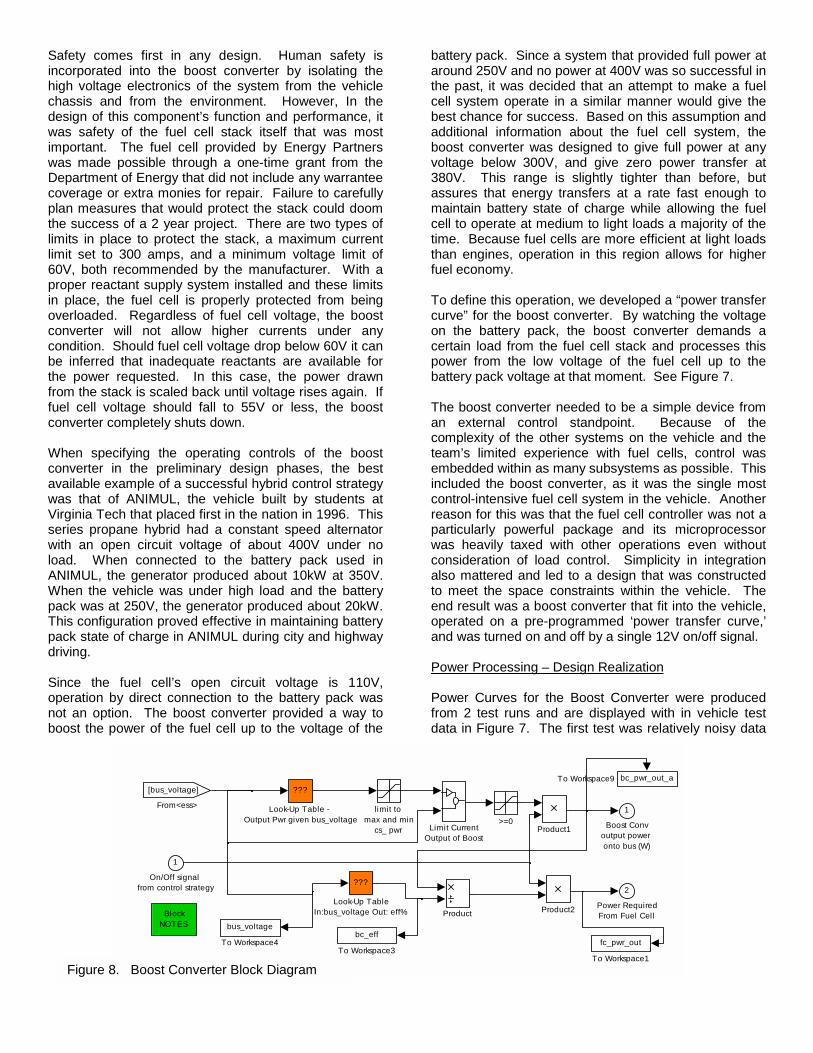
Figure 8. Boost Converter Block Diagram

provided by the manufacturer of the unit. In an effort toverify the accuracy of this data and to gain a betterunderstanding of how the device would function in the ahybrid vehicle a test session was arranged on an ABC-150 controlled DC power source that would simulate theoperation of the fuel cell, the boost converter was testedto approximately 80% of full power, limited by maximumcurrent available from the ABC-150. An attempt tomodel the fuel cell polarization curve was implementedon the ABC-150 by using a straight-line approximation.This approximation was coded into a script file thatvaried the ABC-150’s voltage levels to match 138kPa(20psi) fuel cell performance data collected by EnergyPartners. However, the ABC-150 was slow to respondto this script file and it could not properly simulate thefuel cell’s power curve at light load. Despite limitations,the results of this test were good, both in verifying themanufacturers data and in learning more about theoperating characteristics of the Boost Converter.
Lastly the boost converter was tested in the vehicle afterall systems were operational. However, it is important tonote that the fuel cell itself was slightly damaged prior todynamometer testing of the vehicle. It’s output voltagewas not as high as desired, causing the boost converterto protect the fuel cell from delivering maximum power.This affects the power transfer curve of the fuel cellsystem and prevents the vehicle from receiving as muchpower as it needs to maintain battery state of charge.
The model shown in Figure 8 recreates the action of theBoost Converter, the device that boosts power from the
~60V fuel cell to the ~330V battery pack. When thesystem is operating, this block transfers power to thePower Buss at a rate controlled by a 1-D lookup tablebased on in-vehicle testing. The input to this table is thecalculated battery pack voltage of the Energy StorageSystem (ESS) block to emulate the behavior of thebattery pack in the actual vehicle.
Further testing showed that the load following strategybuilt into the boost converter was not aggressive enoughto maintain adequate SOC during vehicle operation. Tocombat this the vehicle buss voltage was lowered bychanging the number of batteries in the string to 27.Seeing this lower average voltage, the boost converterwould go to a higher average load and help to maintain ahigher battery SOC.
NEW SIMULINK BLOCK DIAGRAM
Figure 9 shows the structure the block diagram thatmodels a series hybrid electric vehicle. Figure 10 showshow the vehicle layout, originally described in Figure 3,is incorporated into the new fuel cell block diagram. Thebasic flow of energy in an ICE series hybrid is the sameas that in a fuel cell hybrid however a fuel cell produceselectrical power, not speed and torque as the seriesmodel in Figure 9 requires.
To better model the Virginia Tech fuel cell hybrid theseries hybrid block diagram is altered to contain theproper components blocks and data files are loaded withinformation from the test phase of the project. This
wheel andaxle <wh>
vehicle <veh>
galtotal fuel used
(gal)
series hybridcontrol stategy
<cs>
powerbus <pb>
motor/control ler <mc>
generator/control ler <gc>
gearbox <gb>
fuelconverter
<fc>
final drive <fd>
exhaust sys<ex>
energystorage <ess>
drive cycle<cyc>
fc_emis
ex_calc
t
To Workspace
Version &Copyright
AND
emisHC, CO,
NOx, PM (g/s)
Clock
vehicle controls
<vc>
<sdo>
wheel andaxle <wh>
vehicle <veh>
fuel_use_grams_sec
total fuel used (grams/sec)
powerbus <pb>
motor/controller <mc>
gearbox <gb>final drive <fd>energy
storage <ess>
drive cycle<cyc>
t
To Workspace
Parasitic Loads
Version &Copyright
emisHC, CO,
NOx, PM (g/s)
Fuel Cell <fc>Fuel Cell Control Strategy
<cs>
ClockBoost Converter
<bc>
vehicle controls
<vc>
<sdo>
Figure 9. ADVISOR SeriesHybrid Block Diagram
Figure 10. Modified BlockDiagram - Fuel Cell System

model begins with the well validated electric drivetrainmodel that exists within ADVISOR (Senger, Merkle, andNelson, 1998) and adds the components that make upthe fuel cell system in the current Virginia Tech fuel cellhybrid electric vehicle.
RESULTS
Vehicle testing was performed at an emissions testfacility equipped with roller dynamometers capable ofperforming a range of tests including the Federal UrbanDriving Schedule (FUDS) and the Highway FuelEconomy Test (HWFET). See Figure 11. The VT FC-HEV completed each of these tests running on hydrogenas a fuel cell hybrid vehicle.
0.0
10.0
20.0
30.0
40.0
50.0
60.0
70.0
0 200 400 600 800 1000 1200 1400Time (s)
Vehi
cle
Spee
d (m
ph)
CityHighway
Figure 11. EPA City and Highway Driving Cycle SpeedTraces – mph vs. time
COMPARISON OF VEHICLE DATA TO MODEL DATA
The dynamometer tests were successful, however theproblems that developed prior to the testing meant thatthe vehicle did not operate as a charge sustaining hybridvehicle as it was designed. Damage to the hydrogenfuel cell prevented it from reaching higher power levelsthat would have provided enough power to maintain thecharge in the vehicle battery pack. Because of thereduced power, a net amount of energy was withdrawnfrom the battery during the cycle which would haveprevented operation after the batteries were dischargedcompletely. Had this damage not occurred, it is believedthat the system would have been able to sustain chargeduring successive cycles until the onboard hydrogenstorage was depleted.
Component Data
Because of the difference in the designed operatingparameters for the vehicle and the way the vehicleactually functioned, the original model that was based oncomponent data prior to vehicle construction had to bealtered slightly. The main change from the ideal modelof the vehicle was the power transfer model in the boost
converter. Because the fuel cell was not able to providethe expected power, that the boost converter accordinglylimited in the amount of power it could supply to thevehicle. This power transfer characteristic was altered inthe model to produce a behavior that matched thereduction in available power so the model could emulatethe way the vehicle performed.
It is immediately apparent that the plots of data from theboost converter manufacturer, from the out-of-vehicletesting, and from on vehicle testing do not totally agree.(See Figure 7) While this seems unusual, it is importantto notice that the vehicle test data and the system testdata do follow very similar trends. The reason for thislies within the fundamental design of the boostconverter, as much of the internal controls that relate itsoutput power to output voltage are preprogrammed toaccount for changes of both input and output voltages.Changes in these voltages greatly affect the powertransfer of the system. A design criterion even moreimportant than the power transfer curves above was theboost converter had to protect the fuel cell from beingoverloaded at any point in time. An abnormally low fuelcell voltage, such as that caused by fuel cell damage,would cause the boost converter to limit power output.
During normal operation a decrease in battery voltage atthe output terminals would cause an increase in powertransfer. In times when the fuel cell was unable toprovide the requested power and its voltage fell due tooverloading, the boost converter would relax its request.This meant that the boost converter’s behavior couldonly be characterized through testing methods thatexactly matched the behavior of the fuel cell polarizationcurve. The factors influencing this curve are sonumerous and system dependent (operating pressure,temperature, rate of reactant flow, etc) that accurateinformation could only be gathered from a full systemtest with the fuel cell as the power source.
In summary, system testing data shown in figure 14 isbelieved to represent the true operation of the of anundamaged fuel cell in the VT FC-HEV fuel cell system,while the “vehicle test data” plot represents how thesystem operated during the EPA test procedure with thedamaged fuel cell.
Time Based Data TrackingFigures 12 and 13 show the time history of datarecorded onboard the vehicle during dynamometertesting at Ford’s labs vs. the output of the ADVISORmodel of the VT FC-HEV.

-25000
-5000
15000
35000
55000
0 200 400 600 800 1000 1200 1400
Time (sec)
Pow
er (W
)
Data Model
Figure 12. City Cycle - Motor Power
-40000
-20000
0
20000
40000
60000
0 200 400 600 800Time (sec)Pow
er (W
)
Data Model
Figure 13. Highway Cycle – Drive Motor Power
As you can see, the model does a good job of trackingthe overall electrical power required to operate theelectric motor and the accessories on the vehicle datathroughout driving cycle. This is a critical first step tocreating an accurate model of a hybrid vehicle. Oncethe loads of the electric vehicle are quantified, the modelmust correctly determine how that power demand is splitbetween the battery pack and the fuel cell system.Because this split changes as battery state of chargeincreases or decreases, accurate modeling of the batterypack and of the boost converter that transfers powerfrom the fuel cell system is very important, as discussedabove.
0
2500
5000
7500
10000
0 200 400 600 800 1000 1200 1400Time (s)
Pow
er (W
)
DataModel
Figure 14. City Cycle – Fuel Cell System Net Power
0
2500
5000
7500
10000
0 200 400 600 800Time (s)
Pow
er (W
)
DataModel
Figure 15. Highway Cycle - Fuel Cell System Net Power
The graphs of power output of the fuel cell, seen inFigures 14 and 15, vary for two different reasons. Thefuel cell was operating in a diminished state due todamage incurred before the testing began. Because ofthis, combined with the fact that the fuel cell was cold atthe beginning of the FUDS test the system controllercommanded temporary shutdowns to protect the fuel cellfrom further damage. No compensation was made forthis in the model. On the highway cycle, an unexpectedproblem occurred with the vehicle controller that causedthe fuel cell to go into temporary shutdown near the endof the cycle. In this case, the model’s fuel cell startedlater than the fuel cell started during the actual test, butthis is accounted for by the fact that the fuel cell was offfor a matching amount of time. Any time the fuel cell isoff requires more power to be drawn from the batterypack to supply the loads onboard the vehicle. Duringtimes when this occurred, more power was required fromthe batteries, making the Amp Hour data plots divergeas seen in Figures 16 and 17.

-5-4.5
-4-3.5
-3-2.5
-2-1.5
-1-0.5
00 200 400 600 800 1000 1200 1400
Time (s)A
mp
hour
s DataModel
Figure 16. City Cycle – Battery Amp Hours Used
-8
-7
-6
-5
-4
-3
-2
-1
00 200 400 600 800
Time (s)
Am
p ho
urs
DataModel
Figure 17. Highway Cycle – Battery Amp Hours Used
Tracking vehicle buss voltage is most critical to theoperation of the VT FC-HEV. In both the vehicle and themodel, buss voltage is used as a signal to the fuel cellsystem to provide varied power to the buss under variedloads. In the model the Energy Storage Systemcomputes a buss voltage variable based oninstantaneous power demand and state of charge andoutputs this to the Boost Converter Block for processinginto a fuel cell system power request. See Figures 18and 19. To produce this output, the Energy StorageBlock was loaded with a battery model to match thecapacity an performance of the one in the VT FC-HEV
250
275
300
325
350
375
400
0 200 400 600 800 1000 1200 1400Time (s)
Volta
ge (V
)
DataModel
Figure 18. City Cycle - Battery Buss Voltage Tracking
200
225
250
275
300
325
350
375
400
0 200 400 600 800Time (s)
Volta
ge (V
)
DataModel
Figure 19. Highway Cycle - Buss Voltage Tracking
Further proof that buss voltage tracking and theupstream calculation of net power generated by the fuelcell system is accurate is shown in Figure 20. On areduced time scale of 100 seconds and a reduced powerscale of 4500W, the vehicle data and model resultsmatch very well.
4000
5500
7000
8500
300 320 340 360 380 400Time (s)
Pow
er (W
)
Data Model
Figure 20. Detailed Data Tracking
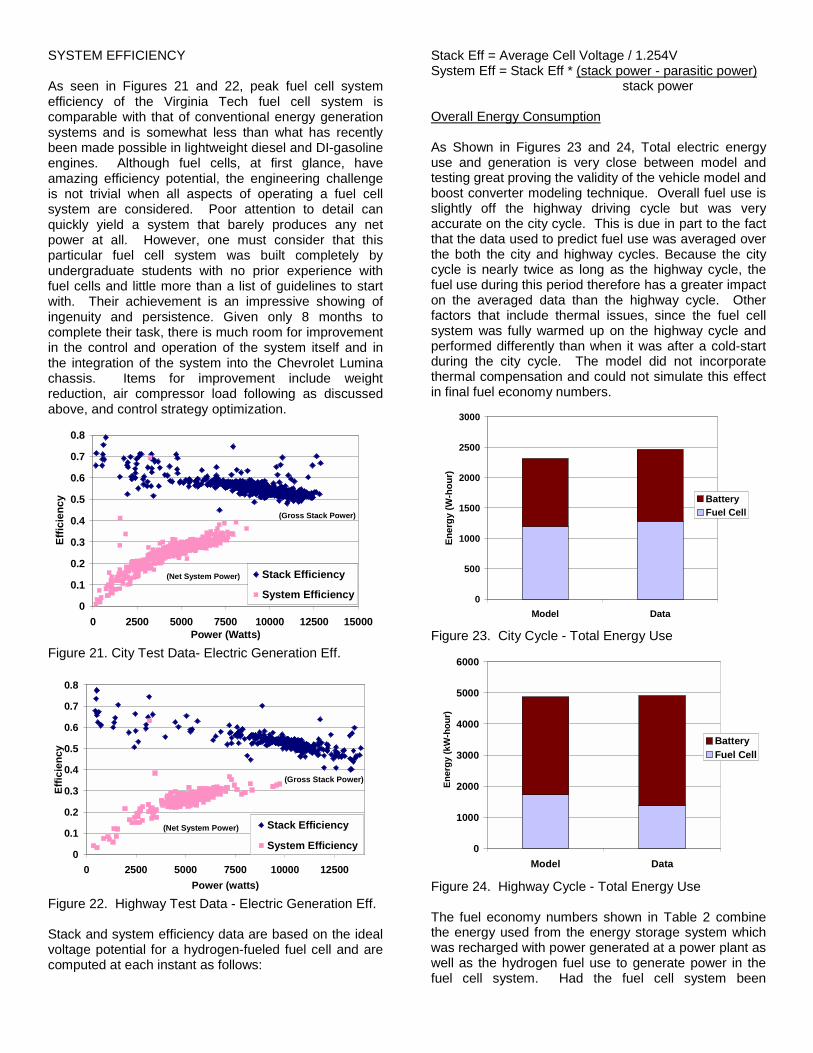
SYSTEM EFFICIENCY
As seen in Figures 21 and 22, peak fuel cell systemefficiency of the Virginia Tech fuel cell system iscomparable with that of conventional energy generationsystems and is somewhat less than what has recentlybeen made possible in lightweight diesel and DI-gasolineengines. Although fuel cells, at first glance, haveamazing efficiency potential, the engineering challengeis not trivial when all aspects of operating a fuel cellsystem are considered. Poor attention to detail canquickly yield a system that barely produces any netpower at all. However, one must consider that thisparticular fuel cell system was built completely byundergraduate students with no prior experience withfuel cells and little more than a list of guidelines to startwith. Their achievement is an impressive showing ofingenuity and persistence. Given only 8 months tocomplete their task, there is much room for improvementin the control and operation of the system itself and inthe integration of the system into the Chevrolet Luminachassis. Items for improvement include weightreduction, air compressor load following as discussedabove, and control strategy optimization.
0
0.1
0.2
0.3
0.4
0.5
0.6
0.7
0.8
0 2500 5000 7500 10000 12500 15000Power (Watts)
Effic
ienc
y
Stack Efficiency
System Efficiency
(Gross Stack Power)
(Net System Power)
Figure 21. City Test Data- Electric Generation Eff.
0
0.1
0.2
0.3
0.4
0.5
0.6
0.7
0.8
0 2500 5000 7500 10000 12500Power (watts)
Effic
ienc
y
Stack Efficiency
System Efficiency
(Gross Stack Power)
(Net System Power)
Figure 22. Highway Test Data - Electric Generation Eff.
Stack and system efficiency data are based on the idealvoltage potential for a hydrogen-fueled fuel cell and arecomputed at each instant as follows:
Stack Eff = Average Cell Voltage / 1.254VSystem Eff = Stack Eff * (stack power - parasitic power)
stack power
Overall Energy Consumption
As Shown in Figures 23 and 24, Total electric energyuse and generation is very close between model andtesting great proving the validity of the vehicle model andboost converter modeling technique. Overall fuel use isslightly off the highway driving cycle but was veryaccurate on the city cycle. This is due in part to the factthat the data used to predict fuel use was averaged overthe both the city and highway cycles. Because the citycycle is nearly twice as long as the highway cycle, thefuel use during this period therefore has a greater impacton the averaged data than the highway cycle. Otherfactors that include thermal issues, since the fuel cellsystem was fully warmed up on the highway cycle andperformed differently than when it was after a cold-startduring the city cycle. The model did not incorporatethermal compensation and could not simulate this effectin final fuel economy numbers.
0
500
1000
1500
2000
2500
3000
Model Data
Ener
gy (W
-hou
r)
BatteryFuel Cell
Figure 23. City Cycle - Total Energy Use
0
1000
2000
3000
4000
5000
6000
Model Data
Ener
gy (k
W-h
our)
BatteryFuel Cell
Figure 24. Highway Cycle - Total Energy Use
The fuel economy numbers shown in Table 2 combinethe energy used from the energy storage system whichwas recharged with power generated at a power plant aswell as the hydrogen fuel use to generate power in thefuel cell system. Had the fuel cell system been

functioning at full power, the energy storage systemwould have remained nearly charged and the majority ofthe power would have been generated directly fromhydrogen.
Table 2.MPGGE Highway CityVT_FuelCell ModelPrediction
28.3 29.1
Data: from tank pressure 26.8 29.1
CONTINUED MODELING EFFORTS
The VT FC-HEV ADVISOR model provides a reasonablyaccurate model of the vehicle and the interconnection ofvehicle and the fuel cell systems that are specific to theVirginia Tech design. Its disadvantages are that itrequires a very accurate model of the vehicle’s energystorage system and load-following power transfersystem. This model is not versatile enough in its currentform to be released into the ADVISOR environment forpublic usage. Therefore, a more generalized model wasdeveloped following the proven themes used in the initialmodel. This new “generic” model individuallyincorporates the behaviors of the fuel cell stack, reactantsupply systems, and cooling systems to form a moreintegrated, thorough model.
This new model of a fuel cell system includes avenuesto ease entry of new fuel cell data, and even
incorporates a thermal model to help approximate theaffect of cold starts on fuel consumption of a fuel cellstack. Work continues with NREL to complete theintegration of this model into a release version ofADVISOR. Further work also includes modeling of theVT FC-HEV in its as-designed state with all systemsfunctioning at full capability. This model is expected toshow better fuel economy as well as be chargesustaining over the EPA driving cycles.
Validation of the "Generic Fuel Cell Model"
This model of a fuel cell system in ADVISOR is designedto integrate the new "Generic Fuel Cell Model" into thedefault series hybrid vehicle model for comparison todata from the 1999 FutureCar Challenge. Several majorchanges have been made from the originalVT_FUELCELL model discussed up to this point, in anattempt to better represent actual vehicular fuel cellsystems. The goal of these changes was to produce amodel that is more straightforward and allows useraccess to system level and stack parameters.
Figure 27 compares the 1999 FutureCar Challenge datato the “Generic Model” results. However, rather thanuse the standard series power follower control strategyfound in ADVISOR, a “boost converter style” of powerrequest, based on buss voltage, was used to commandthe power level of the fuel cell system block. Thefollowing power history plot (Figure 27) shows that this
wheel and
axle <wh>veh icle <veh>
fuel_use_grams_sec
total fuel used (gram s/sec)
power
bus <pb>
m otor/
contro l le r <m c>
gearbox <gb>
fue l cel l hybrid
contro l sta tegy
<cs>fue l ce l l
system <fc>
fina l dri ve <fd>energy
sto rage <ess>
dri ve cycle
<cyc>
t
T o Workspace
Version &
Copyrigh t
Clock
vehicle contro l s
<vc>
<sdo>
wh ee l an d
axl e <wh >
ve h icle <ve h>
ga l
to ta l fue l used (ga l )
p rev va lue
power
b us <pb >
m o to r/
co n tro l le r <m c>
g ea rbo x <gb>
fu e l
conve rte r
< fc> fo r fue lce l l
fi na l d ri ve <fd>
exhau st sys
<e x>
en e rg y
sto ra ge <ess>
d ri ve cycle
<cyc>
fc_ em is
ex_ ca lc
t
T o Workspace
T erm ina to r
V e rsion &
Copyrig h t
A ND
em is
HC, CO,NOx, PM (g/s)
Fue l Ce l l
Con tro l S tra te gy
<cs>
Clo ckB oost Co nve rte r
<b c>
veh icl e con tro ls
<vc>
<sdo>
Figure 25. Generic Fuel Cell Model
Figure 26. Generic Block Diagram with Boost Converter

new model, combined with the boost converter controlmethodology, functions accurately.
0
2500
5000
7500
10000
0 250 500 750 1000 1250Time (s)
Pow
er (W
)
Data Model
Figure 27. City Cycle - Fuel Cell System Power Tracking
Using this method, the power tracking and energy usefor the generic fuel cell system much more closelyresembled the test data.
0
500
1000
1500
2000
2500
3000
Model Data
Ener
gy (W
-hou
r)
BatteryFuel Cell
Future 28. Energy Use - new ‘generic’ fuel cell model
Current status / Conclusions
The generic fuel cell model incorporated into ADVISOR2.2 accounts for the major aspects of a fuel cell system.It allows for load following of fuel cell parasitic systemloads, and has a fully separate power demand block(control strategy) instead of an integrated boostconverter. Most importantly, the model provides theability to perform parametric analysis on various fuel cellsystem parameters. Researchers at VT feel that thismodel provides a good representation of how a fuel cellsystem works (and how the VT system would haveworked if not for system damage before testing). Theoriginal VT model showed that a fuel cell hybrid can bemodeled in ADVISOR and matched to test data.Although no vehicle-level data exists to validate the newADVISOR "generic” fuel cell model, VT recommends itsfuture use for vehicle-level modeling of automotive fuelcell systems.
CONCLUSIONS
The Hybrid Electric Vehicle Team of Virginia Tech wassuccessful in its attempt to convert a 5-passenger sedanto fuel cell power and the resulting data validated thenew ADVISOR fuel cell system model. Testing of thefuel cell system and vehicle components yielded datathat was used to determine overall fuel cell systemefficiency, vehicle energy flow, and fuel usage. Usingthis data, a model of the VT FC-HEV was incorporatedinto ADVISOR. This model included a power sharingmodel to determine the load sharing between the fuelcell and the energy storage system for a given vehiclepower demand. This model accurately represented thevehicle as it performed during real world testing.Comparison to vehicle test data shows that total fuel cellsystem energy production, total energy usage from thevehicle energy storage system, and total vehicleelectrical energy use agree to within 10% in all cases.Overall vehicle fuel economy was accurate to within 1%on the city driving cycle and 6% on the highway drivingcycle.
FUTURE WORK
To better model fuel cell vehicles, deeper investigation ofthe many complex issues involved is needed. Severalcritical areas of design that have a major impact onvehicle efficiency have been identified. The first area isan analysis into hybridization of fuel cell vehicles and theimpact of drivetrain weight vs. drivetrain efficiency. Purefuel cell vehicles generally weigh less than hybrid fuelcell vehicles, but do not have the capability ofregenerative energy storage. Optimization of the degreeof hybridization (size of battery vs. size of fuel cell) mayyield a more efficient design overall.
Critical to the success of any vehicle is properoptimization of control systems to meet vehicle powerneeds over a range of driving conditions. In addition tovehicle level controls, system level controls andespecially thermal control have a great impact on fuelcell efficiency. Better modeling of thermal characteristicsis vital to an accurate understanding of fuel cell system.
ACKNOWLEDGEMENTS
This work was sponsored by The National RenewableEnergy Laboratory under contractXCL-8-18086-01.
NREL would like to thank the U.S. Department of Energyfor continued support in the area of vehicle systemsanalysis and ADVISOR development.
The Hybrid Electric Vehicle Team of Virginia Techextends its deepest thanks to Virginia Power for use if itsABC-150 for testing.

REFERENCES
Wipke, K., Cuddy, M., Burch, S., "ADVISOR 2.1: A User-Friendly Advanced Powertrain Simulation Using aCombined Backward/Forward Approach," IEEETransactions on Vehicular Technology: Special Issue onHybrid and Electric Vehicles, Nov. 1999.
Senger, R. D., M. A. Merkle, and D. J. Nelson (1998),"Validation of ADVISOR as a Simulation Tool for aSeries Hybrid Electric Vehicle," Technology for Electricand Hybrid Vehicles, Proceedings of the 1998 SAE Intl.Congress, Detroit, MI, Feb. 23-26, SAE Paper 981133,SP-1331, pp 95-115.
William Luttrell, Brian King, Scott Postle, RobertFahrenkrog, Michael Ogburn, Douglas J. Nelson, (2000),"Integration of Fuel Cell Technology into the VirginiaTech 1999 Hybrid Electric FutureCar," submitted toProceedings of the 1999 FutureCar Challenge, June 2-9,1999, Auburn Hills, MI, to be published by SAE, 15pages.
Gromatzky, J., M. J. Ogburn, A. Pogany, C. A. Pare, J.Hutchinson, and D. J. Nelson (1999), "Integration of FuelCell Technology into the Virginia Tech 1998 HybridElectric FutureCar," Proceedings of the 1998 FutureCarChallenge, June 3-10, 1998, Auburn Hills, MI, publishedby SAE, SP-1452, Mar. 1999, 15 pages.
Senger, R. D., M. A. Merkle, and D. J. Nelson (1998),"Design and Performance of the 1997 Virginia TechHybrid Electric FutureCar," Proceedings of the 1997FutureCar Challenge, SAE SP-1359, pp. 99-112.