modeling driver behavior and aggressiveness using ... · modeling driver behavior and...
TRANSCRIPT

Report # MATC-KU: 153-1 Final ReportWBS: 25-1121-0005-153-1
Modeling Driver Behavior and Aggressiveness Using Biobehavioral Methods - Phase I
Alexandra Kondyli, Ph.D.Asssistant ProfessorDepartment of Civil, Environmental, and Architectural EngineeringUniversity of Kansas
2018
A Cooperative Research Project sponsored by U.S. Department of Transportation- Office of the AssistantSecretary for Research and Technology
The contents of this report reflect the views of the authors, who are responsible for the facts and the accuracy of the information presented herein. This document is disseminated in the interest of information exchange. The report is
funded, partially or entirely, by a grant from the U.S. Department of Transportation’s University Transportation Centers Program. However, the U.S. Government assumes no liability for the contents or use thereof.
MATC
Evangelia G. Chrysikou, Ph.D.Associate ProfessorDepartment of PsychologyDrexel University
Christopher H. Ramey, Ph.D.Department of PsychologyDrexel University
Vishal C. Kummetha, M.S.Graduate ResearcherDepartment of Civil, Environmental, and Architectural EngineeringUniversity of Kansas

Modeling Driver Behavior and Aggressiveness Using Biobehavioral Methods - Phase I
Alexandra Kondyli, Ph.D. Assistant Professor Department of Civil, Environmental, and Architectural Engineering University of Kansas
Evangelia G. Chrysikou, Ph.D. Associate Professor Department of Psychology Drexel University
Christopher H. Ramey, Ph.D. Department of Psychology Drexel University
Vishal C. Kummetha, M.S. Graduate Researcher Department of Civil, Environmental, and Architectural Engineering University of Kansas
A Report on Research Sponsored by
Mid-America Transportation Center
University of Nebraska–Lincoln
December 2018

ii
TECHNICAL REPORT DOCUMENTATION PAGE
1. Report No.25-1121-0005-153-1
2. Government Accession No. 3. Recipient’s Catalog No.
4. Title and SubtitleModeling Driver Behavior and Aggressiveness Using Biobehavioral Methods - Phase I
5. Report DateDecember 14, 2018 6. Performing Organization Code
7. Author(s)Alexandra Kondyli, Ph.D. https://orcid.org/0000-0002-3462-0000, Evangelia Chrysikou, Ph.D. http://orcid.org/0000-0001-9529-183X, Christopher Ramey, Ph.D. https://orcid.org/0000-0002-6542-3990 Vishal Kummetha, https://orcid.org/0000-0001-9464-6838
8. Performing Organization Report No.25-1121-0005-153-1
9. Performing Organization Name and AddressThe University of Kansas 1530 W 15th Street Lawrence, KS 66045
10. Work Unit No.
11. Contract or Grant No.69A3551747107
12. Sponsoring Agency Name and AddressMid-America Transportation Center 2200 Vine St. PO Box 830851 Lincoln, NE 68583-0851
13. Type of Report and Period CoveredFinal Report (December 2016-December 2018) 14. Sponsoring Agency CodeMATC TRB Rip No. 91994-16
15. Supplementary NotesConducted in cooperation with the U.S. Department of Transportation, Federal Highway Administration.
16. AbstractMathematical models of car-following, lane changing, and gap acceptance are mostly descriptive in nature and lack decisionmaking or error tolerance. Including additional driver information with respect to behavior and cognitive characteristics wouldaccount for these lacking parameters and incorporate a human aspect to these models. Car-following, particularly in relation to theintelligent driver model (IDM), is the primary component of this research. The major objectives of this research are to investigatehow psychophysiological constructs can be modeled to replicate car-following behavior, and to correlate subjective measures ofbehavior and aggressiveness with actual car-following behavior. To accomplish the objectives the following tasks are required:perform a thorough literature review, develop the methodological framework, set up a driving simulator study to collect relevantdata, classify drivers with respect to their static and behavioral traits, and calibrate the IDM. This report presents the first part ofthis study, and includes the thorough literature review, and the methodological framework that will be used to incorporatebiobehavioral parameters into the IDM. The data collection plan to execute the methodology involves collecting driving data from90 participants using a driving simulator, and this will be completed in the second phase of the project. Various car-following taskswill be performed at multiple task difficulties. This will provide data on compensatory and performance effects experienced bydrivers. Modification to the IDM will be made to incorporate any observed trends between driver classes, behavior, andperformance.
17. Key WordsWorkload, situation awareness, biobehavioral, car-following
18. Distribution StatementNo restrictions.
19. Security Classif. (of this report)Unclassified
20. Security Classif. (of thispage)Unclassified
21. No. of Pages64
22. Price
Form DOT F 1700.7 (8-72) Reproduction of completed page authorized

iii
Table of Contents
Chapter 1 Introduction .................................................................................................................... 1 1.1 Problem Statement ........................................................................................................ 1 1.2 Objectives ..................................................................................................................... 1 1.3 Outline of the Report .................................................................................................... 3
Chapter 2 Literature Review ........................................................................................................... 4 2.1 Driver Behavior Models ............................................................................................... 4
2.1.1 Psycho-Physical Car Following Models ........................................................ 5 2.1.2 Intelligent Driver Model (IDM) ..................................................................... 9 2.1.3 Human Driver Model (HDM) ...................................................................... 16
2.2 Situation Awareness, Workload, and Level of Activation ......................................... 17 2.2.1 Situation Awareness (SA) ............................................................................ 17 2.2.2 Workload (WL) ......................................................................................... 20 2.2.3 Level of Activation (LA) ............................................................................. 29
2.3 Relationship Between WL, SA, LA and Performance ............................................... 30 Chapter 3 Methodology ................................................................................................................ 33
3.1 Proposed Modification to the IDM ............................................................................. 37 3.2 Data Collection Techniques ........................................................................................ 39
Chapter 4 Data Collection Plan..................................................................................................... 41 4.1 Participant Recruitment .............................................................................................. 41
4.1.1 Mood and Personality Measure ................................................................... 41 4.1.2 Empathy and Moral Decision-Making Measures ........................................ 42 4.1.3 Attention and Executive Function Measures ............................................... 43
4.2 Configuring the EEG, HR Monitor, and Eye Tracker ................................................ 43 4.3 Scenario Design and Pilot Testing .............................................................................. 44 4.4 Data Collection ........................................................................................................... 47 4.4 Statistical Analysis Plan .............................................................................................. 49
Chapter 5 Summary and Future Plan ............................................................................................ 51 References ..................................................................................................................................... 52 Appendix A: Internet Information Statement ............................................................................... 58 Appendix B: IRB Approval Letter ................................................................................................ 59 Appendix C: Flyer for Recruiting Participants ............................................................................. 60 Appendix D: Informed Consent Document .................................................................................. 61

iv
List of Figures
Figure 2.1 Wiedemann car-following model (Wiedemann 1974) .................................................. 6 Figure 2.2 Fritzsche car-following model (Olstam 2004) .............................................................. 8 Figure 2.3 Urban traffic psycho-physical model (Schulze & Fliess 1997) ..................................... 9 Figure 2.4 Task demand and capability interface (Fuller 2005) ................................................... 12 Figure 2.6 Regimes of the HDM................................................................................................... 17 Figure 2.7 Levels of SA in relation to decision making and performance (Endsley 1995) .......... 18 Figure 2.8a Regions of the brain (Lehr 2015) ............................................................................... 25 Figure 2.8b Regions of the brain (Lehr 2015) .............................................................................. 25 Figure 2.9 EEG electrode positions .............................................................................................. 26 Figure 2.10 Sensitivity of workload measures (De Waard 1996) ................................................. 28 Figure 2.11 Relationship of WL, LA, and performance (Young et al. 2015) ............................... 30 Figure 2.12 Mind wandering and WL (Zhang & Kumada 2017) ................................................. 31 Figure 3.1 Methodological framework ......................................................................................... 33 Figure 3.2 Theoretical framework for classifying drivers and incorporating biobehavioral
parameters ............................................................................................................................. 36 Figure 4.1 Highway layout of the actual scenario ........................................................................ 47 Figure 4.2 Layout of the KU driving simulator ............................................................................ 48 Figure 4.3 KU driving simulator in action .................................................................................... 48

v
List of Tables
Table 2.1 Typical IDM Constraints (Kesting & Treiber 2013) .................................................... 11 Table 3.1 Measuring techniques aggregated by the coefficient .................................................... 40 Table 4.2 Time breakdown by activity ......................................................................................... 45 Table 5.1 Timeline for the next year ............................................................................................. 51

vi
List of Abbreviations
Detection Response Task (DRT) Driving Activity Load Index (DALI) Electrocardiography (ECG) Electroencephalography (EEG) Heart Rate (HR) Heart Rate Variability (HRV) Human Driver Model (HDM) Human Research Protection Program (HRPP) Institutional Review Board (IRB) Intelligent Driver Model (IDM) Level of Activation (LA) Mid-America Transportation Center (MATC) National Aeronautics and Space Administration (NASA) Nebraska Transportation Center (NTC) Peripheral Detection Task (PDT) Situation Awareness (SA) Situation Awareness Global Assessment Technique (SAGAT) Situation Awareness Rating Technique (SART) Situation Present Assessment Method (SPAM) Standard Deviation (SD) The University of Kansas (KU) Task Load Index (TLX) Task-Evoked Pupillary Response (TERP) Useful Field of View (UFOV) Workload (WL)

vii
Disclaimer
The contents of this report reflect the views of the authors, who are responsible for the
facts and the accuracy of the information presented herein. This document is disseminated in the
interest of information exchange. The report is funded, partially or entirely, by a grant from the
U.S. Department of Transportation’s University Transportation Centers Program. However, the
U.S. Government assumes no liability for the contents or use thereof.

viii
Abstract
Mathematical models of car-following, lane changing, and gap acceptance are mostly
descriptive in nature and lack decision making or error tolerance. Including additional driver
information with respect to behavior and cognitive characteristics would account for these
lacking parameters and incorporate a human aspect to these models. Car-following, particularly
in relation to the intelligent driver model (IDM), is the primary component of this research. The
major objectives of this research are to investigate how psychophysiological constructs can be
modeled to replicate car-following behavior, and to correlate subjective measures of behavior
and aggressiveness with actual car-following behavior. To accomplish the objectives the
following tasks are required: perform a thorough literature review, develop the methodological
framework, set up a driving simulator study to collect relevant data, classify drivers with respect
to their static and behavioral traits, and calibrate the IDM.
This report presents the first part of this study, and includes the thorough literature
review, and the methodological framework that will be used to incorporate biobehavioral
parameters into the IDM. The data collection plan to execute the methodology involves
collecting driving data from 90 participants using a driving simulator, and this will be completed
in the second phase of the project. Various car-following tasks will be performed at multiple task
difficulties. This will provide data on compensatory and performance effects experienced by
drivers. Modification to the IDM will be made to incorporate any observed trends between driver
classes, behavior, and performance.

1
Chapter 1 Introduction
1.1 Problem Statement
Driver behavior is a significant contributor to traffic operational quality and safety, and it
is also an important element in traffic simulation tools. These tools allow for driver variability
through various distributions. In addition, the mathematical models of car-following, lane
changing, and gap acceptance are mostly descriptive in nature. As a result, these tools do not
accurately describe traffic phenomena such as breakdowns or capacity drop and consequently,
calibration efforts to field data are needed. Also, the majority of tools are “collision-free” by
default, therefore, estimating surrogate safety measures based on these models would be
inaccurate. As such, additional information of driver behavior from the cognitive sciences could
significantly enhance the ability of existing models and simulator to replicate field conditions.
Biobehavioral aspects encompass the variability of cognitive workload and situation
awareness with the driving behavior of individuals. In this study, variables such as preferred
headway, speed, acceleration, and deceleration, are used together with variations in mental
workload, changes in situation awareness, and static driver properties to categorize individuals.
Although the exact definition for driver behavior will be the outcome of this study, drivers can
be generally grouped into three main categories, conservative, average, and aggressive. Where
average drivers represent the characteristics exhibited by the majority of the sample population,
and conservative and aggressive drivers represent the lower and upper quartiles of the sample
population, respectively.
1.2 Objectives
The major goals of this research are to investigate how psychophysiological constructs
can be modeled to replicate car-following behavior, and to correlate subjective measures of

2
behavior and aggressiveness with actual car-following behavior. This research is divided in two
parts. Part I, which is the focus of this research report, summarizes the literature review
comprising of techniques and past studies aimed at incorporating behavioral aspects into traffic
models. It also includes the methodological setup of the experiments to be conducted with the
use of a driving simulator, as well as survey questionnaires related to driver behavior. Part II of
this research project will execute the data collection and model development, and will commence
with the completion of Part I.
The specific tasks to be carried out in both parts of this research project are as follows:
• Conduct a thorough literature review comprising of techniques and past studies aimed
at incorporating behavioral aspects into traffic models. Including parameters used to
categorize drivers into conservative, average, and aggressive;
• Develop the methodological framework to incorporate behavioral aspects into an
existing car-following model (i.e., the IDM);
• Classify drivers by self-reported/subjective measures (PANAS, decision making,
NASA-TLX (Task load index), attention and executive, and screening
questionnaires), biobehavioral measures (level of activation, heart rate, pupil dilation,
and gaze fixation), and performance measures (speed, acceleration, headway,
standard deviation (SD) steering wheel angle, and SD of lateral position);
• Collect static and dynamic behavioral parameters using a driving simulator study with
90 drivers;
• Analyze data to establish activation level, compensation, and performance thresholds
for the different types of driver classifications (conservative, average, and
aggressive); and

3
• Incorporate attained thresholds into the intelligent driver model (IDM) and compare
the predictive capability to the unaltered IDM. Validate the feasibility of the modified
IDM using data not used for model development.
1.3 Outline of the Report
The report starts by presenting the problem statement and objectives in the first chapter.
Chapter 2 presents the literature review findings on car-following models, behavioral
components such as situation awareness, workload, and level of activation, experimental
techniques, and existing biobehavioral methodologies. The methodological plan is described in
Chapter 3, while the data collection plan is presented in Chapter 4. Finally, a short summary is
presented along with the future schedule.

4
Chapter 2 Literature Review
This section provides a detailed review of some of the existing car-following models,
especially those that have been used to incorporate some sort of biobehavioral architecture. This
chapter also includes literature related to the definitions of several biobehavioral parameters,
their measurement methods, and their relationship. Literature were obtained from several journal
articles, theses, and publications. Online resources such as Google Scholar, ScienceDirect,
University of Kansas (KU) Library resources, WorldCat, and Transportation Research
International Documentation (TRID) were used.
2.1 Driver Behavior Models
Driver behavior models have significantly evolved from the first established Greenshields
single regime model. The Greenshields model is a starting point for several other more complex
traffic flow models such as the Pipes, Lighthill–Whitham–Richards (LWR), Gas kinetic (GK),
Edie, Newell, and Drake, listed in a chronological order (Wageningen-Kessels et al. 2015).
Car-following models are an important sub-category of traffic flow. The concept of car-
following was first introduced by Pipes in 1953. In 1958, a stimulus-response based approach
was developed by Gazis-Herman-Rothery (GHR) in the General Motors laboratories
(Saifuzzaman & Zheng 2014). The GHR model relied on a few inaccurate assumptions such as
the following driver being able to accurately perceive small changes in speed and react to
changes in speed even at very large headways. The need for a more adaptive model that better
depicts the car-following behavior led to the establishment of psycho-physical models, that
incorporate a certain level of human perspective. This establishes a more realistic approach to
model traffic, considering that vehicles are controlled by humans with varying physical and
mental restraints.

5
A discussion consisting of existing psycho-physical models and a few other car-following
models such as the intelligent driver model, human driver model, are presented in the sections
that follow.
2.1.1 Psycho-Physical Car Following Models
Psycho-physical models, as the name suggests, incorporate both psychological and
physical dynamics of drivers into the car following algorithms. They are entirely based on how
drivers react to the actions of the lead vehicle and assume similar perception thresholds for all
drivers (Schulze & Fliess 1997). This major assumption fails to consider the behavior and
driving preferences of the individual operating the vehicle. For example, some individuals prefer
maintaining shorter headways and accelerate more rapidly, affecting the overall flow and
throughput of the roadway. This section presents a detailed review of the existing psycho-
physical car following models and their mechanics.
2.1.1.1 Wiedemann (VISSIM)
This is one of the most well-known psycho-physical models and it acts as the foundation
behind the car following algorithm in VISSIM. After first being established in 1974, the model
has been constantly modified and calibrated to suit various scenarios.
The Wiedemann model considers six main thresholds as shown in figure 2.1. AX: The
desired bumper to bumper spacing between two successive standstill vehicles, BX: The
minimum desired headway expressed as a function of AX, speed, and distance, Closing delta
velocity (CLDV): Deceleration resulting from the application of brakes because speed of vehicle
is greater than the leader, SDV: The point at which the driver perceives a lead vehicle traveling
at a slower velocity, OPDV: The point during a drive when the driver realizes that he/she is
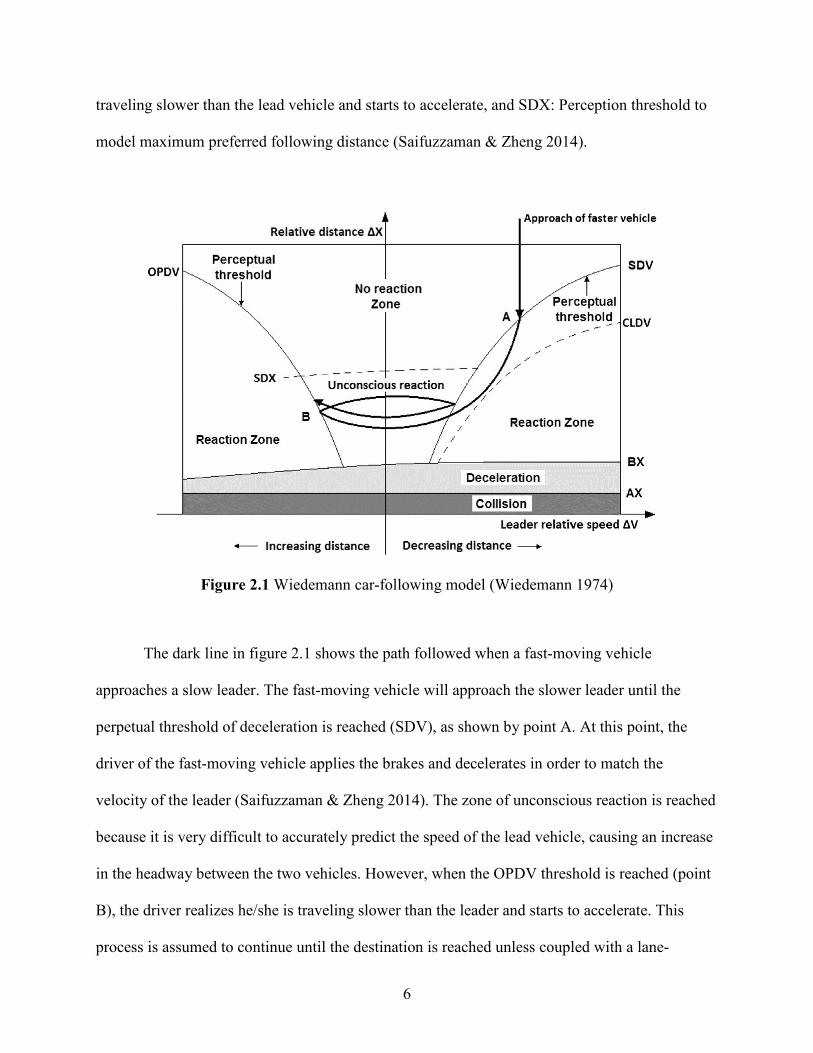
6
traveling slower than the lead vehicle and starts to accelerate, and SDX: Perception threshold to
model maximum preferred following distance (Saifuzzaman & Zheng 2014).
Figure 2.1 Wiedemann car-following model (Wiedemann 1974)
The dark line in figure 2.1 shows the path followed when a fast-moving vehicle
approaches a slow leader. The fast-moving vehicle will approach the slower leader until the
perpetual threshold of deceleration is reached (SDV), as shown by point A. At this point, the
driver of the fast-moving vehicle applies the brakes and decelerates in order to match the
velocity of the leader (Saifuzzaman & Zheng 2014). The zone of unconscious reaction is reached
because it is very difficult to accurately predict the speed of the lead vehicle, causing an increase
in the headway between the two vehicles. However, when the OPDV threshold is reached (point
B), the driver realizes he/she is traveling slower than the leader and starts to accelerate. This
process is assumed to continue until the destination is reached unless coupled with a lane-

7
changing model. Another iteration of the Wiedemann model was also developed specifically to
address driving behavior in a freeway facility (Wiedemann 99). Wiedemann 99 also has nine
calibration parameters that allow for a more user adjustable model.
In 1998, Fancher and Bareket, proposed a new space known as the “comfort zone” to the
Wiedemann model. This zone acts as a threshold for the desired spacing acceptable by the driver
as a result of being unable to accurately perceive speed differences (Saifuzzaman & Zheng
2014).
2.1.1.2 Fritzsche (Paramics)
The Fritzsche model is a psycho-physical model first established in 1994. The model has
been incorporated in traffic simulation software such as Paramics and is capable of introducing
human perception to the car-following (Olstam 2004). There are six main thresholds for this
model and they include: perception of negative speed difference (PTN), perception of positive
speed difference (PTP), desired speed (AD), risky distance (AR), safe distance (AS), and braking
distance (AB). The thresholds together form five regions: free driving, danger, following I,
following II, and closing in, as shown in figure 2.2. Each region captures a specific aspect of car-
following as experienced by the driver. The Fritzsche model assumes that a driver will only
decelerate when in “danger” or “closing in” to the lead vehicle (Saifuzzaman & Zheng 2014).

8
Figure 2.2 Fritzsche car-following model (Olstam 2004)
2.1.1.3 Urban Traffic Psycho-Physical Model
The urban traffic model was established by Schulze and Fliess, in 1997. The phase
diagram of the model is shown in figure 2.3 and can be interpreted as a combination of the
Wiedemann and the Fritzsche car-following models. The phase diagram shows seven defined
regimes, namely: Free driving I, Free driving II, Approximating I, Approximating II, Following
I, Following II, and Danger. The green line shows the trajectory of the following vehicle with
respect to the changes in the driving regimes.

9
Figure 2.3 Urban traffic psycho-physical model (Schulze & Fliess 1997)
2.1.2 Intelligent Driver Model (IDM)
The IDM model is one of the most commonly used microscopic car-following model.
The simplicity of this model with respect to the fewer number of parameters available, makes it
easy to apply and calibrate (Hoogendoorn et al. 2012). The IDM captures both the desired speed
and desired headway of the driver as shown in equation 2.1 (Saifuzzaman & Zheng 2014).
𝑎𝑎𝑛𝑛(𝑡𝑡) = 𝑎𝑎𝑚𝑚𝑚𝑚𝑚𝑚 �1 − �𝑣𝑣𝑛𝑛(𝑡𝑡)𝑣𝑣0(𝑡𝑡)
�𝛿𝛿
− �𝑠𝑠∗𝑛𝑛(𝑡𝑡)𝑠𝑠𝑛𝑛(𝑡𝑡)
�2
� (2.1)
𝑠𝑠∗𝑛𝑛(𝑡𝑡) = 𝑠𝑠∗�𝑣𝑣𝑛𝑛(𝑡𝑡),∆𝑣𝑣𝑛𝑛(𝑡𝑡)� = 𝑠𝑠0 + 𝑠𝑠1�𝑣𝑣𝑛𝑛(𝑡𝑡)𝑣𝑣0(𝑡𝑡)
+ 𝑇𝑇𝑛𝑛𝑣𝑣𝑛𝑛(𝑡𝑡) +𝑣𝑣𝑛𝑛(𝑡𝑡)∆𝑣𝑣𝑛𝑛(𝑡𝑡)
2�𝑎𝑎𝑚𝑚𝑚𝑚𝑚𝑚𝑏𝑏𝑑𝑑𝑑𝑑𝑑𝑑

10
Where,
an(t) is the acceleration of the vehicle at time t
amax is the maximum acceleration of the vehicle
v0(t) is the desired speed
vn(t) is the actual speed at time t
Δvn(t) is the approaching rate at time t
s*n(t) is the desired minimum gap between two vehicles
s0 is the minimum spacing at standstill
sn(t) is the spacing between two vehicles
bcomf is the comfortable deceleration
Tn is the desired time headway
𝛿𝛿 characterizes how acceleration decreases with speed
Researchers studying the IDM have established typical values for city and highway
settings (Kesting & Treiber 2013). However, these values can usually be tweaked within the
constraints to provide a better calibrated model. A summary of typical values along with model
constraints are shown in table 2.1.

11
Table 2.1 Typical IDM Constraints (Kesting & Treiber 2013)
Parameter Typical City Values
Typical highway values Constraints
Desired speed, v0 15.0 m/s 33.3 m/s 1 to 70 m/s Time headway, Tn 1.0 s 1.0 s 0.1 to 5 s Minimum spacing, s0 2 m 2 m 0.1 to 8 m Acceleration component, 𝛿𝛿 4 4 1 to ∞ Maximum acceleration, an 1.0 m/s2 1.0 m/s2 0.1 to 6 m/s2 Comfortable deceleration, bcomf 1.5 m/s2 1.5 m/s2 0.1 to 6 m/s2
The developers of the IDM, Kesting and Treiber, suggested modification to the model
that would improve its predictive capabilities by using external visual indicators such as brake
lights, turn signals, tailgating, and head light flashes. An example of a binary input to replicate
car-following behavior when the brake lights of the lead vehicle are activated and the
acceleration (�̇�𝑣𝑙𝑙) is less than the acceleration of the follower (ac) is shown in equation 2.2.
𝑍𝑍𝑏𝑏 = � 1 �̇�𝑣𝑙𝑙 < 𝑎𝑎𝑐𝑐,0 𝑂𝑂𝑡𝑡ℎ𝑒𝑒𝑒𝑒𝑒𝑒𝑒𝑒𝑠𝑠𝑒𝑒. (2.2)
A typical value of ac is -0.2 m/s2 and it corresponds to the rate of change of velocity when
neither the brakes or throttle is applied (vehicle decelerates uniformly) (Kesting & Treiber 2013).
Other visual indicators can also be individually represented in similar equations.
A limited number of papers also discuss incorporating behavioral parameters into the
IDM. In 2005, Fuller introduced the task capability interface (TCI) model to study the effects of
task demand on risk-taking. Hoogendoorn et al. in 2012 combined the task-capability interface
model with the IDM to predict changes to driving parameters. Figure 2.4 shows the TCI model
that weighs the balance between the capability of the driver (C) and the demand of the task (D).

12
Figure 2.4 Task demand and capability interface (Fuller 2005)
The IDM was modified by incorporating the difference between task demand and the
capability of the driver. The task demand and driver capability are applied as a factor scaled
between 0 and 1. This implies that the difference between the task demand and capability will
range from -1 to 1 as follows:
𝑚𝑚𝑑𝑑(𝑡𝑡) = 𝑚𝑚𝑡𝑡(𝑡𝑡) −𝑚𝑚𝑐𝑐(𝑡𝑡) ; 0 < 𝑚𝑚𝑡𝑡(𝑡𝑡) < 1, 0 < 𝑚𝑚𝑐𝑐(𝑡𝑡) < 1, and −1 < 𝑚𝑚𝑑𝑑(𝑡𝑡) < 1 (2.3)
Where,
mt(t) is the task demand
mc(t) is the capability of the driver
md(t) is the difference between task demand and driver capability

13
When the driver’s capability is much greater than the demand of the task, the driver will
perform better (task is easy), resulting in a negative value for the difference. A theoretical
framework of the methodology is shown in figure 2.5. The driver tries to minimize the difference
between varying task demand and capability by attempting compensatory actions like reducing
speed. However, when compensatory actions alone are not sufficient to neutralize the difference,
performance effects can be noticed (changes in workload and situation awareness) (Dee Waard
& Brookhuis, 1991).

14
Figure 2.5 Framework developed by Hoogendoorn et al. (2012) to modify the IDM
The amax, bcomf, Tn, and v0 parameters were modified to incorporate the difference between
task demand and driver capability. When the difference between task demand and driver
capability results in a negative value, the amax, bcomf, and v0 parameters increase because of the

15
driver having a greater capability than the required task demand. However, Tn decreases because
the driver is assumed to be capable of accepting a smaller time gap as his/her capability is greater
than the demand of the task. The difference between task demand and capability was
incorporated as a cubic function as shown below in equations 2.4-2.7.
𝑎𝑎𝑚𝑚𝑚𝑚𝑚𝑚(𝑡𝑡) = (−𝑚𝑚𝑑𝑑(𝑡𝑡)3𝑎𝑎𝑚𝑚𝑚𝑚𝑚𝑚) + 𝑎𝑎𝑚𝑚𝑚𝑚𝑚𝑚 (2.4)
𝑏𝑏𝑑𝑑𝑑𝑑𝑑𝑑(𝑡𝑡) = (−𝑚𝑚𝑑𝑑(𝑡𝑡)3𝑏𝑏𝑚𝑚𝑚𝑚𝑚𝑚) + 𝑏𝑏𝑚𝑚𝑚𝑚𝑚𝑚 (2.5)
𝑣𝑣0(𝑡𝑡) = (−𝑚𝑚𝑑𝑑(𝑡𝑡)3𝑣𝑣0) + 𝑣𝑣0 (2.6)
𝑇𝑇𝑛𝑛(𝑡𝑡) = (𝑚𝑚𝑑𝑑(𝑡𝑡)3𝑇𝑇𝑛𝑛) + 𝑇𝑇𝑛𝑛 (2.7)
Substituting equations 2.4, 2.5, 2.6, and 2.7 into equation 2.2 results in:
𝑎𝑎𝑛𝑛(𝑡𝑡) = ((−𝑚𝑚𝑑𝑑(𝑡𝑡)3𝑎𝑎𝑚𝑚𝑚𝑚𝑚𝑚) + 𝑎𝑎𝑚𝑚𝑚𝑚𝑚𝑚) �1 − �𝑣𝑣𝑛𝑛(𝑡𝑡)
(−𝑚𝑚𝑑𝑑(𝑡𝑡)3𝑣𝑣0(𝑡𝑡)) + 𝑣𝑣0(𝑡𝑡)�𝛿𝛿
− �𝑠𝑠∗𝑛𝑛(𝑡𝑡)𝑠𝑠𝑛𝑛(𝑡𝑡)
�2
� (2.8)
𝑠𝑠∗𝑛𝑛(𝑡𝑡) = 𝑠𝑠0 + ((𝑚𝑚𝑑𝑑(𝑡𝑡)3𝑇𝑇𝑛𝑛) + 𝑇𝑇𝑛𝑛)𝑣𝑣𝑛𝑛(𝑡𝑡) +𝑣𝑣𝑛𝑛(𝑡𝑡)∆𝑣𝑣𝑛𝑛(𝑡𝑡)
2�((−𝑚𝑚𝑑𝑑(𝑡𝑡)3𝑎𝑎𝑚𝑚𝑚𝑚𝑚𝑚) + 𝑎𝑎𝑚𝑚𝑚𝑚𝑚𝑚)((−𝑚𝑚𝑑𝑑(𝑡𝑡)3𝑏𝑏𝑚𝑚𝑚𝑚𝑚𝑚) + 𝑏𝑏max)
After incorporating possible compensatory actions, the next step involves incorporating
performance effects into the model. De Waard and Brookhuis established that performance
effects and demand are related with an inverted parabola function. This relationship was used to
establish the following equation, with α, β, and γ being parameters:
𝑚𝑚𝑝𝑝(𝑡𝑡) = −(𝛼𝛼𝑚𝑚𝑑𝑑(𝑡𝑡)2 + 𝛽𝛽𝑚𝑚𝑑𝑑(𝑡𝑡) + 𝛾𝛾) (2.9)

16
Equation 2.9 shows that performance effects will have a greater magnitude if the
capability of the driver is less than the demand of the task (if 𝑚𝑚𝑑𝑑(𝑡𝑡) is positive). The following
equation (2.10) shows the result of incorporating both performance effects and task-capability
interface into the IDM:
𝑎𝑎𝑛𝑛(𝑡𝑡) = (1 −𝑚𝑚𝑝𝑝(𝑡𝑡))((−𝑚𝑚𝑑𝑑(𝑡𝑡)3𝑎𝑎𝑚𝑚𝑚𝑚𝑚𝑚) + 𝑎𝑎𝑚𝑚𝑚𝑚𝑚𝑚) �1− �𝑣𝑣𝑛𝑛(𝑡𝑡)
(−𝑚𝑚𝑑𝑑(𝑡𝑡)3𝑣𝑣0(𝑡𝑡)) + 𝑣𝑣0(𝑡𝑡)�𝛿𝛿
− �𝑠𝑠∗𝑛𝑛(𝑡𝑡)𝑠𝑠𝑛𝑛(𝑡𝑡) �
2
� (2.10)
The implementation of models that depend on desired measures such as speed, spacing,
and headway, has a limitation that these measures cannot be readily observed in nature
(Saifuzzaman & Zheng 2014). A correlation has to be made in order to depict how the desired
measures are affected by changes in human factors such as workload, situation awareness, and
level of activation.
2.1.3 Human Driver Model (HDM)
The HDM was first proposed by Treiber et al. in 2006. It incorporated four extensions in
terms of finite reaction times, imperfect estimation capabilities, spatial anticipation, and temporal
anticipation to the IDM (Trieber et al. 2006). The model is based on the reaction time and the
number of vehicles ahead for which the drivers can anticipate spatial information. Figure 2.6
shows the relationship between the reaction time and anticipated vehicles on traffic regimes
including oscillating congested traffic (OCT), homogeneous congested traffic (HCT), moving
and pinned localized clusters (MLC/PLC), and triggered stop-and-go (TSG). It can be seen that
the greater the number of vehicles anticipated, the more the reaction time available to mitigate a
crash. Anticipation is especially useful in the TSG regime, where predicting behavior of more
lead vehicles can be useful to avoid crashes.

17
Figure 2.6 Regimes of the HDM
2.2 Situation Awareness, Workload, and Level of Activation
This section summarizes key definitions of the level of activation, situation awareness,
and workload. It also discusses the experimental techniques that can be used to collect the
respective data.
2.2.1 Situation Awareness (SA)
Situation awareness (SA) has been defined as the ability to perceive (Level 1 SA),
comprehend (Level 2 SA), and project future status (Level 3 SA) of elements in an environment
(Endsley 1995). A common misconception is that SA is only affected by perception (ability to
locate an element). However, comprehension of the situation and the driver’s ability to project
future scenarios are significant factors where as being able to identify an element without placing
where it fits and how it affects an environment is not valuable. The SA of a driver is known to
affect his/her capability during a task in that, high SA generally implies a more alert driver

18
unless affected by cognitive overload (Endsley, 1995). Figure 2.7 shows the Endsley, 1995
model developed to process how SA is related to decision making and performance.
Figure 2.7 Levels of SA in relation to decision making and performance (Endsley 1995)
SA can be measured using several techniques. They can be divided into freeze probe,
real-time probe, self-rating, observer-rating, and physiological techniques. A short description
about each technique is provided in the sections that follow.
2.2.1.1 Freeze-Probe Technique

19
These are typically used in a simulation environment, where a scenario is paused and
queries about the situation are asked. Usually, all operator displays are blanked and questions
related to participant alertness are administered (Salmon et al. 2006). A commonly used freeze
probe technique is the situation awareness global assessment (SAGAT) developed by Endsley in
2000. The SAGAT consists of queries designed to assess all three levels of SA. Freeze probe
techniques are generally considered as highly intrusive as they interfere with the primary task.
However, there has been no conclusive evidence regarding their level of intrusiveness (Salmon et
al. 2006).
2.2.1.2 Real-Time Probe Technique
This involves administering the questions targeted at establishing SA without
pausing/freezing the simulation. During the task, participants are presented with queries pertinent
to the environment and their answers along with response times are noted. A commonly used
real-time probe technique is the situation present assessment method (SPAM). Although,
generally regarded as less intrusive than the free-probe technique, no conclusive evidence exists
to support this claim (Salmon et al. 2006).
2.2.1.3 Self-Rating Technique
This technique involves administering questionnaires about SA after the completion of a
task. They are relatively easy and cheap to administer. A commonly used self-rating technique is
the situation awareness rating technique (SART). SART is a multidimensional scaling technique
that consists of ten subscales each rated from one (low) to seven (high). The subscales include:
Instability of situation, variability of situation, complexity of the situation, arousal, spare mental
capacity, concentration, division of attention, information quantity, information quality, and
familiarity. These ten subscales are categorized in three domains: attentional demand (D),

20
attentional supply (S), and understanding (U). Situation awareness is then calculated by U-(D-S)
(Selcon & Taylor 1989).
The main problem associated with self-rating techniques is the susceptibility of the entire
results to the last performed task (sensitivity).
2.2.1.4 Observer-Rating Technique
This technique requires the presence of an expert to judge the level of SA of the
participant. The observer provides a score based on the tasks performed in the field. The main
advantage of this technique is that it is unintrusive. However, multiple observers (experts in SA)
are required to ensure accurate results without being subject to individual observer bias. Also, the
technique is relatively expensive due to the time required from several observers (Salmon et al.
2006).
2.2.1.2 Physiological Technique
Typical physiological technique used to measure SA is the eye-tracking. SA can be
measured using gaze overlays, fixation patterns, and saccades. Studies have shown that
analyzing fixation patterns and saccades can provide information on the relation between
duration of fixation and the perception of objects/words (Just & Carpenter 1980). Eye-trackers
are ideal for a simulation environment and provide real-time continuous data. Also, they are
unintrusive and do not affect the performance of the primary task (Salmon et al. 2006). However,
devices and relevant software can be very expensive.
2.2.2 Workload (WL)
Workload can be defined as the allocation of attention based on the mental resources
available for information processing (Patten et al. 2006). The primary role of any driver is to
safely navigate from point A to B. However, depending on environmental conditions, emergency

21
situations that require sudden maneuverability, and driver characteristics like age, experience,
and behavior, consume mental resources required by the driver to safely carry out the primary
task of driving vary. These changes in WL can be used to represent how the driving performance
is affected. WL has been measured using subjective, performance, and physiological methods. A
brief description of each of these measures is discussed below along with their respective
sensitivities to task demand.
2.2.2.1 Subjective Measures
Subjective measures are a data collection technique that uses questionnaires and surveys
to pose questions to participants. Participants reply based on their individual experience on the
topic in question. Questionnaires and surveys can be administered before, during, or after the
study. Three most commonly used techniques to measure subjective WL are the NASA-task load
index (TLX), driver activity load index (DALI), and the rating scale mental effort (RSME). Each
technique is briefly discussed in the sections that follow.
2.2.2.1.1 NASA- Task Load Index (TLX)
The NASA-TLX is one of simplest and the most widely used subjective measure. The
NASA-TLX questionnaire calculates WL experienced by participants as a weighted average of six
subscales: mental demand, physical demand, temporal demand, performance, effort, and frustration
experienced during the task, each on a 20-point scale ranging from “very low” to “very high”
(Stojmenova & Sodnik 2015). Participants are then required to assign a weight, from 0 to 5, to a pair
of subscales shown on flash cards (6 subscales resulting in 15 possible pairwise combinations). It is
usually administered after the completion of a task or event and has been used in several WL
studies. However, it has been shown that the answers to the questionnaire are strongly influenced
by the last task performed (Stojmenova & Sodnik 2015). Also, the NASA-TLX does not provide

22
time-varying data but instead relies on participant’s memory and ability to recall events that have
already occurred.
2.2.2.1.2 Driver Activity Load Index (DALI)
The NASA-TLX was specifically designed to capture WL of pilots. However, a modified
version known as DALI was developed by Pauzie around 1994 to assess WL related to driving
with and without secondary tasks. The DALI replaces some subscales from the NASA-TLX not
applicable to driving. The six subscales for the DALI are: effort of attention, visual demand,
auditory demand, temporal demand, interference, situational stress (Pauzie et al. 2008). Although
the DALI was developed for driving, NASA-TLX is still more commonly cited and used to
measure WL in simulation studies (Stojmenova & Sodnik 2015).
2.2.2.1.3 Rating Scale Mental Effort (RSME)
The RSME is conceptually similar to the NASA-TLX and DALI, however, it consists of
a nine-point scale ranging from “absolutely no effort” to “extreme effort” (Sartang 2017).
Participants mark their level of effort after completion of each task. It is relatively easier and
cheap to use. However, not a lot of studies utilize RSME to compute WL with respect to driving
thus not favored over the NASA-TLX.
2.2.2.2 Performance Measures
Performance measures are based on changes to variables collected from the drive.
Examples of performance measures during the drive include; lane keeping ability, speed control,
and car-following ability (De Waard 1996). De Waard in 1996 concluded that varying WL
results in changes to speed, car-following parameters such as standard deviation of headway
deviation, and lane keeping parameters such as standard deviation of lateral position (SDLP) and
steering wheel movement. The main issue with performance measures is that they vary by task

23
and the same measure sometimes cannot be used as a basis for comparison of WL (Sirevaag et
al. 1993). For example, a driver might choose to slow down when observing a crash near the
roadway, however, when driving through a work zone he/she might choose to focus more on
keeping in their lane (SDLP). Ideally, performance measures should be coupled with other WL
measures to provide a more holistic picture.
2.2.2.3 Physiological Measures
Physiological measures are used to assess mental workload from reactions within the
human body. This type of measure provides exact results without interaction from other variables
other than those being examined (De Waard 1996). Participants also do not need to reflect and
fill questionnaires as data is continuous and readily available for the entire task. Most
physiological measures focus on these four areas: heart, brain, eyes, and muscles. A brief
description of measures in these areas is presented.
2.2.2.3.1 Heart
Electrocardiography (ECG) is primarily used in health care centers to monitor electrical
activity in the heart and diagnose critical heart conditions such as attacks and arrhythmias. The ECG
can be used to provide a continuous stream of data showing the impact of various driving tasks on
the electrical activity of the heart expressed over a defined time period. ECG captures several
variables than can be analyzed to assess workload and they include: heart rate (HR), heart rate
variability (HRV), and Inter-Beat-Interval (IBI). Other devices such as heart rate monitors and chest
straps can also be used to track changes to HR. However, they may be less accurate due to the lower
sampling frequency. Both the ECG equipment and heart rate monitors/chest straps are considered as
intrusive techniques because electrodes or contact points must be placed on the participant.
2.2.2.3.2 Brain

24
Electroencephalography (EEG) is a clinical technique used to measure changes in
electrical activity in the brain. The brain is a complex organ that controls most of the functions in
the human body. The EEG device uses electrodes attached to the scalp of an individual to detect
changes in electrical charges arising from the activity in the brain cells. The following
paragraphs discuss the various regions of the brain and their functions. The EEG electrode
positions corresponding to the regions of the brain are discussed.
The brain can be divided into six regions: frontal lobe, parietal lobe, occipital lobe,
cerebellum, temporal lobe and the brain stem, each responsible for different functions. The
frontal lobe is the most anterior region of the brain, located in the forehead. It is responsible for
problem solving, emotions, response, reasoning, and consciousness. The parietal lobe is located
at the same level behind the frontal lobe. The parietal lobe is responsible for controlling sensory
functions such as voluntary movements, touch, and visual attention. The occipital lobe is the
most posterior region of the brain and is responsible for anything related to vision. The
cerebellum is located at the base, in line with the ears and is responsible for coordination and
balance. The brain stem is located deep in the center of the brain and links directly to the spinal
cord. Figures 2.8a and 2.8b show the different regions of the brain.

25
Figure 2.8a Regions of the brain (Lehr 2015)
Figure 2.8b Regions of the brain (Lehr 2015)
The EEG electrodes are placed in positions shown in figure 2.9. The first alphabet in each
position refers to a region of the brain. For example: the frontal lobe is represented by the letter

26
“F”, parietal lobe by the letter “P”, temporal lobe by the letter “T”, occipital lobe by the letter
“O”. However, the letter “C” does not represent the cerebellum. Other letters such as “FP”
represent the frontopolar and “A” represents the auricular (ear electrode).
Figure 2.9 EEG electrode positions
2.2.2.3.3 Eyes
Eye-tracking devices that track eye movement of the driver without disrupting the
primary task of driving are very useful in determining the areas of focus of the driver. Some
advanced devices are also capable of tracking pupil dilation—the phenomenon causing changes
to the pupil diameter due to varying levels of cognitive workload, also known as task-evoked
pupillary response (TEPR) (Devos et al. 2017, Strayer et al. 2013). This can be used to assess
cognitive workload continuously throughout a drive. Software analyze the patterns observed and
compare it to baseline conditions to identify any changes resulting from the task.

27
2.2.2.3.4 Coordination between Vision and Muscles
These measures typically require participants to react to a visual or sensory stimulus.
Common measures include:
The peripheral detection task (PDT) presents visual stimuli throughout various locations
in a driving scenario. Stimuli are presented as small colored squares or circles. Participant’s
reaction time to detect and respond to the task by pressing a button (coordination between vision
and muscle), usually on the steering wheel, is measured (Patten et al. 2004).
The detection response task (DRT) is a more refined version of the PDT and was
primarily devised to determine the effect of a secondary task on WL. The DRT equipment
presents frequent artificial stimuli during a task and records participant performance in the form
of response time, hit rate, and miss rate (ISO 17488 2016). There are three types of DRT stimuli
commonly used in studies. The head-mounted light-emitting diode (LED), fixed LED location
mounted inside a vehicle, and a tactile electrical vibrator attached to the driver’s shoulder (ISO
17488 2016). As the stimuli are presented, participants are required to acknowledge them using a
micro-switch, typically attached to the thumb. Changes to the response time, hit rate, and miss
rate of stimuli are analyzed to determine the intensity of WL being experienced. However,
because both the PDT and DRT present simultaneous alternative tasks for the driver to complete,
they compete with the primary task of driving thus not very effective in establishing actual WL.
2.2.2.4 Sensitivity of the Various Measures
De Waard observed that some WL measures were sensitive at a particular intensity of the
task demand than others. This can be clearly observed in figure 2.10. However, it can also be
noted that most measures are only sensitive at high WL and not during low WL. De Waard

28
concludes that one measure of WL might not be a sufficient representation for the entire task and
multiple measures would provide a better basis for comparison.
Figure 2.10 Sensitivity of workload measures (De Waard 1996)

29
Where, SDLP is the standard deviation of lateral position and SDSTW is the standard
deviation of steering wheel movements.
2.2.3 Level of Activation (LA)
The level of activation or arousal has been identified by several researchers as a key
measure of engagement, motivation, and enthusiasm involved in responding to a task. The LA is
directly related to the ability of an individual to perform the task of driving (Tampere et al.
2009). However, the LA is not only affected by the primary task of driving, but also by
secondary tasks such as cell phone use and operating the media controller or navigation system
(Tampere et al. 2009).
De Waard and Brookhuis (1991), suggested measuring LA using the three classic EEG
bands: theta, alpha, and beta, representing the frequency ranges 4-7 HZ, 8-13 HZ, and 14-30 HZ,
respectively. To prevent susceptibility to isolated changes, De Waard and Brookhuis proposed
combining the spectral power of all three bands (filtered and divided into epochs) using the
formula (α+θ)/β (De Waard & Brookhuis 1991). Prinzel III et al. in 2001, identified the electrode
positions P3, PZ (P2), P4, CZ(C2) to capture the “engagement index” of a driver, also known as
the LA.
A study by Tejero and Choliz in 2002 used the EEG Fourier spectral power analysis
suggested by De Waard and Brookhuis in a real-world driving study. Participants were required
to drive 90 km on a highway while being monitored by researchers. The study showed that LA
increased with varying speed than when keeping at a constant speed. They concluded that the act
of modifying speed creates a source of engagement thus increasing the LA of the driver.

30
2.3 Relationship Between WL, SA, LA and Performance
The relationship between WL and task demand is well established by several studies. De
Waard suggests a U-function as shown in figure 2.10, where WL initially starts off at high and
decreases as the task gets familiar. As the task difficulty gradually increases, there might not be
any significant changes to WL until a threshold is reached (region A3). After, WL increases
steeply with increase in task demand (regions with high sensitivity and easy measurability of
WL) and performance slump is recorded (De Waard 1996).
From figure 2.11, it can be seen as WL increases, the LA also increases. However, the
relationship is not entirely linear.
Figure 2.11 Relationship of WL, LA, and performance (Young et al. 2015)
Zhang and Kumada, in 2017, studied the relationship between WL and mind wandering.
The experiment was performed in a low-fidelity driving simulator. 40 participants drove a 25-
minute scenario with car-following tasks. A real-time probe was applied randomly and

31
participants rating of mind wandering was recorded. After the completion of the scenario,
NASA-TLX was completed to establish the WL. The study also correlated the measured WL to
performance measures such as the standard deviation of lateral position (SDLP) and standard
deviation of steering wheel movement (SDSTW). No significant relationship was seen between
the performance measures and WL.
From figure 2.12, it can be clearly established that as WL increases, mind wandering
decreases. Mind wandering can be directly attributed to SA. However, from this experiment, the
levels of WL are not clear. It would seem that it only captures the region between low and high
WL.
Figure 2.12 Mind wandering and WL (Zhang & Kumada 2017)
In general, it can be theorized that high levels of WL indicate low SA, but low levels of
WL do not necessarily indicate a high level of SA. In situations with low to medium WL, SA

32
increases gradually before reaching an optimum and decreasing sharply. Also, both WL and SA
are dependent on LA.

33
Chapter 3 Methodology
The methodology is divided into two main phases. The first phase involves a simulator
study to establish different levels of driver classification through performance parameters and
biobehavioral trends and the second phase incorporates the classifications with their subsequent
biobehavioral parameters into car following models. A framework for the proposed methodology
is provided in figure 3.1.
Figure 3.1 Methodological framework
Task 6: Establish conclusions
Task 1: Participant recruitment
Task 2: Configuring EEG/HR/Eye Tracking
Task 3: Scenario design and pilot testing
Task 4: Data collection
Task 5: Statistical analysis
Task 1: Establish valid relationships between parameters and thresholds
Task 2: Incorporate established coefficients and thresholds into the IDM
Task 3: Establish conclusions
Phase 1
Phase 2

34
The theory behind developing a framework that can be used to incorporate biobehavioral
parameters such as LA, WL, and SA, with respect to changes in driving performance is
explained in the paragraphs that follow.
The external conditions in a specific scene contribute towards the complexity of the
driving task at hand. Differences in conditions, such as the geometric properties, weather,
number of interaction vehicles, and sources of distraction, add a complexity to the driving
environment. The capability of the driver to handle tasks of varying complexity, mostly depend
on his/her physical and mental characteristics. For example: it can be expected that older drivers
have slower reaction times than younger drivers due to their diminishing physical capabilities.
Also, some individuals may prefer to drive faster and follow smaller headways (aggressive),
while others tend to be more conservative. Static and dynamic characteristics are identified as
distinguishable variables between drivers. Where the age and experience of the driver coupled
with the activation level can affect driving performance. Activation level describes the driver
arousal state before and during the drive e.g. a drowsy or less motivated driver will have a lower
activation level than an active driver.
Also, the capabilities of the driver and the demands of the task are closely related. If the
capabilities of the driver are greater than those required by the task, then the task will be easily
completed (Hoogendoorn et al. 2012). It also means that, drivers can complete this task at a
lower activation level and by utilizing fewer mental resources (WL). If the capability of the
driver is equal to the task demand, the task becomes difficult as the driver is using all the
available capabilities to successfully complete the task (Hoogendoorn et al. 2012). The driver
will require a higher LA and alertness to complete this task. However, if the capability of the

35
driver is less than that required by the task, then the driver will fail to complete the task. The
capability of the driver is also constrained by the physical capability/condition of the vehicle.
The interaction between driver capability and demand can be quantified with respect to
the changes in WL and SA. Slight imbalance between the WL and SA can result in the driver
compensating by adjusting longitudinal control variables such as speed, acceleration, and
headway. For example: if a task is challenging (increased WL), the driver might choose to
reduce his/her overall speed or increase his/her headway in order to be safe and maintain a
comfortable level of SA. In essence, he/she is compensating for the lack of capabilities at that
instance, by making these changes to the driving. This leads to a trigger that is activated through
small imbalances between WL and SA (TR 1) as seen in figure 3.2. However, if the imbalance
between driver capability and task demand is high, e.g. task is hard to be successfully completed
by the driver’s current capability, the driver tries to restore this imbalance resulting in both
compensatory and performance effects (setting off TR 2). Compensation effects are theorized to
only affect longitudinal driving variables while performance effects are theorized to affect
longitudinal and lateral (standard deviation of lateral position, standard deviation of the steering
wheel position) driving variables.

36
C* = min {VCmax or C}. Where VC is the capability of the vehicle.
Figure 3.2 Theoretical framework for classifying drivers and incorporating biobehavioral parameters
External Conditions Geometric properties, Interaction vehicles, Weather, Environment, and Distraction
Driver Characteristics
Complexity
Task demand (T)
Situation Awareness
Workload
Driver Behavior
Compensation effects: Longitudinal control
Performance effects: Long+Lateral control
Driver Capability (C)
C > T, then task is easy C = T, then task is difficult C* < T, then task failed
Driver Classification [{WL + SA} OR {Longitudinal control + Lateral control}]
Static Age, Experience
Human Factors
Dynamic
Activation level
Driver Classification Questionnaires (self-reported)
Modified IDM Input Parameters
α, β, γ
TR 1
TR 2
TCI

37
Drivers will also be categorized by behavioral (LA, WL, SA) and static characteristics
(age, experience, number of speeding tickets, number of accidents), into three groups:
conservative, average, and aggressive. The resulting effect of the driver trying to match his/her
capability to the task demand will be used to establish how a conservative or aggressive driver
will react to a task when compared to an average driver. Will the aggressive driver experience
lower workload, implying lower compensation and performance effects, while completing a
difficult task? Or will aggressive drivers increase the speed and follow shorter headways during
an easy task, to increase the level of difficulty to match their capability accordingly? The
established classifications will also be compared to the driving performance variables such as
average speed, average headway, and maximum acceleration, to measure the accuracy of self-
perception in driver classification.
Based on this description, the theoretical framework in figure 3.2 for classifying drivers
using characteristics, physiological, and behavioral parameters is established.
3.1 Proposed Modification to the IDM
In order to incorporate the theoretical framework shown in figure 3.2, modifications to
the IDM are required. The IDM parameters that can be affected by an imbalance in the task-
capability interface are assumed to be the desired speed and desired time gap. This assumption is
made because the desired variables capture what the driver wants to do at that moment but is not
able to due to a higher than normal task demand. Equations 3.1 and 3.2 show how the overall
acceleration of the IDM will be modified when triggers 1 or 2 are activated.

38
Compensation only (TR 1):
𝑎𝑎𝑛𝑛(𝑡𝑡) = 𝑎𝑎𝑚𝑚𝑚𝑚𝑚𝑚 �1 − �𝑣𝑣𝑛𝑛(𝑡𝑡)
(𝛼𝛼 + 𝛽𝛽)𝑣𝑣0(𝑡𝑡)�𝛿𝛿
− �𝑠𝑠∗𝑛𝑛(𝑡𝑡)𝑠𝑠𝑛𝑛(𝑡𝑡)
�2
� (3.1)
𝑠𝑠∗𝑛𝑛(𝑡𝑡) = 𝑠𝑠0 + (𝛼𝛼 + 𝛽𝛽)𝑇𝑇𝑛𝑛𝑣𝑣𝑛𝑛(𝑡𝑡) +𝑣𝑣𝑛𝑛(𝑡𝑡)∆𝑣𝑣𝑛𝑛(𝑡𝑡)
2�𝑎𝑎𝑚𝑚𝑚𝑚𝑚𝑚𝑏𝑏𝑐𝑐𝑐𝑐𝑚𝑚𝑐𝑐
Where,
α = Compensation coefficient
β = Activation level coefficient
Compensation and Performance (TR 2):
𝑎𝑎𝑛𝑛(𝑡𝑡) = 𝑎𝑎𝑚𝑚𝑚𝑚𝑚𝑚 �1 − �𝑣𝑣𝑛𝑛(𝑡𝑡)
({𝛼𝛼 + 𝛾𝛾} + 𝛽𝛽)𝑣𝑣0(𝑡𝑡)�𝛿𝛿
− �𝑠𝑠∗𝑛𝑛(𝑡𝑡)𝑠𝑠𝑛𝑛(𝑡𝑡)
�2
� (3.2)
𝑠𝑠∗𝑛𝑛(𝑡𝑡) = 𝑠𝑠0 + ({𝛼𝛼 + 𝛾𝛾} + 𝛽𝛽)𝑇𝑇𝑛𝑛𝑣𝑣𝑛𝑛(𝑡𝑡) +𝑣𝑣𝑛𝑛(𝑡𝑡)∆𝑣𝑣𝑛𝑛(𝑡𝑡)
2�𝑎𝑎𝑚𝑚𝑚𝑚𝑚𝑚𝑏𝑏𝑐𝑐𝑐𝑐𝑚𝑚𝑐𝑐
Where,
γ = Performance coefficient
Together with incorporating compensation, LA, and performance coefficients, a visual
cue parameter that incorporates the effect of active brake lights (bl) on the lead vehicle is
implemented to the model. When brake lights are activated on the leader and the time-gap (T(t))
between the leader and follower at time (t) is less than the desired time-gap (Tn), the modified
IDM model recalculates the car-following trajectory using the acceleration/deceleration (a(t)) at
that instance. However, if T(t) is greater than Tn, it can be assumed that the driver does not apply
brakes or accelerate, resulting in a uniform deceleration of -0.2m/s2 (Kesting & Treiber 2013).
T(t) and Tn are used to establish constraints because it can be assumed that drivers can more

39
readily perceive time-gaps than the acceleration of the leader. Equation 3.3 shows the
implementation of brake light parameter along with the resulting acceleration/deceleration.
𝑏𝑏𝑏𝑏 = �1 𝑂𝑂𝑂𝑂,0 𝑂𝑂𝑂𝑂𝑂𝑂.
If 𝑏𝑏𝑏𝑏 = 1 then, 𝑎𝑎𝑛𝑛(𝑡𝑡)∗ = �𝑎𝑎(𝑡𝑡) 0 ≤ 𝑇𝑇(𝑡𝑡) ≤ 𝑇𝑇𝑛𝑛−0.2𝑚𝑚 𝑠𝑠2⁄ 𝑇𝑇𝑛𝑛 ≤ 𝑇𝑇(𝑡𝑡) ≤ 5 (3.3)
Where, 𝑎𝑎𝑛𝑛(𝑡𝑡)∗ describes the starting acceleration/deceleration during car-following
computations. Any brake light observed from a time-gap of greater than five seconds will not be
considered as this will be the threshold to represent active car-following.
3.2 Data Collection Techniques
A list of the techniques that will be used during data collection to establish the coefficients α, β,
and γ are listed in table 3.1.

40
Table 3.1 Measuring techniques aggregated by the coefficient
Coefficient Methodological Definition Measuring Event/Technique
𝛼𝛼 Compensation coefficient
Measuring WL: • HR • Pupil dilation • NASA-TLX Measuring SA: • Gaze overlay Measuring longitudinal control: • Speed • Headway • Acceleration
𝛽𝛽 LA coefficient EEG
𝛼𝛼 + 𝛾𝛾 Compensation + Performance coefficient
Measuring WL: • HR • Pupil dilation • NASA-TLX Measuring SA: • Gaze overlay Measuring longitudinal control: • Speed • Headway • Acceleration Measuring lateral control: • SD of steering wheel position • SD of lateral position

41
Chapter 4 Data Collection Plan
This section discusses the design of the scenarios and the strategies that will be followed
during data collection.
4.1 Participant Recruitment
The study was first submitted to the Human Research Protection Program (HRPP) at the
University of Kansas (KU), for approval. The study was then advertised to attract potential
participants through flyers around Lawrence, social media websites, and email announcements.
90 participants will be recruited to participate in this research, equally split between males and
females. The participants will be divided into three age groups 18-24, 25-49, and 50-65 years.
Participants will be screened using a questionnaire to determine their age, driving experience,
susceptibility to motion sickness, health conditions, and other aspects of driving such as gap
acceptance, merging behavior, speed preferences, and lane changing preferences. Based on
static and dynamic characteristics, drivers will be divided into the following three categories:
conservative, average, and aggressive. This information will later be used to check if participants
are able to correctly gauge their driver classification level.
Participants are required to complete a 45-minute screening questionnaire, covering the
demographic information, medical conditions, driving preferences and history, mood and
personality measure, empathy and moral decision-making measures, and attention and executive
function measures. The internet information statement for this survey is shown in Appendix A.
4.1.1 Mood and Personality Measure
There are several measures available through the literature that provide mood and
personality assessments such as:

42
• Positive and Negative Affect Schedule (PANAS): The PANAS is a self-report
measure designed to assess both positive and negative affect (Watson et al. 1988).
The PANAS consists of 20 adjectives pertaining to negative affect (i.e., distressed or
nervous) and positive affect (i.e., excited or proud), with ten items for each subscale.
Items are rated on a five-point Likert scale: 1 = “Very slightly or not at all” to 5 =
“Extremely.” The subscales are obtained by taking the average of each item within
that subscale.
• Need for Cognition: This test is designed to assess the tendency to engage in and
enjoy effortful cognitive endeavors (Cacioppo et al. 1984).
• Cognitive Reflection Task: This questionnaire assesses individuals' ability to suppress
an intuitive and spontaneous wrong answer in favor of a reflective and deliberative
right answer (Frederick 2005).
• Neuroticism-Extroversion-Openness Five Factor Inventory: this is a 60-item survey
to measure the five primary personality characteristics of openness,
conscientiousness, extraversion, agreeableness, and neuroticism (Costa & McRae
1989).
4.1.2 Empathy and Moral Decision-Making Measures
• Interpersonal Reactivity Index (Davis 1983). This questionnaire measures individual
differences in empathy.
• The Empathy Quotient (Baron-Cohen & Wheelwright 2004): This questionnaire also
measures individual differences in empathy.
• Psychological Entitlement Scale (Campbell et al. 2004): This scale measures
psychological entitlement, which refers to the stable and pervasive sense that one

43
deserves more and is entitled to more than others. This sense of entitlement will also
be reflected in desired or actual behaviors. The concept of psychological entitlement
is intrapsychically pervasive or global; it does not necessarily refer to entitlement that
results from a specific situation (e.g., “I am entitled to social security because I paid
into the system,” or “I deserve an ‘A’ because I performed well in class”). Rather,
psychological entitlement is a sense of entitlement that is experienced across
situations.
• Ethical dilemmas such as the Trolley/Footbridge Dilemmas: These are short vignettes
describing different scenarios and the participant has to decide or evaluate the 'right'
course of action. The tasks are meant to measure moral decision making in context.
4.1.3 Attention and Executive Function Measures
• Stroop Task (Stroop 1935): This is a classic measure of cognitive inhibition in
cognitive control.
• Eriksen Flanker task (1979): This is a classic measure of attention.
4.2 Configuring the EEG, HR Monitor, and Eye Tracker
The LA (arousal) is a key variable in this research. Changes in the LA has been directly
associated with the changes in neural activity occurring in the driver’s brain (Brookhuis et al.
1991). The EEG will be used to monitor any changes in activation level associated with the
various tasks presented during the drive. It will also be used to capture an initial state of mind of
the driver at the beginning of the drive.
During the drive, participants’ overall attentional trajectory will be captured using the
EEG at a sampling frequency of 500 HZ. A portable, lightweight, wireless, and rechargeable
system for EEG recording is available for this project. The system (Enobio) allows for the
44
reliable reproduction of EEG, EOG, and EMG signal with a rapid setup that takes less than 5
minutes and is optimal for multi-component, multi-method studies. The accompanying software
allows for visualization of time-frequency 2D/3D features (3D EEG scalp map) in real time,
including the power spectrum and spectrograms, as well as easy channel labeling. The software
further provides continuous online EEG signal quality.
The HR monitor used is the Polar H10 chest strap that collects heart rate at 1 HZ.
Participants will be shown how to properly place the device along their chest to ensure accurate
data collection.
Fovio-FX3 eye tracker is installed inside along the dashboard of the simulator chassis.
This collects cognitive workload through TERP at 60 HZ. Also, SA is tracked by overlaying the
gaze of the participants with respect to the object in sight, fixation patterns, and saccades.
4.3 Scenario Design and Pilot Testing
A preliminary driving scenario is designed with two phases: free driving and following.
The free driving phase captures the participant’s desired speed and maximum acceleration
components on an empty highway, while the following phase captures the participant’s desired
time-gap. Each phase is designed to be driven at both 55 mph and 75 mph speed limit, to capture
the variability.
The actual driving scenario is designed to last 35 minutes and consists of approximately
40 miles of roadway. A breakdown of the full appointment schedule of the participant is shown
in table 4.2.

45
Table 4.2 Time breakdown by activity
Description Expected Time Consent form explanation 3 minutes Equipping participants with EEG & HR 5 minutes Baseline EEG data: Watching short video 5 minutes Introduction to simulator driving 2-7 minutes
Preliminary scenario:
Free driving (no other roadway traffic) with 55 mph and 75 mph speed limits 5 minutes
Following (one lead vehicle): lead speed changes from 55 mph to 75 mph 5 minutes
Total time 10 minutes
Actual scenario:
Traffic density Scenario Type
1 2 3
Level 1 (Medium) 2 mins no
weaving activity + 5 mins
5 minutes 5 minutes
Level 2 (High) 2 mins no
weaving activity + 5 mins
5 minutes 5 minutes
Total time 35 minutes
NASA-TLX + SA Questionnaires 15 minutes
Total anticipated duration = 80 minutes
The actual scenario incorporates six tasks with varying levels of difficulty (three types
and two levels of traffic density) on a four lane-divided highway with a grass median. The
participant is asked to follow the lead vehicle in each of these tasks. At the completion of each
task, the participant is required to fill out the NASA-TLX and SA questionnaire.

46
Type 1: Low weaving activity
The first type is designed to capture driving performance at lower task difficulty.
Participants are required to follow a car ahead of them at 75 mph while driving on the right lane.
Low weaving activity occurs in the left lane with approximately three cars per mile changing
lanes ahead of the car-following lead vehicle.
Type 2: Active work zone-left shoulder closed and medium weaving activity
The second type is designed to capture driving performance at a slightly higher task
difficulty with an active work zone that closes the left shoulder of the roadway. The idea is to
alter the driver’s WL and SA. Participants are also required to follow a car ahead of them at 75
mph while sticking to the right lane. Medium weaving activity occurs in the left lane with
approximately five cars per mile changing lanes ahead of the car-following lead vehicle.
Type 3: Active work zone-left shoulder closed and high weaving activity
The third type is designed to capture driving performance at a higher task difficulty with
an active work zone that closes the left shoulder of the roadway. However, high weaving activity
occurs in the left lane with approximately ten cars per mile changing lanes ahead of the lead
vehicle.
Each scenario type is driven at two levels of traffic density, to further increase the
number of task difficulty variations. The actual scenario is counter balanced by randomizing the
order in which the scenario types and traffic density levels appear to each driver. Figure 4.1
shows the layout of the designed highway (T1, L1 represents scenario type 1 and traffic density
level 1).

47
Figure 4.1 Highway layout of the actual scenario
Pilot testing will be carried out on five participants to establish any design flaws in the
scenario and assess the quality of data output. Any identified flaws will be corrected to ensure a
smoother experiment.
4.4 Data Collection
The data will be collected using the KU driving simulator, a fixed-based simulator in an
Acura MDX chassis (half cab). The simulator provides a 170o horizontal field of view as shown
in figures 4.2 and 4.3, with three forward screens and one rear screen. The rear screen renders the
view of both side-view mirrors and the rear-view mirror, providing an immersed driving
experience.
T3, L2 T2, L2
T1, L2 T3, L1
T2, L1 T1, L1

48
Figure 4.2 Layout of the KU driving simulator
The simulation run and respective data are recorded on the MiniSim computer while the
video of the participant’s drive is captured on the video capture computer.
Figure 4.3 KU driving simulator in action
49
Data will be obtained in three formats: subjective, driving variables, and physiological.
The subjective data will be collected using paper and online questionnaires such as the screening
questionnaire, NASA-TLX, and SA questionnaires. Driving variables will be the outputs from
the simulator and they include: average speed, maximum speed, average headway, minimum
headway, maximum acceleration, maximum deceleration, standard deviation (SD) of lateral
position, SD of steering wheel position, number of collisions, maximum brake force, and average
brake force. Physiological variables will be obtained using the EEG, HR monitor, pupillometry,
and gaze overlay.
4.5 Analysis Plan
All participants are required to complete all six driving tasks that represent increasing
task difficulty. This represents a within-subjects design with the independent variable being task
difficulty. The dependent variables will be the output from the driving simulator and
physiological variables.
The null hypothesis for this research is that changes in task difficulty do not result in
changes to WL and SA and cannot be directly correlated to performance measures thus providing
no basis for incorporating these into the IDM. A significance level of 95% will be used to
substantiate any evidence. A paired t-test will be used to compare variables obtained at each
difficulty level with those obtained from a baseline difficulty consisting of no significant visual
or mental load.
The analysis plan involves performing a cluster analysis to establish the different
behavioral thresholds for the drivers that participated in the study. First, the clusters will be
created using subjective data from self-reported questionnaires. These clusters will then be
correlated to those obtained by using performance measures collected from the drive.

50
The level of activation, compensation, and performance coefficients will be obtained by
normalizing the data obtained from each technique listed in table 3.1. Various variable
interactions will be tested to determine those which result in the best goodness of fit to the
simulation data. Data from 69 drivers will be used for model development (determining which
combination of measurement techniques yields the best results for the modified IDM used to
better approximate simulation collected results) while the remaining 21 drivers will be used for
validation.

51
Chapter 5 Summary and Future Plan
In summary, the previous chapters provide a comprehensive literature review of existing
car-following models with specific attention to the IDM and how it has been previously modified
to incorporate biobehavioral parameters along with the strategies to collect and measure these
parameters. The proposed methodology and developed framework of the theoretical model is
then discussed in chapter 3. A detailed section describing the data collection plan with respect to
the driving simulator, questionnaires, and physiological measures is presented in chapter 4.
Appendix A, B, C, D consist of the internet information statement, IRB approval letter, flyer to
recruit participants, and the informed consent form, respectively.
Table 5.1 shows the proposed timeline for all remaining tasks. The timeline accounts for
unforeseen changes that might be made to the statistical analysis to provide a better
representation of the data. A final report detailing all the tasks performed during the next year
will be submitted in December.
Table 5.1 Timeline for the next year
2018 2019 Tasks DEC JAN FEB MAR APR MAY JUN JUL AUG SEP OCT NOV DEC
Pilot Testing Design Adjustment Finalizing Participants Data Collection Statistical Analysis Unforeseen Changes Draft Final Report Deliverables FR1 QR QR QR QR DFR FR2
Where, DFR: Draft report, QR: Quarterly updates, FR1: Final report phase 1, FR2: Final
report phase 2.

52
References
Agarwal, Anirudh. Parietal Lobe. 2017. “Human Anatomy.” Link: https://www.knowyourbody .net/parietal-lobe.html. Accessed: Jan 2018.
Baron-Cohen, Simon., and Sally Wheelwright. 2004.“The empathy quotient: An investigation of adults with Asperger syndrome or high functioning autism, and normal sex differences.” Journal of Autism and Developmental Disorders, 34(2): 163-175.
Brookhuis, Karel A., and Dick De Waard. 2010. “Monitoring Drivers’ Mental Workload in Driving Simulators Using Physiological Measures.” Accident Analysis and Prevention, 42(3): 898-903.
Brookhuis, Karel A., Gerbrand De Vries, and Dick De Waard. 1991. “The Effects of Mobile Telephoning on Driving Performance.” Accident Analysis and Prevention, 23(4): 309-316.
Cacioppo, John T., Richard E. Petty, and Chuan F. Kao. 1984. “The Efficient Assessment of Need for Cognition.” Journal of Personality Assessment, 48: 306-307.
Campbell, Keith W., Angelica M. Bonacci, Jeremy Shelton, Julie J. Exline, and Brad J. Bushman. 2004. “Psychological Entitlement: Interpersonal Consequences and Validation of a Self-Report Measure.” Journal of Personality Assessment, 83(1): 29-45.
Costa, Paul T., and Robert R. McCrae. 1989. “The NEO-PI/NEO-FFI manual supplement.” Psychological Assessment Resources, Odessa, FL.
Davis, H. Mark. 1983. “Measuring individual differences in empathy: Evidence for a multidimensional approach.” Journal of Personality and Social Psychology, 44(1): 113-126.
Devos, Hannes, Viswa Gangeddula, Maud Ranchet, Abiodun E. Akinwuntan, and Kathryn Bollinger. 2017. “Effect of Cognitive Demand on Functional Visual Field Performance in Senior Drivers with Glaucoma.” Frontiers in Aging Neuroscience, 9(286).
De Waard, Dick, and Karel. A. Brookhuis. 1991. “Assessing Driver Status: A Demonstration Experiment on the Road.” Accident Analysis and Prevention, 23(4): 297-307.
De Waard, Dick. 1996. “The measurement of drivers' mental workload.” Netherlands: Groningen University, Traffic Research Center.
Dijksterhuis, Chris, Dick De Waard, Karel A. Brookhuis, Ben L. Mulder, and Ritske de Jong. 2013. “Classifying visumotor workload in a driving simulator using subject spatial brain patterns.” Frontiers in Neuroscience, 7(149).
53
Endsley, Mica R., and Daniel J. Garland. 2000. “Direct Measurement of Situation Awareness Validity and use of SAGAT.” Situation awareness analysis and measurement, Mahwah, NJ.
Endsley, Mica R., and David B. Kaber. 1999. “Level of automation effects on performance, situation awareness and workload in a dynamic control task.” Ergonomics, 42(3): 462-492.
Endsley, R. Mica. 1995. “Toward a Theory of Situation Awareness in Dynamic Systems.” Human Factors, 37(1): 32-64.
Eriksen, Charles W., and Derek W. Schultz. 1979. “Information processing in visual search: A continuous flow conception and experimental results.” Perception & Psychophysics, 25: 249-263.
Frederick, Shane. 2005. “Cognitive reflection and decision making.” Journal of Economic Perspectives, 19(4): 25-42.
Fuller, Ray. 2005. “Towards a General Theory of Driver Behavior.” Accident Analysis and Prevention, 37(3): 461-472.
Grabner, Roland H., and Bert De Smedt. 2012. “Oscillatory EEG correlates of arithmetic strategies: A training study.” Frontiers in Psychology, 195(4): 635-642.
Hamdar, Samer H., Hani S. Mahmassani, Martin Treiber. 2015. “From Behavioral Psychology to Acceleration Modeling: Calibration, Validation, and Exploration of Drivers’ Cognitive and Safety Parameters in a Risk-Taking Environment.” Transportation Research Part B, 78: 32-53.
Hart, Sandra G., and Lowell E. Staveland. 2013. “Development of NASA-TLX (Task Load Index): Results of empirical and theoretical research.” Advances in psychology, 53: 139-183.
Hoogendoorn, G. Raymond. 2012. “Empirical Research and Modeling of Longitudinal Driving Behavior Under Adverse Conditions.” Delft University of Technology, Netherlands.
Hoogendoorn, Raymond G., Serge P. Hoogendoorn, Karel A. Brookhuis, and Winnie Daamen. 2010. “Psychological Elements in Car-Following Models: Mental Workload in case of Incidents in the Other Driving Lane.” Procedia Engineering, 3: 87-99.
Hoogendoorn, Raymond. G., Bart van Arem, Serge P. Hoogendoorn, and Karel A. Brookhuis. 2012. “Applying the Task-Capability-Interface Model to the Intelligent Driver Model in Relation to Complexity.” TRB 2013 Annual Meeting.

54
Ikenishi, Toshihito, Takayoshi Kamada, and Masao Nagai. 2013. “Analysis of Longitudinal Driving Behaviors During Car Following Situation by the Driver’s EEG Using PARAFAC.” 12th IFAC Symposium on Analysis, Design, and Evaluation of Human-Machine Systems, Las Vegas, NV, USA.
ISO 17488: International Organization for Standardization. 2016. “Road Vehicles – Transport Information and Control Systems – Detection Response Task (DRT) for Assessing Attentional Effects of Cognitive Load in Driving.” Switzerland.
Just, Marcel A., and Patricia A. Carpenter. 1980. “A Theory of Reading: From Eye Fixations to Comprehension.” Psychological Review, 87(4): 329-354.
Kesting, Arne, and Martin Treiber. 2013. “Traffic Flow Dynamics: Data, Models and Simulation.” Springer-Verlag Berlin Heidelberg.
Lehr, P. Robert. 2015. “Brain Function and Deficits.” Department of Anatomy, Southern Illinois University. Center for Neuro Skills, [URL: https://www.neuroskills.com/brain-injury/brain-function.php], Accessed Nov 2018.
Li, Yiyang, Norihide Kitaoka, Chiyomi Miyajima, and Kazuya Takeda. 2014. “Evaluation Method for Aggressiveness of Driving Behavior Using Drive Recorders." Journal of Industry Applications, 4(1): 59-66.
Loft, Shayne, Lisa Jooste, and Yanqi R. Li. 2018. “Using Situation Awareness and Workload to Predict Performance in Submarine Track Management: A Multilevel Approach.” Human Factors, 60(7): 978-991.
Ma, Ruiqi, and David B. Kaber. 2005. “Situation Awareness and Workload in Driving While Using Adaptive Cruise Control and a Cell Phone.” International Journal of Industrial Ergonomics, 35(10): 939-953.
Ma, Ruiqi, and David B. Kaber. 2007. “Situation awareness and driving performance in a simulated navigation task.” Ergonomics, 50(8): 1351-1364.
Manjunatha, Pruthvi, Alexandra Kondyli, and Lily Elefteriadou. 2017. “How Has Driver Behavior Been Considered in Traffic Microsimulation and How Can We Use Cognitive Sciences and Psychology Studies to Enhance Them?” 96th Annual Meeting of the Transportation Research Board, Washington, DC.
Nguyen, Thanh, Chee P. Lim, Ngoc D. Nguyen, Lee Gordon-Brown, and Saeid Nahavandi. 2018. “A Review of Situation Awareness Assessment Approaches in Aviation Environments.” Cornell University Library-arXiv:1803.08067.
Olstam, Janson J., and Andreas Tapani. 2004. “Comparison of Car-Following Models.” Swedish National Road and Transport Research Institute, VTI meddelande 960A.

55
Patten, Christopher J., Albert Kircher, Joakim Östlund, Lena Nilsson, and Ola Svenson. 2006. “Driver experience and cognitive workload in different traffic environments.” Accident Analysis & Prevention, 38(5): 887-894.
Pauzie, Annie. 2008. “A method to assess the driver mental workload: The Driving Activity Load Index (DALI).” IET Intelligent Transport Systems,2: 315-322.
Pauzie, Annie. 2008. “Evaluating driver mental workload using the driving activity load index (DALI).” In Proceedings European Conference on Human Centered Design for Intelligent Transport Systems, 67-77.
Pekkanen, Jami, Otto Lappi, Teemu H. Itkonen, and Heikki Summala. 2017. “Task-Difficulty Homeostasis in Car Following Models: Experimental Validation Using Self-Paced Visual Occlusion.” PLoS ONE, 12(1).
Prinzel III, Lawrence J., Alan T. Pope, Frederick G. Freeman, Mark W. Scerbo, and Peter J. Mikulka. 2001. “Empirical Analysis of EEG and ERPs for Psychophysiological Adaptive Task Allocation.” National Aeronautics and Space Administration, Report No. NASA/TM-2001-211016.
Saifuzzaman, Mohammad, and Zuduo Zheng. 2014. “Incorporating Human-Factors in Car-Following Models: A Review of Recent Developments and Research Needs.” Transportation Research Part C, 48: 379-403.
Saifuzzaman, Mohammad, Zuduo Zheng, Mazharul Haque, and Simon Washington. 2015. “Revisiting the Task-Capability Interface Model for Incorporating Human Factors into Car-Following Models.” Transportation Research Part B, 82: 1-19.
Salmon, Paul, Neville Stanton, Guy Walker, and Damian Green. 2006. “Situation awareness measurement: A review of applicability for c4i environments.” Applied Ergonomics, 37(2): 225-238.
Salvucci, D. Dario. 2006. “Modeling driver behavior in a cognitive architecture.” Human Factors: The Journal of the Human Factors and Ergonomics Society, 23(2): 362-380.
Sanches, Charles L., Olivier Augereau, and Koichi Kise. 2018. “Estimation of Reading Subjective Understanding Based on Eye Gaze Analysis.” PLoS One, 13(10).
Sartang, Ghanbary A., M. Ashnagar, E. Habibi, and S. Sadeghi. 2017. “Evaluation of Rasting Scale Mental Effort (RSME) effectiveness for mental workload assessment in nurses.” JOHE, 5(4): 211-217.
Schulze, Thomas, and Thomas Fliess. 1997. “Urban Traffic Simulation with Psycho-Physical Vehicle-Following Models.” Proceedings of the 1997 Winter Simulation Conference, 1222-1229.

56
Selcon, Stephen J., and R. Taylor. 1989. “Evaluation of the Situational Awareness Rating Technique (SART) as a tool for aircrew system design.” Proceedings of the AGARD AMP Symposium on Situational Awareness in Aerospace Operations, CP478, France.
Sirevaag, Erik J., Arthur F. Kramer, Christopher D. Wickens, Mark Reisweber, David L. Strayer, and James F. Grenell. 1993. “Assessment of pilot performance and mental workload in rotary wing aircraft.” Ergonomics, 36(9): 1121-1140.
Stojmenova, Kristina, and Jaka Sodnik. 2015. “Methods for assessment of cognitive workload in driving tasks.” ICIST 2015 5th International Conference on Information Society and Technology, 229-234.
Strayer, David L., Joel M. Cooper, Jonna Turrill, James R. Coleman, Nate Medeiros-Ward, and Francesco Biondi. 2013. “Measuring Cognitive Distraction in the Automobile.” AAA Foundation for Traffic Safety, Washington, DC.
Strayer, David L., Jonna Turrill, James R. Coleman, Emily V. Ortiz, and Joel M. Cooper. 2014. “Measuring Cognitive Distraction in the Automobile II: Assessing In-Vehicle Voice-Based Interactive Technologies.” AAA Foundation for Traffic Safety, Washington, DC.
Stroop, J. Ridley. 1935. “Studies of interference in serial verbal reactions.” Journal of Experimental Psychology, 18: 643-662.
Tampere, Chris M. J., Serge P. Hoogendoorn, and Bart van Arem. 2009. “Continuous Traffic Flow Modeling of Driver Support Systems in Multiclass Traffic with Intervehicle Communication and Drivers in the Loop.” IEEE Transactions on Intelligent Transportation Systems, 10(4): 649-657.
Tejero, Pilar, and Mariano Choliz. 2002. “Driving on the Motorway: The Effect of Alternating Speed on Driver’s Activation Level and Mental Effort.” Ergonomics, 45(9): 605-618.
Transportation Research Board National Research Council. 2016. “Highway Capacity Manual.” TRB Business Office.
Treiber, Martin, Ansgar Hennecke, and Dirk Helbing. 2000. “Congested Traffic States in Empirical Observations and Microscopic Simulations.” Physical Review E, 62(2): 1805-1824.
Treiber, Martin, Arne Kesting, and Dirk Helbing. 2006. “Delays, Inaccuracies, and Anticipation in Microscopic Traffic Models.” Physica A, 360: 71-88.
Wageningen-Kessels, Femke, Hans van Lint, Kees Vuik, and Serge Hoogendoorn. 2015. “Genealogy of Traffic Flow Models.” Euro Journal on Transportation and Logistics, 4(4): 445-473.

57
Wiedemann, Rainer. 1974. “Simulation des StraBenverkehrsflusses. Institut fur Verkehrswesen,” University of Karlsruhe, Germany.
Young, Mark S., Karel A. Brookhuis, Christopher D. Wickens, and Peter A. Hancock. 2015. “State of science: mental workload in ergonomics.” Ergonomics, 58(1): 1-17.
Zheng, Yang, Jianqiang Wang, Xiaofei Li, Chenfei Yu, Kenji Kodaka, and Keqiang Li. 2014. “Driving Risk Assessment using Cluster Analysis based on Naturalistic Driving Data.” IEEE 17th International Conference on Intelligent Transportation Systems (ITSC), 2584-2589.
Zhang, Yuyu, and Takatsune Kumada. 2017. “Relationship between workload and mind wandering in simulated driving.” PLoS ONE 12(5).

58
Appendix A: Internet Information Statement
59
Appendix B: IRB Approval Letter

60
Appendix C: Flyer for Recruiting Participants

61
Appendix D: Informed Consent Document
INFORMED CONSENT DOCUMENT
Dr. Alexandra Kondyli, PhD Principal Investigator
Department of Civil, Environmental, and Architectural Engineering 1530 W. 15th Street | 2159A Learned Hall
University of Kansas, Lawrence, KS 66045 (785) 864-6521
Modeling Driver Behavior and Driver Aggressiveness Using
Biobehavioral Methods INTRODUCTION The Department of Civil, Environmental, and Architectural Engineering at the University of Kansas supports the practice of protection for human subjects participating in research. The following information is provided for you to decide whether you wish to participate in the present study. You may refuse to sign this form and not participate in this study. You should be aware that even if you agree to participate, you are free to withdraw at any time. If you do withdraw from this study, it will not affect your relationship with this unit, the services it may provide to you, or the University of Kansas. PURPOSE OF THE STUDY The research is part of a Mid-America transportation Center (MATC) project and will be used to analyze driver behavior and aggressiveness. The findings of this research will help us better understand how driver behaviour and aggressiveness are linked to changes in driving performance and workload. The research will help to improve existing traffic flow models by incorporating biobehavioral architecture. PROCEDURES This study is part of a MATC research project. The study will recruit 90 drivers to participate in the experiments, from 18 to 65 years old. During the experiment you will be asked to drive the driving simulator for approximately 70 minutes. The first 5 minutes will be for you to familiarize with the vehicle/simulator and also to see if you have any signs of motion sickness. After that, and provided you do not have motion sickness, we will start collecting data related to your driving along the simulated scenarios. A heart rate monitoring strap will be placed in the center of your chest to collect data on heart beats per second. An elastic cap, surface electrodes, and ear clip will also be used to record the electrical activity of your brain throughout the experiment, a procedure known as electroencephalogram or EEG. We will use a wireless system to record EEG. We will be recording EEG from the electrodes applied to your scalp during the entire duration of the experiment. All electrodes will be dry without the need for gel. You will have intermediate breaks every 5-15 minutes depending on the driving scenario. The principle investigator (PI) will be analyzing your drive and video recordings after the experiment is finished. Only people that are related to this research (Vishal Kummetha and Dr. Alexandra Kondyli and Dr. Christopher Ramey) will have access to these recordings, which will be securely stored in hard drives and kept in the Driving Simulator Lab.

62
Your responses will never be associated with your name and they will be stored electronically on a password-protected computer. Your behavioral test results may be made available to other researchers in our laboratory via an electronic database, which will be stored on a password-protected computer. Your behavioral test results and background demographics information will be maintained in this database. Researchers in our lab will be able to consult the database for later analysis. Your name and contact information will not be included within the database but will be maintained in a locked cabinet as well as electronically in a separate password-protected list. The research team is committed to confidentiality. Your identity will not be revealed in the final report for this project, nor in any of the manuscripts produced. Instead, you will be assigned a participant ID number. SELECTION CRITERIA Participants are required to be between the ages of 18 and 65 years. Participants are selected based on possession of a valid US driver’s license with at least 3 years of driving experience and no less than 5000 miles of annual driving. Participants with any significant heart conditions or at any stage of pregnancy will not be approved for the study. Also, participants with medical conditions such as severe motion sickness or a history of seizures will not be approved for participation in the study. RISKS Driving Simulator The risks for this experiment are primarily related to motion sickness that you might experience as you are driving in the simulator. Motion sickness does not happen to everyone, but typical motion sickness symptoms include: general discomfort, fatigue, headache, eye strain, difficulty focusing, increased salivation, sweating, nausea, difficulty concentrating, fullness of head, blurred vision, dizzy eyes, vertigo, stomach awareness, and burping. We will be monitoring you during the entire duration of the experiment for signs of motion sickness. During the frequent breaks, we will also ask you several questions on how you feel, so we determine whether you start to experience motion sickness or not. Additionally, you might experience mild stress during decision-making during the driving portion of the study, but this stressor is no more than most people experience on a daily basis. You might also experience mild anxiety about being video recorded while you are driving. Behavioral Testing The testing, as with any testing, may be an inconvenience and cause fatigue, but the tests are not known to cause undue distress or emotional stress. You may be asked to perform a task that you find very difficult or irritating. If you find the task too annoying or frustrating the experiment will be discontinued. Although there is a possible risk of loss of confidentiality with the maintenance of databases, every effort will be made to minimize this risk through the use of password-protection and the separation of name and contact information from behavioral testing results as discussed above. Electroencephalogram There are no risks associated with EEG recordings. There might be slight itchiness or tightness around the head due to the application of the head cap and electrodes.

63
Heart Rate Chest Strap There are no risks associated with the Polar HR10 monitor. BENEFITS There are no direct personal benefits from participating in this research. PAYMENT TO PARTICIPANTS You will be given $50 compensation (in the form of a gift card) for participating in this driving simulator data collection experiment. You will be receiving cash at the end of the experiment. Investigators may ask for your social security number in order to comply with federal and state tax and accounting regulations. PARTICIPANT CONFIDENTIALITY Your name will not be associated in any publication or presentation with the information collected about you or with the research findings from this study. Instead, the researchers will use a study number or a pseudonym rather than your name. Your identifiable information will not be shared unless (a) it is required by law or university policy, or (b) you give written permission. Permission granted on this date to use and disclose your information remains in effect indefinitely. By signing this form you give permission for the use and disclosure of your information for purposes of this study at any time in the future. INSTITUTIONAL DISCLAIMER STATEMENT In the event of injury, the Kansas Tort Claims Act provides for compensation if it can be demonstrated that the injury was caused by the negligent or wrongful act or omission of a state employee acting within the scope of his/her employment. REFUSAL TO SIGN CONSENT AND AUTHORIZATION You are not required to sign this Consent and Authorization form and you may refuse to do so without affecting your right to any services you are receiving or may receive from the University of Kansas or to participate in any programs or events of the University of Kansas. However, if you refuse to sign, you cannot participate in this study. CANCELLING THIS CONSENT AND AUTHORIZATION You may withdraw your consent to participate in this study at any time, without consequence, and receive part of the compensation of $10 in gift card. If participants do not show up at appointment time or withdraw before the start of the study, no compensation will be provided. QUESTIONS ABOUT PARTICIPATION If you have any questions or concerns about the research study, please contact Vishal Kummetha or Dr. Alexandra Kondyli. They will be glad to answer any of your concerns (Contact information is provided below).
64
PARTICIPANT CERTIFICATION I have read this Consent and Authorization form. I have had the opportunity to ask, and I have received answers to, any questions I had regarding the study. I understand that if I have any additional questions about my rights as a research participant, I may call (785) 864-7429 or (785) 864-7385, write the Human Research Protection Program (HRPP), University of Kansas, 2385 Irving Hill Road, Lawrence, Kansas 66045-7568, or email [email protected]. I agree to take part in this study as a research participant. By my signature I affirm that I am at least 18 years old and that I have received a copy of this Consent and Authorization form. _______________________________ _____________________ Type/Print Participant's Name Date _______________________________ Participant's Signature RESEARCHER CONTACT INFORMATION Dr. Alexandra Kondyli, PhD Principal Investigator Department of Civil, Environmental, and Architectural Engineering 1530 W. 15th Street 2159A Learned Hall University of Kansas Lawrence, KS 66045 (785) 864-6521 Dr. Christopher H. Ramey, PhD Co-Principal Investigator Department of Psychology 426 Fraser Hall University of Kansas Lawrence, KS 66045 785-864-1771 Vishal Kummetha, Graduate Research Assistant Department of Civil, Environmental, and Architectural Engineering 1530 W. 15th Street 2160 Learned Hall University of Kansas Lawrence, KS 66045 (785) 312-0845