modeling flexible water pumping stations
TRANSCRIPT
Merit Order Model PPSGenModeling flexible water pumping stations
October 2017
Content
29/09/2017 2
1. PPSGen 2.0
2. eRisk Group scenarios
3. Examples analysis PPSGen
4. Modelling flexibility of water pump stations
PPSGen: The structure of the model
29/09/2017 3
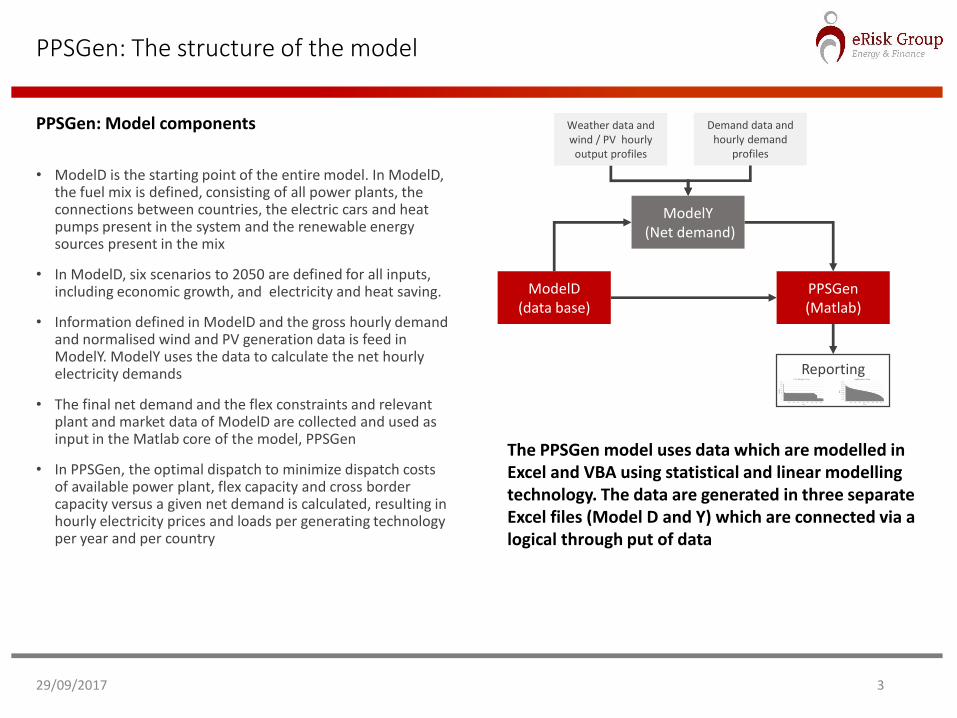
• ModelD is the starting point of the entire model. In ModelD, the fuel mix is defined, consisting of all power plants, the connections between countries, the electric cars and heat pumps present in the system and the renewable energy sources present in the mix
• In ModelD, six scenarios to 2050 are defined for all inputs, including economic growth, and electricity and heat saving.
• Information defined in ModelD and the gross hourly demand and normalised wind and PV generation data is feed in ModelY. ModelY uses the data to calculate the net hourly electricity demands
• The final net demand and the flex constraints and relevant plant and market data of ModelD are collected and used as input in the Matlab core of the model, PPSGen
• In PPSGen, the optimal dispatch to minimize dispatch costs of available power plant, flex capacity and cross border capacity versus a given net demand is calculated, resulting in hourly electricity prices and loads per generating technology per year and per country
The PPSGen model uses data which are modelled in Excel and VBA using statistical and linear modelling technology. The data are generated in three separate Excel files (Model D and Y) which are connected via a logical through put of data
PPSGen: Model components
ModelD (data base)
ModelY(Net demand)
Weather data and wind / PV hourly
output profiles
Demand data and hourly demand
profiles
PPSGen (Matlab)
Reporting
PPSGen: Overview
29/09/2017 4
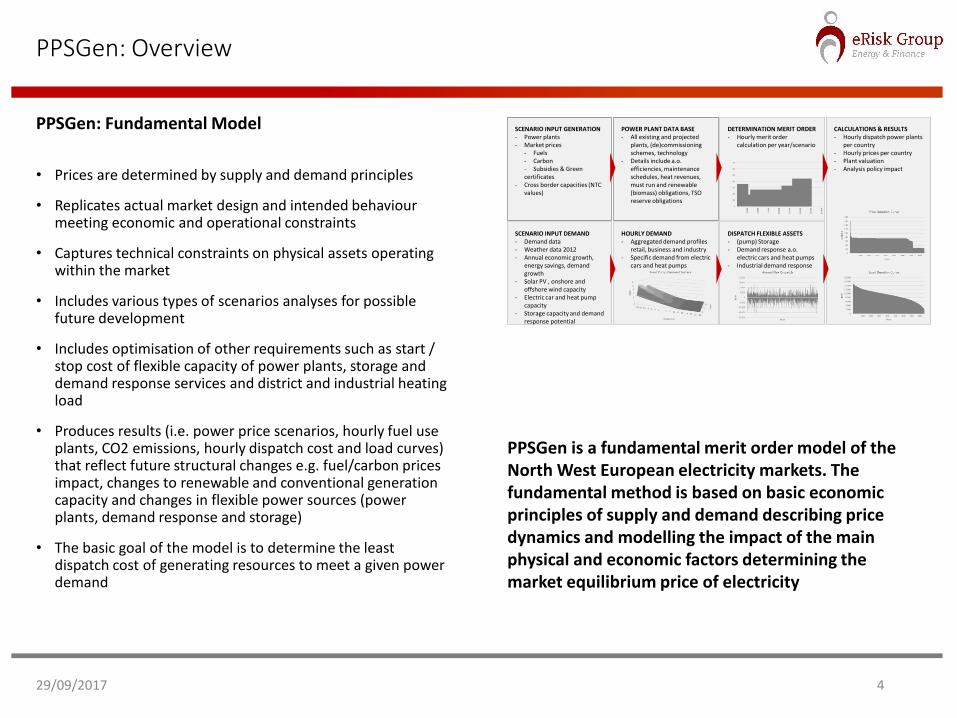
DETERMINATION MERIT ORDER- Hourly merit order
calculation per year/scenario
POWER PLANT DATA BASE- All existing and projected
plants, (de)commissioning schemes, technology
- Details include a.o. efficiencies, maintenance schedules, heat revenues, must run and renewable (biomass) obligations, TSO reserve obligations
HOURLY DEMAND- Aggregated demand profiles
retail, business and industry- Specific demand from electric
cars and heat pumps
DISPATCH FLEXIBLE ASSETS- (pump) Storage- Demand response a.o.
electric cars and heat pumps- Industrial demand response
CALCULATIONS & RESULTS- Hourly dispatch power plants
per country- Hourly prices per country- Plant valuation- Analysis policy impact
SCENARIO INPUT DEMAND- Demand data - Weather data 2012- Annual economic growth,
energy savings, demand growth
- Solar PV , onshore and offshore wind capacity
- Electric car and heat pump capacity
- Storage capacity and demand response potential
SCENARIO INPUT GENERATION- Power plants- Market prices
- Fuels- Carbon- Subsidies & Green certificates
- Cross border capacities (NTC values)
• Prices are determined by supply and demand principles
• Replicates actual market design and intended behaviour meeting economic and operational constraints
• Captures technical constraints on physical assets operating within the market
• Includes various types of scenarios analyses for possible future development
• Includes optimisation of other requirements such as start / stop cost of flexible capacity of power plants, storage and demand response services and district and industrial heating load
• Produces results (i.e. power price scenarios, hourly fuel use plants, CO2 emissions, hourly dispatch cost and load curves) that reflect future structural changes e.g. fuel/carbon prices impact, changes to renewable and conventional generation capacity and changes in flexible power sources (power plants, demand response and storage)
• The basic goal of the model is to determine the least dispatch cost of generating resources to meet a given power demand
PPSGen is a fundamental merit order model of the North West European electricity markets. The fundamental method is based on basic economic principles of supply and demand describing price dynamics and modelling the impact of the main physical and economic factors determining the market equilibrium price of electricity
PPSGen: Fundamental Model
PPSGen: Scenarios
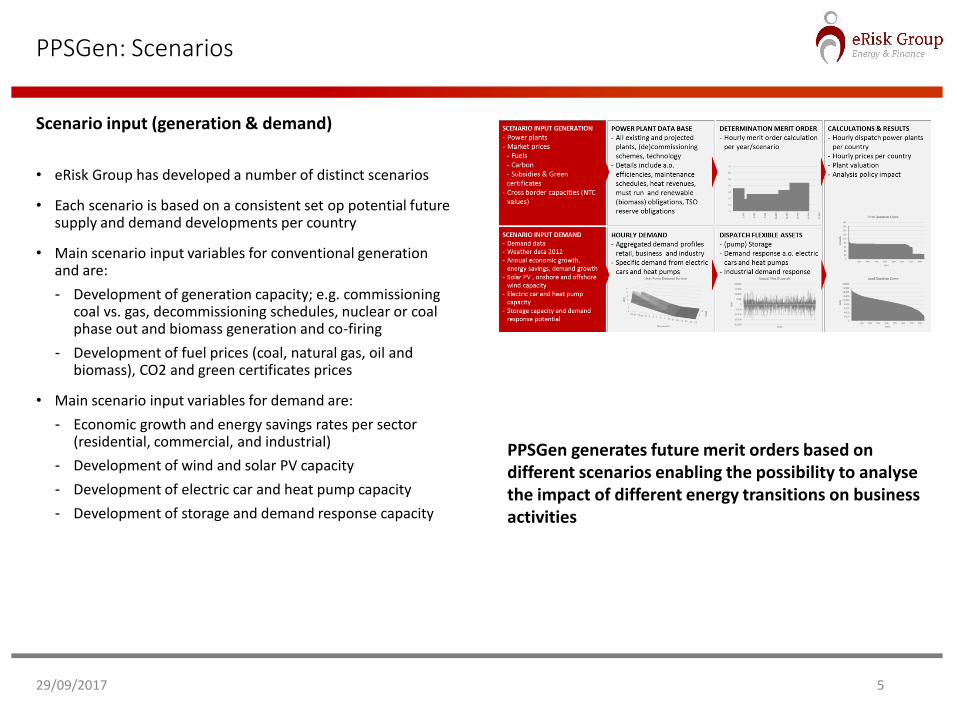
• eRisk Group has developed a number of distinct scenarios
• Each scenario is based on a consistent set op potential future supply and demand developments per country
• Main scenario input variables for conventional generation and are:
- Development of generation capacity; e.g. commissioning coal vs. gas, decommissioning schedules, nuclear or coal phase out and biomass generation and co-firing
- Development of fuel prices (coal, natural gas, oil and biomass), CO2 and green certificates prices
• Main scenario input variables for demand are:
- Economic growth and energy savings rates per sector (residential, commercial, and industrial)
- Development of wind and solar PV capacity
- Development of electric car and heat pump capacity
- Development of storage and demand response capacity
29/09/2017 5
Scenario input (generation & demand)
PPSGen generates future merit orders based on different scenarios enabling the possibility to analyse the impact of different energy transitions on business activities
PPSGen: Power plant database
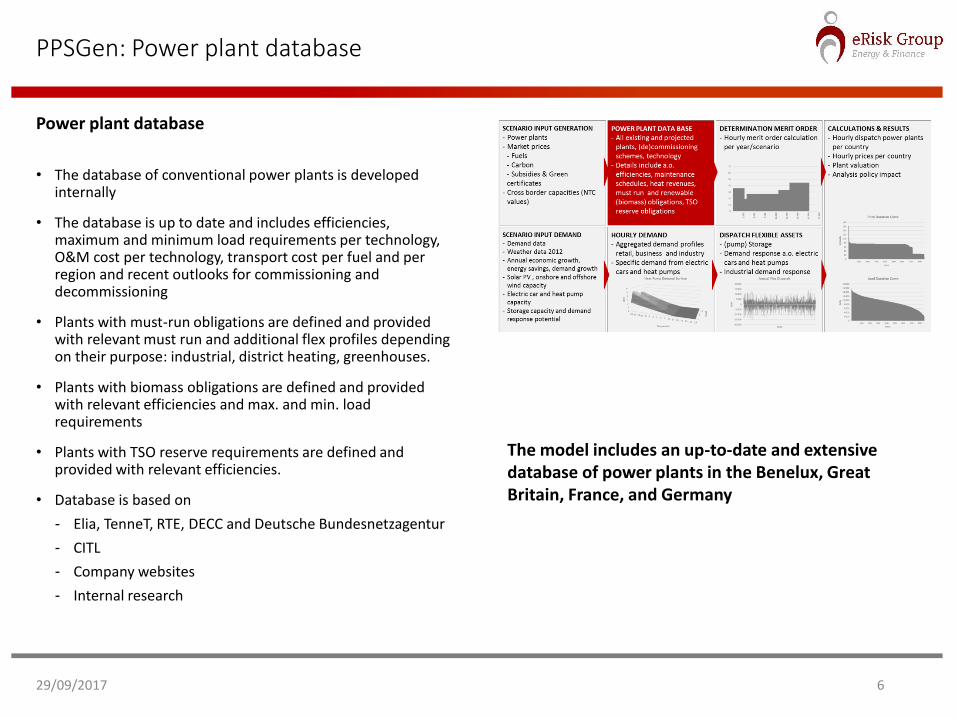
• The database of conventional power plants is developed internally
• The database is up to date and includes efficiencies, maximum and minimum load requirements per technology, O&M cost per technology, transport cost per fuel and per region and recent outlooks for commissioning and decommissioning
• Plants with must-run obligations are defined and provided with relevant must run and additional flex profiles depending on their purpose: industrial, district heating, greenhouses.
• Plants with biomass obligations are defined and provided with relevant efficiencies and max. and min. load requirements
• Plants with TSO reserve requirements are defined and provided with relevant efficiencies.
• Database is based on
- Elia, TenneT, RTE, DECC and Deutsche Bundesnetzagentur
- CITL
- Company websites
- Internal research
29/09/2017 6
Power plant database
The model includes an up-to-date and extensive database of power plants in the Benelux, Great Britain, France, and Germany
PPSGen: Sorting merit order
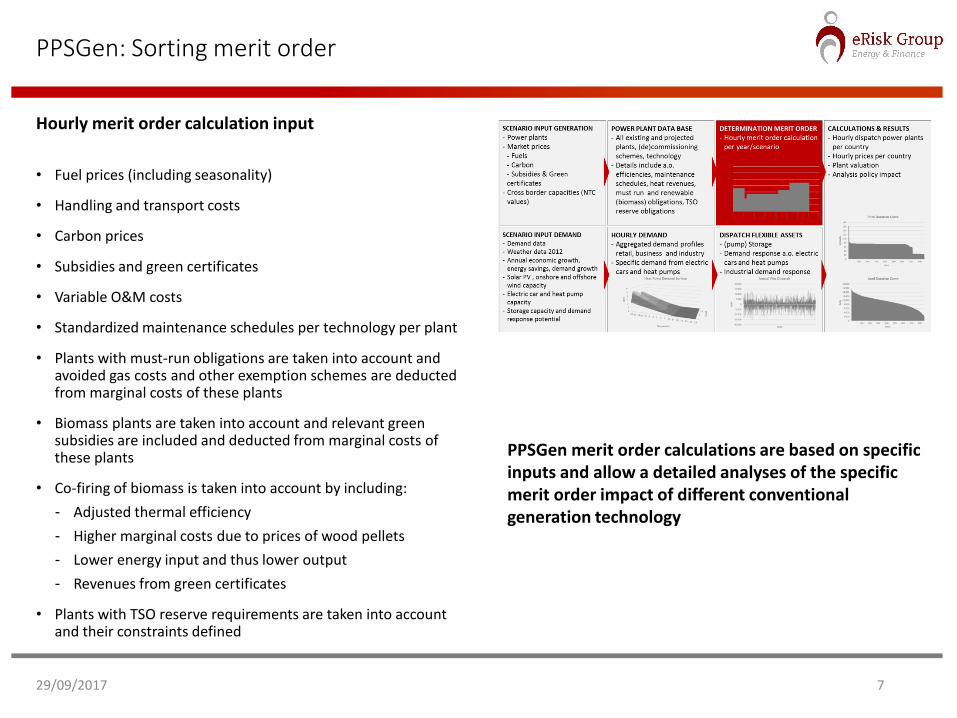
• Fuel prices (including seasonality)
• Handling and transport costs
• Carbon prices
• Subsidies and green certificates
• Variable O&M costs
• Standardized maintenance schedules per technology per plant
• Plants with must-run obligations are taken into account and avoided gas costs and other exemption schemes are deducted from marginal costs of these plants
• Biomass plants are taken into account and relevant green subsidies are included and deducted from marginal costs of these plants
• Co-firing of biomass is taken into account by including:
- Adjusted thermal efficiency
- Higher marginal costs due to prices of wood pellets
- Lower energy input and thus lower output
- Revenues from green certificates
• Plants with TSO reserve requirements are taken into account and their constraints defined
29/09/2017 7
Hourly merit order calculation input
PPSGen merit order calculations are based on specific inputs and allow a detailed analyses of the specific merit order impact of different conventional generation technology
PPSGen: Determination of net demand
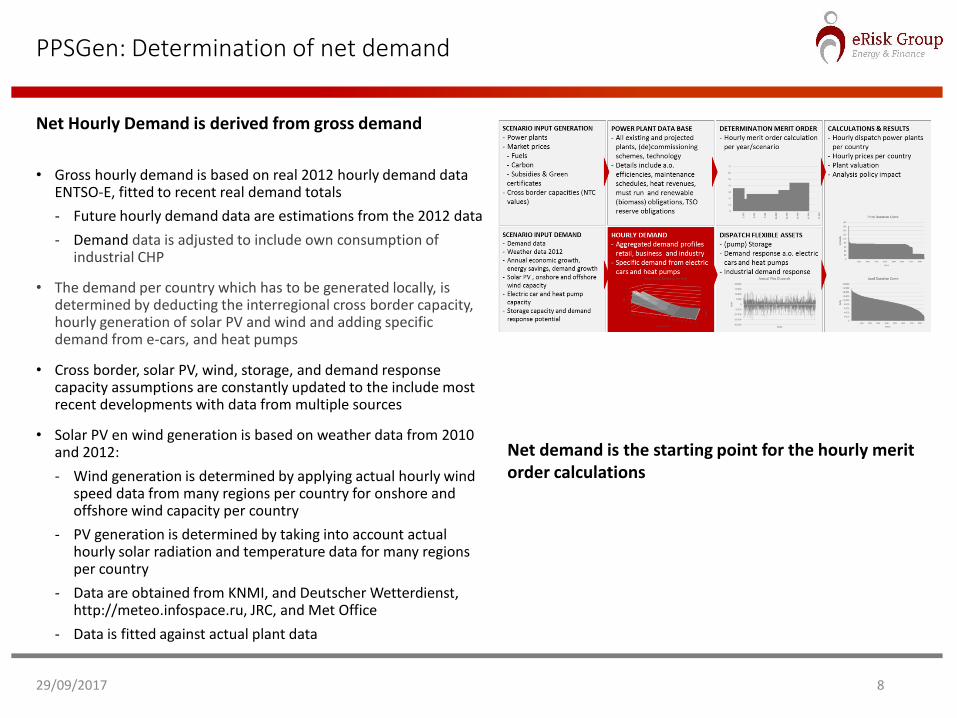
• Gross hourly demand is based on real 2012 hourly demand data ENTSO-E, fitted to recent real demand totals
‐ Future hourly demand data are estimations from the 2012 data
‐ Demand data is adjusted to include own consumption of industrial CHP
• The demand per country which has to be generated locally, is determined by deducting the interregional cross border capacity, hourly generation of solar PV and wind and adding specific demand from e-cars, and heat pumps
• Cross border, solar PV, wind, storage, and demand response capacity assumptions are constantly updated to the include most recent developments with data from multiple sources
• Solar PV en wind generation is based on weather data from 2010 and 2012:
‐ Wind generation is determined by applying actual hourly wind speed data from many regions per country for onshore and offshore wind capacity per country
‐ PV generation is determined by taking into account actual hourly solar radiation and temperature data for many regions per country
‐ Data are obtained from KNMI, and Deutscher Wetterdienst, http://meteo.infospace.ru, JRC, and Met Office
‐ Data is fitted against actual plant data
29/09/2017 8
Net Hourly Demand is derived from gross demand
Net demand is the starting point for the hourly merit order calculations
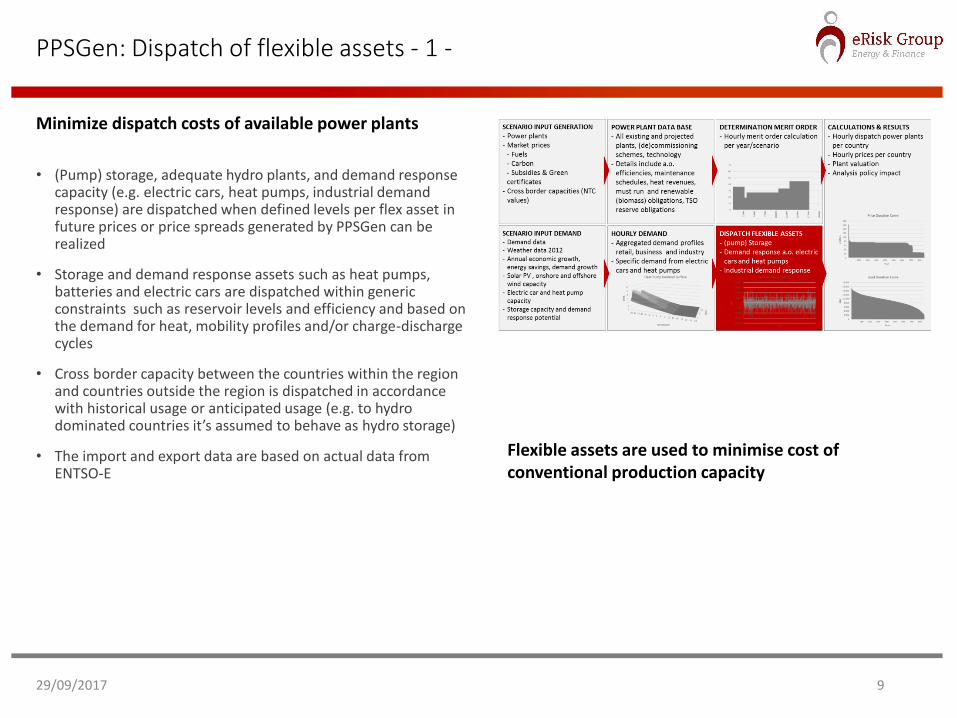
PPSGen: Dispatch of flexible assets - 1 -
• (Pump) storage, adequate hydro plants, and demand response capacity (e.g. electric cars, heat pumps, industrial demand response) are dispatched when defined levels per flex asset in future prices or price spreads generated by PPSGen can be realized
• Storage and demand response assets such as heat pumps, batteries and electric cars are dispatched within generic constraints such as reservoir levels and efficiency and based on the demand for heat, mobility profiles and/or charge-discharge cycles
• Cross border capacity between the countries within the region and countries outside the region is dispatched in accordance with historical usage or anticipated usage (e.g. to hydro dominated countries it’s assumed to behave as hydro storage)
• The import and export data are based on actual data from ENTSO-E
29/09/2017 9
Minimize dispatch costs of available power plants
Flexible assets are used to minimise cost of conventional production capacity

PPSGen: Dispatch of flexible assets - 2 - Cross border flows
29/09/2017 10
Cross border flows between included countries (region)
• The cross border flows between Great Britain, France, Germany, the Netherlands, Belgium, and Luxembourg are determined endogenously in the model
• The cross border capacities are determined based on actual data from ENTSO-E
• Net hourly demand minus hourly cross border capacity determines the minimum generation per country
• The remaining demand for the region (UK, BENELUX, FR, and GE) is optimised on a regional level
• Allocation of regional generation capacity per country based on available import capacity
Cross border flows between the region and other countries
• The cross border flows between the region and other countries is determined by their expected behaviour. Flows with predominantly hydro countries are modelled in such a way to smoothen demand. Flows with countries with a similar fuel mix are modelled based on their historical behaviour
Impact of cross border flows on demand and the merit order

PPSGen: Model calculations & output
• PPSGen is a flexible and transparent tool to generate
‐ Power price scenarios
‐ Plant / portfolio valuation
‐ Plant hourly dispatch
• Analyses can be performed by changing the (key) variables
• The above allows for hourly merit order calculations for different scenarios
• Consequently, it makes PPSGen an ideal tool ideal to perform sensitivity analyses with respect to regulatory and other changes impacting the market environment such as the commissioning or decommissioning of power plants, the penetration of renewable energy and fuel and CO2 price developments
29/09/2017 11
PPSGen is a flexible and transparent tool which can be used for multiple analyses, including the impact of market changes and regulation on prices, portfolio value, and plant dispatch
The PPSGen tool
Content
29/09/2017 12
1. PPSGen 2.0
2. eRisk Group scenarios
3. Examples analysis PPSGen
4. Modelling flexibility of water pump stations
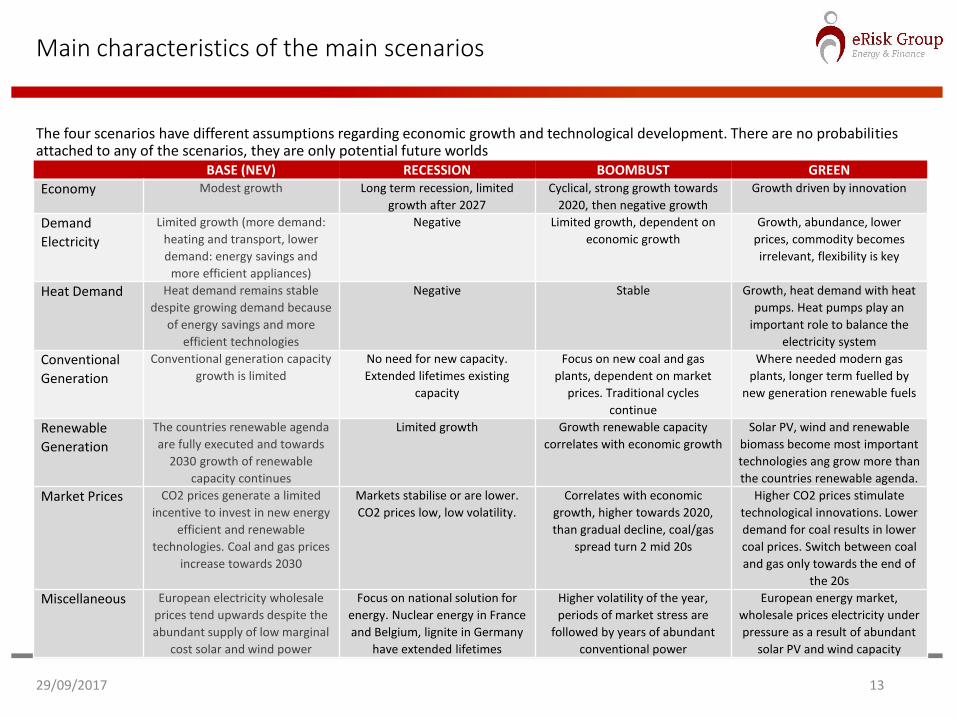
Main characteristics of the main scenarios
The four scenarios have different assumptions regarding economic growth and technological development. There are no probabilities attached to any of the scenarios, they are only potential future worlds
29/09/2017 13
BASE (NEV) RECESSION BOOMBUST GREEN
Economy Modest growth Long term recession, limited
growth after 2027
Cyclical, strong growth towards
2020, then negative growth
Growth driven by innovation
Demand
Electricity
Limited growth (more demand:
heating and transport, lower
demand: energy savings and
more efficient appliances)
Negative Limited growth, dependent on
economic growth
Growth, abundance, lower
prices, commodity becomes
irrelevant, flexibility is key
Heat Demand Heat demand remains stable
despite growing demand because
of energy savings and more
efficient technologies
Negative Stable Growth, heat demand with heat
pumps. Heat pumps play an
important role to balance the
electricity system
Conventional
Generation
Conventional generation capacity
growth is limited
No need for new capacity.
Extended lifetimes existing
capacity
Focus on new coal and gas
plants, dependent on market
prices. Traditional cycles
continue
Where needed modern gas
plants, longer term fuelled by
new generation renewable fuels
Renewable
Generation
The countries renewable agenda
are fully executed and towards
2030 growth of renewable
capacity continues
Limited growth Growth renewable capacity
correlates with economic growth
Solar PV, wind and renewable
biomass become most important
technologies ang grow more than
the countries renewable agenda.
Market Prices CO2 prices generate a limited
incentive to invest in new energy
efficient and renewable
technologies. Coal and gas prices
increase towards 2030
Markets stabilise or are lower.
CO2 prices low, low volatility.
Correlates with economic
growth, higher towards 2020,
than gradual decline, coal/gas
spread turn 2 mid 20s
Higher CO2 prices stimulate
technological innovations. Lower
demand for coal results in lower
coal prices. Switch between coal
and gas only towards the end of
the 20s
Miscellaneous European electricity wholesale
prices tend upwards despite the
abundant supply of low marginal
cost solar and wind power
Focus on national solution for
energy. Nuclear energy in France
and Belgium, lignite in Germany
have extended lifetimes
Higher volatility of the year,
periods of market stress are
followed by years of abundant
conventional power
European energy market,
wholesale prices electricity under
pressure as a result of abundant
solar PV and wind capacity
Content
29/09/2017 14
1. PPSGen 2.0
2. eRisk Group scenarios
3. Examples analysis PPSGen
4. Modelling flexibility of water pump stations
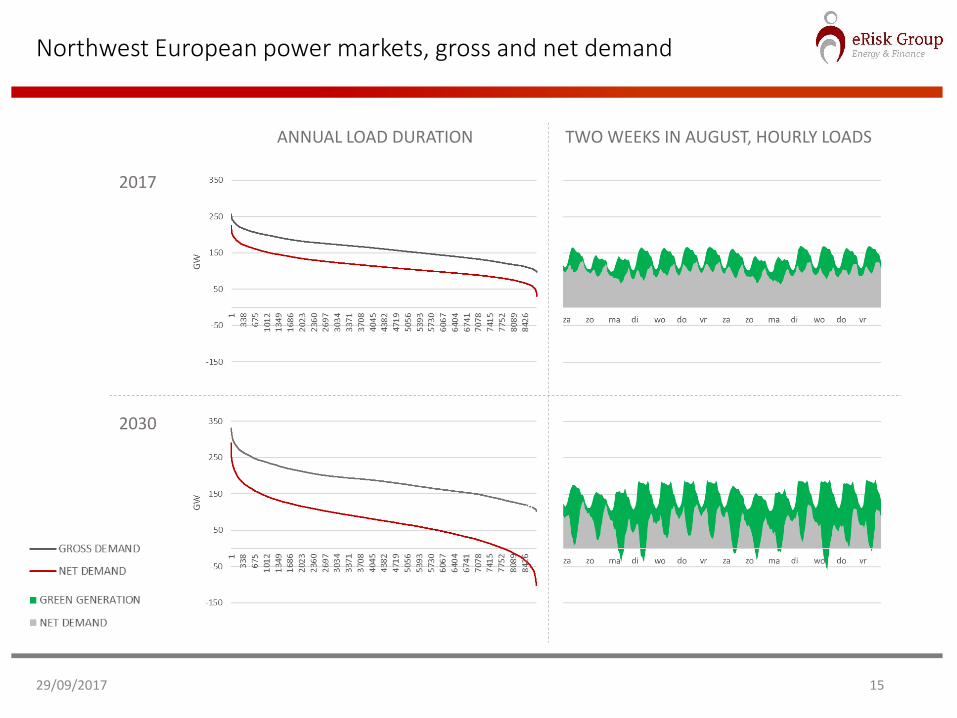
Northwest European power markets, gross and net demand
29/09/2017 15
2017
2030
ANNUAL LOAD DURATION TWO WEEKS IN AUGUST, HOURLY LOADS
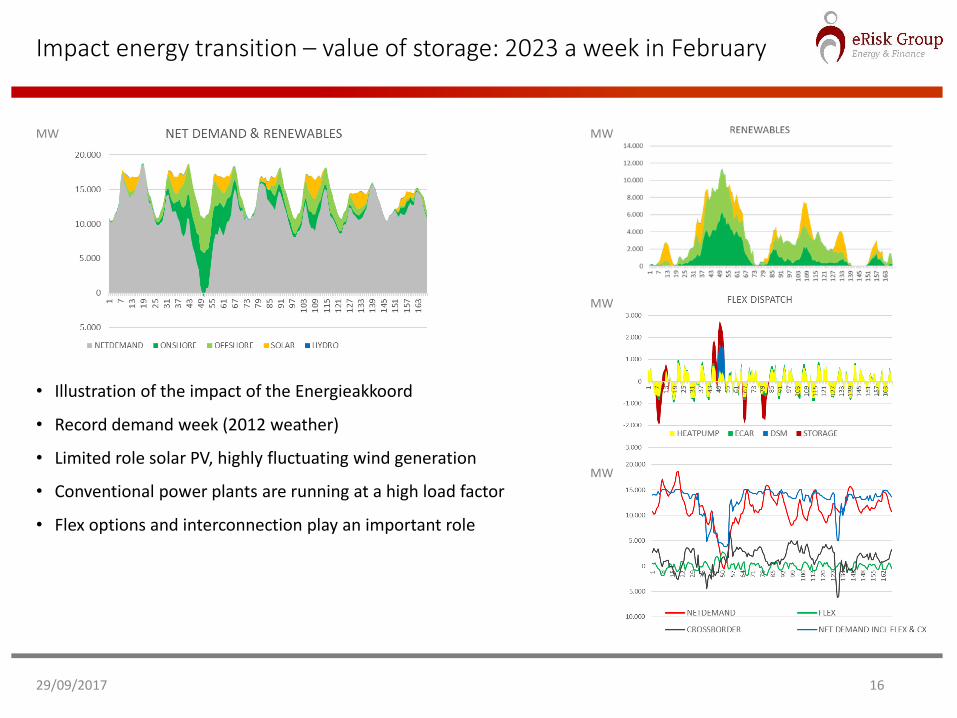
Impact energy transition – value of storage: 2023 a week in February
• Illustration of the impact of the Energieakkoord
• Record demand week (2012 weather)
• Limited role solar PV, highly fluctuating wind generation
• Conventional power plants are running at a high load factor
• Flex options and interconnection play an important role
29/09/2017 16
MW
MWMW
MW
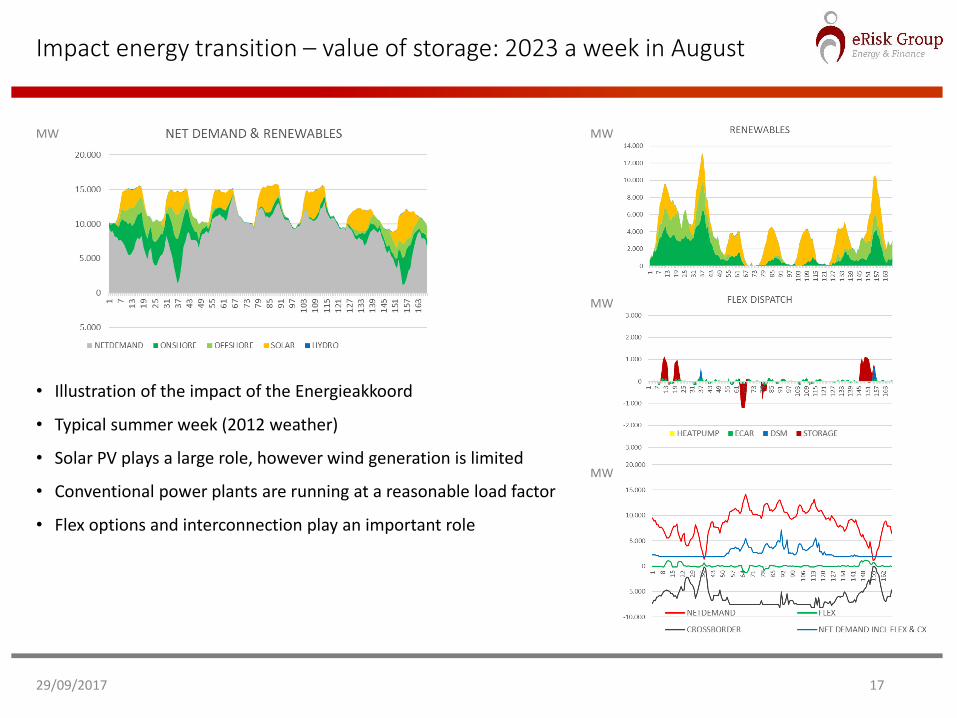
Impact energy transition – value of storage: 2023 a week in August
• Illustration of the impact of the Energieakkoord
• Typical summer week (2012 weather)
• Solar PV plays a large role, however wind generation is limited
• Conventional power plants are running at a reasonable load factor
• Flex options and interconnection play an important role
29/09/2017 17
MW
MWMW
MW
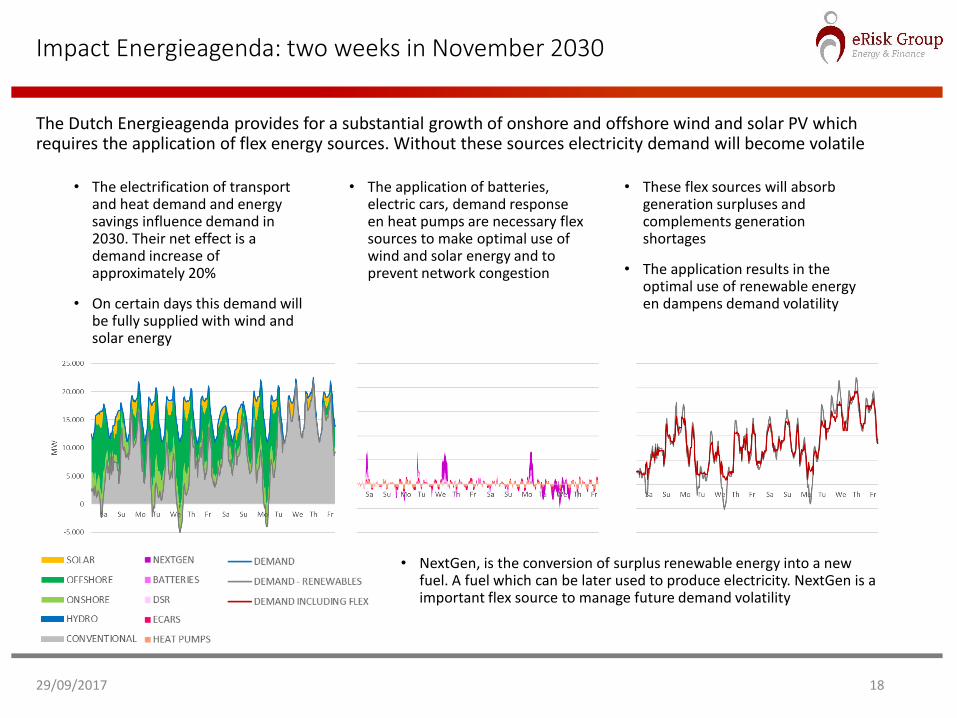
Impact Energieagenda: two weeks in November 2030
The Dutch Energieagenda provides for a substantial growth of onshore and offshore wind and solar PV which requires the application of flex energy sources. Without these sources electricity demand will become volatile
• The electrification of transport and heat demand and energy savings influence demand in 2030. Their net effect is a demand increase of approximately 20%
• On certain days this demand will be fully supplied with wind and solar energy
• The application of batteries, electric cars, demand response en heat pumps are necessary flex sources to make optimal use of wind and solar energy and to prevent network congestion
• These flex sources will absorb generation surpluses and complements generation shortages
• The application results in the optimal use of renewable energy en dampens demand volatility
• NextGen, is the conversion of surplus renewable energy into a new fuel. A fuel which can be later used to produce electricity. NextGen is a important flex source to manage future demand volatility
29/09/2017 18
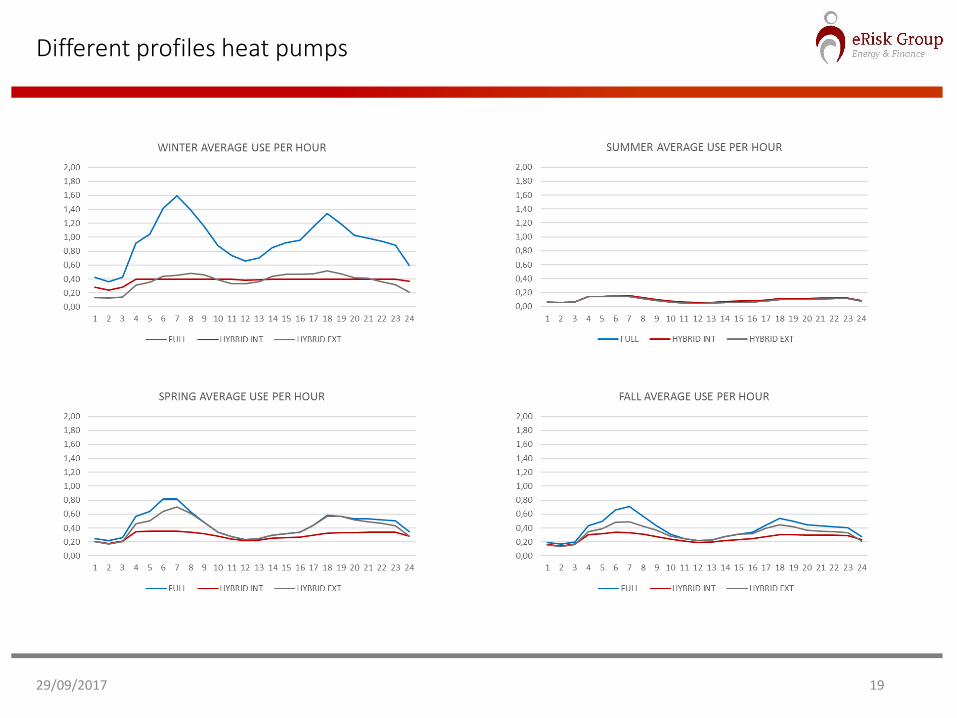
Different profiles heat pumps
29/09/2017 19
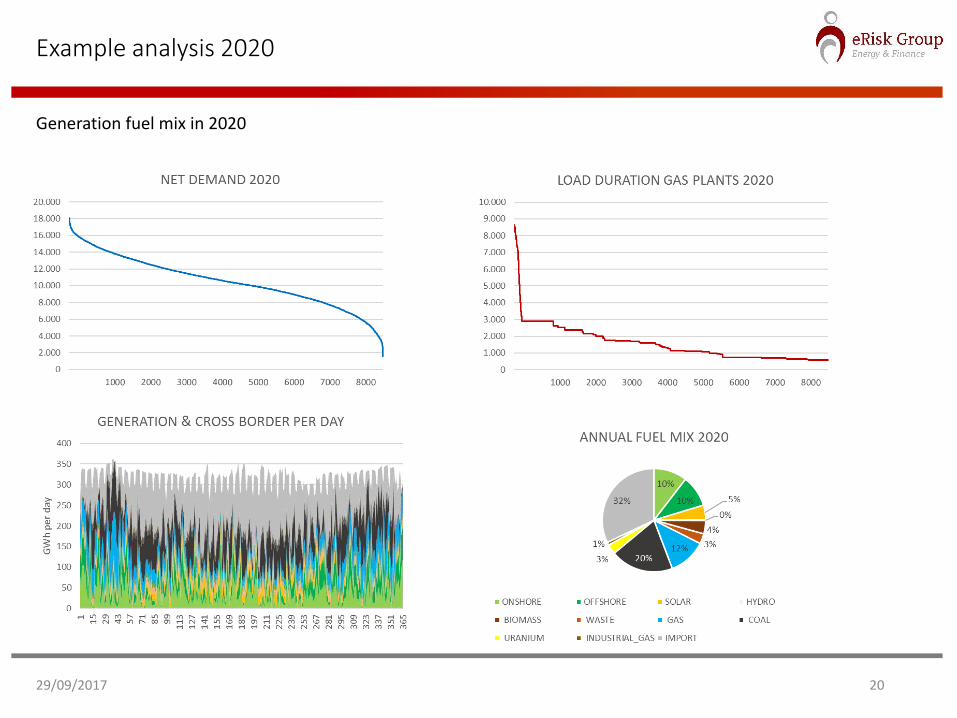
Example analysis 2020
29/09/2017 20
Generation fuel mix in 2020
Content
29/09/2017 21
1. PPSGen 2.0
2. eRisk Group scenarios
3. Examples analysis PPSGen
4. Modelling flexibility of water pump stations
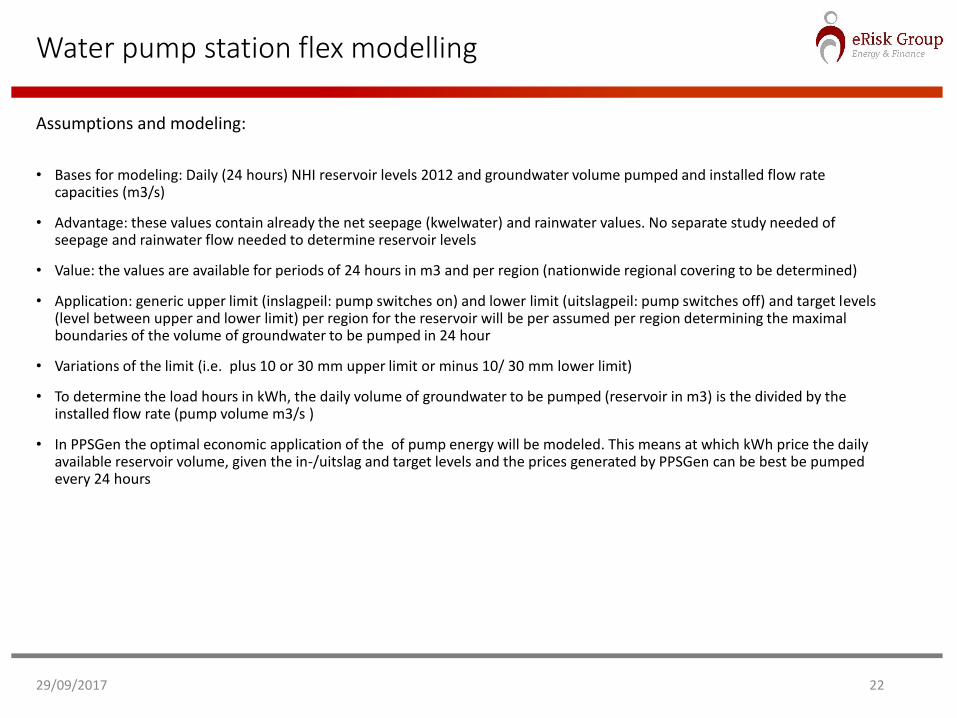
Water pump station flex modelling
• Bases for modeling: Daily (24 hours) NHI reservoir levels 2012 and groundwater volume pumped and installed flow rate capacities (m3/s)
• Advantage: these values contain already the net seepage (kwelwater) and rainwater values. No separate study needed of seepage and rainwater flow needed to determine reservoir levels
• Value: the values are available for periods of 24 hours in m3 and per region (nationwide regional covering to be determined)
• Application: generic upper limit (inslagpeil: pump switches on) and lower limit (uitslagpeil: pump switches off) and target levels (level between upper and lower limit) per region for the reservoir will be per assumed per region determining the maximal boundaries of the volume of groundwater to be pumped in 24 hour
• Variations of the limit (i.e. plus 10 or 30 mm upper limit or minus 10/ 30 mm lower limit)
• To determine the load hours in kWh, the daily volume of groundwater to be pumped (reservoir in m3) is the divided by the installed flow rate (pump volume m3/s )
• In PPSGen the optimal economic application of the of pump energy will be modeled. This means at which kWh price the daily available reservoir volume, given the in-/uitslag and target levels and the prices generated by PPSGen can be best be pumped every 24 hours
29/09/2017 22
Assumptions and modeling:

Contact
• MAARTEN MEIJBURG
- mobile: +31 643053281
• RUUT SCHALIJ
- mobile: +31 620437109
• Website
- www.eriskgroup.com
29/09/2017 23