modeling hydraulic fracturing and …santos/research/talks_seg_2015/f... · induced seismicity in...
TRANSCRIPT
MODELING HYDRAULIC FRACTURING AND INDUCED SEISMICITY IN UNCONVENTIONAL
RESERVOIRS USING MULTIPHASEFLUID-FLOW SIMULATIONS
Juan E. Santos
Work in collaboration with: L. A. Macias (UBA), G. B. Savioli (UBA) and J. M. Carcione (OGS)
Instituto del Gas y del Petróleo, Facultad de Ingeniería UBA and Department of Mathematics, Purdue University and Universidad Nacional de La Plata
INTRODUCTION I
Hydraulic fracturing or fracking consists in injecting fluids at high pressure into areservoir in order to produce fractures or to connect already existing naturalfractures, creating pathways where the hydrocarbons flow to the wellbore.
This procedure is required in unconventional reservoirs because of their lowpermeability, as it is the case of tight gas, tight oil, shale gas or shale oilreservoirs.
During the process of fluid injection into a reservoir the pore pressure builds upand, consequently, micro-seismic events along pre-existing zones of weaknessmay occur.
Tracking these events can help to follow the evolution of the fractures along withits geometry.
INTRODUCTION II
In this work, we employ a multiphase fluid flow numerical simulator to modelthe distribution of micro-seismic events caused by pore pressure increase duringwater injection in a gas reservoir.
Given a spatial distribution of weak stress zones and a threshold pore pressure,the simulator predicts the spatio-temporal distribution of the micro-seismicevents.
The influence of different reservoir rock matrix properties and of the interactingfluids over the time-spatial distribution of these sources is analyzed.
A wave propagation simulator is applied to monitor the evolution of the fracturenetwork.
METHODOLOGY
Use a Black-OIL multiphase fluid flow numerical simulator to modelwater injection in a gas reservoir.
Apply a breakdown pressure criterion to determine thecomputational cells to be fractured and where the petrophysicalproperties must be updated.
Analyze the microseismic event distribution.
Use a numerical simulator of wave propagation in viscoelastic mediato monitor the fracking procedure.
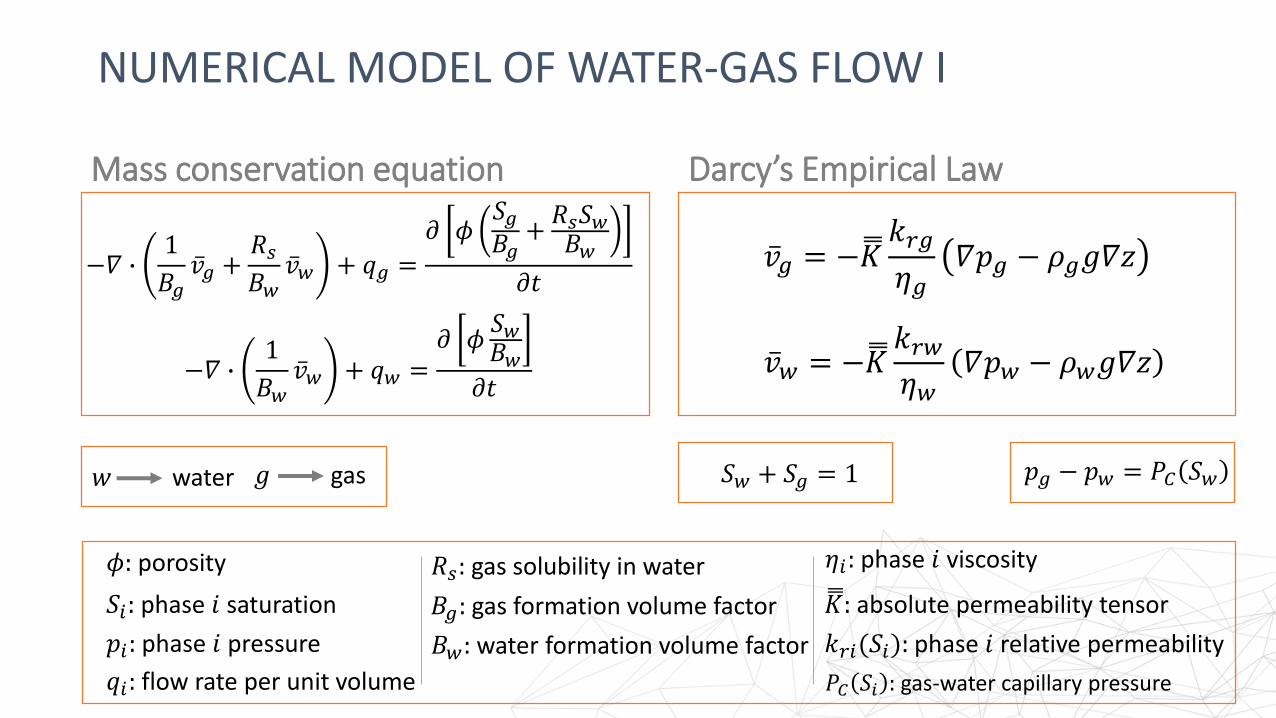
NUMERICAL MODEL OF WATER-GAS FLOW I
Mass conservation equation
𝑆𝑖: phase 𝑖 saturation
𝜙: porosity
𝑞𝑖: flow rate per unit volume
−𝛻 ∙1
𝐵𝑔 𝑣𝑔 +
𝑅𝑠𝐵𝑤
𝑣𝑤 + 𝑞𝑔 =
𝜕 𝜙𝑆𝑔𝐵𝑔
+𝑅𝑠𝑆𝑤𝐵𝑤
𝜕𝑡
−𝛻 ∙1
𝐵𝑤 𝑣𝑤 + 𝑞𝑤 =
𝜕 𝜙𝑆𝑤𝐵𝑤
𝜕𝑡
𝑅𝑠: gas solubility in water
𝐵𝑔: gas formation volume factor
𝐵𝑤: water formation volume factor
𝑣𝑔 = − 𝐾𝑘𝑟𝑔
𝜂𝑔𝛻𝑝𝑔 − 𝜌𝑔𝑔𝛻𝑧
𝑣𝑤 = − 𝐾𝑘𝑟𝑤𝜂𝑤
𝛻𝑝𝑤 − 𝜌𝑤𝑔𝛻𝑧
Darcy’s Empirical Law
𝜂𝑖: phase 𝑖 viscosity
𝑝𝑖: phase 𝑖 pressure
𝐾: absolute permeability tensor
𝑘𝑟𝑖(𝑆𝑖): phase 𝑖 relative permeability
𝑆𝑤 + 𝑆𝑔 = 1 𝑝𝑔 − 𝑝𝑤 = 𝑃𝐶 𝑆𝑤
𝑃𝐶 𝑆𝑖 : gas-water capillary pressure
𝑤 water 𝑔 gas
The numerical solution is obtained employing the public domainsoftware BOAST.
BOAST solves the flow differential equations using IMPES (IMplicitPressure Explicit Saturation), a finite difference technique.
The basic idea of IMPES is to solve:
A pressure equation obtained combining the flow equations forboth phases.
A saturation equation, which is the flow equation for the waterphase.
NUMERICAL MODEL OF WATER-GAS FLOW II
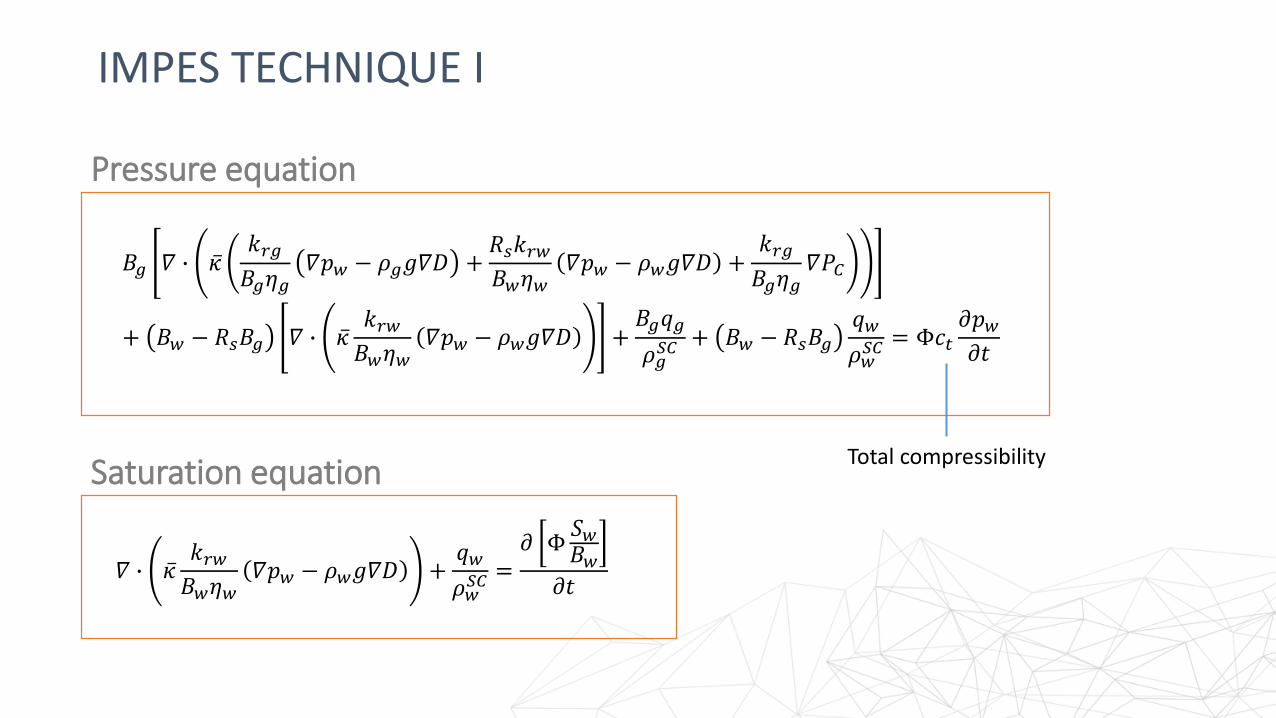
IMPES TECHNIQUE I
Pressure equation
Saturation equation
𝐵𝑔 𝛻 ∙ 𝜅𝑘𝑟𝑔
𝐵𝑔𝜂𝑔𝛻𝑝𝑤 − 𝜌𝑔𝑔𝛻𝐷 +
𝑅𝑠𝑘𝑟𝑤𝐵𝑤𝜂𝑤
𝛻𝑝𝑤 − 𝜌𝑤𝑔𝛻𝐷 +𝑘𝑟𝑔
𝐵𝑔𝜂𝑔𝛻𝑃𝐶
+ 𝐵𝑤 − 𝑅𝑠𝐵𝑔 𝛻 ∙ 𝜅𝑘𝑟𝑤𝐵𝑤𝜂𝑤
𝛻𝑝𝑤 − 𝜌𝑤𝑔𝛻𝐷 +𝐵𝑔𝑞𝑔
𝜌𝑔𝑆𝐶 + 𝐵𝑤 − 𝑅𝑠𝐵𝑔
𝑞𝑤
𝜌𝑤𝑆𝐶 = Φ𝑐𝑡
𝜕𝑝𝑤𝜕𝑡
𝛻 ∙ 𝜅𝑘𝑟𝑤𝐵𝑤𝜂𝑤
𝛻𝑝𝑤 − 𝜌𝑤𝑔𝛻𝐷 +𝑞𝑤
𝜌𝑤𝑆𝐶 =
𝜕 Φ𝑆𝑤𝐵𝑤
𝜕𝑡
Total compressibility
IMPES TECHNIQUE II
The system is linearized evaluating the pressure and saturationdependent coefficients at the previous time step.
The pressure equation is solved implicitly, applying a Block SuccessiveOver Relaxation method (BSOR) to compute the linear systemsolution.
The saturation equation is solved explicitly, therefore stabilityrestrictions are considered to select the time step.
FRACTURE CRITERION
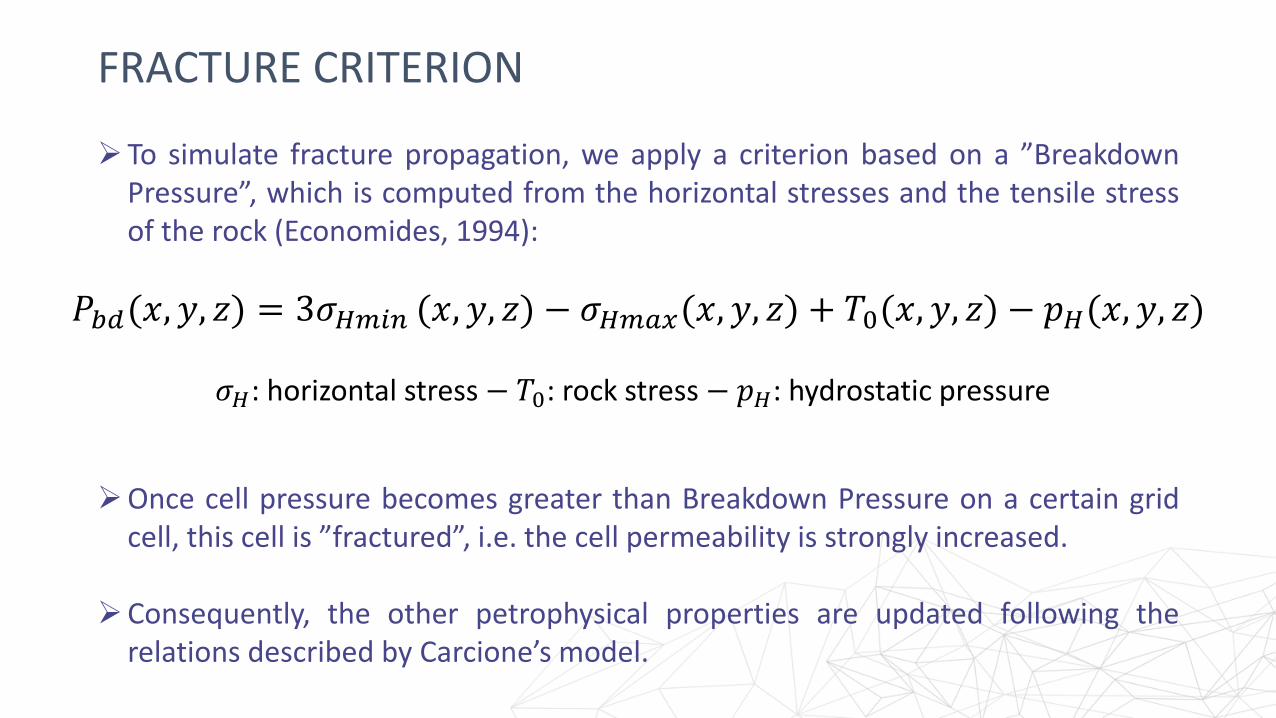
To simulate fracture propagation, we apply a criterion based on a ”BreakdownPressure”, which is computed from the horizontal stresses and the tensile stressof the rock (Economides, 1994):
𝑃𝑏𝑑(𝑥, 𝑦, 𝑧) = 3𝜎𝐻𝑚𝑖𝑛 (𝑥, 𝑦, 𝑧) − 𝜎𝐻𝑚𝑎𝑥(𝑥, 𝑦, 𝑧) + 𝑇0(𝑥, 𝑦, 𝑧) − 𝑝𝐻(𝑥, 𝑦, 𝑧)
𝜎𝐻: horizontal stress − 𝑇0: rock stress − 𝑝𝐻: hydrostatic pressure
Once cell pressure becomes greater than Breakdown Pressure on a certain gridcell, this cell is ”fractured”, i.e. the cell permeability is strongly increased.
Consequently, the other petrophysical properties are updated following therelations described by Carcione’s model.
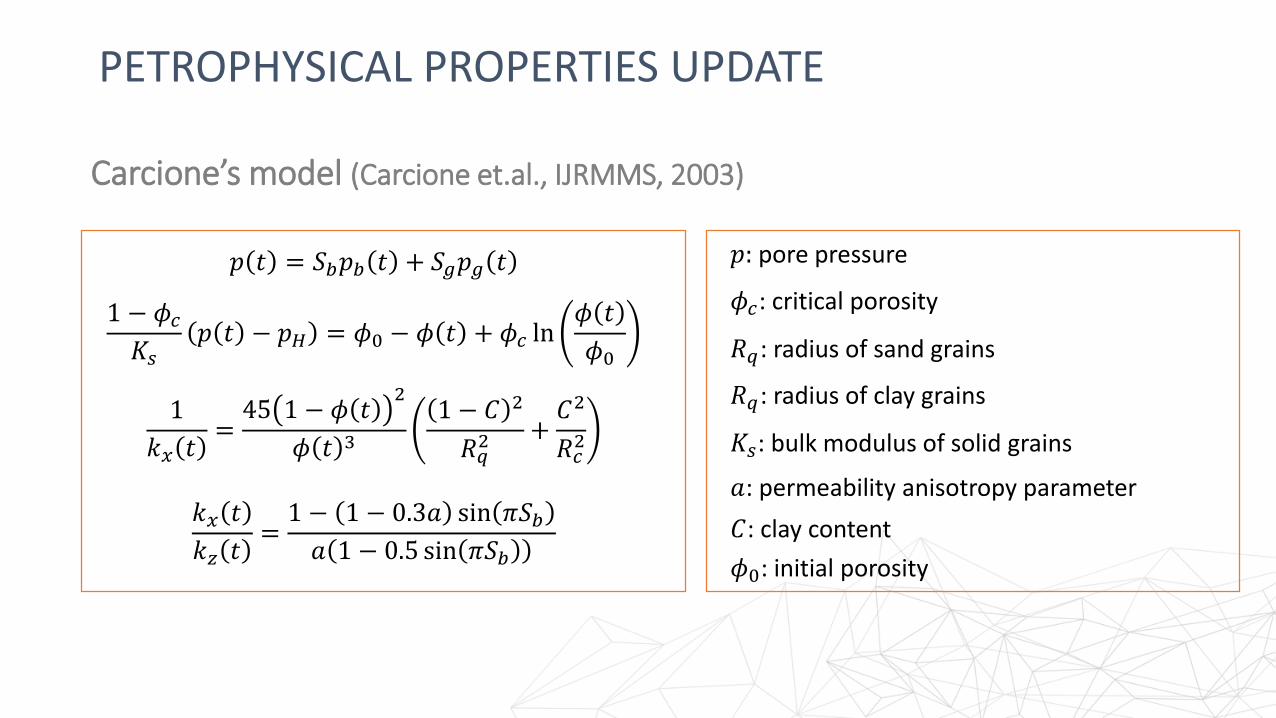
PETROPHYSICAL PROPERTIES UPDATE
𝑝 𝑡 = 𝑆𝑏𝑝𝑏 𝑡 + 𝑆𝑔𝑝𝑔 𝑡
1 − 𝜙𝑐𝐾𝑠
𝑝 𝑡 − 𝑝𝐻 = 𝜙0 − 𝜙 𝑡 + 𝜙𝑐 ln𝜙 𝑡
𝜙0
1
𝑘𝑥 𝑡=45 1 − 𝜙 𝑡
2
𝜙 𝑡 3
1 − 𝐶 2
𝑅𝑞2 +
𝐶2
𝑅𝑐2
𝑘𝑥 𝑡
𝑘𝑧 𝑡=1 − 1 − 0.3𝑎 sin 𝜋𝑆𝑏𝑎 1 − 0.5 sin 𝜋𝑆𝑏
𝑝: pore pressure
𝜙𝑐: critical porosity
𝜙0: initial porosity
𝐾𝑠: bulk modulus of solid grains
𝐶: clay content
𝑎: permeability anisotropy parameter
𝑅𝑞: radius of sand grains
𝑅𝑞: radius of clay grains
Carcione’s model (Carcione et.al., IJRMMS, 2003)
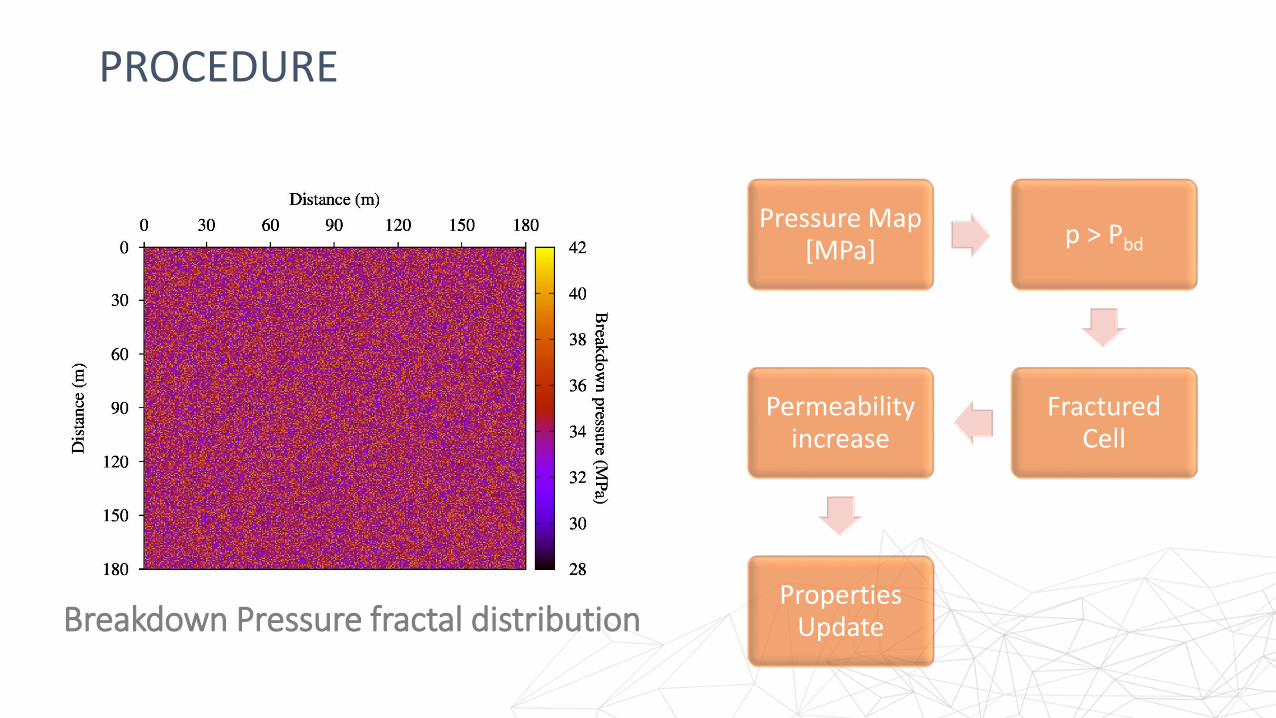
PROCEDURE
Pressure Map [MPa]
p > Pbd
Fractured Cell
Permeability increase
Properties UpdateBreakdown Pressure fractal distribution
NUMERICAL EXPERIMENTS IConsider a 2D horizontal section in the x-y plane of a low permeability gas reservoir (0.1
mD) with an extent of 180 m x 180 m.
The reservoir is located at 2500 m b.s.l., with 10% of initial porosity and 30% of initial watersaturation. The data correspond to the Vaca Muerta formation.
The simulation is performed by using a 300 × 300 uniform mesh.
In the first experiment we assume that porosity and permeability are not modified whenthe breakdown pressure (Pbd) is reached.
We also assume a fractal distribution of Pbd using the Von-Kármán correlation function(Frankel and Clayton, 1986).
Water is injected at the center of the reservoir section with a constant flow rate of 0,15m3/s.
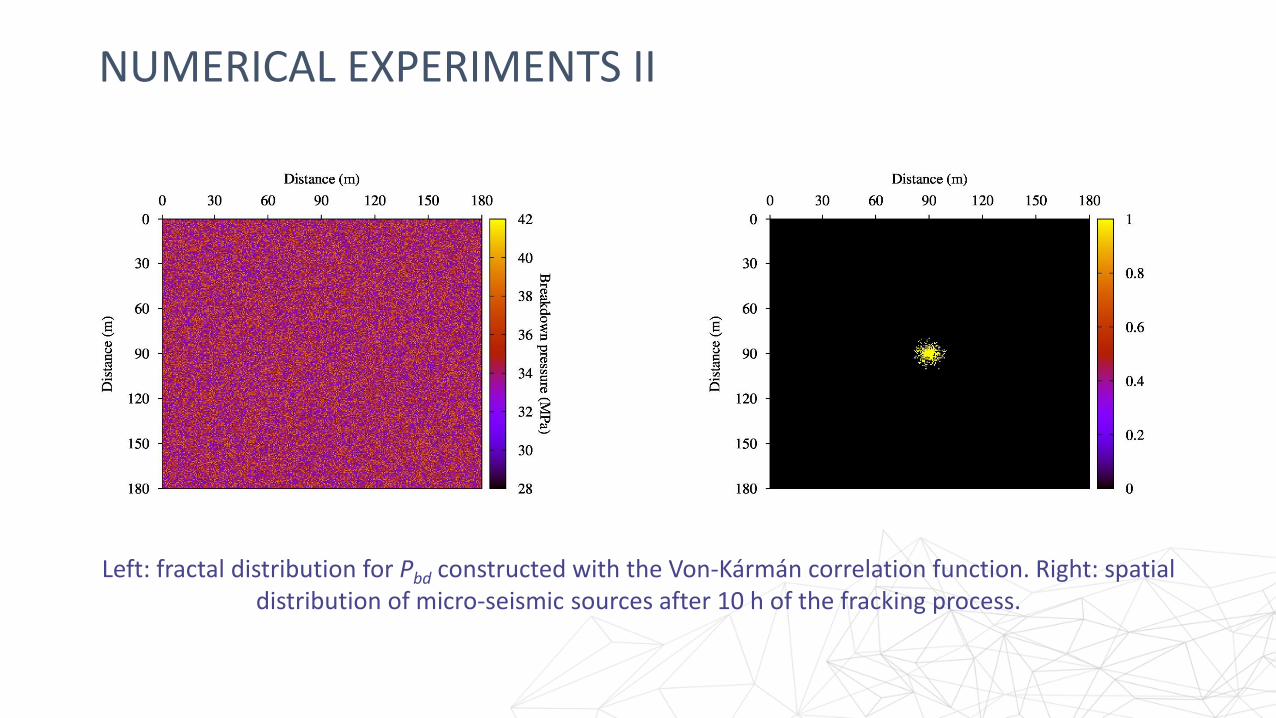
NUMERICAL EXPERIMENTS II
Left: fractal distribution for Pbd constructed with the Von-Kármán correlation function. Right: spatial distribution of micro-seismic sources after 10 h of the fracking process.
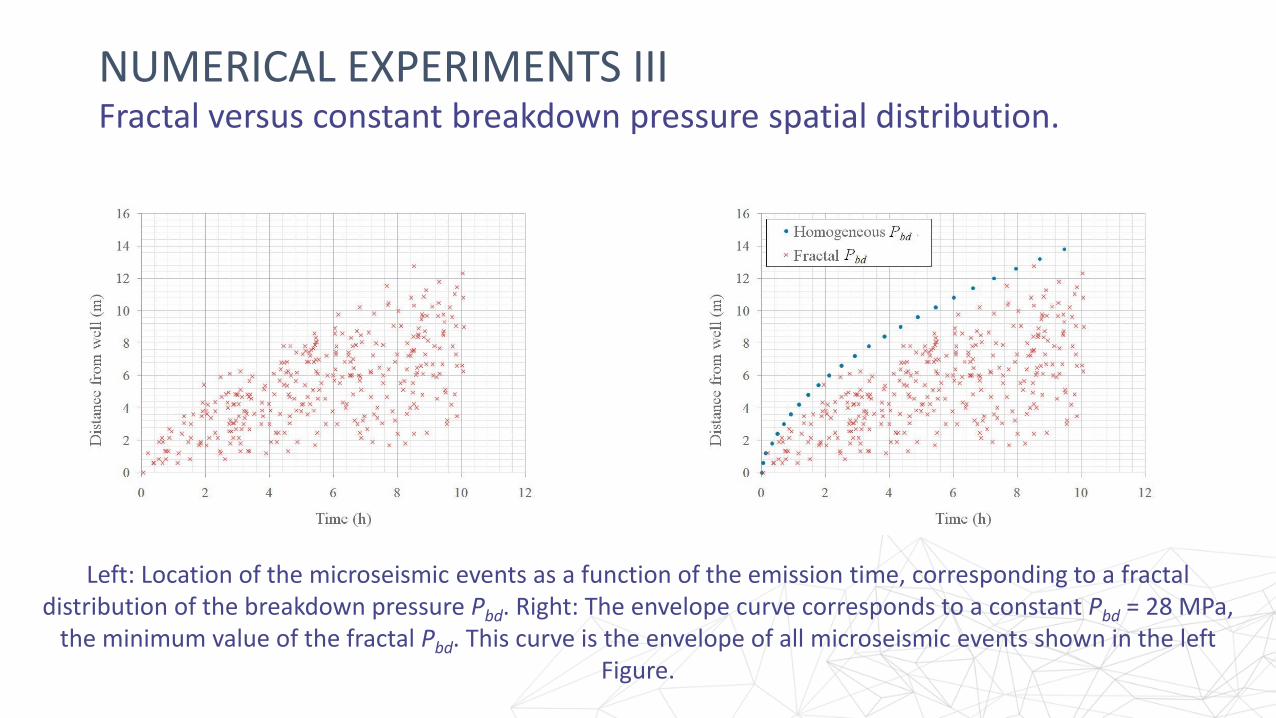
NUMERICAL EXPERIMENTS III
Left: Location of the microseismic events as a function of the emission time, corresponding to a fractal distribution of the breakdown pressure Pbd. Right: The envelope curve corresponds to a constant Pbd = 28 MPa,
the minimum value of the fractal Pbd. This curve is the envelope of all microseismic events shown in the left Figure.
Fractal versus constant breakdown pressure spatial distribution.
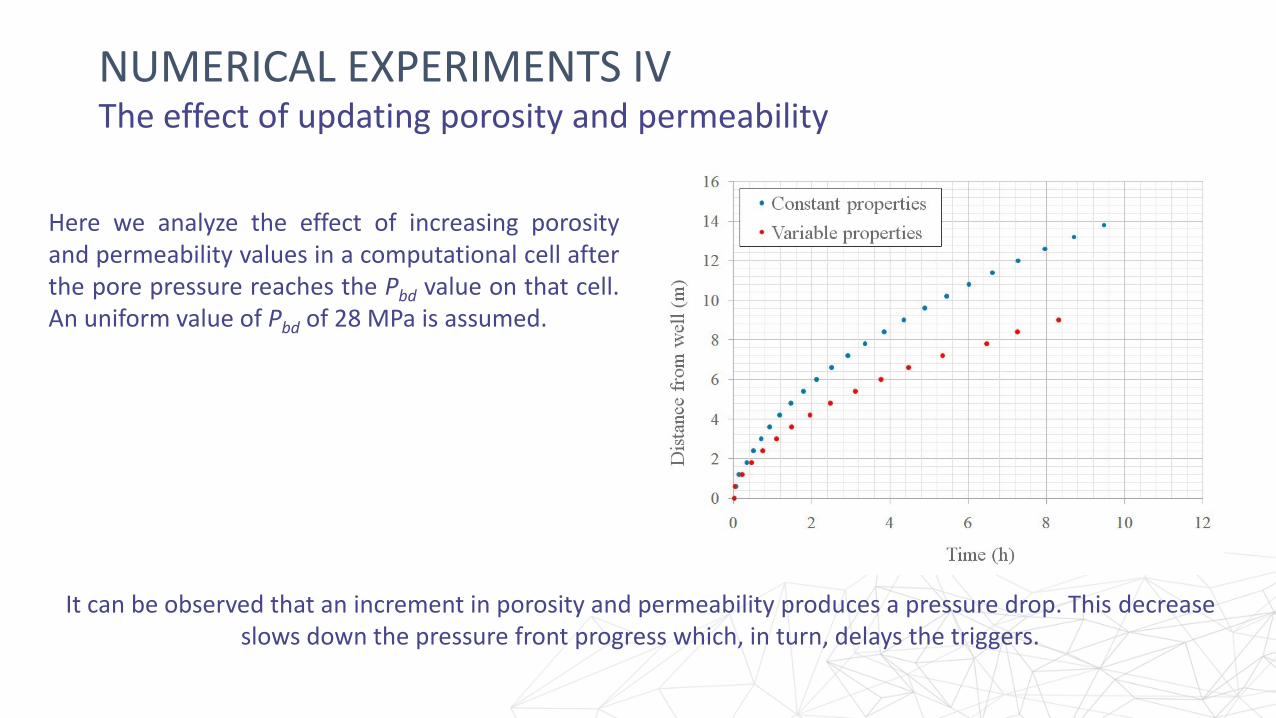
NUMERICAL EXPERIMENTS IVThe effect of updating porosity and permeability
Here we analyze the effect of increasing porosityand permeability values in a computational cell afterthe pore pressure reaches the Pbd value on that cell.An uniform value of Pbd of 28 MPa is assumed.
It can be observed that an increment in porosity and permeability produces a pressure drop. This decrease slows down the pressure front progress which, in turn, delays the triggers.

NUMERICAL EXPERIMENTS VPbd Sensitivity
Here we run four simulations for uniform spatialdistributions of Pbd with values : 28, 31, 35 and 38Mpa (4000, 4500, 5000, 5500 psi).
A Pbd increment slows down the occurrence of triggers and reduces the size of the fractured zone. This effect is due to the fact that for a given region, a higher Pbd value requires to reach a higher pore pressure to induce a
fracture. An increase of about 12% on the Pbd induces a 50% decrease in the distance from the fracture front to the well.
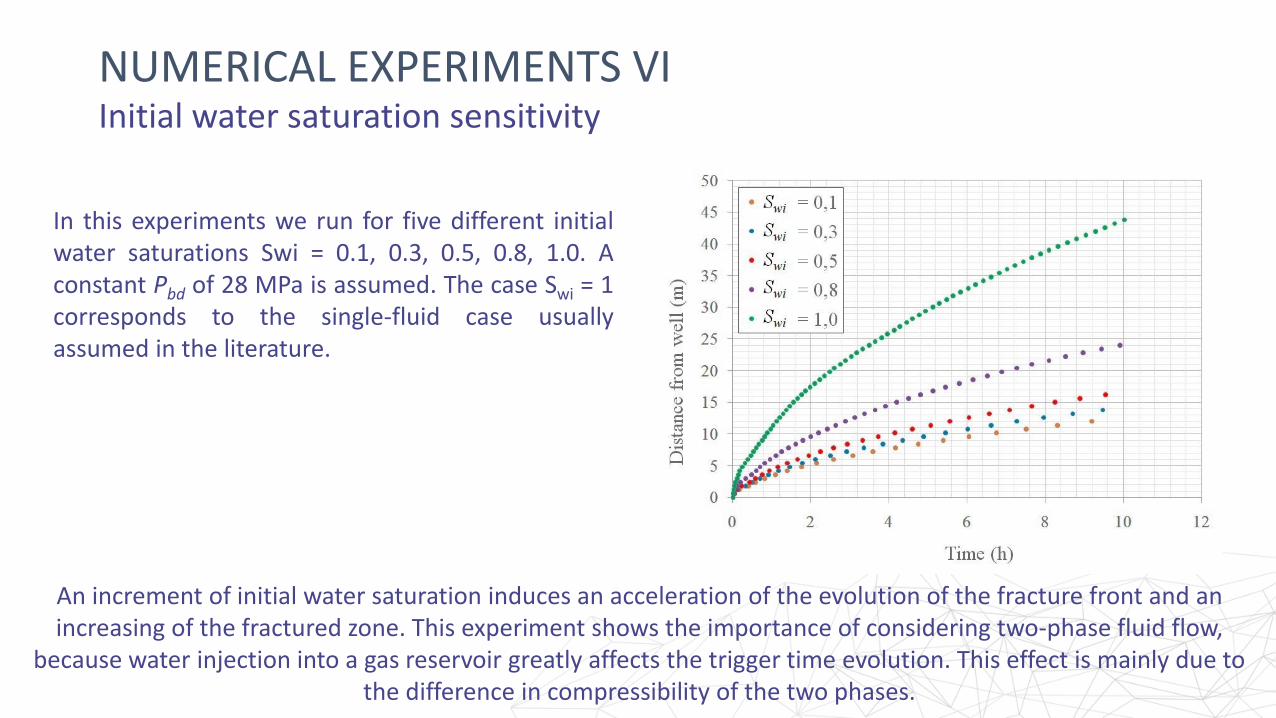
NUMERICAL EXPERIMENTS VIInitial water saturation sensitivity
In this experiments we run for five different initialwater saturations Swi = 0.1, 0.3, 0.5, 0.8, 1.0. Aconstant Pbd of 28 MPa is assumed. The case Swi = 1corresponds to the single-fluid case usuallyassumed in the literature.
An increment of initial water saturation induces an acceleration of the evolution of the fracture front and an increasing of the fractured zone. This experiment shows the importance of considering two-phase fluid flow,
because water injection into a gas reservoir greatly affects the trigger time evolution. This effect is mainly due to the difference in compressibility of the two phases.
NUMERICAL EXPERIMENTS VIIPre-existing natural fractures effect
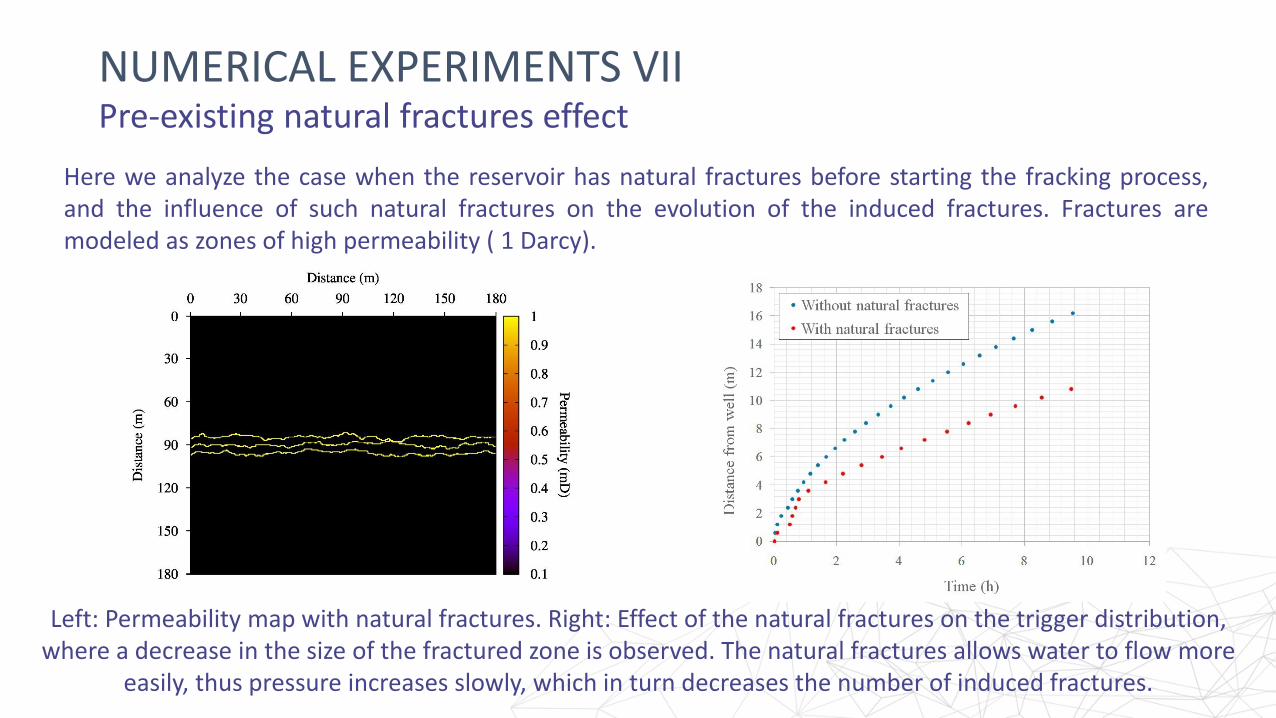
Here we analyze the case when the reservoir has natural fractures before starting the fracking process,and the influence of such natural fractures on the evolution of the induced fractures. Fractures aremodeled as zones of high permeability ( 1 Darcy).
Left: Permeability map with natural fractures. Right: Effect of the natural fractures on the trigger distribution, where a decrease in the size of the fractured zone is observed. The natural fractures allows water to flow more
easily, thus pressure increases slowly, which in turn decreases the number of induced fractures.
NUMERICAL EXPERIMENTS VIIISeismic monitoring of the fracking procedure
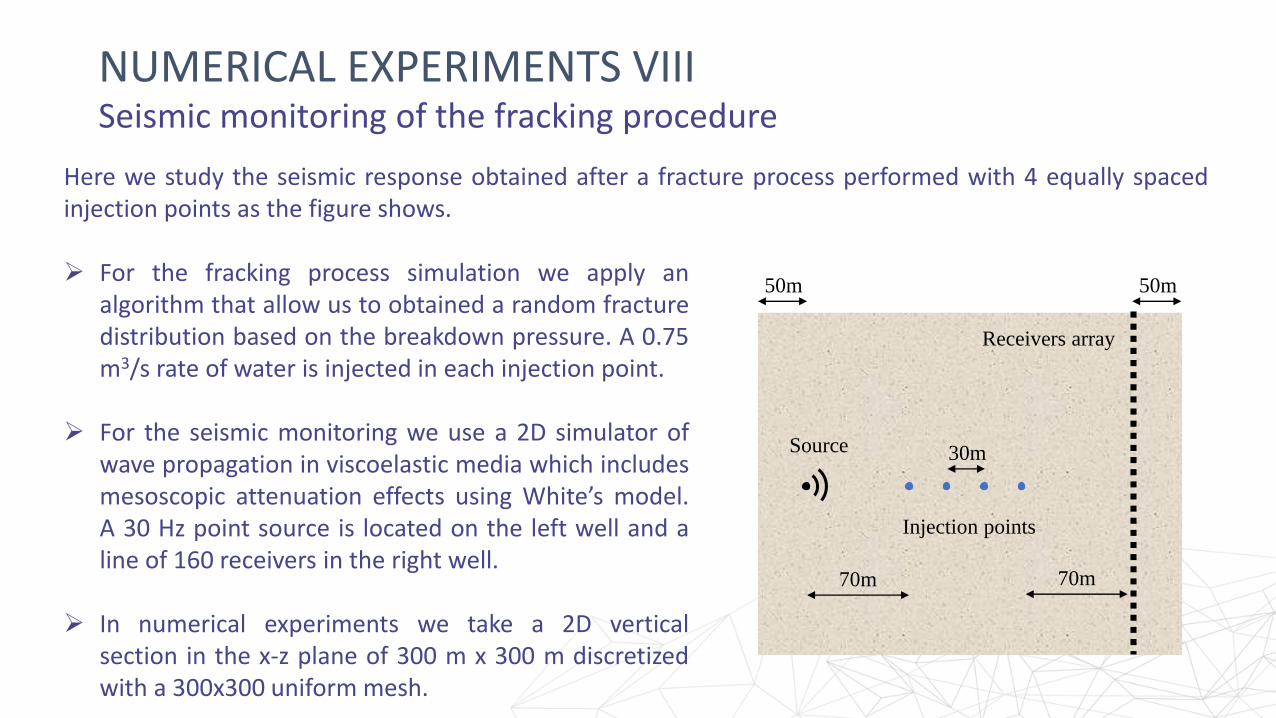
Here we study the seismic response obtained after a fracture process performed with 4 equally spacedinjection points as the figure shows.
Injection points
Source
Receivers array
50m 50m
30m
70m 70m
For the fracking process simulation we apply analgorithm that allow us to obtained a random fracturedistribution based on the breakdown pressure. A 0.75m3/s rate of water is injected in each injection point.
For the seismic monitoring we use a 2D simulator ofwave propagation in viscoelastic media which includesmesoscopic attenuation effects using White’s model.A 30 Hz point source is located on the left well and aline of 160 receivers in the right well.
In numerical experiments we take a 2D verticalsection in the x-z plane of 300 m x 300 m discretizedwith a 300x300 uniform mesh.
NUMERICAL EXPERIMENTS IXPorosity and pore pressure maps
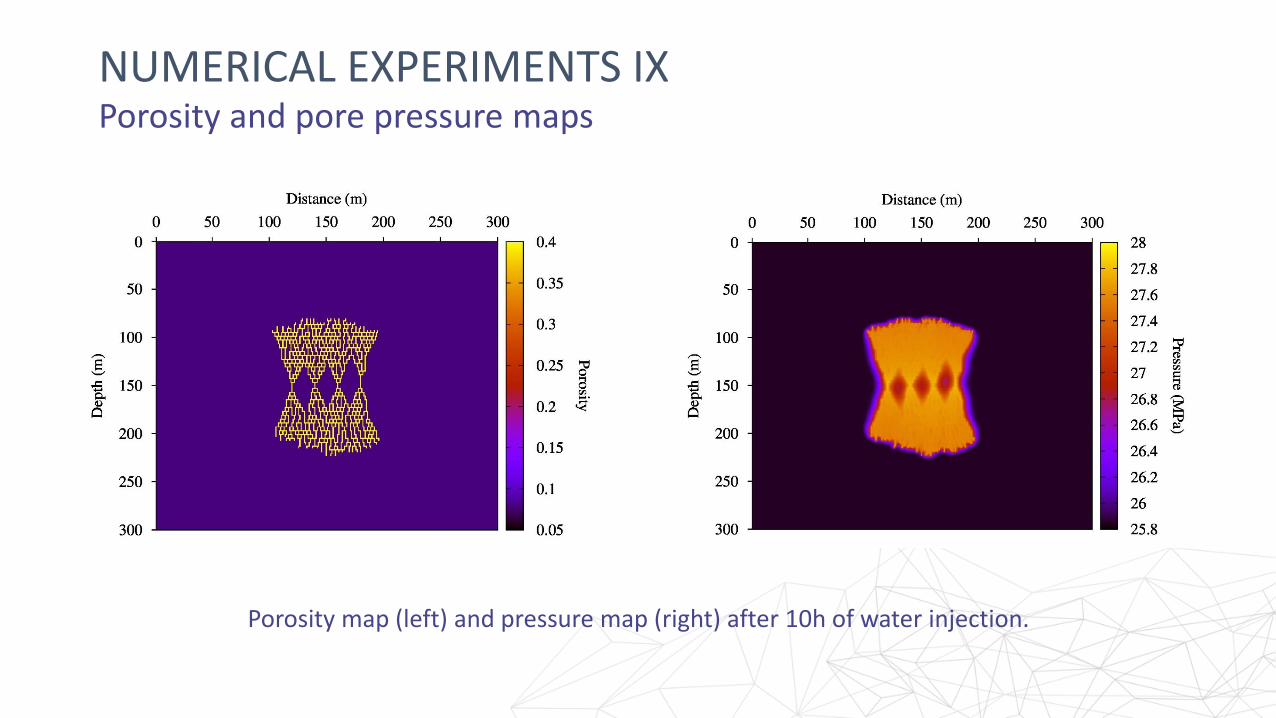
Porosity map (left) and pressure map (right) after 10h of water injection.
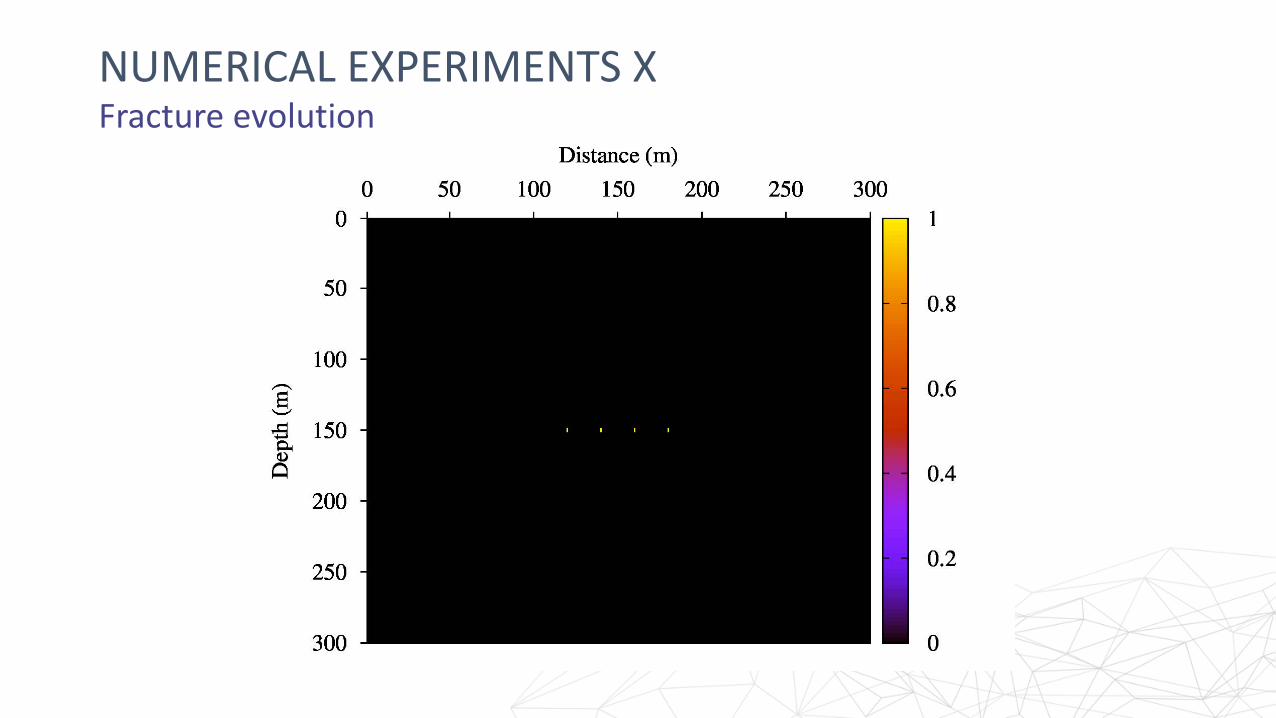
NUMERICAL EXPERIMENTS XFracture evolution
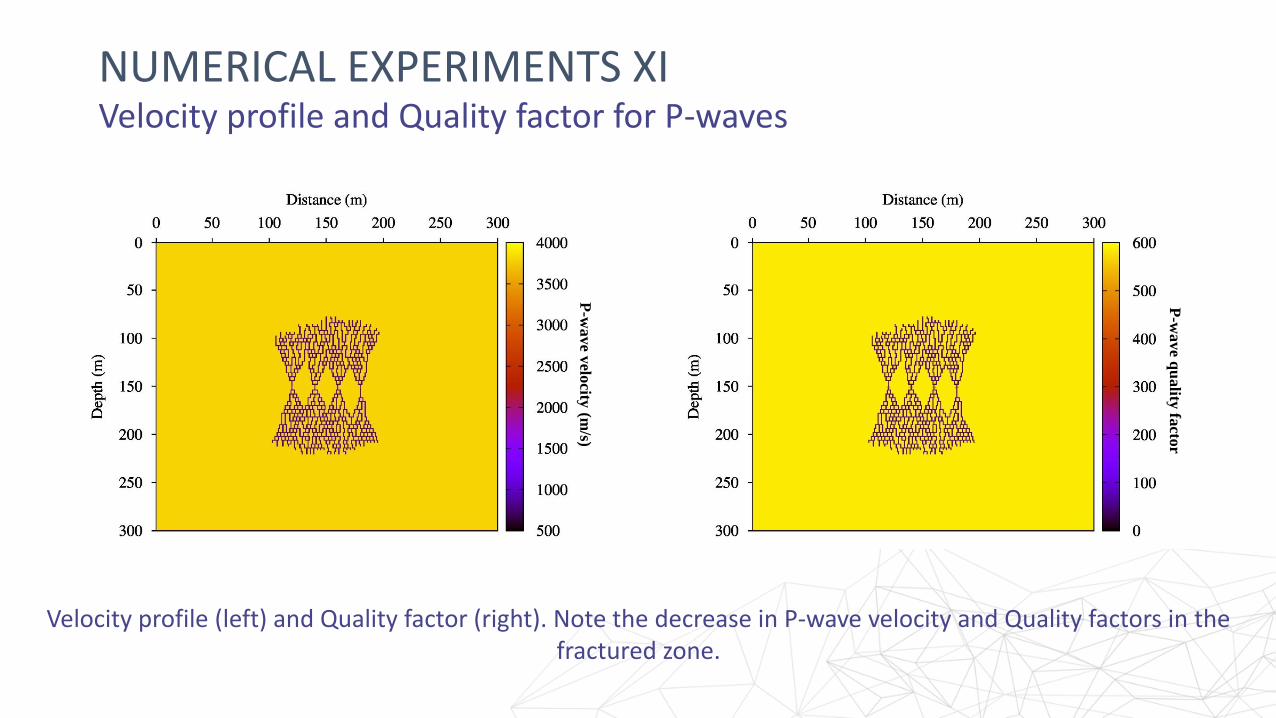
NUMERICAL EXPERIMENTS XIVelocity profile and Quality factor for P-waves
Velocity profile (left) and Quality factor (right). Note the decrease in P-wave velocity and Quality factors in the fractured zone.
P-w
ave v
elocity
(m/s)
P-w
ave q
uality
facto
r
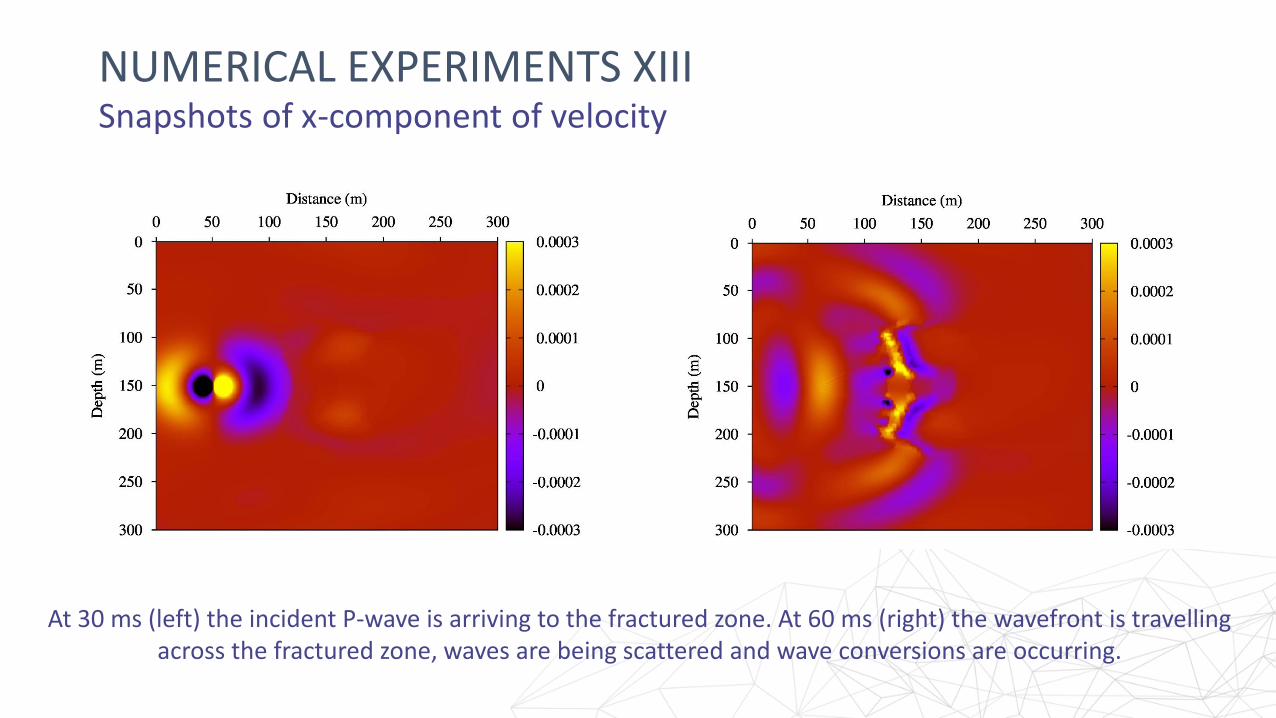
NUMERICAL EXPERIMENTS XIIISnapshots of x-component of velocity
At 30 ms (left) the incident P-wave is arriving to the fractured zone. At 60 ms (right) the wavefront is travelling across the fractured zone, waves are being scattered and wave conversions are occurring.
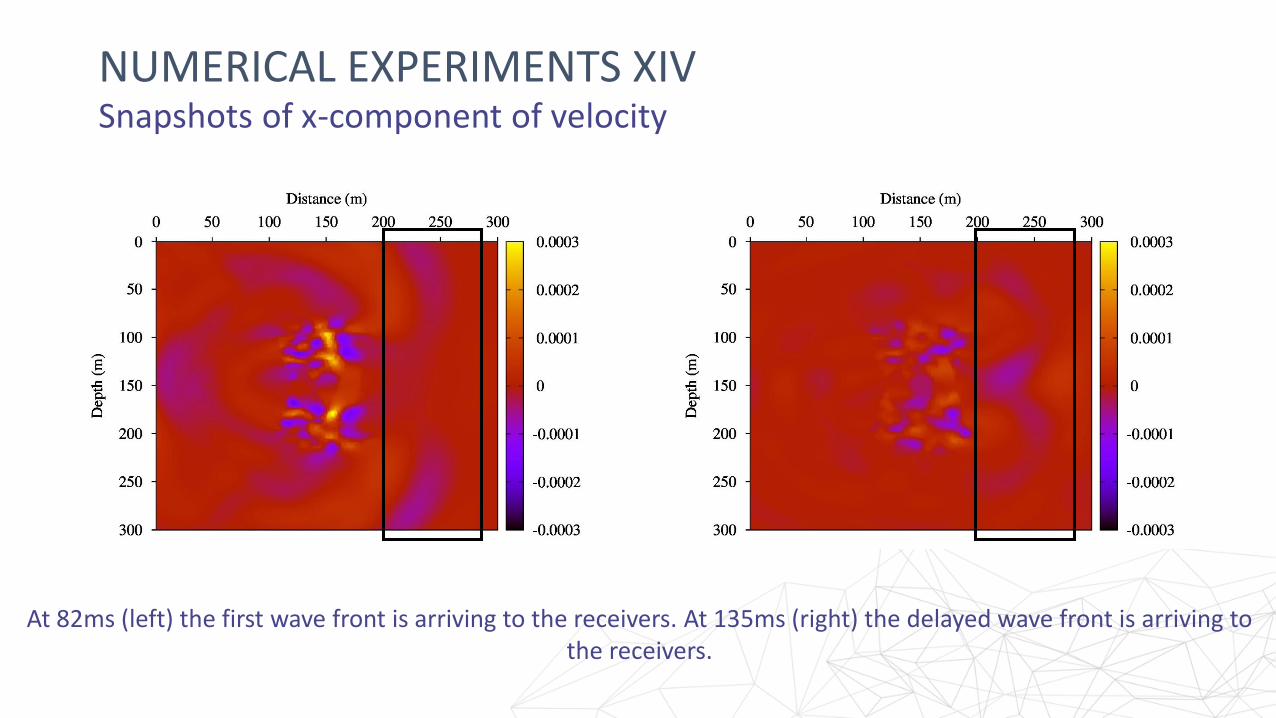
NUMERICAL EXPERIMENTS XIVSnapshots of x-component of velocity
At 82ms (left) the first wave front is arriving to the receivers. At 135ms (right) the delayed wave front is arriving to the receivers.
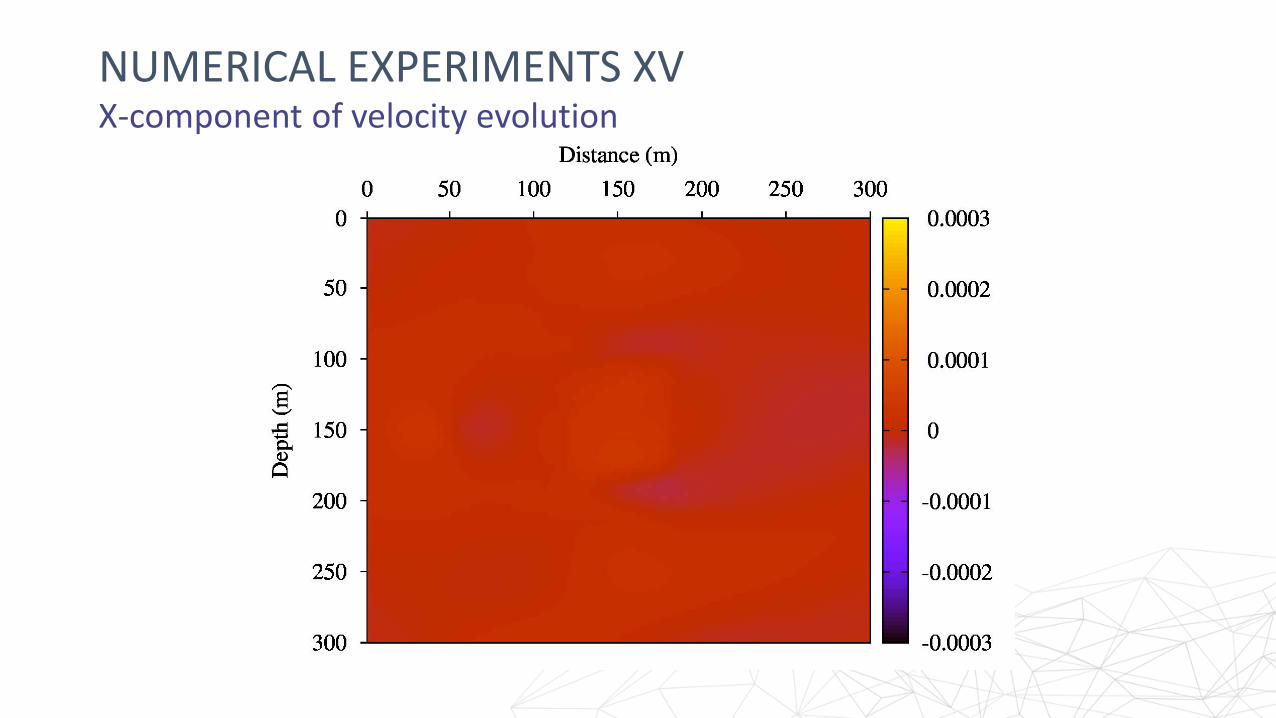
NUMERICAL EXPERIMENTS XVX-component of velocity evolution
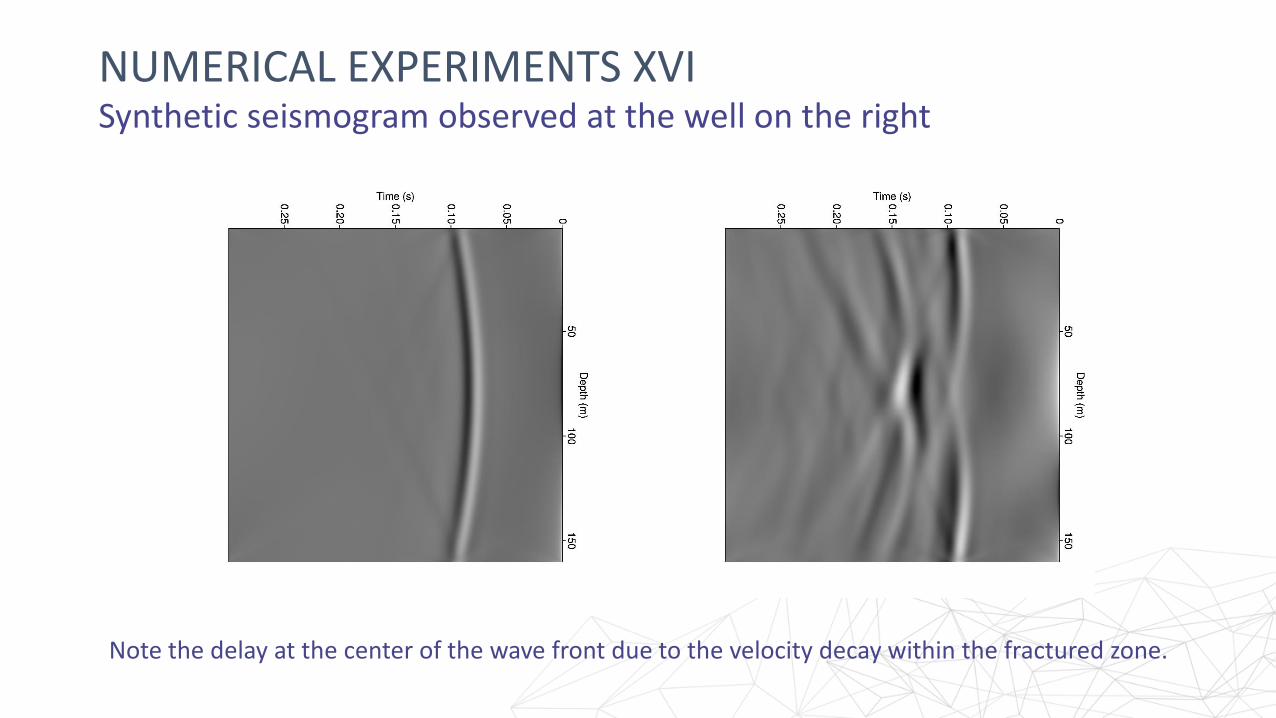
NUMERICAL EXPERIMENTS XVISynthetic seismogram observed at the well on the right
Note the delay at the center of the wave front due to the velocity decay within the fractured zone.
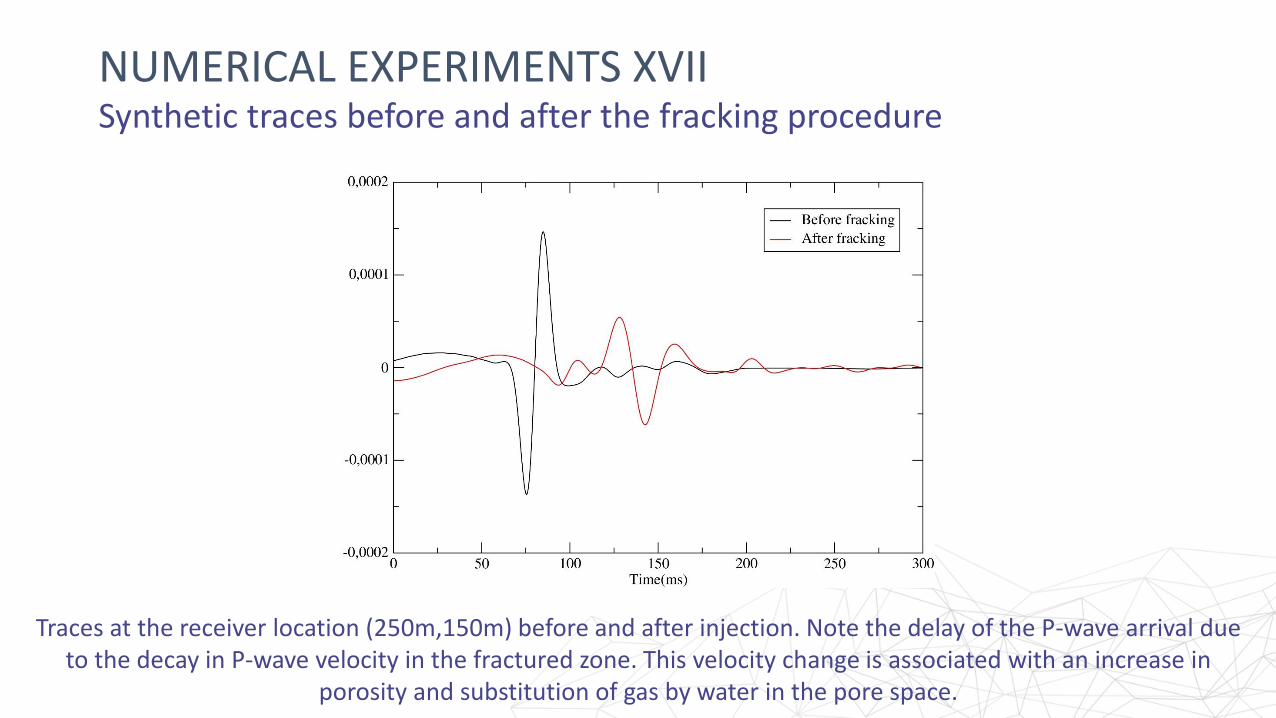
NUMERICAL EXPERIMENTS XVIISynthetic traces before and after the fracking procedure
Traces at the receiver location (250m,150m) before and after injection. Note the delay of the P-wave arrival due to the decay in P-wave velocity in the fractured zone. This velocity change is associated with an increase in
porosity and substitution of gas by water in the pore space.
CONCLUSIONS
The numerical simulation examples have shown:
A multiphase flow simulator is needed to properly model the generationand spatial distribution of the microseismic events as it was shown whenconsidering different initial water saturations.
The update of the porosity and permeability in the reservoir gives morerealistic description of this phenomenon.
The presence of natural fractures induces a reduction in the size of thefractured zone.
An increase of breakdown pressure slows down the occurrence of triggers.
The wave propagator simulator detected the presence of the fracture zone dueto its changes in petrophysical properties and pore fluid saturations.

THANKS FOR YOUR ATTENTION!!!