modeling immersive media experiences by sensing … · modeling immersive media experiences by ......
TRANSCRIPT

Multimed Tools Appl manuscript No.(will be inserted by the editor)
Modeling Immersive Media Experiences by SensingImpact on Subjects
Eleni Kroupi · Philippe Hanhart ·Jong-Seok Lee∗ · Martin Rerabek ·Touradj Ebrahimi
Received: date / Accepted: date
Abstract As immersive technologies target to provide higher quality of multi-media experiences, it is important to understand the quality of experience (QoE)perceived by users from various multimedia rendering schemes, in order to designand optimize human-centric immersive multimedia systems. In this study, vari-ous QoE-related aspects, such as depth perception, sensation of reality, contentpreference, and perceived quality are being investigated and compared for presen-tation of 2D and 3D contents. Since the advantages of implicit over explicit QoEassessment have become essential, the way these QoE-related aspects influencebrain and periphery is also investigated. In particular, two classification schemesusing electroencephalography (EEG) and peripheral signals (electrocardiographyand respiration) are carried out, to explore if it is possible to automatically rec-ognize the QoE-related aspects under investigation. In addition, a decision-fusionscheme is applied to EEG and peripheral features, to explore the advantage ofintegrating information from the two modalities. The results reveal that the high-est monomodal average informedness is achieved in the high beta EEG band(0.14% ± 0.09, p < 0.01), when recognizing sensation of reality. The highest andsignificantly non-random multimodal average informedness is achieved in whenhigh beta EEG band is fused with peripheral features (0.17%± 0.1, p < 0.01), forthe case of sensation of reality. Finally, a temporal analysis is conducted to explorehow the EEG correlates for the case of sensation of reality change over time. The
∗Refers to the corresponding author.The research leading to these results has been performed in the framework of Swiss NationalFoundation for Scientific Research (FN 200020-132673-1 and FN 200021-143696-1) and theBasic Science Research Program through the National Research Foundation of Korea fundedby the Ministry of Science, ICT and Future Planning, Korea (2013R1A1A1007822).
E. Kroupi, P. Hanhart, M. Rerabek and T. EbrahimiMultimedia Signal Processing Group, EPFL, Station 11, CH-1015 Lausanne, SwitzerlandE-mail: [email protected], [email protected], [email protected],[email protected]
J.-S. LeeSchool of Integrated Technology, Yonsei University, Republic of KoreaE-mail: [email protected]

2 Eleni Kroupi et al.
results reveal that that the right cortex is more involved when sensation of realityis low, and the left one when sensation of reality is high, indicating that approachand withdrawal-related processes occur during sensation of reality.
Keywords EEG · heart rate · respiration · immersiveness · fusion · qualityof experience
1 Introduction
Most of our impressions and understanding about our surroundings are basedon sight. Thus, our perception of the world is mainly three-dimensional. A po-tential, therefore, actual representation of real scenes should provide a three-dimensional feeling to enhance sensation of reality through multimedia devices.The importance of sensation of reality has been recognized in the field of gamesand virtual reality [28,35], through user-system interactions. Also, recent advancesin imaging and displays have enabled implementation of more immersive multi-media environments, offering improved sensation of reality to users [9, 20].
As a result, immersive multimedia, which allows users to experience enhancedimmersion and involvement in comparison to traditional multimedia, is receivinga rapidly increasing amount of attention. It has strong impact on users’ emotion,sense of presence, and degree of engagement, which can eventually be used to pro-vide users more satisfactory media experience [29, 33, 34]. For instance, 3D imageand video technologies are gaining ground in multimedia applications since theyincorporate depth perception, leading to more realistic scenes, and consequently toemotionally stronger experiences. However, in order for the experience to be as re-alistic as possible, the quality of the rendering should be as good as possible. Thus,it is important to understand the quality of experience (QoE) perceived by usersfrom various multimedia rendering schemes to design and optimize human-centricimmersive multimedia systems.
QoE assessment can be carried out either explicitly or implicitly. In the formercase, human subjects are hired and asked to assess their perceived quality of givencontents in pre-defined rating scales (e.g., [21]). The analysis and correspondingresearch outcomes are based on mean opinion scores (MOS) or differential MOS(DMOS) across subjects for various stimuli. However, explicit assessment of QoEcan be tiresome and may include subjective biases depending on external factors.
On the other hand, the latter is a bio-inspired approach to automatically rec-ognize the way users perceive and appreciate various multimedia contents, throughtheir physiological signals. Physiological signals can be acquired continuously, real-time, and in a non-invasive way. They originate either from the central nervoussystem (CNS), such as electroencephalography (EEG), or from the peripheral ner-vous system (PNS), such as heart rate, respiration, etc. Once an accurate implicitQoE recognition system based on physiological signals is constructed, no explicitresponse will be required, facilitating real-time monitoring of QoE without sub-jective biases.
Recently, there have been efforts to measure brain activity in order to under-stand QoE in 2D and 3D multimedia rendering schemes. In [31], it was demon-strated that abrupt changes in 2D visual quality give rise to specific components inthe EEG, which has potential to be used for implicit subjective quality assessment.
Modeling Immersive Media Experiences by Sensing Impact on Subjects 3
In the field of 3D image/video, researchers attempted to detect fatigue caused by3D visual media based on EEG. In [5], visually evoked potentials in EEG wereexamined to detect fatigue, where it was shown that the P100 latency (i.e., 100msec after the stimulus onset) can be used for a fatigue index. The study in [22]showed that the power of the high frequency EEG bands and the changes of theP700 component (i.e., amplitude 700 msec after the stimulus onset) are strongcandidates for measuring 3D visual fatigue. Moreover, in [15], it was shown that3D visual fatigue is linked to human cortical activities measured by functionalMagnetic Resonance Imaging (fMRI). The study in [7] attempted to apply fMRIin combination with magnetoencephalography (MEG) to measure asthenopia andshowed potentiality of such a scheme, although detection accuracy remains ques-tionable. These results show that monitoring neurological responses can providehints for the perceived QoE. However, this topic is still in its infancy with many re-search questions unanswered. For instance, measuring sensation of reality or depthperception based on EEG and peripheral physiological signals for 3D media hasnot been adequately considered.
Our previous research attempted to explore these issues. For instance, in [19], asubject-independent classification was performed using EEG and peripheral signalsto infer if a subject was experiencing 2D or 3D video contents. The results revealedthat EEG-based classification can be used to discriminate between 2D and 3Dcontents, independently of the video quality. The EEG high beta frequency band(21-29 Hz) seemed to be mainly responsible for this discrimination. Moreover,in [18] it was demonstrated that EEG-based classification can be also used toautomatically recognize high from low sensation of reality, in a subject-dependentframework. Also, classification of sensation of reality from heart and respirationwas possible, but less accurate than using EEG signals. Finally, in [17], EEGfrontal asymmetry patterns in the EEG alpha band (8-12 Hz) were observed withrespect to perceived quality from 2D and 3D stimuli. These patterns indicatedright frontal activation when perceived quality was low.
In this paper, we attempt to investigate immersive multimedia presentationexperience via explicit subjective rating analysis and implicit monitoring of users’brain and peripheral physiological responses for 2D and 3D multimedia contents.The current study differs from our previous ones in various aspects. Although thedatabase used is the same, in this study subject-independent analysis is conducted,and various QoE-related aspects are investigated and compared. In particular,depth perception, sensation of reality, content preference, and perceived quality areinvestigated with respect to how they influence each other, and how they influencebrain and periphery. More specifically, initially, the subjective ratings are analyzedto investigate how QoE is perceived in an explicit way. Then, two classificationschemes using EEG and peripheral signals (ECG and respiration) are carried out,to explore if it is possible to automatically recognize the QoE-related aspectsunder investigation. In addition, a decision-fusion scheme is applied to EEG andperipheral features, to explore if it is possible to automatically recognize QoEby integrating information from brain and periphery. Finally, the EEG correlatesfor the case of sensation of reality are investigated over time. For reproducibilityreasons, and to encourage further research on the topic, the produced database is

4 Eleni Kroupi et al.
made publicly available1, under the name MIMESIS (Modeling Immersive MediaExperiences by Sensing Impact on Subjects).
The paper is organized as follows. Section 2 explains the details of the ex-periments, the self-assessed ratings and the acquisition of biosignals. In Section 3the subjective ratings are analyzed and discussed. In Section 4 the feature extrac-tion and classification methods are presented, and the corresponding results aredetailed and discussed. Finally, the conclusions are presented in Section 5.
2 Experiment
2.1 Video stimuli
At the time of this study, the availability of high quality stereoscopic contentof sufficient duration to induce immersiveness was almost inexistent. In our ex-periments, we used video clips recorded during the Montreux Jazz music festival(MJF) by NVP3D2, a professional 3D video production company. The datasetwas composed of eight video contents: one for the training and seven for the tests.All contents were recorded with two RED SCARLET-X cameras3 mounted ona Genus Hurricane Rig. All video sequences were recorded in REDCODE RAW(R3D) format4, DCI 4K resolution (4096×2160 pixels), at 25 fps, and had a dura-tion of about one minute long. Stereo audio was recorded in PCM format, sampledat 48 kHz, 24 bits. Table 1 describes the contents and their characteristics. Therecorded video sequences were cropped and downsampled to Full HD resolution(1920 × 1080 pixels) and then compressed with H.264/MPEG-4 AVC. Two dif-ferent quantization parameters (QP) were selected: QP=2 for high quality (HQ)and QP=35 for low quality (LQ). For each content, four different versions wereconsidered: 2D HQ, 3D HQ, 2D LQ, and 3D LQ, leading to a total of 28 videosequences, 14 of which in 2D and 14 in 3D.
2.2 Monitor, sound system and environment
To display the video stimuli, a HD 46” Hyundai S465D stereoscopic monitorwith passive 3D glasses were used. The monitor has a 60 Hz refresh rate and relieson a line-interleaved display and circular polarizing filters to separate the left- andright-eye images. The laboratory setup was controlled to ensure the reproducibilityof results by avoiding involuntary influence of external factors. The test room wasequipped with a controlled lighting system with a 6500K color temperature andan ambient luminance at 15% of the maximum screen luminance. For the audioplayback, the PSI A14-M professional studio full range speakers5 were used.
1 http://mmspg.epfl.ch/mimesis2 http://www.nvp3d.com3 http://www.red.com/products/scarlet4 http://www.red.com/learn/red-101/redcode-file-format5 http://www.psiaudio.com/product/active-monitors/a14-m

Modeling Immersive Media Experiences by Sensing Impact on Subjects 5
Table 1 Characteristics of the contents used in our experiments.
Content Description and characteristics
Training Rock band playing at the Auditorium Stravinski. Dark. Bright spots.Shot from the back of the auditorium.
Jazz Jazz band playing at the Funky Claude’s Lounge at the Opening Party.Wide shot.
Rock Rock band playing at the Auditorium Stravinski. Dark. Bright spots.Shot from the back of the auditorium.
Stage MJF general manager on stage introducing the next artist. Very dark.In French. Wide shot.
Speech1 MJF general manager giving a speech at the Opening Party. In French.Mid shot.
Speech2 Speech at the Opening Party. In French. Mid shot.Outdoor Crowd walking on the street near the lake. Lot of depth. Wide shot.Interview Interview of Quincy Jones. Medium close up.
2.3 Participants
Sixteen subjects (5 females, 11 males) took part in our experiments. They werebetween 19 and 30 years old with an average of 23.8 years of age. All subjectswere screened for correct visual acuity, color vision, and stereo vision using theSnellen (no errors on 20/30 line), Ishihara ,and Randot charts, respectively. Theyall provided written consent forms.
2.4 Physiological signal acquisition
The EEG was recorded from 256 electrodes placed at the standard positionson the scalp. An EGI’s Geodesic EEG System 300 (GES)6 was used to record,amplify, and digitalize the EEG signals. To ensure that there were more instancesthan features in the classification schemes (to avoid the curse of dimensionality),only the nineteen electrodes that correspond to the 10-20 International Systemwere used in this study. Additionally, two standard electrocardiogram (ECG) leadswere used and placed on the lower left ribcage and on the upper right clavicle, aswell as two respiratory inductive plethysmography belts (thoracic and abdomen).All signals were recorded at 250 Hz.
2.5 Experimental protocol
Before each experiment, a training session was organized to allow participantsto familiarize with the assessment procedure. The content shown in the trainingsession was selected by experts to include 2D and 3D examples of various qualitylevels.
The participants were seated at a distance of 3.2 times the picture height,corresponding to roughly 1.8 meters from the stereoscopic monitor, as suggestedin [11]. Experiments were conducted in three sessions. To avoid subjects’ fatigue,
6 https://www.egi.com/clinical-division/clinical-division-clinical-products/ges-300

6 Eleni Kroupi et al.
a fifteen-minute break was provided between consecutive sessions. Nine video se-quences were presented in the first and second sessions, and ten in the last one,leading to a total of 28 video sequences, and thus, to a total of 28 trials. To reducecontextual effects, the stimuli orders of display were randomized applying differentpermutation for each subject, whereas the same content was never shown consec-utively. The 2D and 3D video sequences were mixed, such that subjects couldnot predict the rendering mode and to reduce any a priori that could influencesubjects’ ratings and EEG patterns. Therefore, all video sequences were viewedwith 3D glasses. Watching 2D video content while wearing 3D glasses reduces thehorizontal resolution by a factor two due to characteristics of the monitor used inthe experiments (see Section 2.2), which can reduce perceived quality. However,the loss of vertical resolution in passive 3D display is very low and, in our results,no statistical difference was found between 2D and 3D modes on the perceivedoverall quality (see Section 3).
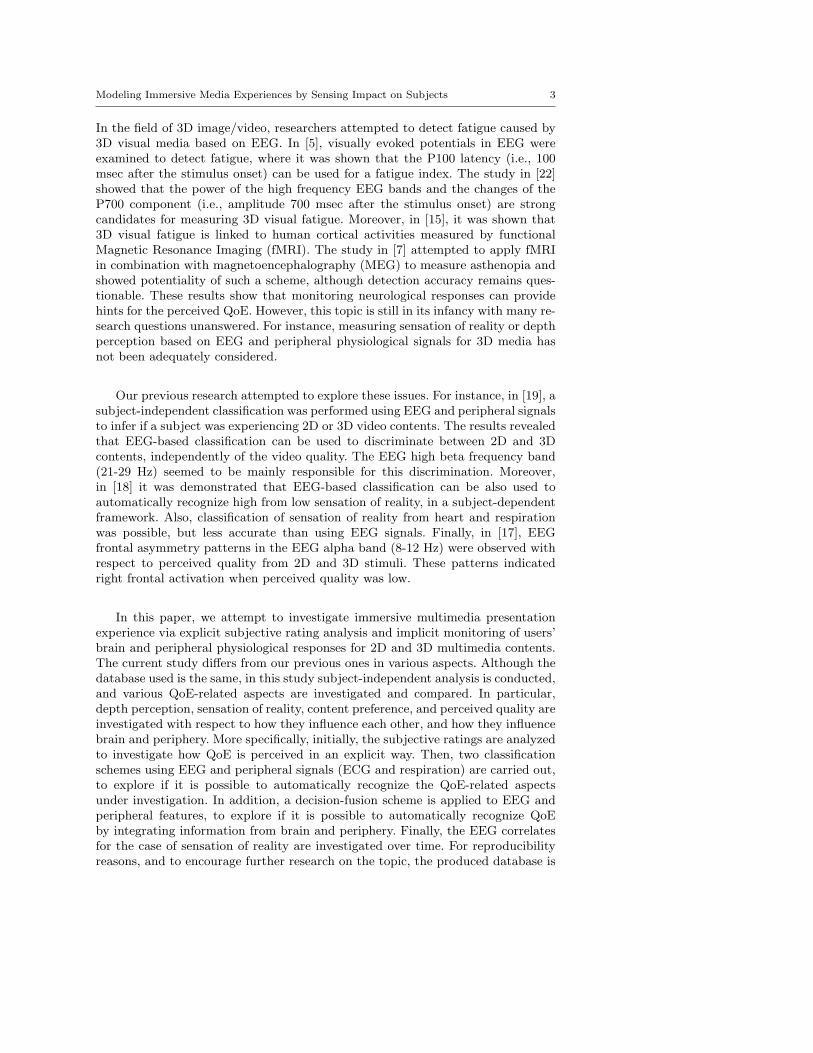
As illustrated in Figure 1 Each trial consisted of a ten-second baseline periodand a stimulus period. The biosignals recorded during the baseline period wereused to remove stimulus-unrelated variations from the signals obtained duringthe stimulus period. During the baseline period, the subjects were instructed toremain calm and focus on a 2D white cross on a black background presented on thescreen in front of them. Once this baseline period was over, a video sequence wasrandomly selected and presented. After the video sequence was over, the subjectswere asked to provide their self-assessed ratings for the particular video sequencewithout any restriction in time, following the Absolute Category Rating (ACR)evaluation methodology [13].
Once a trial was over, the next baseline period was recorded and the next videosequence was randomly selected, presented and rated. The procedure was repeateduntil all 28 video sequences were presented and rated.
Regarding the self-assessed ratings, subjects were asked to evaluate the videosequences in terms of four different aspects, namely perceived overall quality, con-tent preference, sensation of reality, and perceived depth quantity. Two differentrating scales were used for each aspect, a 9-point and a 3-point scale. The 9-pointrating scale ranged from 1 to 9, with 1 representing the lowest value, and 9 thehighest value of each aspect. In particular, the two extremes (1 and 9) correspondto “low” and “high” for perceived overall quality and content preference, “no pres-ence” and “very strong presence” for sensation of reality, and “no depth” and “alot of depth” for perceived depth quantity. Regarding the 3-point rating scales, thechoices were {“do not like it”, “neutral”, “like it”} for perceived overall qualityand content preference, {“low presence”, “middle presence”, “high presence”} forsensation of reality, and {“low depth”, “middle depth”, “high depth”} for per-ceived depth quantity. The 3-point scale was intended to be used for classificationpurposes.
3 Subjective ratings analysis
In this section, a subjective ratings analysis is carried out to investigate howQoE is perceived in an explicit way, as well as to explore how various QoE-relatedaspects are interrelated.
Modeling Immersive Media Experiences by Sensing Impact on Subjects 7
Fig. 1 Example of a trial
Before the analysis on the subjective ratings, outlier detection was performedaccording to the guidelines described in Section 2.3.1 of Annex 2 of [12], to detectand remove subjects whose ratings appear to deviate significantly from others.During the training session, examples of the lowest and highest quality levelswere shown to guide subjects to bound their own perceived overall quality ratingsin a similar way. Since quality was the only factor in which subjects could betrained, the outlier detection was performed only on the perceived overall qualityratings. No outliers were detected, thus, for the subjective ratings analysis allsixteen subjects were included.
Regarding the analysis on the subjective ratings, a normality test was per-formed using the Pearson’s chi-squared test to determine if the subjective ratingsare well-modeled by a normal distribution. Results showed that, for each individualcondition, the ratings of the different subjects were normally distributed. Then,the mean opinion score (MOS) and associated 95% confidence interval (CI) werecomputed for each test stimulus, assuming a normal distribution of the subjectiveratings, to represent explicit estimates of perceived depth quantity, sensation ofreality, content preference and perceived overall quality.
Figure 2 shows the resulting MOS and CI for each case. As it can be observed,for a given quality level, perceived depth and sensation of reality are both higherfor 3D when compared to 2D stimuli. Similarly, high quality sequences generallyobtained higher ratings for perceived depth quantity, sensation of reality, and per-ceived overall quality when compared to their corresponding low quality versions.However, the difference in terms of perceived depth and sensation of reality be-tween 3D LQ stimuli and 2D HQ stimuli is not significant as the CIs considerablyoverlap in all contents. This observation shows that depth cues in 3D stimuli areeffective for depth perception only if a certain level of visual quality is reached. Ascontent Stage is very dark, the perceived 3D effect was not very strong and theperceived depth and sensation of reality were rated relatively low.
To investigate quantitatively whether the objective factors, such as the ren-dering mode (2D vs. 3D), actual quality level (LQ vs. HQ), and content have asignificant influence on the perceptual factors (perceived depth, sensation of re-ality, content preference and perceived overall quality), an ANOVA analysis wasperformed on the subjective ratings for each case. In particular, the null hypothesis

8 Eleni Kroupi et al.
(a) Depth perception (b) Sensation of reality
(c) Content preference (d) Perceived overall quality
Fig. 2 Mean opinion scores for each of the perceptual factors.
was that the rendering mode, quality level, and content do not influence neitherof the perceptual factors.
The null hypothesis was rejected for the cases of perceived depth and sensationof reality for all three objective factors, p < 0.001, indicating that the effects ofthe rendering mode, actual quality level, and content on perceived depth quantityand on sensation of reality were significant. Regarding the effects of the objectivefactors on content preference and on perceived overall quality, only the actual con-tent and the actual quality level influenced these perceptual factors significantly,p < 0.001. Two sequences (Jazz and Rock) out of seven are from music concertand contain a musical audio track, while the other five sequences are quite gen-eral. As the interview of Quincy Jones, who is a famous musician, got similarratings for content preference when compared to the Jazz sequence, we believethat the presence of a musical audio track was not the only factor influencingcontent preference. Although the rendering mode itself did not influence neithercontent preference nor perceived overall quality, the interactions between render-ing mode and quality level, as well as the interactions between actual content andquality level influence significantly, p < 0.05, perceived overall quality. For the rest
Modeling Immersive Media Experiences by Sensing Impact on Subjects 9
Table 2 Pearson correlation coefficients between the ratings of different perceptual aspects.
Content Sensation Depthpreference of reality quantity
Overall0.3392 0.7308 0.4172
qualityContent
- 0.3017 0.1527preferenceSensation
- - 0.8835of reality
of the cases, interactions among the objective factors did not influence any otherperceptual factor. The findings confirmed our expectations.
To understand the impact of the perceptual factors, such as sensation of reality,content preference, perceived overall quality, and perceived depth quantity on eachother, the correlation between the MOS for all four factors was measured usingthe Pearson correlation coefficient. Table 2 reports the correlation coefficients. Theresults show that there is a strong correlation between perceived depth quantityand sensation of reality (ρ > 0.88). Also, there is a strong correlation betweensensation of reality and perceived overall quality (ρ > 0.73). However, the correla-tion between perceived overall quality and perceived depth quantity is relativelylow (ρ = 0.42), but statistically different from zero, p = 0.03. Since the correla-tion between sensation of reality and perceived depth quantity, as well as betweensensation of reality and perceived overall quality, is strong, it is rational that thecorrelation between perceived overall quality and perceived depth quantity is alsodifferent from zero, due to the transitivity property. On the other hand, the corre-lation between perceived depth quantity and content preference (ρ < 0.16) is veryweak. Thus, apparently content per se impacts on depth perception, but contentpreference does not. Additionally, depth perception is significantly influenced bythe presentation mode, as binocular depth cues are quite powerful, while this factorhas no significant effect on content preference, which also explains the weak cor-relation between content preference and perceived depth. The correlation betweensensation of reality and content preference is very low (ρ < 0.3) and not statisti-cally different from zero, p = 0.12. Again, the low correlation between sensationof reality and content preference can be explained by the fact that the renderingmode has a significant impact on first perceptual factor, but not on the formerone.
4 Biosignal analysis
In this section the acquired biosignals are analysed. In particular, features areextracted from the EEG, ECG, and respiration and then classification is performedto explore if it is possible to discriminate between high and low values of the QoEaspects under investigation. These biosignals were acquired while the subjects wereexperiencing the audiovisual content.

10 Eleni Kroupi et al.
4.1 Feature extraction
Regarding the EEG signals, the power for frequencies between 4 and 47 Hzwas estimated using Welch periodogram with 128-sample windows. The mean trialpower was then divided by the mean baseline power, in order to extract the powerchanges without considering the pre-stimulus period. These power changes werecaptured for different frequency bands, namely the theta (4-7 Hz), alpha (8-13Hz), beta low (13-16 Hz), beta middle (17-20 Hz), beta high (21-29 Hz), and lowgamma (30-47 Hz) bands.
ECG signals were used to extract the heart rate variability (HRV), which is thephysiological measurement of variation in the time intervals between consecutiveheart beats, and was estimated using the real-time algorithm developed in [25].As the HRV is a time-series of nonuniform R-R time intervals (i.e., time intervalsbetween consecutive heart beats), the HRV was regularly resampled at 4Hz. Res-piration signals were low-pass filtered using a second-order Butterworth filter witha cutoff frequency of 1 Hz. Time and frequency-domain features were extractedfrom HRV and respiration. Regarding the time domain features, the mean, stan-dard deviation, and mean absolute values of the first and second derivatives wereextracted from both signals, as in [26]. Regarding the HRV frequency domain fea-tures, the power in the low frequency (LF, 0.04-0.15 Hz), high frequency (HF,0.15-0.4 Hz), and the LF/HF ratio were also extracted [1]. Finally, the power inthree frequency bands was extracted from respiration, in particular from 0.1-0.2Hz, 0.2-0.3 Hz, and 0.3-0.4 Hz. These features were shown to be related to emo-tional processes. Thus, in our case, the idea was to explore if the same featurescan provide information about QoE.
Due to the fact that the duration of the signals was long, EEG spatiotemporalfeatures were used. In particular, EEG power changes in theta, alpha, low beta,middle beta, high beta, and gamma bands were estimated for five second-windows(epochs), leading to twenty-one epochs, and thus, to 399 spatiotemporal featuresin total. Since peripheral signals need more time to regulate than the EEG signals,only spatial features were extracted from them.
4.2 Classification scheme
For the classification schemes, a Linear Discriminant Analysis (LDA) classifierwas trained and tested. The LDA classifier was used because it has been shown toincrease the accuracy on single-trial EEG analysis [2, 23, 31]. For real-applicationdata, the feature space dimensionality is usually high compared to the number ofinstances, which leads to a systematic misestimation of the covariance martix [2,30], and renders classification suboptimal. To overcome this issue, a regularizationof the estimated common covariance matrix using shrinkage [30] can be used inthe LDA scheme. In particular, the shrinkage parameter is defined as:
γ =d
(d− 1)2
n∑i,j=1
vark(zij(k))
n∑i,j=1
s2ij
, (1)

Modeling Immersive Media Experiences by Sensing Impact on Subjects 11
wherezij(k) = ((xk)i − (µ)i)((xk)j − (µ)j) (2)
is the correlation coefficient of features i and j of the k-th trial (x represents thefeature vector), µ is the average value across trials, and d is the number of featurevectors in Rn [2]. Also, sij is the element in the i-th row and j-th column of thematrix Σc − νI, where Σc is the empirical covariance matrix, I is the identitymatrix, and ν is the trace(Σc)/n. Therefore, using shrinkage, a better estimate ofthe covariance matrix is:
Σc = (1− γ)Σc + γνI. (3)
As performance metric of the classifier, the Informedness was estimated. In-formedness is defined as
I = sensitivity + specificity − 1, (4)
and is considered an accurate metric of the performance of a classifier with unbal-anced classes [27]. Since in our case we deal with unbalanced classes, informednesscan be a robust metric for evaluating the classifiers. Sensitivity refers to the truepositive rate, and specificity refers to the true negative rate. Obviously informed-ness takes values in the [−1, 1] space, with zero representing the random guess.
Due to the fact that the variance in the performance metrics is reduced in a K-fold cross-validation scheme compared to a leave-one-out cross-validation one [8,36], a two-fold cross-validation was performed on the data, which was repeated tentimes to randomize the created folds. The final classification performance metricswere estimated as the average performance metrics across all folds.
4.3 Classification results
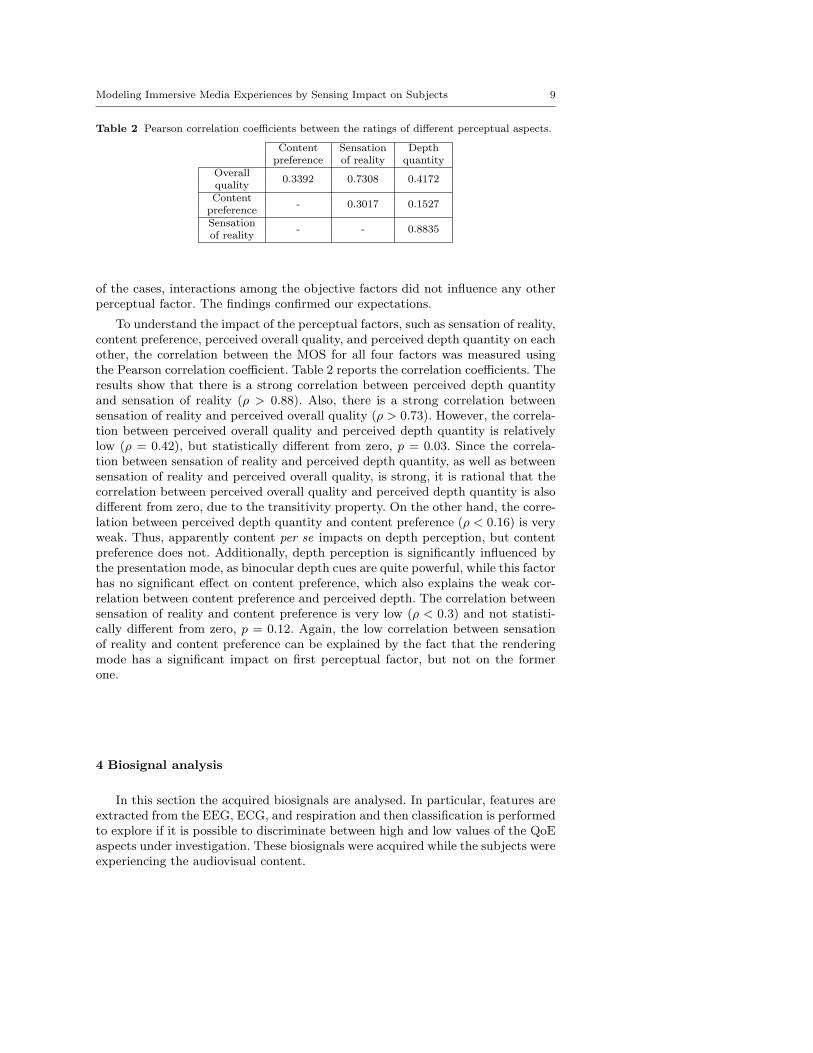
Regarding the EEG features, classification was performed in the following way;to avoid high dimensional feature spaces, only two temporal features were selectedfrom each training set, based on I (eq. (4)), in a wrapper feature selection scheme.Also, the classification was performed for each frequency band separately, leadingto 38 final features per classification scheme (19 electrodes by 2 spatiotemporalfeatures, for six classification schemes). Regarding the ground truth values, the twoclasses were created based on the 9-point rating scales (the rating values equal tofive were excluded as neutral ones, and ratings from one to four corresponded toclass 1, and from six to nine to class 2). The classification was based on the 9-pointscales instead of the 3-point ones to have more data for training and testing. Theaverage classification results are presented in Figure 3.
According to Figure 3, the highest average sensitivity (54.02% ± 13.84) andspecificity (60.43%± 11.52) are obtained using the high beta band for predictingsensation of reality. To verify which results are significantly different from a randomvalue, a t-test was applied to each case. The null hypothesis was that the sensitivityand specificity for each case follow a Student’s t distribution with mean 0.5 (sinceit is a binary problem, the random value considered was 50%). The null hypothesiswas rejected with p < 0.01 for the case of predicting sensation of reality from thehigh beta band, indicating that the classification result is significantly non-random.
However, typically sensitivity and specificity are not used per se, but are insteadcombined to form an unbiased metric that takes into account the unbalanced-class
12 Eleni Kroupi et al.
0
10
20
30
40
50
60
70
Sensitivity [%]
Specificity [%]
random
Theta
Alpha
Low b
eta
Middle
beta
High
beta
Gam
ma
Per
iphe
ral
(a) Depth
0
10
20
30
40
50
60
70
Sensitivity [%]
Specificity [%]
random
Theta
Alpha
Low b
eta
Middle
beta
High
beta
Gam
ma
Per
iphe
ral
(b) Content Preference
0
10
20
30
40
50
60
70
Sensitivity [%]
Specificity [%]
random
Theta
Alpha
Low b
eta
Middle
beta
High
beta
Gam
ma
Per
iphe
ral
(c) Sensation of reality
0
10
20
30
40
50
60
70
Sensitivity [%]
Specificity [%]
random
Theta
Alpha
Low b
eta
Middle
beta
High
beta
Gam
ma
Per
iphe
ral
(d) Perceived overall quality
Fig. 3 Sensitivity and specificity for depth perception, content preference, sensation of reality,and overall quality perception. The horizontal line for each case represents the random guess(50%).
problem. Thus, to evaluate the performance of the classifiers in an unbiased anda more conventional way, the informedness was estimated (eq. (4)). A t-test wasapplied to the informedness results to estimate whether the values were signifi-cantly different from a random value. The results are presented in Figure 4. Inconsistency with the previous results, the informedness of the high beta band forthe case of sensation of reality has the highest value. However, by estimating in-formedness, three frequency bands are also able to predict depth perception, andfour frequency bands are able to predict content preference. Thus, finally, it isindeed possible to predict content preference, depth perception and sensation ofreality from EEG signals, but it is not possible to predict them from peripheralsignals, and is also not possible to predict overall quality perception under theinvestigated framework.
These results are also confirmed by integrating all EEG features. In particular,a LDA classifier was trained and tested as previously using all EEG features. The

Modeling Immersive Media Experiences by Sensing Impact on Subjects 13
Fig. 4 Informedness for each case. The white arrows point to the frequency bands for whichthe informedness was significantly different from a random value with p < 0.05. The light greenarrows point to the frequency bands for which the informedness was significantly different froma random value with p < 0.01. The zero (magenta line) corresponds to the random value.
Table 3 Informedness for all EEG features integrated, for each classification scenario. SDstands for standard deviation. One asterisk indicates significance with p < 0.05, and twoasterisks with p < 0.01.
Classification tasks Mean SD
Content Preference** 0.09 0.08
Depth Perception* 0.04 0.09
Sensation of reality** 0.08 0.1
Perceived Overall Quality -0.03 0.07
results are summarized in Table 3. One may notice indeed that it is possible topredict content preference, depth perception and sensation of reality from EEGsignals, as previously. Moreover, in line with Figure 4, the results are better thecase of content preference and sensation of reality (i.e., higher mean Informednessand p < 0.01). According to Table 3 it is not possible to predict overall qualityperception in this context.

14 Eleni Kroupi et al.
4.4 Spatial filters
Since sensation of reality revealed the best results, in this section the EEGcorrelates for sensation of reality are presented and analysed.
Due to the properties and assumptions on EEG generation [24], it is generallyconsidered that a current source in the brain, s(t) ∈ RM×Ti , where M is thenumber of sources and Ti is the time, contributes linearly to the scalp potential,x(t) ∈ RN×Ti , in a way such that
x(t) = As(t) + n(t), (5)
where A ∈ RN×M is the propagation matrix that represents the strength of con-tribution of each source to N the surface electrodes. The term n(t) correspondsto the noise, which is not related to the sources. The reverse process of relatingthe scalp potentials to the sources, is known as backward modeling, and aims atestimating the sources from the scalp potentials. It is formed as
s(t) = WTx(t), (6)
where W is either the exact inverse (if it exists) or the pseudoinverse of the matrixA. The rows wT of WT are referred to as spatial filters, and can be visualized asscalp maps [2].
A linear classifier trained on spatial features can be considered as a spatialfilter [2]. In particular, if w ∈ RN is the weight vector, and x(t) ∈ RN×Ti representsthe EEG signals, then
y(t) = wTx(t) (7)
is the result of spatial filtering. It is known that w = Σ−1c (µ2 − µ1), where Σc is
the estimated common covariance matrix [6]. In this case, µ2 corresponds to low,and µ1 corresponds to high sensation of reality. Thus, a large positive value in ascalp plot indicates activation of a particular part of the cortex when sensation ofreality is low, whereas a large negative value in a scalp plot indicates activationof a particular part of the cortex when sensation of reality is high. Moreover, forthis case, the common covariance matrix was estimated using shrinkage (eq. (3)).The parameter gamma used to estimate the common covariance matrix was foundequal to γ = 0.05 (eq. (1)).
Figure 5 depicts the scalp plots of the high beta band (since it achieved thehighest classification performance), for the first sixteen five-second epochs. Similarpatterns are observed across all epochs, according to which the right somatosen-sory cortex is activated when sensation of reality is high, whereas the right parietalcortex is activated when sensation of reality is low. Moreover, particularly in someepochs there is also a slight asymmetry in the frontal cortex. More specifically,the left frontal cortex seems to be activated (in terms of beta band increase) whensensation of reality is low. It is suggested that beta power reflects inhibitory char-acteristics [14], thus, this finding suggests dominance of the right hemisphere overthe left one when sensation of reality is low, due to left hemispheric inhibitoryactivity. Thus, withdrawal-related processes may occur during low sensation of re-ality, since this result is consistent with other studies that revealed left frontalbeta activation [10, 32] or right frontal increase in alpha EEG power [3] dur-ing withdrawal-related tasks. This indicates that sensation of reality is related

Modeling Immersive Media Experiences by Sensing Impact on Subjects 15
-0.6
-0.4
-0.2
0
0.2
0.4
0.6
-0.6
-0.4
-0.2
0
0.2
0.4
0.6
-0.6-0.4-0.200.20.40.6
-0.6
-0.4
-0.2
0
0.2
0.4
0.6
-0.8-0.6-0.4-0.200.20.40.60.8
-0.6
-0.4
-0.2
0
0.2
0.4
0.6
-0.6
-0.4
-0.2
0
0.2
0.4
0.6
-0.6
-0.4
-0.2
0
0.2
0.4
0.6
-0.6
-0.4
-0.2
0
0.2
0.4
0.6
-0.6
-0.4
-0.2
0
0.2
0.4
0.6
-0.8-0.6-0.4-0.200.20.40.60.8
-0.8
-0.6
-0.4
-0.2
0
0.2
0.4
0.6
0.8
-0.8
-0.6
-0.4
-0.2
0
0.2
0.4
0.6
0.8
-0.6
-0.4
-0.2
0
0.2
0.4
0.6
-0.6
-0.4
-0.2
0
0.2
0.4
0.6
-0.8-0.6-0.4-0.200.20.40.60.8
Epoch 1 Epoch 2 Epoch 3 Epoch 4
Epoch 5 Epoch 6 Epoch 7 Epoch 8
Epoch 9 Epoch 10 Epoch 11 Epoch 12
Epoch 13 Epoch 14 Epoch 15 Epoch 16
Fig. 5 Scalp plots that depict the spatial distribution of high beta for each five-second epoch.Scalp plots are presented as top views of the head, the nose is pointing upwards, and the dotsindicate the electrode positions. Epochs 12 and 13 provide the highest asymmetry betweenthe right and left frontal cortex, indicating that low sensation of reality is better distinguishedfrom high during these epochs.
to approach/withdrawal-related emotional processes, in the sense that low sensa-tion of reality may lead to withdrawal-related emotional processes, whereas highsensation of reality to approach-related ones.
4.5 Fusion
To investigate if it is possible to better recognize QoE by integrating infor-mation from both the EEG and the peripheral signals, a decision-fusion schemebased on the maximum probability rule was applied [16]. A decision-fusion scheme
16 Eleni Kroupi et al.
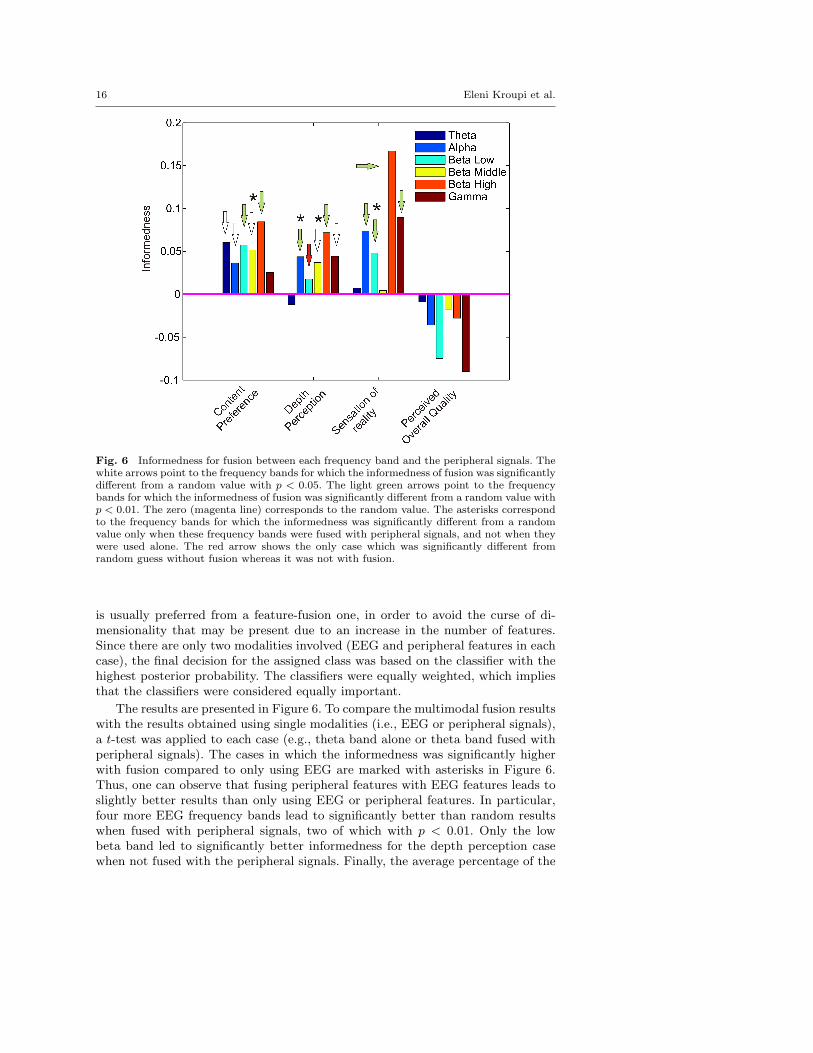
Fig. 6 Informedness for fusion between each frequency band and the peripheral signals. Thewhite arrows point to the frequency bands for which the informedness of fusion was significantlydifferent from a random value with p < 0.05. The light green arrows point to the frequencybands for which the informedness of fusion was significantly different from a random value withp < 0.01. The zero (magenta line) corresponds to the random value. The asterisks correspondto the frequency bands for which the informedness was significantly different from a randomvalue only when these frequency bands were fused with peripheral signals, and not when theywere used alone. The red arrow shows the only case which was significantly different fromrandom guess without fusion whereas it was not with fusion.
is usually preferred from a feature-fusion one, in order to avoid the curse of di-mensionality that may be present due to an increase in the number of features.Since there are only two modalities involved (EEG and peripheral features in eachcase), the final decision for the assigned class was based on the classifier with thehighest posterior probability. The classifiers were equally weighted, which impliesthat the classifiers were considered equally important.
The results are presented in Figure 6. To compare the multimodal fusion resultswith the results obtained using single modalities (i.e., EEG or peripheral signals),a t-test was applied to each case (e.g., theta band alone or theta band fused withperipheral signals). The cases in which the informedness was significantly higherwith fusion compared to only using EEG are marked with asterisks in Figure 6.Thus, one can observe that fusing peripheral features with EEG features leads toslightly better results than only using EEG or peripheral features. In particular,four more EEG frequency bands lead to significantly better than random resultswhen fused with peripheral signals, two of which with p < 0.01. Only the lowbeta band led to significantly better informedness for the depth perception casewhen not fused with the peripheral signals. Finally, the average percentage of the

Modeling Immersive Media Experiences by Sensing Impact on Subjects 17
contribution of the two classifiers was estimated to investigate whether one of thetwo classifiers (EEG-based or periphery-based classifiers) contributed more thanthe other. As expected, the decision was based on the EEG classifiers for 64% ofthe cases, and for 36% of the cases it was based on the peripheral classifiers.
4.6 Further discussion
In our first study [19], a subject-independent classification was performed toinfer if a subject was experiencing 2D or 3D video contents. In [18], we demon-strated that classification can be also used to automatically recognize high fromlow sensation of reality, in a subject-dependent framework. In this paper, we aimedat predicting all evaluated aspects, i.e., content preference, depth perception, sen-sation of reality, and perceived overall quality, using subject-independent classifi-cation systems. The current study also differs in the sense that we used an LDAclassifier, whereas a SVM classifier was used in [18, 19]. Moreover, in this paper,we also applied a decision-fusion scheme to EEG and peripheral features, to ex-plore the advantage of integrating information from the two modalities. Finally, inthis paper, we investigated the EEG correlates over time for the case of sensationof reality, whereas EEG correlates for the case of overall perceived quality wereinvestigated without considering the time evolution in [17].
In this study we demonstrated that the high beta EEG band is mainly responsi-ble for discriminating high from low sensation of reality. This finding corroborateswith the finding in [19], in which it was shown that high beta EEG band is mainlyresponsible for discriminating 2D from 3D video contents. Thus, apparently sim-ilar brain patterns occur during experience of 2D and 3D contents, as well asduring sensation-of-reality experiences, indicating that these two processes mayactually be related, which is in line with our expectations. This observation is alsosupported by [4], in which it was shown that stronger emotions are elicited with3D compared to 2D visual stimuli, reflected in the activity of the right amygdala.Since sensation of reality typically provokes stronger emotions due to its resem-blance with the real world, in [4] it is expected that sensation of reality was higherwith 3D compared to 2D stimuli, although the participants in the experimentswere not explicitly asked about that. In general EEG provides a very good timeresolution and fMRI spatial resolution. Thus, it is expected that fusion of bothbrain imaging tools will significantly improve classification performance.
Moreover, we found that frontal-cortex asymmetry patterns occur during sen-sation of reality, indicating that approach-related and withdrawal-related processesmay take place during such experiences. In [17] it was shown that frontal asymme-try patterns also occur with perceived quality. In particular, the right frontal cortexis activated when perceived quality is low, indicating that withdrawal-related pro-cesses are involved in such experiences. Since in this study we have found thatthe right frontal cortex is activated when sensation of reality is low, this findingindicates that similar brain patterns occur during perceived quality and sensationof reality. This corroborates also with the subjective rating analysis, in which itwas shown that sensation of reality and perceived overall quality are correlated.However, although the classification performance for sensation of reality was sig-nificantly non-random, this was not the case for overall perceived quality. This maybe due to occurrence of weaker brain patterns during overall quality compared to
18 Eleni Kroupi et al.
the patterns provoked by sensation of reality, which may affect the classificationperformance. More specifically, sensation of reality may be correlated with overallperceived quality, but it is also correlated with additional factors (e.g., 2D or 3Drendering), which may lead to more distinguishable EEG patterns. Moreover, an-other possible reason for not being able to recognize overall quality perception maybe due to subjective interpretation of the question. In particular, overall quality isa mix of different factors, such as picture quality, depth quality, etc. and each sub-ject may weight those factors differently and come up with his/her own definitionof overall quality based on what mainly matters to him/her.
5 Conclusions
In this study the way various QoE-related aspects affect brain and peripherywas explored. In particular, an experiment with sixteen participants was con-ducted, during which the participants were experiencing 2D and 3D multimediacontents of various quality levels, while at the same time their EEG, ECG, andrespiration signals were recorded. The subjects provided their self-assessed rat-ings after each video, in which they were asked to rate various aspects that mayinfluence QoE, namely, perceived depth, perceived overall quality, content pref-erence, and sensation of reality. A subjective ratings analysis revealed that theeffects of the rendering mode, actual quality level, and content on perceived depthand on sensation of reality were significant. It also revealed that there is a strongcorrelation between perceived depth and sensation of reality, as well as betweensensation of reality and perceived overall quality. Finally, for a given quality levelperceived depth and sensation of reality are both higher for 3D when compared to2D stimuli. Similarly, high quality sequences generally obtained higher ratings forperceived depth quantity, sensation of reality, and perceived overall quality whencompared to their corresponding low quality versions. However, the difference interms of perceived depth and sensation of reality between 3D LQ stimuli and 2DHQ stimuli was not significant.
To investigate if it is possible to automatically recognize perceived depth, sen-sation of reality, content preference, and perceived overall quality, two classificationschemes were carried out, one using EEG and another peripheral features. It wasrevealed that it is possible to recognize perceived depth, content preference, andsensation of reality from EEG signals, but not from the peripheral ones. It wasalso found that EEG high beta band is the main responsible one for each case, andthat the left frontal cortex seems to be involved when sensation of reality is high,indicating that high sensation of reality is related to approach-related emotionalprocesses. Finally, decision fusion between peripheral and EEG features was foundto improve classification performance in some cases.
References
1. Bilchick, K.C., Berger, R.D.: Heart rate variability. Journal of Cardiovascular Electro-physiology 17(6), 691–694 (2006)
2. Blankertz, B., Lemm, S., Treder, M., Haufe, S., Muller, K.R.: Single-trial analysis andclassification of ERP components: a tutorial. NeuroImage 56(2), 814–825 (2011)

Modeling Immersive Media Experiences by Sensing Impact on Subjects 19
3. Davidson, R., Ekman, P., Saron, C., Senulis, J., Friesen, W.: Approach-withdrawal andcerebral asymmetry: Emotional expression and brain physiology: I. Journal of Personalityand Social Psychology 58(2), 330–341 (1990)
4. Dores, A.R., Barbosa, F., Monteiro, L., Leitao, M., Reis, M., Coelho, C.M., Ribeiro, E.,Carvalho, I.P., Sousa, L., Castro-Caldas, A.: Amygdala activation in response to 2D and3D emotion-inducing stimuli. PsychNology Journal 12(1–2), 29–43 (2014)
5. Emoto, M., Niida, T., Okana, F.: Repeated vergence adaptation causes the decline ofvisual functions in watching stereoscopic television. Journal of Display Technology 1(2),328–340 (2005)
6. Fukunaga, K.: Introduction to Statistical Pattern Recognition. Academic press (1990)7. Hagura, H., Nakajima, M., Owaki, T., Takeda, T.: Study of asthenopia caused by the
viewing of stereoscopic images: measuring by MEG and other devices. In: Proceedings ofSPIE, vol. 6057, pp. 192–202 (2006)
8. Hastie, T., Tibshirani, R., Friedman, J.: The Elements of Statistical Learning, vol. 2.Springer (2009)
9. Hayward, V., Astley, O.R., Cruz-Hernandez, M., Grant, D., Robles-De-La-Torre, G.: Hap-tic interfaces and devices. Sensor Review 24(1), 16–29 (2004)
10. Hofman, D., Schutter, D.J.: Asymmetrical frontal resting-state beta oscillations predicttrait aggressive tendencies and behavioral inhibition. Social Cognitive and Affective Neu-roscience pp. 1–8 (2011)
11. ITU-R BT.2021: Subjective methods for the assessment of stereoscopic 3DTV systems.International Telecommunication Union (2012)
12. ITU-R BT.500-13: Methodology for the subjective assessment of the quality of televisionpictures. International Telecommunication Union (2012)
13. ITU-T P.910: Subjective video quality assessment methods for multimedia applications.International Telecommunication Union (2008)
14. Jensen, O., Goel, P., Kopell, N., Pohja, M., Hari, R., Ermentrout, B.: On the humansensorimotor-cortex beta rhythm: sources and modeling. Neuroimage 26(2), 347–355(2005)
15. Kim, D., Jung, Y.J., Kim, E., Ro, Y.M., Park, H.W.: Human brain response to visualfatigue caused by stereoscopic depth perception. In: Proc. Int. Conf. Digital Signal Pro-cessing, pp. 1–5. Corfu, Greece (2011)
16. Kittler, J., Hatef, M., Duin, R.P., Matas, J.: On combining classifiers. IEEE Transactionson Pattern Analysis and Machine Intelligence 20(3), 226–239 (1998)
17. Kroupi, E., Hanhart, P., Lee, J.S., Rerabek, M., Ebrahimi, T.: EEG correlates during videoquality perception. In: Proceedings of the 22nd European Signal Processing Conference(EUSIPCO), Lisbon, Portugal (2014)
18. Kroupi, E., Hanhart, P., Lee, J.S., Rerabek, M., Ebrahimi, T.: Predicting subjective sensa-tion of reality during multimedia consumption based on EEG and peripheral physiologicalsignals. In: Proceedings of the IEEE International Conference on Multimedia and Expo(2014)
19. Kroupi, E., Hanhart, P., Lee, J.S., Rerabek, M., Ebrahimi, T.: User-independent classifi-cation of 2D versus 3D multimedia experiences through EEG and physiological signals. In:Proceedings of the 8th International Workshop on Video Processing and Quality Metricsfor Consumer Electronics-VPQM (2014)
20. Kulkarni, S.D., Minor, M.A., Deaver, M.W., Pardyjak, E.R., Hollerbach, J.M.: Design,sensing, and control of a scaled wind tunnel for atmospheric display. IEEE/ASME Trans-actions on Mechatronics 17(4), 635–645 (2012)
21. Lee, J.S., De Simone, F., Ebrahimi, T.: Subjective quality evaluation of foveated videocoding using audio-visual focus of attention. IEEE Journal of Selected Topics in SignalProcessing 5(7), 1322–1331 (2011)
22. Li, H.C.O., Seo, J., Kham, K., Lee, S.: Measurement of 3D visual fatigue using event-related potential (ERP): 3D oddball paradigm. In: Proc. 3DTV Conf., pp. 213–216. Is-tanbul, Turkey (2008)
23. Muller, K., Anderson, C.W., Birch, G.E.: Linear and nonlinear methods for brain-computerinterfaces. IEEE Transactions on Neural Systems and Rehabilitation Engineering 11(2),165–169 (2003)
24. Nunez, P., Srinivasan, R.: Electric Fields of the Brain: The Neurophysics of EEG. OxfordUniversity Press (2006)
25. Pan, J., Tompkins, W.J.: A real-time QRS detection algorithm. IEEE Trans. BiomedicalEngineering (3), 230–236 (1985)
20 Eleni Kroupi et al.
26. Picard, R., Vyzas, E., Healey, J.: Toward machine emotional intelligence: Analysis of af-fective physiological state. Pattern Analysis and Machine Intelligence, IEEE Transactionson 23(10), 1175–1191 (2001)
27. Powers, D.M.W.: Evaluation: From precision, recall and f-measure to ROC, informedness,markedness & correlation. Journal of Machine Learning Technologies 2(1), 37–63 (2011)
28. von der Putten, A.M., Klatt, J., Broeke, S.T., McCall, R., Kramer, N.C., Wetzel, R.,Blum, L., Oppermann, L., Klatt, J.: Subjective and behavioral presence measurement andinteractivity in the collaborative augmented reality game TimeWarp. Interacting withComputers 24, 317–325 (2012)
29. Sanchez-Vives, M.V., Slater, M.: From presence to consciousness through virtual reality.Nature Reviews Neuroscience 6(4), 332–339 (2005)
30. Schafer, J., Strimmer, K.: A shrinkage approach to large-scale covariance matrix estima-tion and implications for functional genomics. Statistical Applications in Genetics andMolecular Biology 4(1), 32 (2005)
31. Scholler, S., Bosse, S., Treder, M.S., Blankertz, B., Curio, G., Muller, K.R., Wiegand, T.:Toward a direct measure of video quality perception using EEG. IEEE Transactions onImage Processessing 21(5), 2619–2629 (2012)
32. Schutter, D.J., de Weijer, A.D., Meuwese, J.D., Morgan, B., Van Honk, J.: Interrelationsbetween motivational stance, cortical excitability, and the frontal electroencephalogramasymmetry of emotion: a transcranial magnetic stimulation study. Human Brain Mapping29(5), 574–580 (2008)
33. Slater, M.: Place illusion and plausibility can lead to realistic behaviour in immersive vir-tual environments. Philosophical Transactions of the Royal Society B: Biological Sciences364(1535), 3549–3557 (2009)
34. Slater, M., Wilbur, S.: A framework for immersive virtual environments (FIVE): Specula-tions on the role of presence in virtual environments. Presence: Teleoperators and VirtualEnvironments 6(6), 603–616 (1997)
35. Stoakley, R., Conway, M.J., Pausch, R.: Virtual reality on a WIM: interactive worlds inminiature. In: Proc. SIGCHI Conf. Human Factors in Computing Systems, pp. 265–272.Denver, CO (1995)
36. Theodoridis, S., Koutroumbas, K.: Pattern Recognition. Academic Press (1998)