modeling in aquatic environment · modeling in aquatic environment lecture 2 catchment models ......
TRANSCRIPT
1
16.11.2016 Timo Huttula, Finnish Environment Institute 1
Modeling in aquaticenvironment
Lecture 2Catchment models
Timo Huttula
www.syke.fi/jyvaskyla
http://www.jyvaskyla.fi/international
2
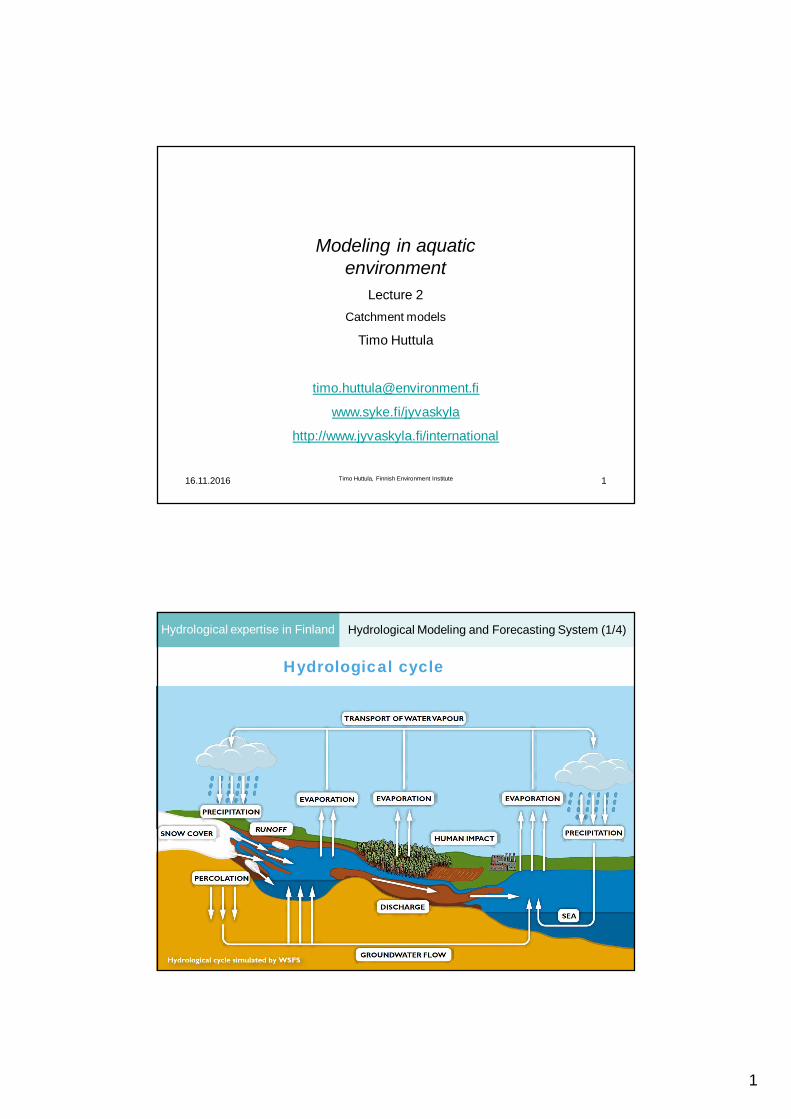
Hydrological expertise in Finland Hydrological Modeling and Forecasting System (1/4)
Hydrological cycle

2
WETS151 Huttula Lecture Set 1 V2 3
Mass balance in catchment(or watershed)
Timo Huttula, Finnish Environment Institute 4
Water balance model (continuity equation):a simple and good mathematical model
P = ET + dS + R
Max-Planc institute
For example foroceans:P = ET + R + dS
P=precipitationR=runoffET=evapotranspirationdS = change inwater storage; likewater in ice, snow.Inshort term watersoil, ground,reservoirs and lakes
16.11.2016
3
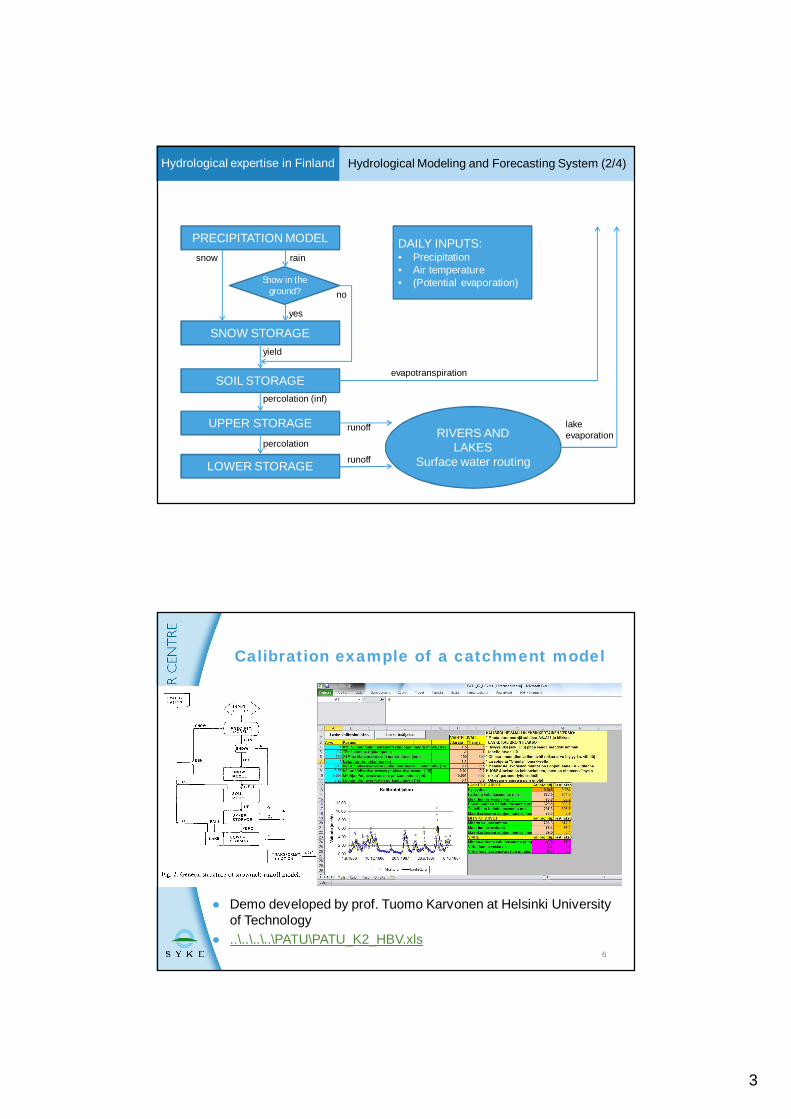
snow rain
yes
percolation (inf)
Hydrological expertise in Finland Hydrological Modeling and Forecasting System (2/4)
DAILY INPUTS:• Precipitation• Air temperature• (Potential evaporation)
LOWER STORAGE
UPPER STORAGE
SOIL STORAGE
SNOW STORAGE
PRECIPITATION MODEL
Snow in theground? no
yield
percolationRIVERS AND
LAKESSurface water routing
runoff
runoff
evapotranspiration
lakeevaporation
Demo developed by prof. Tuomo Karvonen at Helsinki Universityof Technology..\..\..\..\PATU\PATU_K2_HBV.xls
6
Calibration example of a catchment model
4
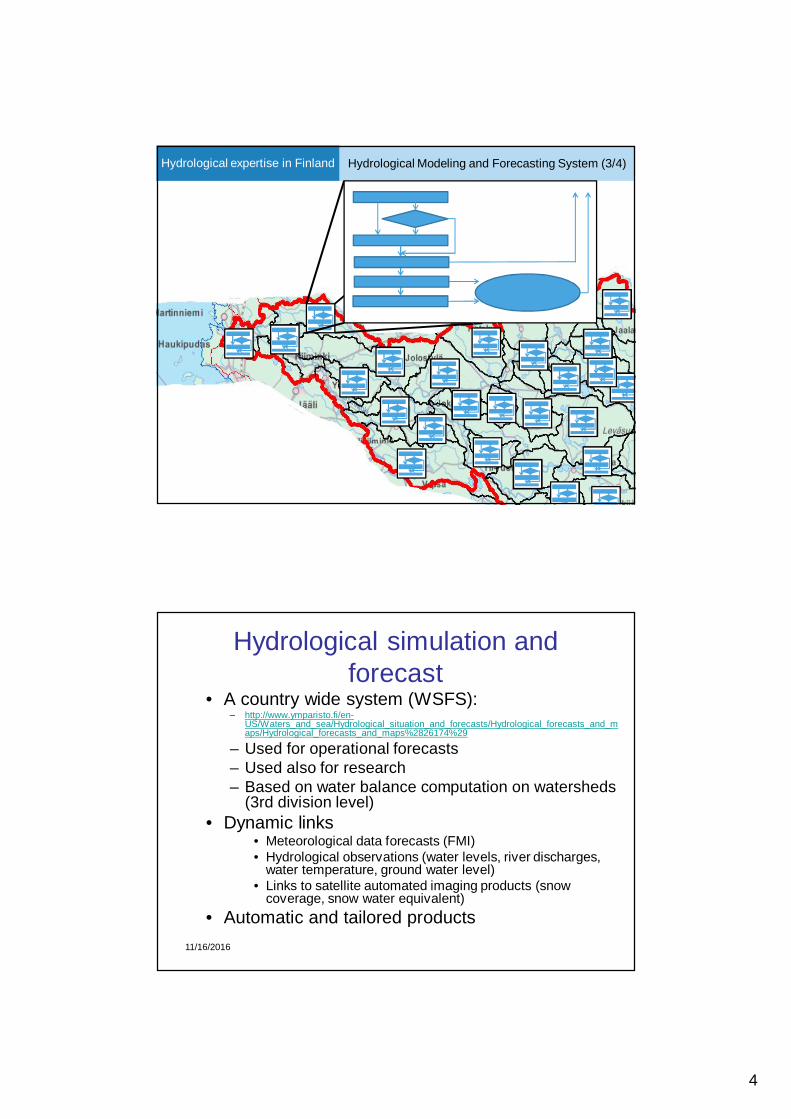
Hydrological expertise in Finland Hydrological Modeling and Forecasting System (3/4)
• A country wide system (WSFS):– http://www.ymparisto.fi/en-
US/Waters_and_sea/Hydrological_situation_and_forecasts/Hydrological_forecasts_and_maps/Hydrological_forecasts_and_maps%2826174%29
– Used for operational forecasts– Used also for research– Based on water balance computation on watersheds
(3rd division level)• Dynamic links
• Meteorological data forecasts (FMI)• Hydrological observations (water levels, river discharges,
water temperature, ground water level)• Links to satellite automated imaging products (snow
coverage, snow water equivalent)• Automatic and tailored products
11/16/2016
Hydrological simulation andforecast
5
Observations(weather, hydrology,
nutrients) SYKE & FMIWeather forecasts
ECMWF & FMI
Integrated use of weather, climate, water quantity andquality expertise in hydrological services in Finland
Nutrient load and transportof harmfull substances:
Simulation and forecasting
Forecastaccuracy
monitoring
MinisteriesCommunitiesRescue servicesLake regulatorsConsultsWater supplyCommon peopleMedia
Simulated datafor unobserved
areas
Process models: water quality, lakes, soil moisture, ice,frost & snow, corrected precipitation, evaporation
Climatechange Planning &
design floods
Weather radar, LAPSFMI
Realtimeforecastsand maps
Automaticflood
warningsAutomaticmedia
monitoring
Satellite snowSatellite snowFMI & SYKE
R&D
1-hourtimestep
model
Adaptiveoutflow
calculation
Local environmentalauthorities, rescueservices, lake regulators
Operative lakeregulation & flood
mitigation decisions
Water balancefor mines
Flood Centre• Officers on duty (met. & hyd.)• Hydrologists, meteorologists,
water resource experts• Video connections to local
environmental authorities andrescue departmens Manual flood warnings and water situation info
WATERSHED SIMULATION ANDFORECASTING SYSTEM
WSFS-VEMALASYKE
Forecast for Pori
DataAssimil.
andControl
Observations fromneighbour countries
Internationalexamples
Tailored modellingsolutions
Dam control
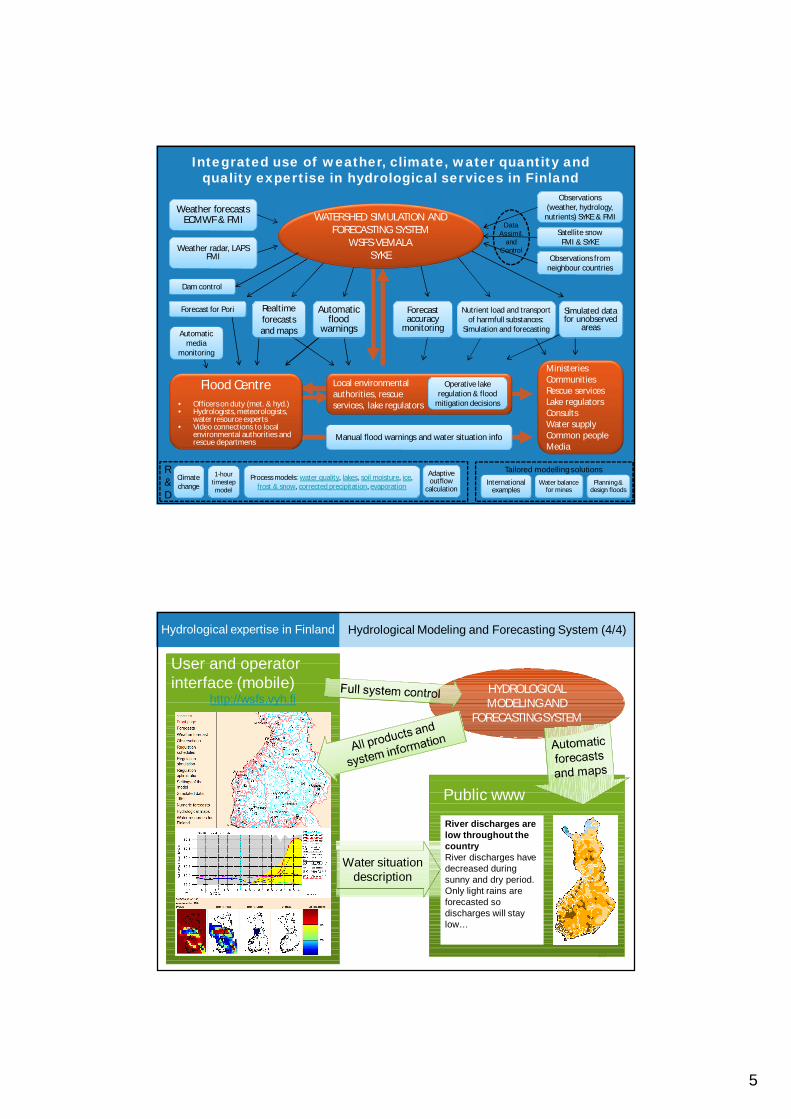
Hydrological expertise in Finland Hydrological Modeling and Forecasting System (4/4)
10
User and operatorinterface (mobile)
http://wsfs.vyh.fiHYDROLOGICALMODELING AND
FORECASTING SYSTEM
Public www
River discharges arelow throughout thecountryRiver discharges havedecreased duringsunny and dry period.Only light rains areforecasted sodischarges will staylow…
Water situationdescription
6
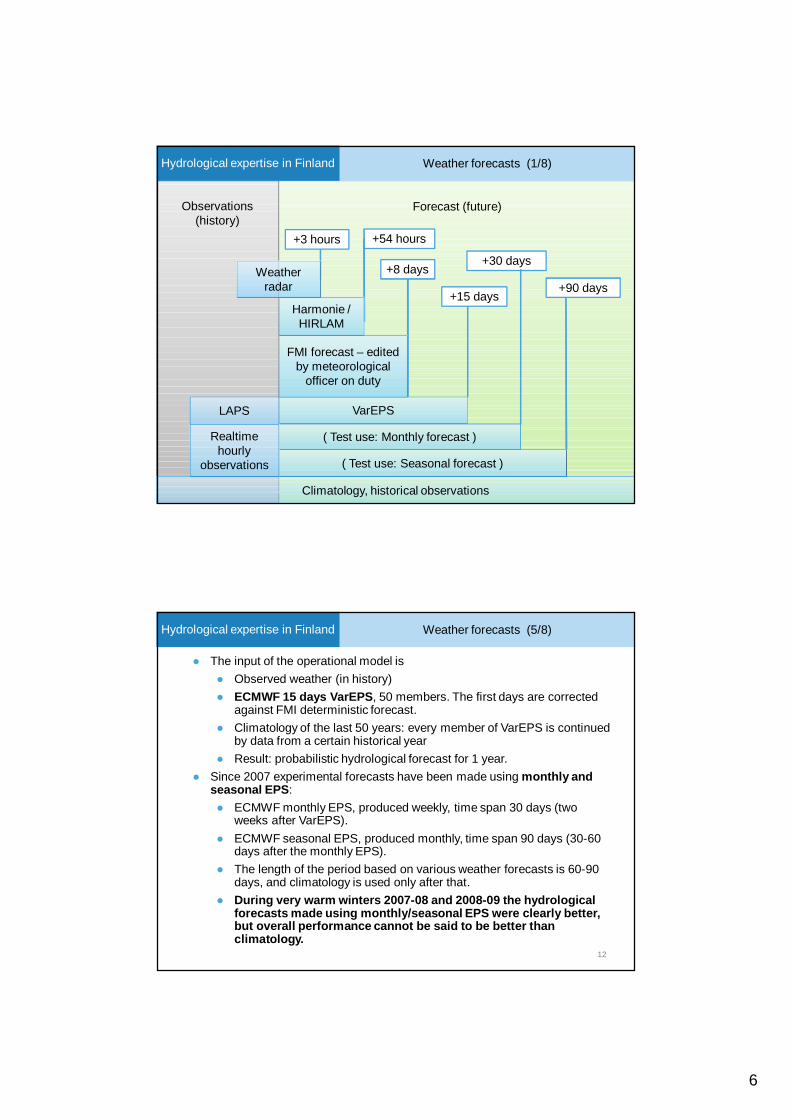
Forecast (future)Observations(history)
Weather forecasts (1/8)Hydrological expertise in Finland
Climatology, historical observations
+3 hours +54 hours
+8 days
+15 days
+30 days
+90 days
( Test use: Seasonal forecast )
( Test use: Monthly forecast )
VarEPS
FMI forecast – editedby meteorological
officer on duty
Harmonie /HIRLAM
Weatherradar
Realtimehourly
observations
LAPS
12
Weather forecasts (5/8)Hydrological expertise in Finland
The input of the operational model isObserved weather (in history)ECMWF 15 days VarEPS, 50 members. The first days are correctedagainst FMI deterministic forecast.Climatology of the last 50 years: every member of VarEPS is continuedby data from a certain historical yearResult: probabilistic hydrological forecast for 1 year.
Since 2007 experimental forecasts have been made using monthly andseasonal EPS:
ECMWF monthly EPS, produced weekly, time span 30 days (twoweeks after VarEPS).ECMWF seasonal EPS, produced monthly, time span 90 days (30-60days after the monthly EPS).The length of the period based on various weather forecasts is 60-90days, and climatology is used only after that.During very warm winters 2007-08 and 2008-09 the hydrologicalforecasts made using monthly/seasonal EPS were clearly better,but overall performance cannot be said to be better thanclimatology.

7
13
Weather forecasts (6/8)Hydrological expertise in Finland
Mean forecast goodness of fit values for lake inflow 30, 60 and90 days ahead
Comparing inflow forecasts of2013 shows that usingoperative weather forecast gavebetter results than usingexperimental use monthly andseasonal EPS weatherforecasts
14
Weather radar observations and nowcasts (1/1)Hydrological expertise in Finland
Weather radarHourly radar data in 2x2km gridUsed for 2 days in modelUnderestimates large rainfalls
Corrected manually against raingauges
Radar nowcasting3hrs in Southern FinlandEnsamble of 50 members
LAPSCombines information from weatherradar, automatic real-time rain gauges,road weather measurements, …Will probably be used in WSFS as aweather radar replacement in nearfuture 14
Weather radar and LAPS in WSFS
8
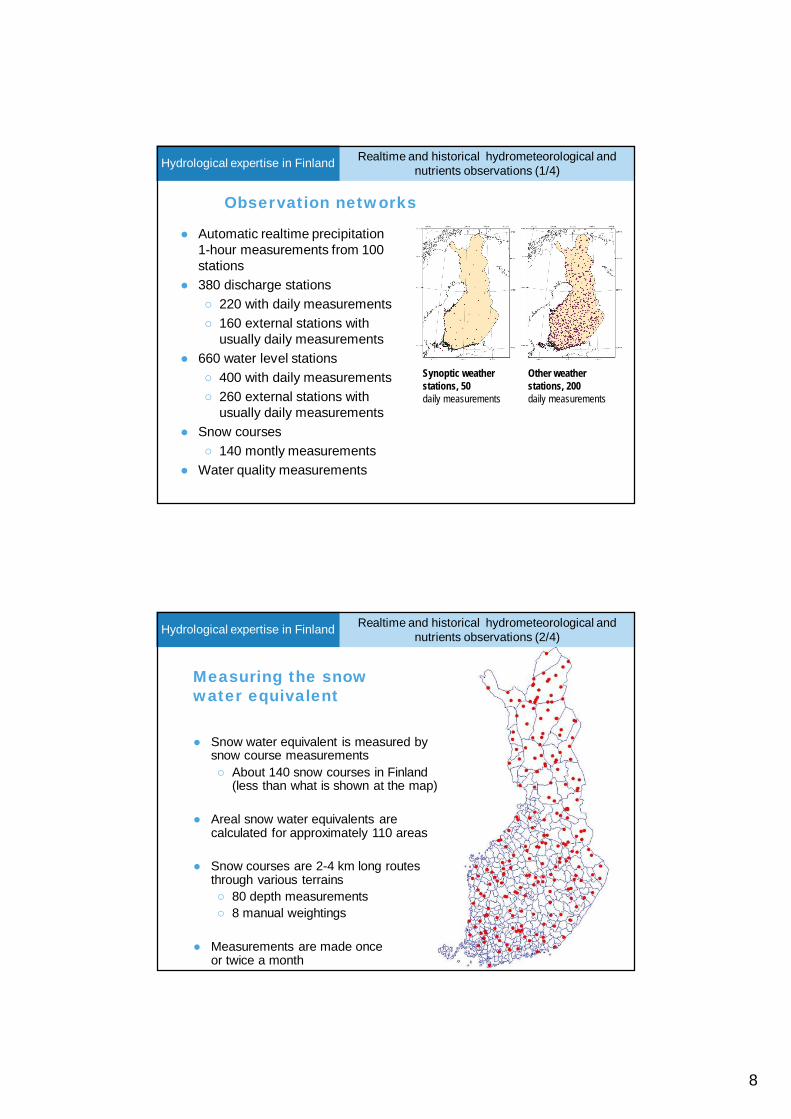
Realtime and historical hydrometeorological andnutrients observations (1/4)Hydrological expertise in Finland
Observation networks
Synoptic weatherstations, 50daily measurements
Other weatherstations, 200daily measurements
Automatic realtime precipitation1-hour measurements from 100stations380 discharge stations
220 with daily measurements160 external stations withusually daily measurements
660 water level stations400 with daily measurements260 external stations withusually daily measurements
Snow courses140 montly measurements
Water quality measurements
Realtime and historical hydrometeorological andnutrients observations (2/4)Hydrological expertise in Finland
Measuring the snowwater equivalent
Snow water equivalent is measured bysnow course measurements
About 140 snow courses in Finland(less than what is shown at the map)
Areal snow water equivalents arecalculated for approximately 110 areas
Snow courses are 2-4 km long routesthrough various terrains
80 depth measurements8 manual weightings
Measurements are made onceor twice a month
9
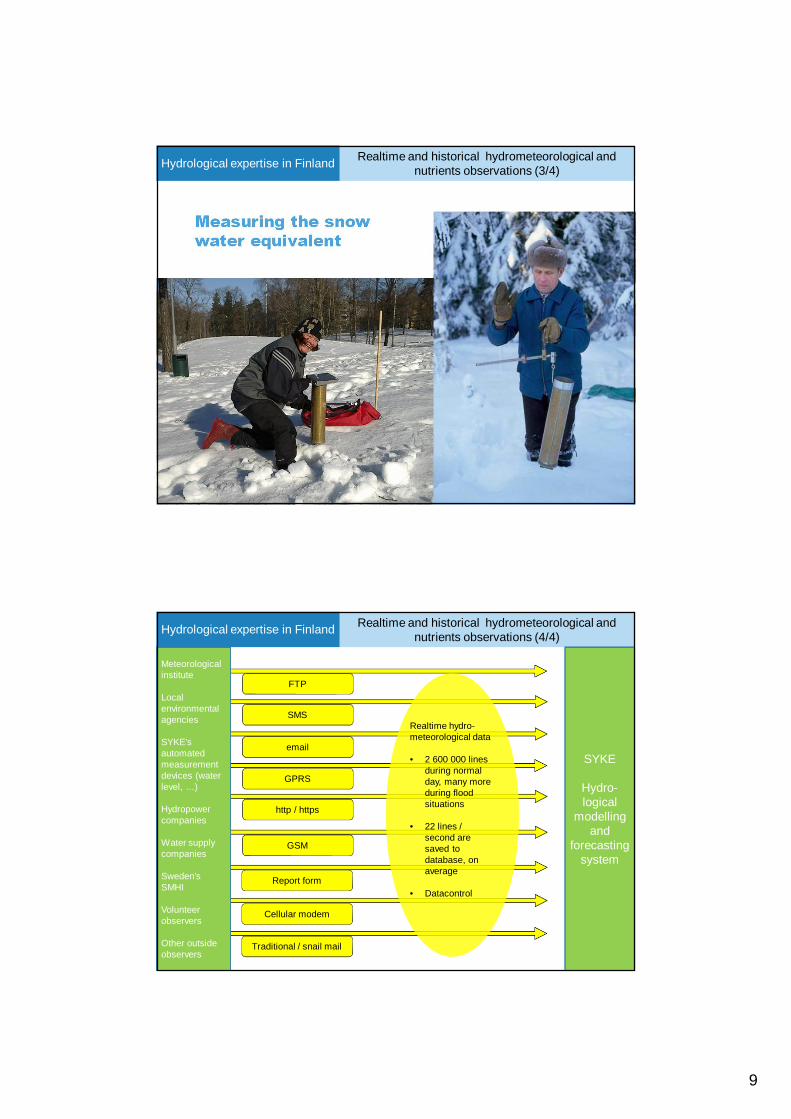
Realtime and historical hydrometeorological andnutrients observations (3/4)Hydrological expertise in Finland
Measuring the snowwater equivalent
18
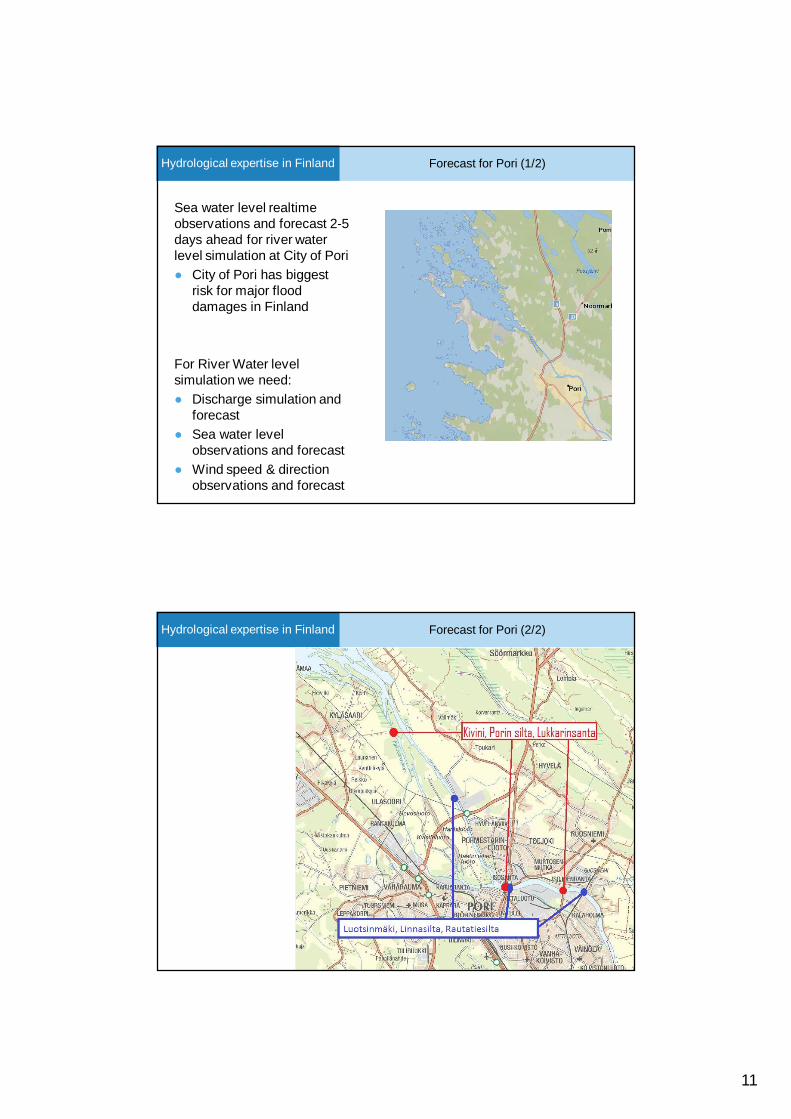
Realtime and historical hydrometeorological andnutrients observations (4/4)Hydrological expertise in Finland
SYKE
Hydro-logical
modellingand
forecastingsystem
Meteorologicalinstitute
Localenvironmentalagencies
SYKE’sautomatedmeasurementdevices (waterlevel, …)
Hydropowercompanies
Water supplycompanies
Sweden’sSMHI
Volunteerobservers
Other outsideobservers
Cellular modem
SMS
Report form
GPRS
GSM
FTP
http / https
Traditional / snail mail
Realtime hydro-meteorological data
• 2 600 000 linesduring normalday, many moreduring floodsituations
• 22 lines /second aresaved todatabase, onaverage
• Datacontrol

10
Satellite snow observations (1/2)Hydrological expertise in Finland
CryoLandFractional snow coverSnow water equivalent
Satellite snow products in WSFS
Satellite snow observations (2/2)Hydrological expertise in Finland
Satellite snow products in WSFS
Areal snow difficult to estimateFSC provides informationabout remaining snow infinal stage of melting
Snow water equivalent
If modelled snow differs fromprec.sum SWE helpsHas not yet been as helpful asareal snow
Fractional snow cover
11
Forecast for Pori (1/2)Hydrological expertise in Finland
Sea water level realtimeobservations and forecast 2-5days ahead for river waterlevel simulation at City of Pori
City of Pori has biggestrisk for major flooddamages in Finland
For River Water levelsimulation we need:
Discharge simulation andforecastSea water levelobservations and forecastWind speed & directionobservations and forecast
Forecast for Pori (2/2)Hydrological expertise in Finland

12
Adjustment
Dam control (1/1)Hydrological expertise in Finland
Kaarenhaara dam at Evijärvi is controlled by Watershed Simulation andForecasting System SYKE-WSFSThe WSFS model calculates the daily runoff based on the inflow forecast(adaptive outflow calculation), and the result is sent to the damThe dam adjusts the outflow according to the model, but applies also asafety logic on top of the model’s calculationThe model’s outflow for the dam can be manually overriden, if necessary
Regulation dam controlled by the hydrological model
Guidelines / manualadjustment
Overridepossibility
SYKEWSFS
DamDam interface (providedby private partner)
ELY
Realtime forecasts and maps (1/3)Hydrological expertise in Finland
Water levelDischargeIce dam riskIce breakupNutrient loadEvaporationSnowRunoffGroundwaterSoil moistureHydropower situation

13
Realtime forecasts and maps (2/3)Hydrological expertise in Finland
Realtime forecasts and maps (3/3)Hydrological expertise in Finland
Realtime forecasts and maps for over 600lakes and rivers available online:
http://www.environment.fi/waterforecast
http://www.ymparisto.fi/vesistoennusteet(in Finnish)
14
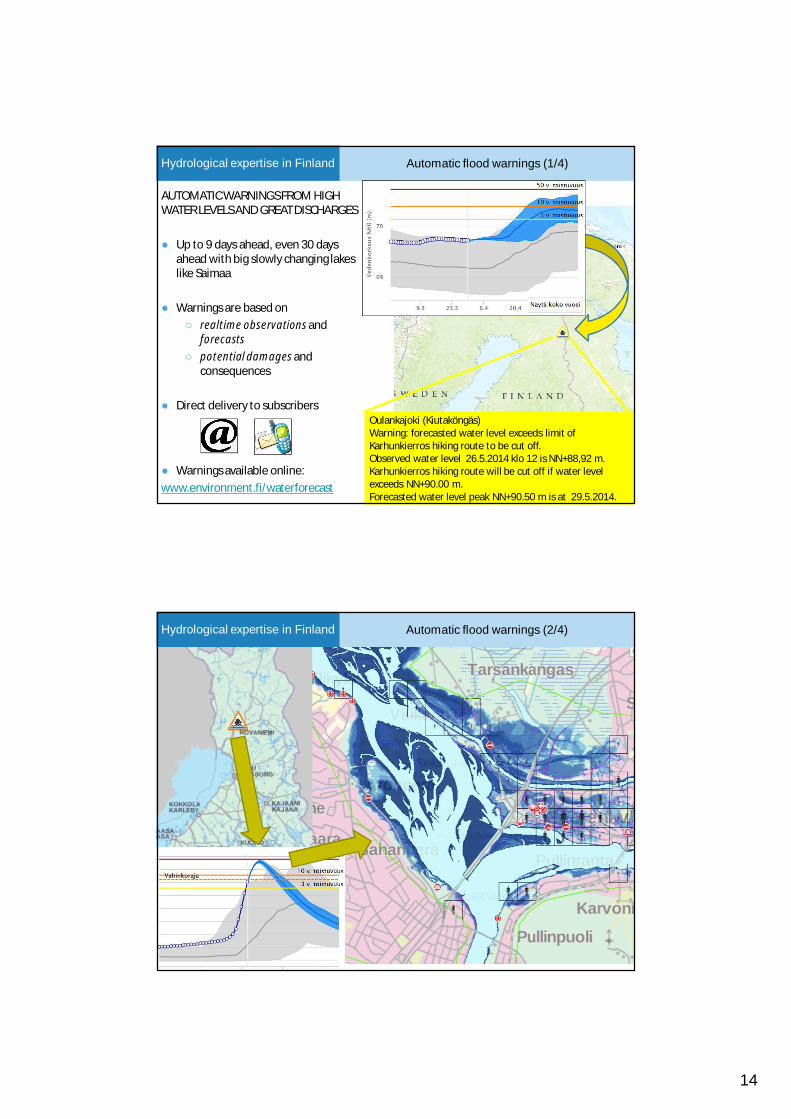
Automatic flood warnings (1/4)Hydrological expertise in Finland
Oulankajoki (Kiutaköngäs)Warning: forecasted water level exceeds limit ofKarhunkierros hiking route to be cut off.Observed water level 26.5.2014 klo 12 is NN+88,92 m.Karhunkierros hiking route will be cut off if water levelexceeds NN+90.00 m.Forecasted water level peak NN+90.50 m is at 29.5.2014.
AUTOMATIC WARNINGS FROM HIGHWATER LEVELS AND GREAT DISCHARGES
Up to 9 days ahead, even 30 daysahead with big slowly changing lakeslike Saimaa
Warnings are based onrealtime observations andforecastspotential damages andconsequences
Direct delivery to subscribers
Warnings available online:www.environment.fi/waterforecast
28
Automatic flood warnings (2/4)Hydrological expertise in Finland
15
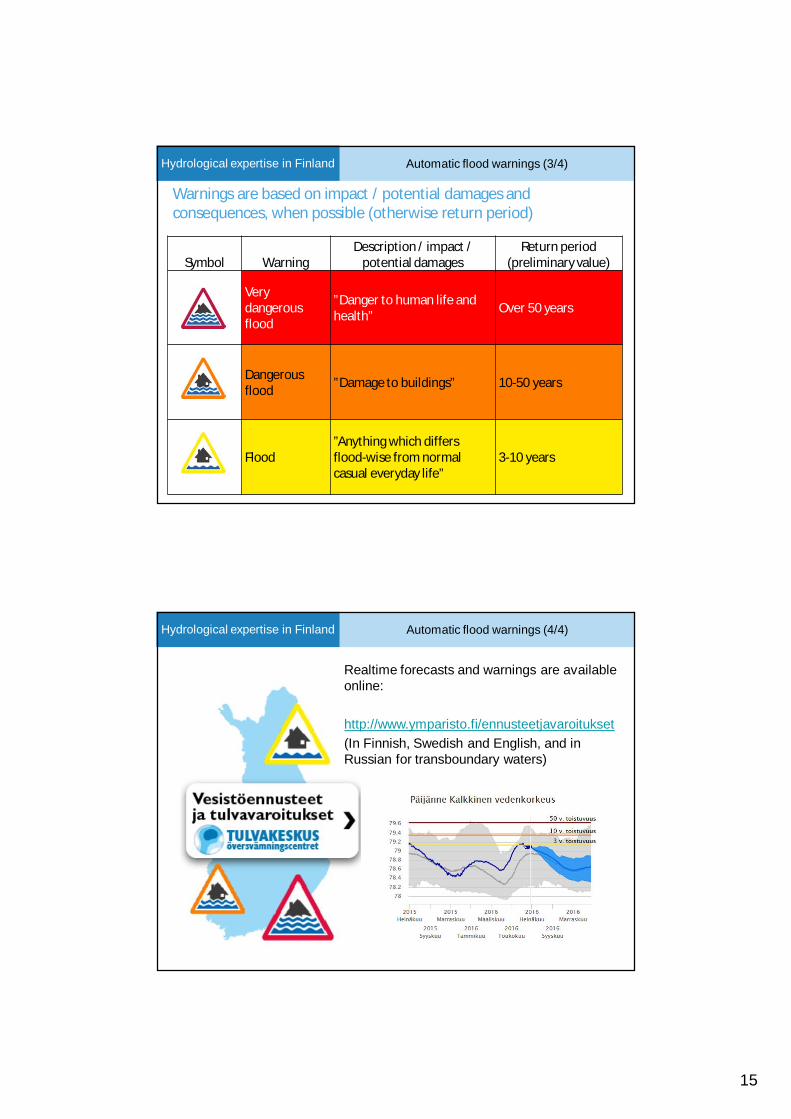
Automatic flood warnings (3/4)Hydrological expertise in Finland
Warnings are based on impact / potential damages andconsequences, when possible (otherwise return period)
Symbol WarningDescription / impact /
potential damagesReturn period
(preliminary value)
Verydangerousflood
”Danger to human life andhealth” Over 50 years
Dangerousflood ”Damage to buildings” 10-50 years
Flood”Anything which differsflood-wise from normalcasual everyday life”
3-10 years
Automatic flood warnings (4/4)Hydrological expertise in Finland
Realtime forecasts and warnings are availableonline:
http://www.ymparisto.fi/ennusteetjavaroitukset(In Finnish, Swedish and English, and inRussian for transboundary waters)

16
Nutrient load simulation and forecasting (1/13)Hydrological expertise in Finland
Structure of WSFS-Vemala water quality model
Phosphorus and nitrogen leaching from fields and forestPoint sources, scattered dwelling and depositionTransport and retention in rivers and lakesField level descriptionCovers all Finland
Nutrient load simulation and forecasting (2/13)Hydrological expertise in Finland
32
Realtime and annual phosphorusload from Finland to Baltic sea
17
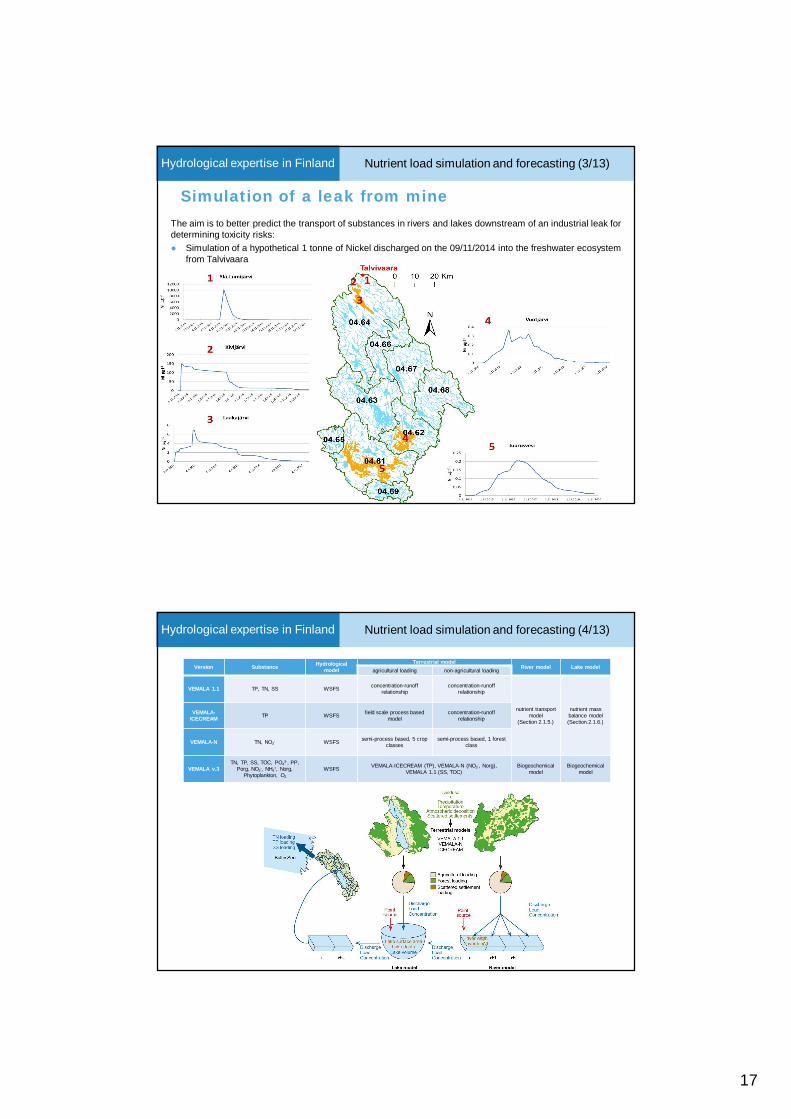
Nutrient load simulation and forecasting (3/13)Hydrological expertise in Finland
33
Simulation of a leak from mineThe aim is to better predict the transport of substances in rivers and lakes downstream of an industrial leak fordetermining toxicity risks:
Simulation of a hypothetical 1 tonne of Nickel discharged on the 09/11/2014 into the freshwater ecosystemfrom Talvivaara
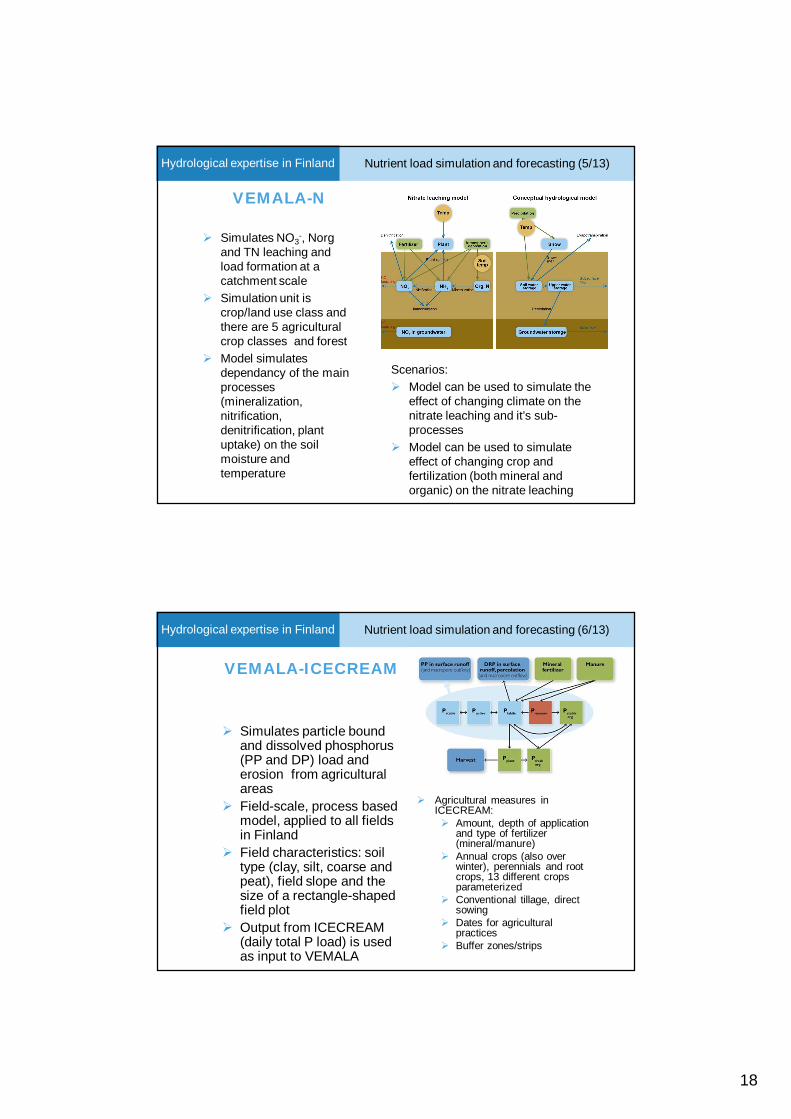
Nutrient load simulation and forecasting (4/13)Hydrological expertise in Finland
Version Substance Hydrologicalmodel
Terrestrial modelRiver model Lake modelagricultural loading non-agricultural loading
VEMALA 1.1 TP, TN, SS WSFS concentration-runoffrelationship
concentration-runoffrelationship
nutrient transportmodel
(Section 2.1.5.)
nutrient massbalance model(Section.2.1.6.)
VEMALA-ICECREAM TP WSFS field scale process based
modelconcentration-runoff
relationship
VEMALA-N TN, NO3- WSFS semi-process based, 5 crop
classessemi-process based, 1 forest
class
VEMALA v.3TN, TP, SS, TOC, PO4
3-, PP,Porg, NO3
-, NH4+, Norg,
Phytoplankton, O2
WSFS VEMALA-ICECREAM (TP), VEMALA-N (NO3-, Norg),
VEMALA 1.1 (SS, TOC)Biogeochemical
modelBiogeochemical
model
18
Nutrient load simulation and forecasting (5/13)Hydrological expertise in Finland
Simulates NO3-, Norg
and TN leaching andload formation at acatchment scaleSimulation unit iscrop/land use class andthere are 5 agriculturalcrop classes and forestModel simulatesdependancy of the mainprocesses(mineralization,nitrification,denitrification, plantuptake) on the soilmoisture andtemperature
VEMALA-N
Scenarios:Model can be used to simulate theeffect of changing climate on thenitrate leaching and it’s sub-processesModel can be used to simulateeffect of changing crop andfertilization (both mineral andorganic) on the nitrate leaching
Nutrient load simulation and forecasting (6/13)Hydrological expertise in Finland
VEMALA-ICECREAM
Simulates particle boundand dissolved phosphorus(PP and DP) load anderosion from agriculturalareasField-scale, process basedmodel, applied to all fieldsin FinlandField characteristics: soiltype (clay, silt, coarse andpeat), field slope and thesize of a rectangle-shapedfield plotOutput from ICECREAM(daily total P load) is usedas input to VEMALA
Agricultural measures inICECREAM:
Amount, depth of applicationand type of fertilizer(mineral/manure)Annual crops (also overwinter), perennials and rootcrops, 13 different cropsparameterizedConventional tillage, directsowingDates for agriculturalpracticesBuffer zones/strips
19
Nutrient load simulation and forecasting (7/13)Hydrological expertise in Finland
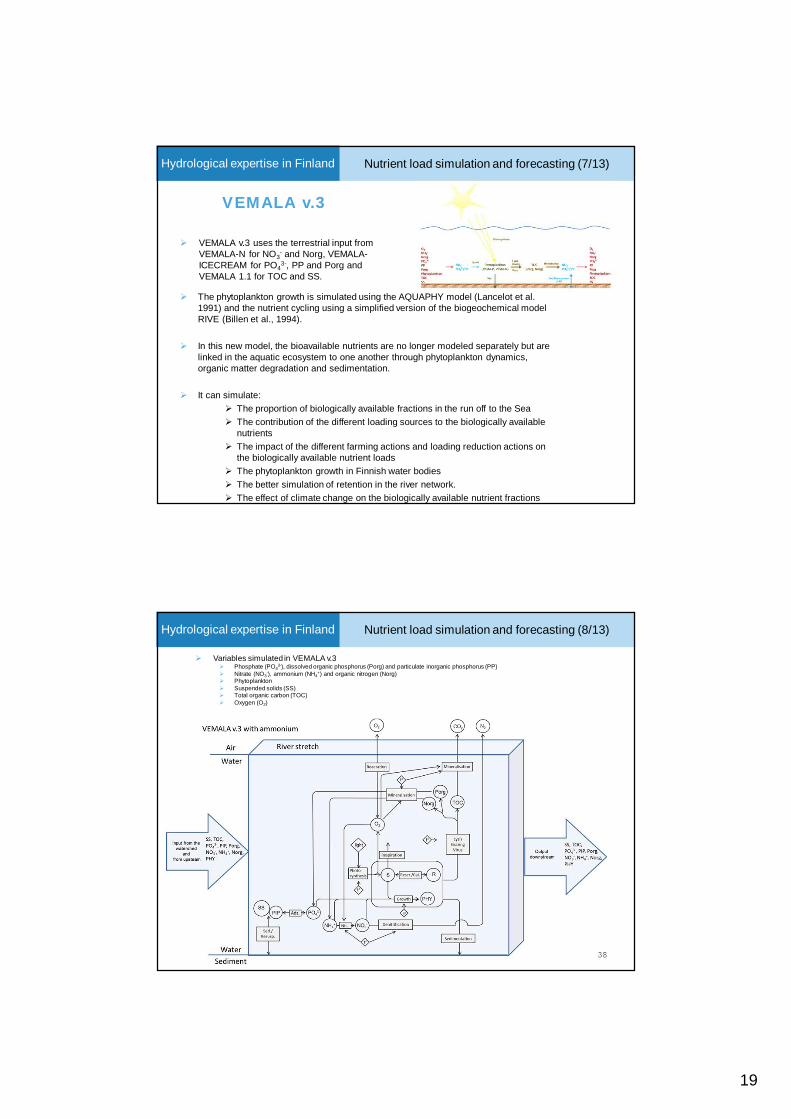
The phytoplankton growth is simulated using the AQUAPHY model (Lancelot et al.1991) and the nutrient cycling using a simplified version of the biogeochemical modelRIVE (Billen et al., 1994).
In this new model, the bioavailable nutrients are no longer modeled separately but arelinked in the aquatic ecosystem to one another through phytoplankton dynamics,organic matter degradation and sedimentation.
It can simulate:The proportion of biologically available fractions in the run off to the SeaThe contribution of the different loading sources to the biologically availablenutrientsThe impact of the different farming actions and loading reduction actions onthe biologically available nutrient loadsThe phytoplankton growth in Finnish water bodiesThe better simulation of retention in the river network.The effect of climate change on the biologically available nutrient fractions
VEMALA v.3
VEMALA v.3 uses the terrestrial input fromVEMALA-N for NO3
- and Norg, VEMALA-ICECREAM for PO4
3-, PP and Porg andVEMALA 1.1 for TOC and SS.
Variables simulated in VEMALA v.3Phosphate (PO4
3-), dissolved organic phosphorus (Porg) and particulate inorganic phosphorus (PP)Nitrate (NO3
-), ammonium (NH4+) and organic nitrogen (Norg)
PhytoplanktonSuspended solids (SS)Total organic carbon (TOC)Oxygen (O2)
38
Nutrient load simulation and forecasting (8/13)Hydrological expertise in Finland
20
Nutrient load simulation and forecasting (9/13)Hydrological expertise in Finland
It can simulate:The proportion of total or biologically available fractions in the run off to theSeaThe contribution of the different loading sources to the total or biologicallyavailable nutrientsThe retention in lakes and the river network.The phytoplankton growth in Finnish water bodiesScenarios:
The impact of the different farming actions and loading reductionactions on the total or biologically available nutrient loadsThe effect of climate change on the total or biologically availablenutrient fractions
VEMALA can help in the WFD implementation
Impact of the mining industry
Where can it be used?
Nutrient load simulation and forecasting (10/13)Hydrological expertise in Finland
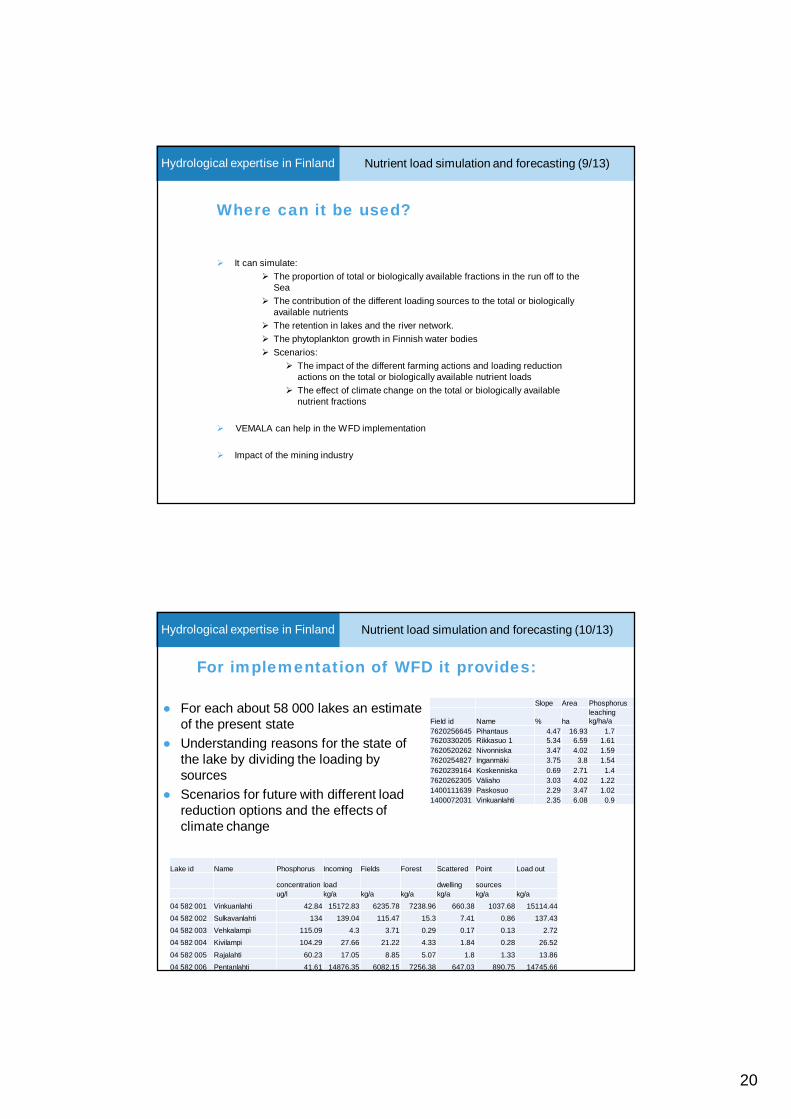
For implementation of WFD it provides:
For each about 58 000 lakes an estimateof the present stateUnderstanding reasons for the state ofthe lake by dividing the loading bysourcesScenarios for future with different loadreduction options and the effects ofclimate change
Slope Area Phosphorus
Field id Name % haleachingkg/ha/a
7620256645 Pihantaus 4.47 16.93 1.77620330205 Rikkasuo 1 5.34 6.59 1.617620520262 Nivonniska 3.47 4.02 1.597620254827 Inganmäki 3.75 3.8 1.547620239164 Koskenniska 0.69 2.71 1.47620262305 Väliaho 3.03 4.02 1.221400111639 Paskosuo 2.29 3.47 1.021400072031 Vinkuanlahti 2.35 6.08 0.9
Lake id Name Phosphorus Incoming Fields Forest Scattered Point Load out
concentration load dwelling sourcesug/l kg/a kg/a kg/a kg/a kg/a kg/a
04 582 001 Vinkuanlahti 42.84 15172.83 6235.78 7238.96 660.38 1037.68 15114.4404 582 002 Sulkavanlahti 134 139.04 115.47 15.3 7.41 0.86 137.4304 582 003 Vehkalampi 115.09 4.3 3.71 0.29 0.17 0.13 2.7204 582 004 Kivilampi 104.29 27.66 21.22 4.33 1.84 0.28 26.52
04 582 005 Rajalahti 60.23 17.05 8.85 5.07 1.8 1.33 13.8604 582 006 Pentanlahti 41.61 14876.35 6082.15 7256.38 647.03 890.75 14745.66
21
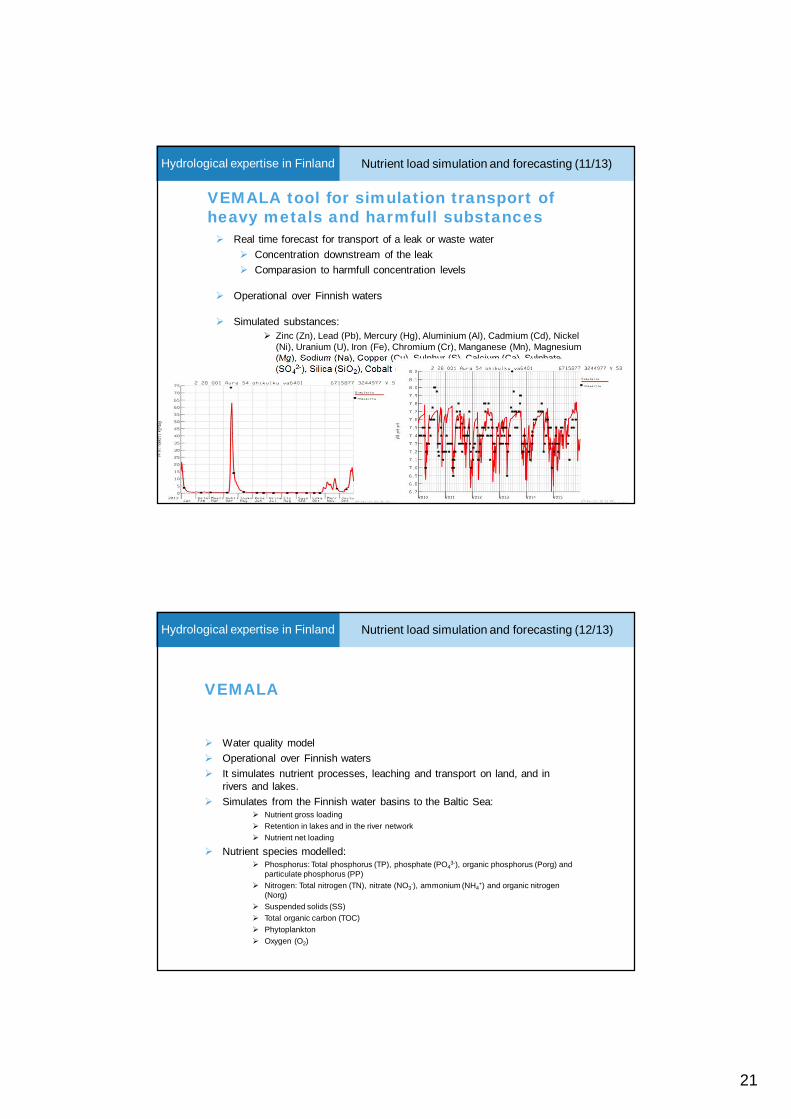
Real time forecast for transport of a leak or waste waterConcentration downstream of the leakComparasion to harmfull concentration levels
Operational over Finnish waters
Simulated substances:Zinc (Zn), Lead (Pb), Mercury (Hg), Aluminium (Al), Cadmium (Cd), Nickel(Ni), Uranium (U), Iron (Fe), Chromium (Cr), Manganese (Mn), Magnesium(Mg), Sodium (Na), Copper (Cu), Sulphur (S), Calcium (Ca), Sulphate(SO4
2-), Silica (SiO2), Cobalt (Co), Arsenic (As), Potassium (K).pH
41
VEMALA tool for simulation transport ofheavy metals and harmfull substances
Nutrient load simulation and forecasting (11/13)Hydrological expertise in Finland
Nutrient load simulation and forecasting (12/13)Hydrological expertise in Finland
Water quality modelOperational over Finnish watersIt simulates nutrient processes, leaching and transport on land, and inrivers and lakes.Simulates from the Finnish water basins to the Baltic Sea:
Nutrient gross loadingRetention in lakes and in the river networkNutrient net loading
Nutrient species modelled:Phosphorus: Total phosphorus (TP), phosphate (PO4
3-), organic phosphorus (Porg) andparticulate phosphorus (PP)Nitrogen: Total nitrogen (TN), nitrate (NO3
-), ammonium (NH4+) and organic nitrogen
(Norg)Suspended solids (SS)Total organic carbon (TOC)PhytoplanktonOxygen (O2)
VEMALA
22
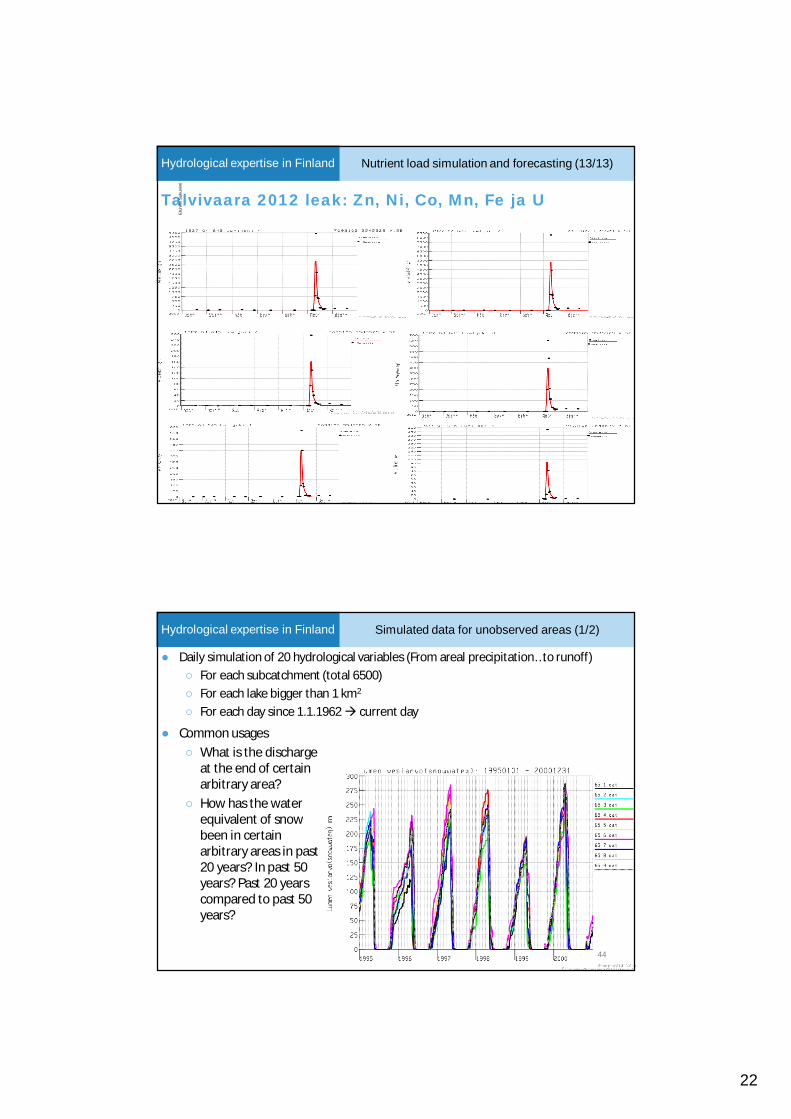
Talvivaara 2012 leak: Zn, Ni, Co, Mn, Fe ja U16
.11.
2016
Etu
nim
iSuk
unim
i
43
Nutrient load simulation and forecasting (13/13)Hydrological expertise in Finland
44
Simulated data for unobserved areas (1/2)Hydrological expertise in Finland
Daily simulation of 20 hydrological variables (From areal precipitation…to runoff)For each subcatchment (total 6500)For each lake bigger than 1 km2
For each day since 1.1.1962 current day
Common usagesWhat is the dischargeat the end of certainarbitrary area?How has the waterequivalent of snowbeen in certainarbitrary areas in past20 years? In past 50years? Past 20 yearscompared to past 50years?

23
Simulated data for unobserved areas (2/2)Hydrological expertise in Finland
Compares short-term values with long-termdistributionStatistical indicator based on a transformation intostandard normal variable with zero mean andvariance equal to one
Available for 1, 3, 6, 12 and 24 months periods
Precipitation (SPI)For meteorological drought situations
Runoff (SRI)For hydrological drought situationsTakes into account, in addition toprecipitation, other relevant elements ofhydrological cycle
Both SPI and SRI are ”only indicators” of thephenomenon, and it might be wise to use themtogether instead using just the other
Standardized index
Indicatorvalues
Droughtness Cumulativeprobability
Categoryprobability
-1.0 to 0.0 Normal 0.159 – 0.5 34.1 %
-1.5 to -1.0 Moderate 0.067 – 0.159 9.2 %
-2.0 to -1.5 Severe 0.023 – 0.067 4.4 %
to -2.0 Extreme 0.0 – 0.023 2.3 %
Forecast accuracy monitoring (1/2)Hydrological expertise in Finland
Forecast accuracy monitoringWSFS operational model forecast input (precipitation and temperature) and output(lake inflow and river peak flow) is archived and later verified against observations.
Archiving and verification is completely automatic, and results are shown incontinuously updating web interface.
The web interface shows many verification criteria, tables for comparison, andverification graph types for WSFS forecasting locations in Finland.

24
47
Forecast accuracy monitoring (2/2)Hydrological expertise in Finland
Flood Centre (1/7)Hydrological expertise in Finland

25
Joint flood service of Finnish Environment Institute (SYKE) andFinnish Meteorological Institute (FMI)National water situation and flood information, forecasts andwarnings 24/7All types of flooding:
WatershedSea coastUrban
Solid co-operationwith regional floodmanagement authorities(ELY-centres,rescue departments)
Flood Centre (1/9)Hydrological expertise in Finland
Flood Centre
Regional environment authorities,rescue departments, municipals
Operativeweather andstorm surgeexpertise of
FMI
Operativeflood
expertise ofSYKE
Flood Centre
Flood Centre (2/9)Hydrological expertise in Finland
Flood Centre productsWater situation informationFlood warnings to authorities and publicFlood situation pictureLUOVA (National natural disaster warning andinformation system) warnings to authoritiesFlood damage and effect forecasts and mapsFlood expectionality statements to insurancecompanies
26
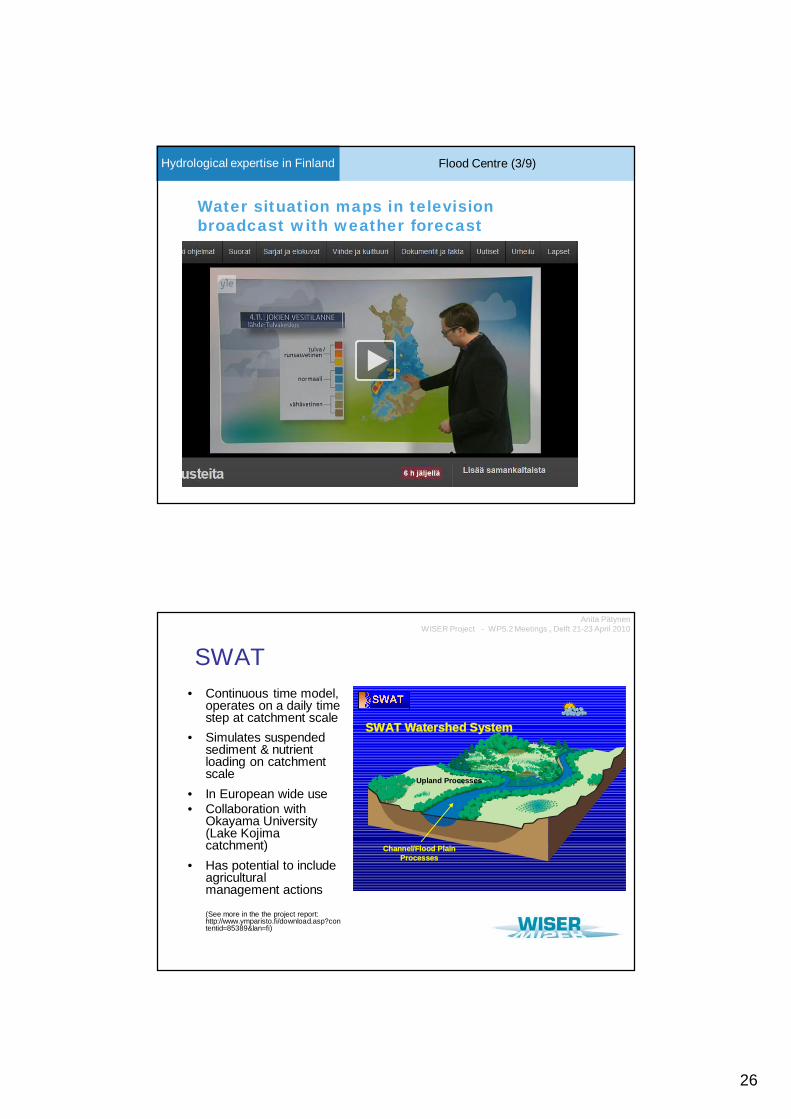
Flood Centre (3/9)Hydrological expertise in Finland
Water situation maps in televisionbroadcast with weather forecast
SWAT• Continuous time model,
operates on a daily timestep at catchment scale
• Simulates suspendedsediment & nutrientloading on catchmentscale
• In European wide use• Collaboration with
Okayama University(Lake Kojimacatchment)
• Has potential to includeagriculturalmanagement actions
(See more in the the project report:http://www.ymparisto.fi/download.asp?contentid=85389&lan=fi)
Anita PätynenWISER Project - WP5.2 Meetings , Delft 21-23 April 2010
Upland Processes
SWAT Watershed System
Channel/Flood PlainProcesses
27
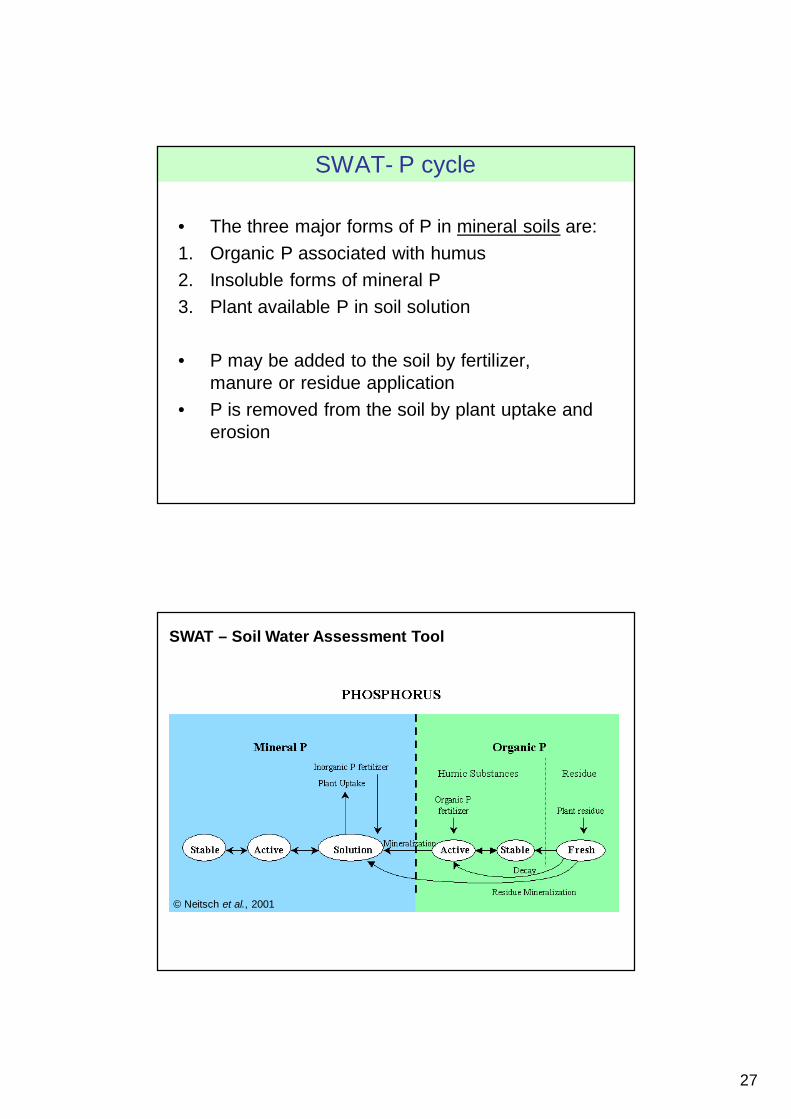
SWAT- P cycle
• The three major forms of P in mineral soils are:1. Organic P associated with humus2. Insoluble forms of mineral P3. Plant available P in soil solution
• P may be added to the soil by fertilizer,manure or residue application
• P is removed from the soil by plant uptake anderosion
SWAT – Soil Water Assessment Tool
© Neitsch et al., 2001
28
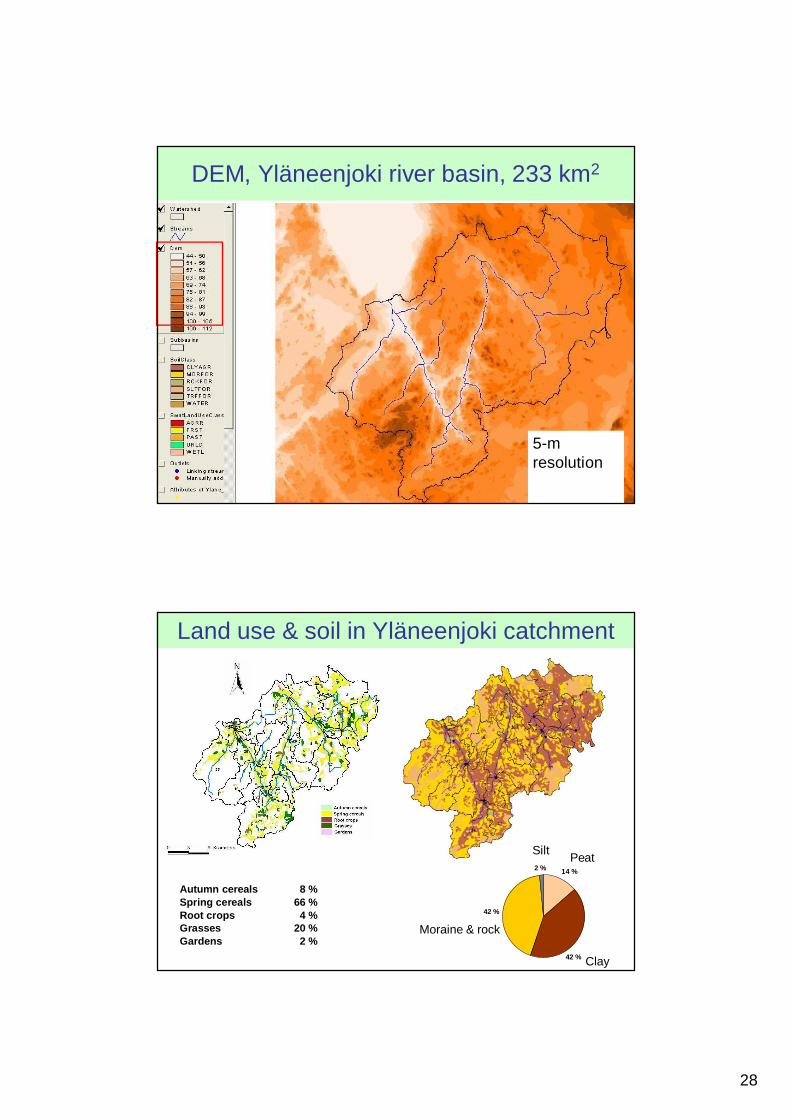
DEM, Yläneenjoki river basin, 233 km2
5-mresolution
Land use & soil in Yläneenjoki catchment
Autumn cereals 8 %Spring cereals 66 %Root crops 4 %Grasses 20 %Gardens 2 %
14 %
42 %
2 %
42 % Clay
Moraine & rock
PeatSilt

29
Yläneenjoki SWAT application - sub basins
Calibration point: Vanhakartano
Other observationpoints
Vanhakartano observation point

30
SWAT : loading estimates & various agriculturalmanagement practices
Inside the fieldIntensity and timing of ploughing
• land use change• drainage• fertilization• etc.
… ”outside the field”• buffer zones• wetlands• sedimentation ponds
SWAT calibration• Discharge in
Vanhakartano
Parameters GWQMN,TIMP, ESCO, SOL_AWC,CN2, SMTMP, SFTMP andSURLAG were chosenfor autocalibration runsmade for daily discharge.

31
SWAT calibration• Hydrology and erosion
SWAT scenarios
Scenario Action
Buffer zones Date for autumn ploughing Fertilization
0-scenario No buffer zones Ploughing 1.9. (spring cereals)and 20.10. (beets)
Average fertilization levelsused in Yläneenjoki region
Scenario 1
21 meter wide buffer zonesalong the main channel for allsub basins and for springcereals and beets(*
Ploughing for both springcereals and beets on
10.12=delayed ploughingdatum.
Maximum fertilizationlevels used in Yläneenjokiregion
Scenario 2
Buffer zones according to scen1 but additional 15 meter widthbuffer zones for spring cerealsand beets
Dates for ploughing same as in0-scen. but normal ploughingrepalced by cultivation
Chicken manure 5000kg/ha for grass crops,other crops according toscen 0. Pig manure 10000kg/ha for grass crops,othercrops, scen 0

32
SWAT scenario, results
Scenario Action
Buffer zones Datum for autumn ploughing Fertilization
P change in % P P
Scenario 1 -19 -8 +17
Scenario 2 -36 -22+25 (chicken)
+27 (pig)
• Effect on annual P-load at the river outlet (change-% compared to 0-scenario)