modeling lean, agile, and leagile supply chain - wilkes university
TRANSCRIPT

.lOURNAL OF BUSINESS LOGISTICS.Vol. 27. No. 1,2006 ' ' - I 57
MODELING LEAN, AGILE, AND LEAGILE SUPPLY CHAIN STRATEGIES
by
Thomas J. GoldshyUniversity of Kentucky
Stanley E. GrifTis
Air Force Institute of Technology >
and
ADthony S. Roath
The University of Oklahoma
The views expressed in this article are those of the authors and do not necessarily reflect theofficial policy or position of the Air Force, the Department of Defense, or the U.S. Government.
INTRODUCTION
An unprecedented number of companies are pursuing lean management and agility to reducecosts, improve customer service, and gain competitive advantage. "Lean thinking" embraces the elim-ination of waste in its various forms. Activities that consume resources but generate no redeemingvalue in the eyes of customers are wastes that must be eliminated in the "lean" paradigm (Womackand Jones 1996). Agility, on the other hand, emphasizes flexible, timely action in response to rapidlychanging demand environments (Christopher and Towill 2002).
Lean management has been the subject of best-selling business books over the past decade andthe focus of many management training programs as managers seek to make the "lean leap." Agilemanagement, meanwhile, has enjoyed its own share of attention as the mantra espoused by manyleading consultancies and technology vendors. Academics have embraced both paradigms as well,with special issues commonly appearing in leading journals dedicated to each philosophy. Beyondindications of passing interest, entire journals are dedicated to the advancement of theory and prac-tice in leanness and agility {e.g.. Lean Construction Journal. International Journal of Agile Man-agement System.i).
Though the "lean" and "agile" philosophies are anchored with relatively simple premises,their complexity becomes apparent during implementation. The very requirements and perfor-mance outcomes associated with the two approaches are often called into question. It appears that

55 GOLDSBY. GRIFFIS, AND ROATH
neither paradigm is particularly well understood - even by companies considering their respectiveadoption and implementation. The ambiguity of the paradigms raises the challenge of determiningwhether one approach or the other would serve as an appropriate basis for adopting a supply chainstralegy. When should a company and perhaps an entire supply chain pursue lean management oragility, and must the question be an either/or proposition? Answering these questions is criticalgiven the significance of aligning the company with iLs up and downstream supply chain tradingpartners support of business strategy and key supply chain objectives.
The purpose of this paper is to further the understanding of lean, agile, and hybrid (or so-called "leagile") supply chain strategies, with particular interest directed toward the dynamics andtrade-offs associated with each of the strategies. This objective is achieved by operational izing thethree strategies in a real-world case setting. Simulation research is used to examine the opera-tionalization of the different strategies and to measure the respective performance associated witheach, identifying the similarities and differences among strategic inputs and outcomes. The appli-cation of simulation to supply chain settings is well established given the stochastic nature of sup-ply chains, where decisions in one area have impact on the others (Bhaskaran 1998; Closs et al. 1998;Disney. Naim, and Towiil 1997; Towill 1996; Waller, Johnson, and Davis 1999). Simulation pro-vides a basis for comparison among alternative strategies and, in tum, enhanced managerial deci-sion-making.
This paper first describes the three supply chain strategies and introduces the research hypothe-ses. The paper then details the research setting and method, reviewing the operationalization ofthe strategies in the simulation models. Finally, the paper presents the results and implications formanagers and researchers.
A REVIEW OF THE STRATEGIES
This section describes the three supply chain strategies of interest: lean, agile, and leagilestrategies. Each is described in tum.
Lean Supply Chains
Womack, Jones, and Roos (1990) introduced the business world to the premise of lean productionin their seminal book The Machine That Changed the World. The book chronicled the operationsfound in the automotive industry, capturing the dramatic differences in approach and ensuing per-formance found among the world's leading automakers. In particular, the book examined how thetechniques employed by Japanese automakers, namely Toyota, outpaced the performance achievedby U.S. and European competitors. Much has been written in the academic and popular business pressabout Toyota's much envied competitive weapon, the Toyota Production System (TPS).
As the architect of TPS, Taiichi Ohno believed that fundamental for any company's success wasthe elimination of waste (or "muda" in Japanese). Ohno (1988) developed a li.st of seven basicforms of muda: 1) defects in production, 2) overproduction, 3) inventories, 4) unnecessary processing.

JOURNAL OF BUSINESS LOGISTICS, Vol. 27. No. 1.2006 \ 59
5) unnecessary movement of people, 6) unnecessary transport of goods, and 7) waiting by employ-ees. Womack and Jones (1996) added to this list with the muda of goods and services that fail to meetthe needs of customers. The term "lean," originally coined by MIT researcher John Krafcik, appliesbecause the lean company uses "less of everything compared with mass production - half thehuman effort in the factory, half the manufacturing space, half the investment in tools, half theengineering hours to develop a new product in half the time" (Womack, Jones, and Roos 1990.p. 13). Womack, Jones, and Roos add that in comparison to a mass production approach, a leancompany calls for far less inventory and incurs fewer defects while providing greater variety inproducts.
The potential offered by lean principles has been embraced by practitioners and researchers alike.An Industry Week survey of U.S. manufacturers in 2004 found that aknost 36% of plants reportedimplementation of lean principles in some fashion (Rio 2(X)4). Beyond manufacturing, lean prin-ciples have also found application in logistics (Disney, Naim, and Towill 1997; Jones. Hines. andRich 1997; Wu 2002), product development and launch (Bowersox, Stank, and Daugherty 1999),purchasing (MacDuffie and Helper 1997), accounting (Ahlstrom and Karlsson 1996), and evenoffice environments (Hyer and Wemmerlov 2002; Tapping and Shuker 2003).
in the follow-up to their seminal book, Womack and Jones (1996) extended their original con-ceptualization of lean operations to the broader enterprise. They contend that the lean enterprise isone that identifies the value inherent in specific products, identifies the value stream for each prod-uct, supports the flow of value, lets the customer pull value ftom the producer, and pursues perfection.It is through this holistic, enterprise-wide approach to lean implementation that the theory extendsbeyond functional strategy to a broader supply chain strategy employed by the company.
It is important to note that while "pull" replenishment is a principle of the lean enterprise, thequestion arises: pulling from where? Womack and Jones speak of the "customer" but ordinarily leansystems do not pull from the end customer. Rather, manufacturing responds to the demand signalemitted by the next-stage customer, which is rarely the end user. This is true even at Toyota, the "epit-ome of lean," where manufacturing reacts to a combination of dealer orders and sales forecastsprovided by Toyota Motor Sales (Goldsby and Martichenko 2005). Despite talks of the ten-daycar, auto manufacturers generally believe that cars must be readily available at dealer lots in antic-ipation of prospective car buyers, for it is believed that U.S. car buyers would rather drive away imme-diately with vehicles that may not perfectly match their criteria than wait ten (or more) days for acar that exactly meets their requirements (Holweg and Miemczyk 2003).
Given the "I want it now" assumption, automakers serving the U.S. market (including Toyota)typically manufacture vehicles in advance on a make-to-stock (MTS) basis and speculate whatwill be sold. This planning-based production method more readily supports level scheduling ofproduction (or "heijunka" in Toyota-speak) and pull-based kanban ordering upstream for parts tosupport manufacturing. Yet, it is clear that demand does not always equal supply - auto dealers mustspeculate regarding fmal consumer demand. Therefore, while lean seeks to minimize waste in itsvarious forms, the planning basis essential for serving end customers with immediate product

60 GOLDSBY. GRIFFIS, AND ROATH
availability means that inventory will t>e produced in advance, similar to mass production. The keydifference between a "lean push" and a "mass production push" is that lean typically relies on a muchshorter forecast horizon (often two weeks or less) and an ability to adapt should production sched-ules need to be changed. The challenge with any push-based system rests ultimately with accuratelyanticipating the quantities, qualities, and allocation of products that will match consumer demand.Improved performance in this area calls for greater focus on the customer. The strategy that embod-ies an effort to respond to end-user demand on a real-time basis is agility, which is described next.
r 'Agile Supply Chains
While lean management emphasizes the pursuit of process efficiency - generating the great-est outcome from the least input through the minimization of wastes, agility refers to effective,flexible accommodation of unique customer demands (Christopher 2000). Naylor, Naim. and Berry(1997) suggest that the agile company is one that "luses] market knowledge and a virtual corpora-tion to exploit profitable opportunities in a volatile marketplace" (p. 108). Instead of relying on spec-ulative notions of what might be demanded, the quantity of demand, and the location of that demand,agility employs a "wait-and-see" approach lo demand, not committing to products until demandbecomes known. Therefore, while lean management typically calls for make-to-stock replenishmentdriven by short-term forecasts, agile supply chains employ make-to-order provisions, producing onlywhat has already been sold or committed in the marketplace.
Key to providing agile response is flexibility throughout the supply chain, ln manufacturing,this would call for the ability to produce in large or small batches, minimizing the "pain" associatedwith setups and product changeovers, often cited as a critical component of lean manufacturing. Agilitymight also call for a flexible workforce with members cross-trained, or able to fulfill a variety of tasksas dictated by the demand situation. Product designs should also reflect an ease of assembly that pro-vides for quick conversion of materials from a raw to completed state. Beyond the capabilities ofthe focal firm, the rest of the supply chain must be responsive as well for agile market accommo-dation. In fact, response-based supply chains are often characterized as "short," with few or nointermediaries. Supply should be located nearby, and information sharing among the parties mustbe open and frequent (Christopber 2(XX); Christopher and Towill 2001).
As is the case with lean management, advocates for agility have established a strong voice inpractice and research. Many companies are realizing that the costs and risks associated with hold-ing speculative inventories are too great. This is particularly true with products that have short lifecycles (such as personal electronics) or erratic demand (like fashion apparel), where the risks of obso-lescence are high. Toyota's supply chain represents a lean strategy in its production of high-qual-ity, affordable automobiles, but there are few. if any. agile manufacturers of automobiles who wouldemploy true make-to-order (MTO) accommodation of customer demand on a large scale. However,other product categories - both complex and simple in product composition - do employ agile,MTO response to the market.

JOURNAL OF BUSINESS LOGISTICS. Vol. 27. No. 1,2006 61
A much heralded example of agile market accommodation is practiced hy Dell in its direct-to-consumer business model. The computer maker holds inventories of component parts such as harddrives, processors, memory storage media, monitors, speakers, and a host of other supplies at eachof the company's three assembly plants in the U.S. Many Dell suppliers are located near the Dellassembly plants, providing parts in a just-in-time manner, some replenishing parts as frequently asevery 90 minutes (Hofftnan 2004). Dell then quickly configures the components into finished desk-top and laptop computers that meet customer-specific orders. The make-to-order approach does callfor the consumer to wait, as opposed to pre-positioned finished goods inventories found in make-to-stock operations. Dell and other agile companies bank on customers' willingness to wait forproducts that meet their specific requirements.
Another example of agility is found at TaylorMade adidas Golf (TMaG) which produces high-pertbnnance golf clubs specific to a customer's needs. TMaG maintains inventories of the variousclub heads, shafts, and grips that compose the finished product. Tliey can readily mix and match m^e-rials and produce a product that meets the customer's needs in terms of club length, weight, angle,and performance attributes, depending upon how they formulate the semi-finished subassembliesand process them (Bowman 2002). Like Dell, TaylorMade's basis for these customized clubs is toproduce only what is demanded when it is demanded to accommodate customer orders perfectly.
In essence, demand pulls supply all the way back to the point of production in agile supply chains.The manufacturer reacts to the demand signal emitted directly from the end customer. The weak-ness of this model is that finished goods inventory cannot be made in advance and, hence, every orderessentially enters into a backorder situation.
Though "lean" and "agile" strategies are often pitted as opposing paradigms, they share acommon objective; meeting customer demands at the least total cost. It is on the nature of thatdemand and the basis of meeting customer demands in which the two approaches differ (Goldsbyand Garcia-Dastugue 2003). Researchers in recent years have suggested that the two approaches neednot necessarily represent opposing points of view. Rather, they may be merged in a variety of waysto create so-called "leagile" approaches.
Leagile Supply Chains - ' '
Naylor, Naim, and Berry (1997) coined the term "leagile" to refer to hybrids of the lean andagile approaches. Buildingon the concept ofthe blended strategy set forth by Naylor etal., Christo-pher and Towill (2001) conceived three distinct hybrids. The first hybrid approach embraces the Pareto(80/20) Rule, recognizing that 80% of a company's revenue is generated from 20% of products. Itis suggested that the fast-moving products that make up the dominant 20% ofthe product line canbe produced in a lean, make-to-stock manner given that demand is relatively stable for these itemsand that efficient replenishment is the appropriate ohjective. Meanwhile, the remaining 80% shouldbe produced in an agile, less anticipatory manner, perhaps even employing make-to-order produc-tion to generate supply for only those items ordered when they are ordered. This strategy is oflenreferred to as a mixed-model approach in manufacturing environmenls (Goldsby and Garcia-

62 GOLDSBY, GRIFFIS, AND ROATH
Dastugue 2003). Il is common for manufacturing facilities to be designed so that some lines are des-ignated for efficient processing of fast-moving product while others are designated as smaJl-batchlines with quick, frequent changeovers in support of the slower-moving items.
The second lean-agile hybrid involves having temporary capacity to meet the needs of peakdemand. Most companies expKrience a hase level of demand over the course of the year. This baselevel of demand can be accommodated in a lean manner, using the company's own resources to employheijtmka (smooth production) principles to maintain highly efficient operations. However, whendemand spikes over the cotirse of peak seasons or heavy promotion periods, outside capacity is pro-cured to meet the heightened demands of these distinct time windows. The procurement of outsidecapacity for coverage in these situations is viewed as the agile component of this hybrid approach.Many companies engage in leagile supply, manufacturing, and logistics to support seasonal demands.
The third hybrid, perhaps the most intriguing of the three, calls for form postponement. Formpostponement refers to delaying the final form of a product until an order is received from customersdictating the quantity and qualities of the goods demanded (Feitzinger and Lee 1997; Zinn andBowersox 1988). This approach works best when goods can be developed from common materi-als into a near-fmished state with fmal touches to the product providing for a diverse assortment thataccommodates distinct customer needs. The premise calls for lean operations in the production ofgeneric, semi-finished product, and agile accommodation in the customization process (Mason-Jones,Naylor. and Towill 2000). It is on the hasis of accommodating diverse needs efficiently that manyrefer to such an approach as "mass customization" (Feitzinger and Lee 1997).
An example of leagility at work is found at Toyota - the very company regarded as the inspi-ration for "lean thinking." Scion, a splinter division of Toyota, is dedicated to serving a distinct seg-ment of today's automotive market: the 18-25 year-old "Generation Y" segment. Toyota caters tothis market through marketing mechanisms that avoid the mainstream media, choosing instead tosponsor local sporting events, concerts, and enthusiast cluhs (Oser 2004). Pervasive in this marketing.strategy is an emphasis on individuality when selecting and owning a car. After logging on toScion's website, Toyota encourages visitors to modify one of the three base Scion models (the xA,xB, and tC), saying, "Build your Scion: We relinquish the power to you." Customization of the vehi-cles involves selection among 40 different "menu" options, including vehicle color, wheels, inte-rior and exterior styling, and stereo system, among others.
The base vehicles are produced in a lean manner in Japan and shipped to the U.S. Some vehi-cles are delivered directly to dealer locations, where they may be used for showroom and demon-stration purposes along with supplying the dealer with a small inventory for general sales.Customization calling for cosmetic features and accessories can often be accommodated at dealerlocations. These accessories range from exterior features like spoilers, custom lighting, and bodygraphics to interior items like steering wheels and sport pedals. The remaining vehicles are main-tained at distributor facilities near U.S. receiving ports, where more substantive customization cantake place. These more substantive, port-installed modifications include stereo installation, side-impactairbags, and performance elements like sport mufflers and stnits/shocks. Therefore, hase vehicles
JOURNAL OF BUSINESS LOGISTICS, Vol. 27. No. 1.2006 63
may be produced in a lean manner, leaving the agile accommodation of customer-specific needs forthe port facility or the dealer.
Whether the customization is small or significant, the point is that the final form of the prod-uct is delayed and ultimately committed at a location near the fmal customer - in the U.S. rather thanin Japan - allowing for cycle time compression, or quicker accommodation of customer-specificdemand (Mason-Jones, Naylor, and Towill 2000). This method of mass customization is some-times referred to as "forward-positioned postponement" (Pagh and Cooper 1998). The approach issimilar to that long employed by Hewlett-Packard in the bundling of power supplies and users' man-uals with computer peripherals for distribution within diverse regional markets, but on a broader,more complicated scale (Davis 1993; Lee and Sasser 1995). This fmal form of ieagility is thatwhich is modeled in the current analysis. / - .. ,.
Given these characterizations of the three supply chain strategies, this research will examinethree broad aspects of supply chain performance. The first aspect examines the expected level of cus-tomer service attainable by each model. A common measure of service is average order-to-shiptime. Tliis metric captures both on-hand inventory availability and backorder response time. Wheninventory of the right product is available at the right place upon order receipt, then order-to-shiptime should be minimal, consisting only of the time required to fill the order from existing inven-tory. The model that is expected to perform best on this measure of performance Is the lean mode!since it is the only one of the three to preposition fmished goods inventory in the distribution chan-nel in advance of customer orders. Hypothesis 1 therefore states:
HI: Customer service, as measured by order-to-ship time, will be best in the lean system.
This hypothesis should hold true as long as sufficient quantities of the right inventory are on-hand at the appropriate stockkeeping locations. If backorders exist in the lean system, considerabletime may be required to acquire supplies and realign production priorities.
A second aspect of interest is inventory. The measure of enterprise-wide inventory across thethree strategies captures the speculative nature of the supply chain. More inventory in various statesof completion in different locations translates into greater inventory holdings and higher inventorycarrying costs. The least speculative strategy of the three models is the agile system. By employingmake-to-order production, only raw materials are acquired in advance of demand. Therefore, the sec-ond hypothesis slates:
H2: Enterprise-wide inventory will be lowest in the agile system.
To add to this hypothesis, the leagile model should prove to be second in order of inventory min-imization, given that it does not build fmished goods in advance but rather engages in postponed pro-duction of fmished goods.
The third aspect of interest is total cost. The enterprise-wide total cost of each strategy is anexploratory dimension of the current analysis. Total cost consists of the focal company's costs ofmaterial acquisition, inbound logistics, manufacturing, and outbound logistics. Inbound and outboundlogistics include the costs of transportation, warehousing, and inventory canying costs. Post hoc

64 GOLDSBY, GRIFFIS, AND ROATH
analysis will compare the models on a tolal cost basis, examining the cost trade-offs that existamong the models in the base case scenario as well as varying cost conditions. The paper contin-ues with a discussion of the base case environment and operationalization of the lean, agile, and leag-ile supply chain strategies.
RESEARCH SETTING AND METHOD
Tlie operational envirorunent chosen to demonstrate the lean, agile, and leagile strategies wasthat of a component manufacturer supplying the heating, ventilation, and air conditioning (H VAC)manufacturing industry. TTie modeled component is a pressure switch used in HVAC equipment todetect pressure levels in the heating and cooling systems of residential and commercial buildings.The component is essentially a generic assembly that can be configured into several distinct switchesby using different calibration settings and mounting brackets. The buyers of the switches (HVACmanufacturers) typically have unique requirements regarding the attributes of the fmal assembly.Within any given family of switches, the manufactured product is ultimately customer specificbecause of the uniqueness of the calibration setting requested and the mounting bracket applied tothe unit.
The case company produces components in the Maquiladora zone of northern Mexico and main-tains two U.S. distribution centers (DCs), one in Southern California and one in Kentucky. A depic-tion of the material flows associated with the current operation appears in Figure 1. The eight partsthat make up the final component assembly are all sourced from U.S. suppliers and flow, for tariff"reasons, through the distribution center in Southern California to the Mexico production facility. OneMexican supplier is used, providing the packaging materials for the finished assemblies and theyare the only supplier to deliver directly to the Mexico production facility. After items are producedin Mexico, all are transported to the Southern California distribution center where they are eitherstored as finished goods inventory or transported to the Kentucky distribution center for storage. TheHVAC manufacturers subsequently draw inventory from the closer DC.

JOURNAL OF BUSINESS LOGISTICS, Vol. 2 7, No. 1.2006
FIGURE 1
65
PHYSICAL FLOWS, CURENT SYSTEM (LEAN)
Supplier [ ^ Manufacturing ^ Distribution Center ^ CustomerHVAC
Finished Good Product Flow
Supplier Materiai Fiow
The base case scenario depicts a !ean system. The company has embraced lean managementtechniques for more than five years. Consistent with the lean description above, the companyemploys a forecast-based planning approach to establish pre-positioned inventory levels at theDCs. When customer orders are placed, the finished goods inventory at the appropriate distributioncenter is checked. If the order can be filled immediately, it is, and the distribution center processesan order to replenish its finished goods inventory. When an order cannot be filled immediately, a buUdsignal is sent to the production facility in Mexico, and the order is backordered until production occursand the replenishing supply is shipped to the requesting distributitm center. No attempt at transshipmentbetween distribution centers is possible because each stockkeeping unit (SKU) at the distributioncenters is unique. Therefore, customers are served from one DC or the other, not txjth.
The materials flows for the agile model are the same as lean on the supplier side of the oper-ation with inbound materials being mixed at the Southern California facility on their way to Mex-ico, but differ with regard to production and outbound distribution. Instead of two outbounddistribution centers, the agile model uses only the Southern California DC. No finished goodsinventory is held at the EXT, and customer orders are communicated directly with the production facil-ity as demand occurs. Upon receipt of the order, parts are inducted into the manufacturing processand finished components are then routed through the Southern California DC and on to the customer.The agile environment is depicted in Figure 2.

66 GOLDSBY, GRIFFIS. AND ROATH
FIGURE 2
PHYSICAL FLOWS, AGILE SYSTEM
Q Supplier r~j Manufacturing ^ Distribution Center ^ Customer
HVACMariif. 5 HVAC
Finished Good Product Flow
Supplier Material Fiow
Mexico
The leagile model, as its name implies, incorporates elements of twth the lean and agile oper-ations. Both DCs are utilized, but they hold no finished goods inventory. Instead, each holds semi-processed, generic assemblies that can be made into any of the SKUs. When a customer order isreceived, light manufacturing tasks are performed to customize the assemblies into final SKUs tofill a specific customer's order. At the same time, the distribution center places an order for replace-ment of the generic assemblies to resupply those used to fill customer orders. In this arrangement,both distribution centers must house production machinery and labor to support the forward-posi-tioned postponement operations.
Model Parameters
Numerous data inputs were necessary to reflect the stochastic nature of the three supply chainstrategies of interest. Direct observation of the manufacturing and logistics operations by theresearchers, interviews with senior management of the Mexico facility, sales forecasts, and demanddata resulted in sufficient input to support the modeling effort. Table 1 outlines the operations para-meters used in the models.

JOURNAL OF BUSINESS LOGISTICS. Vol. 27, No. 1,2006
TABLE 1
MODEL PARAMETERS
Parameter
Raw malcrials order processing
Inbound iransponaiion to Soulhem California DC
Inbound transportation to Mexico (packaging only)
S. California DC to Mexico wiih border cro.ssing
Mexico plant processing time (lean and agile)
Mexico suba.ssembly processing lime (teagile)
S. California/Kentucky DC tmal processing time (leagile)
Mexico to S, Califomia DC with border crossing
Delay time at S. Califomia DC awaiting Kentucky transit
S. Califomia DC to Kentucky DC transponation time
Mean
24 hours
24 hours
12 hours
22. 24,26 hours
2 4, 3.0,4 2 hours
0.6.1.2, 1.8 hours
2.4, 3.0,4.2 hours
22, 24. 26 hours
2.8, 24 hours
4,4, 5 days
Distribution
Exponential
Constant
Constant
Triangular
Triangular
Triangular
Triangular
Triangular
Triangular
Triangular
Supplier parts are dehvered daily to the Southern Califomia DC. This facility serves as aninbound mixing facility for the Mexico plant. Transportation across the U.S./Mexico border alsooccurs daily and takes between 22 and 26 hours, with a most likely time of 24 hours. Upon receiptin Mexico, parts are stored in the warehouse until needed on the production floor. Parts are releasedto the production floor based upon demand and move through production in a time that is triangu-larly distributed with a minimum of 2.4 hours, a mode of 3.0 hours, and a maximum of 4.2 hoursfor the lean and agile production models. Leagile production took place in two distinct steps withsubassembly processing at the Mexico plant with a triangular (0.6,1.2,1.8 hours) distribution andfinal processing at the DCs occurring with another triangular distribution (2.4, 3.0, 4.2 hours).
Upon completion of production, assemblies are shipped to the Southern Califomia DC foreither storage or Immediate delivety to the DC in Kentucky. All assemblies crossing the border doso according to the same distribution as the U.S.-to-Mexico border crossing. Assemblies destinedfor the Kentucky DC are delayed in Southern Califomia for a triangularly distributed f)eriod oftime (minimum = 2, likely = 8, maximum = 24 hours) before continuing on to Kentucky accordingto a triangularly distributed time (minimum = 4 days, likely = 4 days, maximum = 5 days). Assem-blies then enter the warehouses of the respective DC either to immediately fill demand or to awaitcustomer orders. Order wait time is accrued whenever demand is not immediately met due to insuf-ficient inventory on the shelf.
Several modeling assumptions were necessary to bound the research problem. These assump-tions address various design factors of the model and were carefully selected to improve the model'sintemal validity while maintaining external validity. Key model assumptions are shown in Table 2.

68 GOLDSBY. GRIFFIS. AND ROATH
Foremost among these assumptions is the nature of demand under which the three str^egies weretested. Demand is modeled a.s a scaled factor of the case company's annual demand. Mean dailydemand is consistent over the course of the modeled time horizon, reflecting the company's prac-tice of lean management and the smoothing of demand. Despite this "smoothing" effort there wasstill variation in demand as depicted hy a built-in degree of variance (15% standard deviation)around the mean order size. Negative order values were controlled for as all normal distributionscan potentially return a negative value. In addition, variation resulted from the timing of customerorders. The timing of orders generated variation since SKUs are unique to each of the customers.Therefore, even though demand volume might be fairly consistent over time, the composition ofdemand involves disparate SKUs. Each customer's share of the case company's annual sales drovethe frequency with which individual customers placed orders for their particular SKUs.
TABLE 2
KEY MODEL ASSUMPTIONS
Cat^ory Assumption
Stockkeeping units (SKUs)
Finished goods assemblyprocessing
PrtKJuclion resources
Seven different ilems are produced in the models to cater lo seven customers;each customer buys a distinct SKU; SKUs are ba.sed upon a standard platformconfiguration, using ctmimon raw materi^s that are customized in analprocessing.
Finished goods assembly is a Iwo-slep process; the produclion of generic(pre-customized) assemblies is consistent across the three models; customizatiotiis consisteru in the lean and agile models and 25%-43% longer at the DCs inthe leagile model due to increased variability associated with additionalprocess steps.
Production assets do noi have a designed failure rate.
Transportation capacity Transportation capacity was unconstrained fur modeling purposes.
Transit times Transit times are consistent across the models.
Customer demand Customer demand is a scaled factor of actual aggregate demand - due to sizelimitations of the modeling software.
Demand forecasting Annual demand was disaggregaled into daily batches.
Inventory positioning Raw materials feed the Mexico plant approximately daily based ondisaggregated annual demand.
The model as described was developed with Arena simulation software (Rockwell Software2003). resulting in a large and complex model containing hundreds of modeling elements, 80different queues, and 14 different state variables. The output was compared to the actual system beingmodeled to assess model validity. Output from the simulation indicated that the model's performancewas consistent with that of the real system, providing evidence that a vahd model had been developed.

JOURNAL OF BUSINESS LOGISTICS. Vol. 27. No. 1.2006
To determine how many simulation runs were required, a model for each of the three strate-gies was run for thirty replications of one and one-half year each, a period deemed consistent withproduct Ufecycles. Run calculations indicated that 2,684 replications of each model were requiredto achieve sufficient power of analysis at the 0.05 level of significance (per Banks, Carson, andNelson 2000). Additionally, variance reduction techniques suggested by Law and Kelton (2000) werefollowed, including the use of common random numbers.
RESULTS
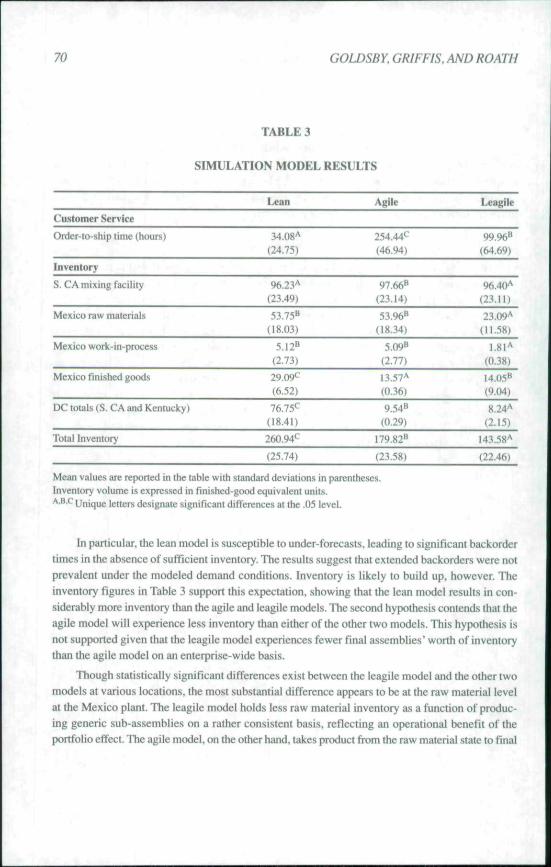
Table 3 provides a summary of the model results on the focal areas of performance. Meanvalues and standard deviations are reported for order-to-ship time and inventory levels across thethree models. Hypothesis 1 implied superior customer service performance, as measured by order-lo-ship time, by the lean model given the presence of pre-positioned inventories at stockkeeping loca-tions. This hypothesis finds support given the considerably lower mean value for the lean model (34,08hours), compared to the leagile (99.96) and agile (254,44) altematives. This implies an ability to sup-port customer demand more quickly with forecast-driven supply. The response-based systemsfound in the leagile and agile models must process materials and semi-finished assemblies intofinished assemblies before filling orders. The results Indicate that leagile and agile models willtake more than 4 and 10.5 days, respectively, to serve the customer under modeled conditions.While the lean model takes just under 1.5 days on average to accomplish the same task, it shouldbe noted that orders are not always filled immediately, demonstrating that the lean model is also sus-ceptible to delay.
70 GOLDSBY. GRIFFIS, AND ROATH
TABLE 3
SIMULATION MODEL RESULTS
Customer Service
Order-io-ship lime (hours)
Invenlury
S. CA mixing facility
Mexico raw materials
Mexico work-in-process
Mexico finished goods
DC totals (S. CA and Kentucky)
Total Inventory
Lean
34.08'^(24.75)
96.23'^(23.49)
53.75B(18.03)
5.I2B(2.73)
29.09^^(6.52)
76,75^'(18,41)
260.94^'
(25.74)
A^ile
254.44^'(46.94)
97.66»(23.14)
53.96^(18.34)
5.09"(2.77)
13.57'^(0.36)
9.54B(0.29)
179.82^
(23.58)
Leagile
99.96^(64.69)
96.40'^(23.11)
23.09^^(11.58)
l.XI'^(0.38)
14.05"(9.04)
8.24'̂(2.15)
143.58'^
(22.46)
Mean values are reported in the table with standard deviations in parentheses.Inventory volume is expressed in finished-good equivalent units.^•^•^ Unique letters designate significant differetices at the .05 level.
In particular, the lean model is susceptible to under-forecasts, leading to significant backordertimes in the absence of sufficient inventory. The results suggest that extended backorders were notprevalent under the modeled demand conditions. Inventory is likely to build up, however. Theinventory figures in Table 3 support this expectation, showing that the lean model results in con-siderably more inventory than the agile and leagile models. The second hypothesis contends that theagile model will experience less inventory than either of the other two models. This hypothesis isnot supported given that the leagile model experiences fewer final assemblies" worth of inventorythan the agile model on an enterprise-wide basis.
Though statistically significant differences exist between the leagile model and the other twomodels at various locations, the most substantial difference appears to be at the raw material levelat the Mexico plant. The leagile model holds less raw material inventory as a function of produc-ing generic sub-assemblies on a rather consistent basis, refiecting an operational benefit of theportfolio effect. The agile model, on the other hand, takes product from the raw material state to final

JOURNAL OF BUSINESS LOGISTICS, Vol. 27, No. 1,2006 . 71
assembly only upon demand. As a result, raw materiaJ inventory will sit for a longer period of time,on average.
The finding that the lean model results in substantially more inventory than either the agile orleagile strategy might be surprising to some given lean management's emphasis on inventory reduc-tion. Yet lean's premise is to rely on forecasts rather than actual dem^id to drive replenishment. Whatmust be kept in mind Is that the lean approach operates with much less inventory than a conventionalmass production approach, which is not presented in the current analysis. The agile and leagileapproaches employ less speculative inventory in various states of completion; hence, the agile andleagile approaches appear to be more lean than the "lean" model depicted in this research.
POST HOC ANALYSIS
In addition to the two stated hypotheses, detailed post hoc analysis of the model output was con-ducted with regard to enterprise-wide costs found in the base case. Additionally, analysis was con-ducted on the cost data to assess the sensitivity of the supply chain strategies to varying costconditions. The enterprise-wide cost characteristics across the three strategies will be examined first.
Base Case Cost Analysis '
Cost data were collected for the base case scenario, supporting the calculation of enterprise-wide costs for the three supply chain strategies. Costs were determined for raw materials acquisi-tion, manufacturing, and inbound and outbound logistics for the product family of interest. Themanufactured cost for an item in this product family totaled $5.50 and the applicable inventorycarrying cost was 15%. A review of the total costs listed at the bottom of Table 4 indicates that thelean approach represents the least-cost alternative among the three strategies. On this basis, thecase company appears to have selected the appropriate strategy for production and distribution ofits products.

72 GOLDSBY. GRIFFIS, AND ROATH
TABLE 4
BASE CASE SCENARIO COST COMPARISONS
Raw Materials Acquisition
Inbound Transpiration
Manufacturing
Interfacility Transportation
Warehousing (space and handling)
Outbound Tran.sportation
Inventory Carrying Cost
Total Cost
Lean
$ 2,472,386
75,000
9.777,002
75.000
456.589
124.800
75,718
$13,056,495
Agile
$ 2,494.996
75.000
9.693,485
75,000
368,780
551.866
25,029
$13,284,156
Leagile
$ 2.491.986
75,000
12.421,226
75.000
555.538
124.800
19.985
$15,763^35
Closer examination of the categorical costs illustrates the strategies' relatively similar costs forraw materials acquisition and identical costs for inbound transportation and interfacility trans-portation. Inbound and interfacility transportation costs arc uniform on the basis of the twice-daily.shuttles that run from the Southern California mixing facility to the Mexico production plant andback in all three scenarios. Manufacturing costs are lowest under the agile approach given thatonly ordered products are manufactured, while the lean model produces volume that is not alwaysdemanded. Manufacturing costs for the leagile strategy are demonstrably higher given that productiontakes place in two distinct phases with the latter stage (i.e., customization of the item) occurring inthe U.S.-based distribution centers, where labor co.sts are higher. This manufacturing premiumalone is enough to make the leagile approach uncompetitive in the current analysis. All other costsremaining unchanged, leagile manufacturing could incur only a 1.7% premium, compared to its cur-rent 27.0% premium, to match the total cost for the agile strategy. Manufacturing costs would actu-ally have to be lower in the leagile operation than in the lean operation in order for the leagilestrategy to match the lean strategy - which again is very unlikely. Warehousing costs that are sub-stantially higher given the additional handling and space required to support the product cus-tomization activity at the two distribution centers further erode the competitiveness of the leagileoption for the relatively low-cost item.
Outbound transportation costs are dramatically higher in the agile environment given thedelivery of expedited, smali-quantity shipments directly to customers. If the company were to useless timely means of ground transportation, it is likely that the agile strategy would prove to be theleast-cost alternative though the longer and more variable order lead time might offset such a costadvantage. OEM customers in the base case scenario seem to reflect this sentiment, preferring to havecertain supply in a short amount of time and a willingness to support the supplier's inventory car-rying costs to enjoy such provision.

JOURNAL OF BUSINESS LOGISTICS, Vol 27. No. 1,2006 73
These observations illustrate the total costs as well as the trade-offs found among the categoricalcosts ill the base ca.se scenario. Additional ana!ysi.s is required to assess the cost dynamics of the strate-gies under varying conditions. The sensitivity analysis in the next section provides further insightregarding the relative strengths and weaknesses of the three stralegies under different assumptionsfor two key variables; product value and inventory canying-cosi percentages.
Sensitivity Analysis
To evaluate the models' sensitivity to varying product values and carrying costs, the results wereevaluated in light of 15 different possible scenarios. The finished goods range in value by ten-foldorders of magnitude and the carrying cost levels range within values commonly cited in the litera-ture (Stock and Lambert 2001). With three finished good values ($10, $100, $1,000) and five car-rying-cost percentages (ranging from 10 to 50%) across the three supply chain strategies, 45 possibledesign points were developed for the analysis.
To assess the resulting enterprise-wide costs associated with these design points, the outputsfrom the three simulation models were referenced and average inventory at the various levels acrossthe enterprise noted. These values were then used to calculate total enterprise-wide costs for eachmodel. These costs appear in Table 5.
TABLE 51
. ENTERPRISE-WroE TOTAL COSTS ' i
FinishedGoods
Value
$10
$100
$1,000
Model
Lean
Agile
Leagile
Lean
Agile
Leagile
Lean
Agile
Leagile
10%
23,094,114
23,261.718
27,969.414
224,3.'i 1.288
222,979341
272.220.193
2.236,923,028
2,220,161,067
2,714,727.984
Carrying Cost Percentages
20%
23,185^25
23,291,917
27.993.558
225,255.047
223,280^97
272,460,738
2.245.953.274
2,223,164,091
2.717,132.538
30%
23^76^36
23J22,n628,017.701
226,158,807
223^80,752
272,701,282
2,254.983,519
2,226,167,115
2,719,537,093
40%
23.367.446
23,352^115
28,04 L844
227,062,566
223,881,208
272,94 L826
2,264,013.764
2,229,170,139
2,72L941,648
50%
23,458.557
23382,514
28.065.987
227.966.326
224,181,664
273,182.370
2.273,044,009
2,232,173.162
2,724,346,203
Bold cells highlight the least-cosi alternative.
Unlike the base case model analysis where there is a 'best' option, there are differences inwhich model performs best as the result of the varying per-unit costs and carrying costs incurred.

74 GOLDSBY, GRIFFIS, AND ROATH
The lowest-cost items, those with a finished goods value of $ 10, experience ihe lowest enterprise-wide cost under a lean system at the lower carrying-cost values (i.e., those below 40%). However,as the carrying costs rise, the agile model begins to outperform the lean model. This is consistentwith expectations of the two systems given that inventorying carrying costs rise as a function of bothcarrying-cost percentages and the value of the inventory. Although lean systems seek to eliminatewaste, they still populate the supply chain with inventory at all stages, albeit less than a mass pro-duction approach.
In contrast, agile supply chains accommodate customers by pulling inventory only upon orderplacement. Raw material inventory incurs less inventory carrying cost than finished goods (Lam-bert and Bennion 1982). In addition, the agile strategy employed a direct-to-customer distributionstrategy once products arrived at the Southern California DC, eliminating the cost associated withthe Kentucky DC. Though the agile model calls for small-quantity shipments of finished goods directto customers, the increased carrying costs found in the lean model begin to offset the total costsavings enjoyed by the lean system. The break-even point between the lean and agile models occursat a carrying-cost percentage of approximately 33.4% for $ 10 items. The medium-priced ($ 100) fm-ished goods and high-priced ($ 1 ,(XX)) goods exhibit results consistent with the observations involv-ing higher carrying-cost percentages given the higher inventory holding costs. The agile model, byholding very little finished goods inventory and only one distribution center, is able to oftset itspremium transportation costs and incurs a lower enterprise-wide total cost across all carrying-costlevels with these goods of higher value.
The leagile model generates the highest enterprise-wide cost across all modeled scenariosdespite incurring the lowest inventory holdings, as noted in the discussion of our second hypothe-sis. Although its order-to-ship time is better than agile, it is worse than lean. From a total cost per-spective, it consistently lags when compared to lean and agile. The reason for this appears to be themanufacturing cost premium associated with producing semi-fmished assemblies and then rein-troducing them to the manufacturing process closer to the customer. In the leagile model, a 25% man-ufacturing cost premium was charged for this two-stage production. Although with careful operationsplanning and development this disadvantage could be significantly reduced, ihe manufacturingpremium would need to be reduced to a 1.7% premium noted in the base case to allow the leagilemodel to be competitive against the lean and agile models on a cost basis. *
' ' IMPLICATIONS AND CONCLUSIONS
This research yields several implications for the manager and the researcher. One primarypurpose for the research was to provide meaningful descriptions of three much debated supplychain strategies. By modeling the strategies, the research effectively characterizes the strategies intangible terms. The simulation method supports the operationalization of the strategies, taking eachfrom hypothetical concept to a functional, working model. Therefore, the valid development ofmodels is important not only in the generation of results but also in the very illustration of thestrategies as they might be practiced. Simulation serves as a valuable tool for the manager to address

JOURNAL OF BUSINESS LOGISTICS, Vol. 27, Na 12006 75
"what if..." questions, allowing one to compare altematives and to understxmd the realities associ-ated with a strategy before committing significant resources.
The operationalization of the models demonstrates the key differences that exist among thestrategies in terms of customer service commitments, forecasting approach, manufacturing philoso-phies, logistics network design, information exchange, inventory planning, and transportation meth-ods, among other strategic and operational decisions. These supply chain strategies therefore reflectnot only the management of physical flows among entities in the supply chain but also the very methodby which products are developed, procured, manufactured, marketed, and sold as well as the rela-tionships among internal and external parties that make the implementation of supply chainstrategy possible.
The research suggests that there is an appropriate time and place for each of the three strate-gies. That is, each strategy holds merit and proves advantageous under specific market and economiccircumstances. The lean strategy demonstrated the best customer service performance, as mea-sured by order-to-ship time. This will hold true so long as demand is smooth and can be predictedwith a relatively high degree of accuracy. This finding is consistent with the observations of Mason-Jones, Naylor, and Towill (2(X)0) and Christopher and Towill (2002). The lean strategy accumulatesmore enteiprise-wide inventory than the other two approaches, with the most demonstrative differencesin the accumulation of finished goods inventory. This, too, is caused by the production of finishedgoods in advance of demand, as opposed to the wait-and-see approach of the other two strategies.Despite this seemingly "non-lean" result, a direct comparison to mass production (not presented aspart of this study) would reveal that the lean approach far outperforms mass production in keepinginventories down.
Post hoc analysis showed that despite lean management's higher inventory investment, the casecompany was correct in its determination to employ a lean strategy given that it not only resultedin the highest service level to customers but also the lowest enterprise-wide costs. Subsequentanalysis suggested that this holds true under conditions involving low-value finished goods ($10)at lower inventory carrying cost percentages (30% and below). However, the agile strategy provedto be the low-cost approach in all other modeled scenarios.
This research also supports the contention of several authors that the lean and agile strategiescan be cranbined into a so-called "lexile" hybrid. The modeled approach reflected the lean pnxiuctionof generic base units that were then positioned closer to customers in the distribution channel forsubsequent customization. While this operationalization of forward-positioned postponement didnot prove to be the least-cost approach for the base case or other modeled scenarios, leagility mightprove advantageous with products and manufacturing scenarios where the manufacturing premiumassociated with disjointed operations is minimal.
There may also be instances similar to the Toyota Scion example, where customers are will-ing to wait a short period of time and perfiaps pay somewhat more for a customized product. In stillother circumstances, delayed processing might actually be welcome in order to allow semi-

76 GOLDSBY. GRIFFIS, AND ROATH
fmished product to cure, age, or ferment, before final processing or packaging. The delayed actionmay therefore be significant or minimal, like that found in package-to-order operations where soldproduct might be distinct in packaging only. Regardless, the combination of lean production and theprovision of postponed tailoring of products in support of mass customization remains an area forfurther exploration and assessment.
Other extensions of the current research are abundant. The cunent analysis focused on the oper-ations of a tier-1 supplier to the HVAC manufacturing industry. The same three strategies could beexamined in a host of other industries and at different levels of the supply chain. In addition, the cur-rent analysis limited its scope to the service rendered by the focal company and the costs incurredby this company. A significant benefit of simulation research is the ability to model entire supplychains to understand better the dynamics that transpire among multiple companies. Therefore,rather than focusing on a single company, researchers might broaden the scope for system-wide impli-cations across the supply chain. The simulation might also be expanded to encompass additional prod-uct families, more accurately reflecting the full array of products manufactured and distributed inthe supply chain. With the incorporation of more products, a more complete analysis of potential ben-efits associated with pooling inventory and measurement ofthe portfolio effect would be feasible.With expanded scope in analysis, however, the researcher must often trade internal validity foradded external validity.
Subsequent research should not necessarily be limited to broadened scope, however, given thatthe models may be refined for added insight within the focal company's operations. Further analy-sis might be directed toward different demand scenarios to a.ssess the robustness of the strategies givenvarious demand characteristics -either more stable or more erratic demand than that reflected in thebase case scenario. The level of analysis might also be honed to focus on the intricate activities tak-ing place within specific facilities in the focal company's domain. These "black boxes" found in thecurrent analysis (e.g., manufacturing) could be examined in much greater detail for the sake of in-depth investigation of optimal work design at the activity level. For example, how are the "blackboxes" altered as a result of improved information flow across the enterprise, and how does improvedinformation flow influence the physical flow of material and goods? Studying such issues in greaterdetail can enhance our understanding of complex interactions among activities in the supply chain.
Beyond further refinement, assessment, and selection of the modeled strategies, there must beconsideration for the implementation of a chosen strategy. Methods aside from simulation willcontinue to be tapped to determine how companies can coordinate activities to achieve supplychain integration and desired outcomes. In fact, simulation can be combined with other empiricalmethods (e.g., survey research) and qualitative methods (e.g., case research) to capture more fullythe complexities of supply chain interactions. The experimental designs of simulation researchshould therefore seek to incorporate the critical behavioral, non-operational elements of supplychain management. The current analysis used established decision-making logic with perfect ratio-nalization of its actions.

JOURNALOF BUSINESS LOGISTICS, Vol. 27, No. 12006 r \ 77
Further research should seek to capture the realities of disparate motives, information asym-metry, channel power, perceived risks and rewards, and a host of other behavioral attributes asso-ciated with industrial dynamics and supply chain management. In addition, research might considerhow supply chains should be designed to respond to dismptions such as those caused by inclementweather, natural disasters, work stoppages, or operations failure. Analyses might also examine pos-sible contingency strategies around management-driven initiatives such as mergers/acquisiticms, prod-uct-line expansions, or the adoption of new technologies like radio frequency identification (RFID).Inclusion of these considerations, while difficult to model, will substantiate understanding of boththe inputs and outcomes associated with coordinated effort, helping convert the supply chain visioninto reality.
NOTES
Ahlstrom, Par and Christer Karlsson (1996), "Change Processes towards Lean Production: TheRole of the Management Accounting System," Internalionaljournal of Operations and ProductionManagement, Vol. 16, No. II,pp. 42-56.
Banks, Jerry, John Carson, and Barry L. Nelson (2000). Discrete-Event Simulation, 3"* Ed. UpperSaddle River. NJ: Prentice Hall.
Bhaskaran. Sita (1998), "Simulation Analysis of a Manufacturing Supply Chain." Decision Sciences,Vol. 29, No. 3, pp. 633-657.
I . " -.
Bowersox, Donald J.. Theodore P. Stank, and Patricia J. Daugherty (1999). "Lean Launch: Man-aging Product Introduction Risk through Response-Based Logistics," Journal of Product Innova-tion Management. Vol. 16. No. 4. pp. 557-568.
Bowman, Robert J. (2002). "TaylorMade Drives Supply-Chain Efficiency with 24-Hour Cluh,"Global Logistics & Supply Chain Strategies. October, pp. 38-43.
Christopher. Martin (20(X)). "The Agile Supply Chain: Competing in Volatile Markets," IndustrialMarketing Management, Vol. 29, No. 1, pp. 37-44.
Christopher, Martin and Denis R. Towill (2(X)2), "Developing Market Specific Supply Chain SxiaXe-pes" The International Journal of Logistics Management.Vol. 13,No. l.pp. 1-14.
Christopher. Martin and Denis R. Towill (2001). "An Integrated Model for the Design of AgileSupply Chains." International Journal of Physical Distribution and Logistics Management. Vol. 31,No. 4. pp. 235-246.

78 GOLDSBY, GRIFFIS, AND ROATH
Closs, David J.. Anthony S. Roath, Thomas J. Goldsby, James A. Eckert. and Stephen Swartz(1998), "An Empirical Comparison of Anticipatory and Response-Based Supply Chains," TheInternational Journal of Logistics Management,Woi. 9, No. 2, pp. 21-34.
Davis, Tom (1993), "Effective Supply ChzmMandigtvasxA" Sloan Management Review,\o\. 34,No. 4, pp. 35-46.
Disney. S.M., M.M. Naim. and D.R. Towill (1997), "Dynamic Simulation Modeling for LeanLogistics," International Journal of Physical Distribution and Logistics Management, Vol. 27.No. 3-4, pp. 174-196.
Feitzinger. Edward and Hau L. Lee (1997), "Mass Customization at Hewlett-Packard: The Powerof Postponement." Hanard Business Review. Vol. 75. No. 1. pp. 116-121.
Goldsby, Thomas J. and Sebastian J. Garcia-Dastugue (2(X)3). "The Manufacturing Flow Man-agement Process." The International Journal of Logistics Management, Vol. 14, No. 2, pp. 33-52.
Goldsby, TTiomas and Robert Martichenko (2005), Lean Six Sigma Logistics: Strategic Developmentto Operational Success, Boca Raton, FL: J. Ross Publishing.
Hoffman. William (2004), "Dell Gets Domestic," Traffic WorW online edition, URL: www.trafficworld.com/news/log/1129O4a.asp,
Holweg, Matthias and Joe Miemczyk (2003). "Delivering the '3-Day Car' - The Strategic Impli-cations for Automotive Logistics Operations," Journal of Purchasing and Supply Management,Vol. 9, No. 2, pp. 63-71.
Hyer. Nancy L. and Urban Wemmerlov (2002). "The Office that Lean Built," HE Solutions, Vol. 34,No. 10, pp. 37-43.
Jones. Daniel T, Peter Hines. and Nick Rich (1997), "Lean Logistics," InlernationalJournal cf Phys-ical Distribution and Logistics Management. Vol. 27. No. 3-4. pp. 153-173.
Lambert. Douglas M. and Mark L. Bennion (1982). "New Channel Strategies for the 1980s,"in Michael G. Harvey and Robert F. Lusch eds.. Marketing Channels: Domestic and InternationalPerspectives, Norman. OK: Center for Economic and Management Research, University ofOklahoma, pp. 124-128.
Law. Averill M. and W. David Kelton (2000), Simulation Modeling and Analysis. 3"* Ed. NewYork: McGraw-Hill.

JOURNAL OF BUSINESS LOGISTICS, Vol. 27. No. 1,2006 n
Lee, Hau L. and Marguerita M. Sasser (1995), "Product Universality and Design for Supply ChainManagement," Production Planning and Control, Vol. 6, No. 3, pp. 270-277.
MacDuifie, John Paul and Susan Helper (1997), "Creating Lean Suppliers: Diffusing Lean Productionthrough the Supply Chain," Ca/i/ornia Wa/wgem^nr/Seviov, Vol. 39, No. 4, pp. 118-15 L
Mason-Jones, Rachel, Ben Naylor, and Denis R. Towil! (2000) "Engineering the Leagile SupplyChain" internationalJournal of Agile Management Systems, Wol. 2, No. 1, pp. 54-61.
Naylor, J. Ben, Mohamed M. Naim, and Danny Berry (1997), "Leagility: Integrating the Lean andAgile Manufacturing Paradigms in the Total Supply Chain," MASTS woridng paper No. 47. Repub-lished in internationalJournal of Production Economics {1999),Wol. 62, pp. 107-118.
Ohno, Taiichi (1988), The Toyota Production System: Beyond Large-Scale Production, Portland, OR:Productivity Press.
Oser, Kris (2004), "Scion Develops Web Tool Bar for Users to Aid in Brand Ad Campaign,"AutoWeek online edition (August 20), URL: www,autoweek.com/news.cms?newsID-100653.
Pagh, Janus D. and Martha C. Cooper (1998), "Supply Chain Postponement and Speculation Strate-gies: How toChoosciheRightStrategy," Journal of Business Logistics,Vol. 19, No. 2, pp. 13-33.
Rio, Ralph (2004), "Successful Execution of a Lean Program." ARC Advisory Group website,URL: http://www.arcweb.com/Newsmag/auto/leanmfg-ins37-111104.asp.
Rockwell Software (2003), Arena 7.01, Selwickly, PA.
Stock, James R. and Douglas M. Lambert (2001), Strategic Logistics Management, 4* Ed. New York,McGraw-Hill. . • • j •
Tapping, Don and Tom Shuker (2(H)3), Value Stream Management for the Lean Office: 8 Steps toPlanning, Mapping, and Sustaining Lean Improvements in Administrative Areas, New York:Productivity Press.
Towill, Denis R. (1996), 'Time Compression and Supply Chain Management - a Guided Tour,"Supply Chain Management, Vol. 1, No. 1, pp 15-27.
Waller, Matt, M. Eric Johnson, and Tom Davis (1999), "Vendor-Managed Inventory in the RetailSupply Chain," Journal of Business Logistics, Vol. 20, No. 1, pp. 183-204.

GOLDSBY, GRIFFIS. AND ROATH
Womack, James P. and David T. Jones (1996), Lean Thinking. New York: Simon & Schuster.
Womack, James P.. David T. Jones, and Daniel Roos (1990), The Machine That Changed the World.New York: Macmillan.
Wu. Yen-Chun Jim (2002), "Effective Lean Logistics Strategy for the Auto Industry." Interna-tionalJournal of Logistics Management. Vo\. 13, No. 2. pp. 19-38.
Zinn, Walter and Donald J. Bowersox {1988), "Planning Physical Distribution with the Principle ofPostponement" Journal of Business Logistics, Vol. 9, No. 2, pp. 117-136.
ACKNOWLEDGMENT
The authors would like to thank Sridhar Gidda, Ohio State MBA 2004 graduate, for his crit-ical role in developing the simulation models in their formative stages. We would also like to thankGregory Gomez Comejo, who provided valuable insight into supply chain operations.
ABOUT THE AUTHORS
Thomas J. G<ddsby (Ph.D. Michigan State Univereity) is an Associate Professor of Supply ChainManagement, Gatton College of Business and Economics, The University of Kentucky. Dr. Goldsbyhas held previous faculty appointments at Iowa State University and The Ohio State University. Hereceived a BS in Business Administration from the University of Evansviile, and an MBA from theUniversity of Kentucky. His research interests focus on logistics customer service, supply chain inte-gration, and the implementation of lean and agile supply chain strategies. He is co-author of a booktitled Lean Six Sigma Logistics: Strategic Development to Operational Success.
Stanley E. GrifTis (Ph.D. The Ohio State University) is an Adjunct Professor in the School ofEngineering and Management at the Air Force Institute of Technology (AFIT) in Dayton, Ohio. Hisresearch interests primarily focus upon logistics performance measurement, lean supply chains,and reverse logistics and its role in customer satisfaction.
Anthony S. Roath (Ph.D. Michigan State University) is an Assistant Professor of Marketingand Supply Chain Management at the Price College of Business, The University of Oklahoma.His research interests include international supply chains, relational management/governance, andlogistics modeling and simulation.
