modeling, mapping, & consequence production center
DESCRIPTION
MODELING, MAPPING, & CONSEQUENCE PRODUCTION CENTERTRANSCRIPT

Hosted by
Black & Veatch Corporation
GEI Consultants, Inc.
Kleinfelder, Inc.
MWH Americas, Inc.
Parsons Water and Infrastructure Inc.
URS Corporation
21st Century Dam Design —
Advances and Adaptations
31st Annual USSD Conference
San Diego, California, April 11-15, 2011
On the CoverArtist's rendition of San Vicente Dam after completion of the dam raise project to increase local storage and provide
a more flexible conveyance system for use during emergencies such as earthquakes that could curtail the region’s
imported water supplies. The existing 220-foot-high dam, owned by the City of San Diego, will be raised by 117
feet to increase reservoir storage capacity by 152,000 acre-feet. The project will be the tallest dam raise in the
United States and tallest roller compacted concrete dam raise in the world.
The information contained in this publication regarding commercial projects or firms may not be used for
advertising or promotional purposes and may not be construed as an endorsement of any product or
from by the United States Society on Dams. USSD accepts no responsibility for the statements made
or the opinions expressed in this publication.
Copyright © 2011 U.S. Society on Dams
Printed in the United States of America
Library of Congress Control Number: 2011924673
ISBN 978-1-884575-52-5
U.S. Society on Dams
1616 Seventeenth Street, #483
Denver, CO 80202
Telephone: 303-628-5430
Fax: 303-628-5431
E-mail: [email protected]
Internet: www.ussdams.org
U.S. Society on Dams
Vision
To be the nation's leading organization of professionals dedicated to advancing the role of dams
for the benefit of society.
Mission — USSD is dedicated to:
• Advancing the knowledge of dam engineering, construction, planning, operation,
performance, rehabilitation, decommissioning, maintenance, security and safety;
• Fostering dam technology for socially, environmentally and financially sustainable water
resources systems;
• Providing public awareness of the role of dams in the management of the nation's water
resources;
• Enhancing practices to meet current and future challenges on dams; and
• Representing the United States as an active member of the International Commission on
Large Dams (ICOLD).

MMC Production Center 1061
MODELING, MAPPING, & CONSEQUENCE PRODUCTION CENTER / ILLUSTRATED GUIDE TO MMC INUNDATION MAPPING GRAPHIC
SPECIFICATION
Joey M. Windham, P.E1 Will Breitkreutz2
ABSTRACT The Modeling, Mapping, and Consequences Production Center (MM&C) is responsible for accomplishing hydraulic modeling, mapping, and consequences analysis for USACE Dams in support of the USACE Dam Safety and Critical Infrastructure Protection and Resilience (CIPR) Programs. The MM&C is managed by the Vicksburg District and supplemented by virtual staff of 100 plus members including technical specialists, hydraulic engineers, economists, and Geographical Information System (GIS) professionals from across USACE. The following are the major initiatives for the MM&C: develop consistent and scalable dam failure models and consequence estimates for Corps dams, develop reliable mapping products to meet multiple objectives and apply, test and advance modeling and GIS mapping capabilities of the USACE. The MM&C formulation was initiated in September 2008. Since conception the MM&C has modeled 200 plus Corps Dams including Flood Control Dams, Navigation Dams, and Hurricane Barriers. The MM&C is continually developing and refining hydraulic modeling methods and consequence estimates techniques by incorporating lessons learned, researching sensitivities of modeling parameters, researching applications of new technologies, and working with Corps of Engineers Research Centers to advance modeling software and refining dam failure modes. In addition to dam failure modeling the MM&C is researching the best methods for modeling levee failures and resulting consequence estimates and inundation mapping, and will begin analysis in 2011.
MISSION STATEMENT The Modeling, Mapping, and Consequences (MMC) Production Center is charged with supporting the U.S. Army Corps of Engineers (USACE) Institute for Water Resources (IWR) Risk Management Center (RMC) in the production of hydrologic and hydraulic (H&H) models, economic consequences models, and flood inundation mapping. These models and maps support a risk-based assessment, prioritization, and management framework for the USACE Critical Infrastructure Protection and Resilience (CIPR), Dam Safety, and Levee Safety programs. The MMC Production Center also provides critical feedback necessary for the RMC to refine and update USACE guidance and policy within the MMC functional areas. As a virtual team, staffed by USACE employees across the United States, the MMC Production Center also plays an important role in developing
1Civil Engineer, United States Army Corps of Engineers, Vicksburg District, 4155 East Clay Street,Vicksburg, MS 39183, [email protected] 2GIS Professional, United States Army Corps of Engineers, Kansas City District, 601 East 12th Street, Kansas City, MO, 39183

1062 21st Century Dam Design — Advances and Adaptations
and maintaining USACE competency in the Hydrology, Hydraulic, and Coastal (HH&C) Community of Practice. CIPR, Dam Safety, and Levee Safety Common Requirements The MMC Production Center’s current efforts primarily support the CIPR, Dam Safety, and Levee Safety programs; however the MMC Production Center also supports USACE districts and external agencies. The CIPR, Dam Safety, and Levee Safety programs share several common requirements for MMC products, including:
• Developing models that support the estimation of inundation areas and consequences for dam and levee failure scenarios and dam operational (non-failure) scenarios over a broad range of loading conditions and project performance.
• Tabulation of consequences that support national infrastructure protection priority setting within a risk-based portfolio management framework.
• Development of mapping products that clearly communicate the location of potential inundation areas, as well as the critical facilities and communities at risk.
The H&H modeling scenarios required by the CIPR, Dam Safety, and Levee Safety programs vary by structure type. For dams, the CIPR and Dam Safety programs have agreed to a standard modeling process that includes five failure scenarios and five operational scenarios. Navigation dam evaluations begin with a screening process to determine the potential to generate immediate consequences from failure. If there is any uncertainty when estimating consequence impacts, modeling of navigation dams is performed following the general procedure for flood control dams. Specific Program Uses for MMC Products Emergency Action Plans (EAPs) for USACE Dams: MMC initial model development and mapping for dams is based on CIPR and Dam Safety program priorities. Prioritization of the Dam Safety portfolio is based on dam safety action classification (DSAC) rating. The MMC Production Center aligns critical schedules for dams with upcoming issue evaluation studies (IESs). The Dam Safety Program’s long-term objective is for each dam in the USACE portfolio to have updated models, inundation maps, and consequences estimates at least every ten years as part of the periodic assessment (PA) process. An EAP is an essential component of a comprehensive emergency management framework for dam owners and operators. An EAP plays a crucial role in preventing the loss of life and property damage that can result from the failure of a high-hazard-potential dam. The EAP identifies potential emergency conditions at a dam and specifies pre-planned actions to be followed to minimize property damage and loss of life. The EAP is essential because it identifies the area below a dam that would be flooded as a result of a failure; establishes communication between the dam owner and state/local emergency responders; provides for notifications and evacuations conducted by police, fire, and rescue teams; and predicts the timing of the impending flood wave. Inundation maps supporting EAPs can assist local emergency response agencies in the development of

MMC Production Center 1063
evacuation plans for local communities This Dam Safety Program requirement is met through a series of geospatial databases and electronic inundation map products developed by the MMC Production Center. Dams Sector Exercise Series (DSES): One of the CIPR Program’s key initiatives is a series of collaborative efforts to address regional disaster resilience issues—the DSES. The DSES utilizes discussion-based activities (e.g., meetings, seminars, and workshops), which are complemented by a number of information gathering, consolidation, and analysis efforts. The purpose of the DSES is to identify, analyze, assess, and enhance regional preparedness and disaster resilience by involving a wide array of public and private stakeholders in multijurisdictional, discussion-based activities. The DSES utilizes a particular scenario for a given region. That scenario serves as the triggering event to analyze impacts, disruptions, critical interdependencies, and stakeholder roles and responsibilities. The discussion-based process is executed under the framework provided by the Homeland Security Exercise and Evaluation Program (HSEEP). The HSEEP framework provides a standardized methodology and terminology for activity design, development, conduct, evaluation, and improvement planning, and can be adapted to a variety of scenarios and events (from natural disasters to terrorist incidents). To date, two major regional efforts involving multiple dams and levee systems, cascading impacts, and critical infrastructure interdependencies have been conducted as part of the DSES program. The MMC Production Center provides technical support to the DSES program by developing and refining new or existing models to evaluate flood damages (including estimation of human health and safety impacts) and estimation of direct economic impacts under the DSES scenario conditions. Consequence-Based Top Screen (CTS): Considering the USACE’s extensive asset portfolio, the USACE needs to develop a clear and consistent strategy to identify those high-consequence facilities whose failure or disruption could potentially lead to the most severe impacts. The USACE must conduct a systematic, portfolio-wide prioritization of those high-consequence facilities. The MMC Production Center provides support to the CIPR Program by developing a series of consequence assessment studies. The results of these studies are used to assist in implementing a Dams CTS methodology within the USACE and identifying critical facilities within the USACE dams and locks portfolio (i.e., high-consequence facilities whose failure or disruption could be potentially associated with the highest possible impact among the portfolio assets). The consequence analysis considers the following potential impacts associated with severe damage or disruption:
• Direct impacts on human health and safety caused by inundation of downstream populated areas
• Economic impacts associated with severe damage or failure of the facility, considering direct damage to downstream inundated areas and direct onsite impacts (asset replacement and business losses)
• Indirect effects associated with the disruption or loss of the critical functions provided by the facility

1064 21st Century Dam Design — Advances and Adaptations
MODELING
Objective The goal of the MMC modeling team is to create geo-referenced unsteady HEC-RAS models capable of producing accurate mapping and consequence analysis across a wide range of scenarios. Most dams modeled as part of the MMC program are located in a typical riverine system which HEC-RAS can accurately model. However some projects with unconfined floodplains and/or located in extremely flat areas may require two-dimensional modeling to produce accurate results. For the latter case FLO-2D is currently being used while other two-dimensional (2-D) modeling tools are being investigated The key products delivered by the MMC Production Center’s modeling team members for CIPR Program and issue evaluation study (IES) projects are as follows:
• Geo-referenced hydraulic model capable of simulating a full range of hydrologic loading and failure and non-failure conditions
• Geo-referenced consequence (HEC-FIA) model • H&H report
Modeling Scenarios Ten modeling scenarios have been developed to support Dam Safety and CIPR. These scearios cover both fail and non-fail for a range of pool elevations, representing minimum and maximum normal operating conditions as well as select extreme loading conditions designed to capture the upper limit of potential downstream consequences . These scenarios are described below. Normal Low Pool: An unsteady flow simulation for non-failure and failure scenarios will be modeled for a normal low water level, the 90-percent exceedance duration pool elevation. Starting reservoir pool will correspond to the 90-percent exceedance duration pool elevation. Reservoir inflow will be a constant inflow hydrograph as required to produce the 90-percent exceedance duration pool under normal gate operations. Gate operation procedures consistent with the latest water control manual will be applied to the hydrograph routing. Consequence analysis (Hydrologic Engineering Center-Flood Impact Analysis [HEC-FIA]) will include damage and loss of life estimates. Normal High Pool: An unsteady flow simulation for non-failure and failure scenarios will be modeled for a normal high water level, the 10-percent exceedance duration pool elevation. Starting reservoir pool will correspond to the 10-percent exceedance duration pool elevation. Reservoir inflow will be a constant inflow hydrograph as required to produce the 10-percent exceedance duration pool under normal gate operations. Gate operation procedures consistent with the latest water control manual will be applied to the hydrograph routing. Consequence analysis (HEC-FIA) will include damage and loss-of-life estimates.

MMC Production Center 1065
Security Scenario: An unsteady flow simulation for non-failure and failure scenarios will be modeled for a 1-percent exceedance duration pool elevation. Starting reservoir pool will correspond to the 10-percent exceedance duration pool elevation. Reservoir inflow will be a scaled PMF or reservoir design flood hydrograph. The scaled hydrograph will be developed by scaling the available hydrograph using trial and error to produce a peak pool equal to the 1-percent pool elevation. Gate operation procedures consistent with the latest water control manual will be applied to the hydrograph routing. Consequence analysis (HEC-FIA) will include damage and loss-of-life estimates. A HEC-FIA simulation for the non-failure condition is not necessary if non-damaging releases result from the Security Scenario. Top of Active Storage. An unsteady flow simulation for non-failure and failure scenarios will be modeled for the top of active storage water level. Starting reservoir pool will correspond to the 10-percent exceedance duration pool elevation. Reservoir inflow will be a scaled PMF or reservoir design flood hydrograph. The scaled hydrograph will be developed by scaling the available hydrograph using trial and error to produce a peak pool equal to the top of active storage elevation. Gate operation procedures from the latest water control manual will be applied to the hydrograph routing. Consequence analysis (HEC-FIA) will include damage and loss-of-life estimates.
Note: Top of active storage is defined as the pool elevation that, if exceeded, would result in significant increase in discharge based on the physical properties of the project and/or operation procedures from the latest water control manual. Maximum High Pool: An unsteady flow simulation for non-failure and failure scenarios will be modeled for the maximum high pool water level. The maximum high pool event will be defined by one of the scenarios below: Scenario 1: If the available inflow design flood hydrograph has been derived in accordance with current policy and guidance, this design flood hydrograph is to be routed through the reservoir according to current operational procedures from the latest water control manual. The peak pool produced by this routing will be designated the maximum high pool elevation at which dam failure is to occur. Scenario 2: If the available inflow design flood hydrograph is not current, the antecedent pool should be increased as required to obtain a peak pool at the top of dam elevation by routing the design flood hydrograph through the reservoir according to current operational procedures from the latest water control manual. If the available design flood overtops the dam and the dam has not been specifically designed for overtopping, overtopping failure shall be assumed at the top of dam (maximum high pool) elevation. Storage and discharge data may have to be extrapolated using available data for the overtopping maximum high pool scenario. Scenario 3: If the project has significant storage and/or discharge capacity, such that raising the antecedent condition in the above scenario cannot reasonably obtain the top of dam, the design flood hydrograph is to be routed through the reservoir with the

1066 21st Century Dam Design — Advances and Adaptations
appropriate antecedent pool level. Gates will be operated according to the current operational procedures from the latest water control manual. The peak pool produced by this routing will be designated the maximum high pool elevation at which dam failure is to occur. The antecedent pool level is to be approved by the modeling project lead.
MAPPING Inundation Mapping The MMC has put considerable effort into developing a standard template for inundation mapping to be used as both an addendum to emergency action plan documentation and as stand-alone map books for use in actual or exercise emergencies. Data generated by the inundation modeling effort is processed using custom GIS (Geographic Information Systems) tools and optimized for use in the mapping process. The mapping standard is a set of processes and templates that are used by the MMC GIS team to produce the dam failure inundation maps, or Inundation Atlases. The goal for the MMC inundation mapping standard is to fit the needs of the majority of users and to provide the ability for stake-holders to take the products and customize them to meet local goals. No single standard will work for every dam in the USACE inventory, the MMC standard aims to get as close as possible. This section will discuss the development of the inundation mapping standard and some specifics about how the maps are developed and then disseminated to stake-holders. Mapping Data Along with the data generated through the modeling effort, a number of national datasets are used to provide context to the modeled inundation. These datasets are gathered from the enterprise data stores of USACE and are combined on the maps. These datasets include such information as police stations, fire stations, hospitals, and electric generation plants. Hydraulic modeling is dependent on geometric datasets including such features as flow paths and cross sections. These datasets are extracted from the model output for use in the MMC inundation maps. While not directly displayed in the maps, the centerline of the model is used to derive the reference miles denoting the distance downstream from the dam and is used as the basis for the display of the arrival time points that will be discussed later. Cross sections are displayed in the map as the source of inundation timing data shown in the time data tables on the map sheets. Hydrograph data, stored as tabular data depicting water surface elevation over time at each cross section is produced by the model. This data is extracted from the model output dataset into a GIS database for use in constructing the profile graph facing pages discussed later. The hydrographs are the bulk of the data output from the MMC hydraulic model.

MMC Production Center 1067
Mapping Templates The inundation atlas is a map book produced in Adobe pdf format and printed on 11” by 17” paper. The sheets are laid out based on the USGS 7.5 minute topographic quadrangle index. The MMC index uses ½ of a USGS quad sheet on each page of the inundation atlas. References to the quad sheet number and name are included on the MMC maps to give users a way to find associated mapping products. The GIS Mapping team uses template files to produce the pieces of the inundation atlas. The process begins with the cover sheet which displays information about the map series including the dam name, owning district, and date of production (Figure 1). A cover sheet is developed for both the aerial and the street map background series. A photo of the study dam is placed in the cover sheet template and then the sheet is exported to pdf format for use in compiling the atlas later.
Figure 1. Cover Sheet
1068 21st Century Dam Design — Advances and Adaptations
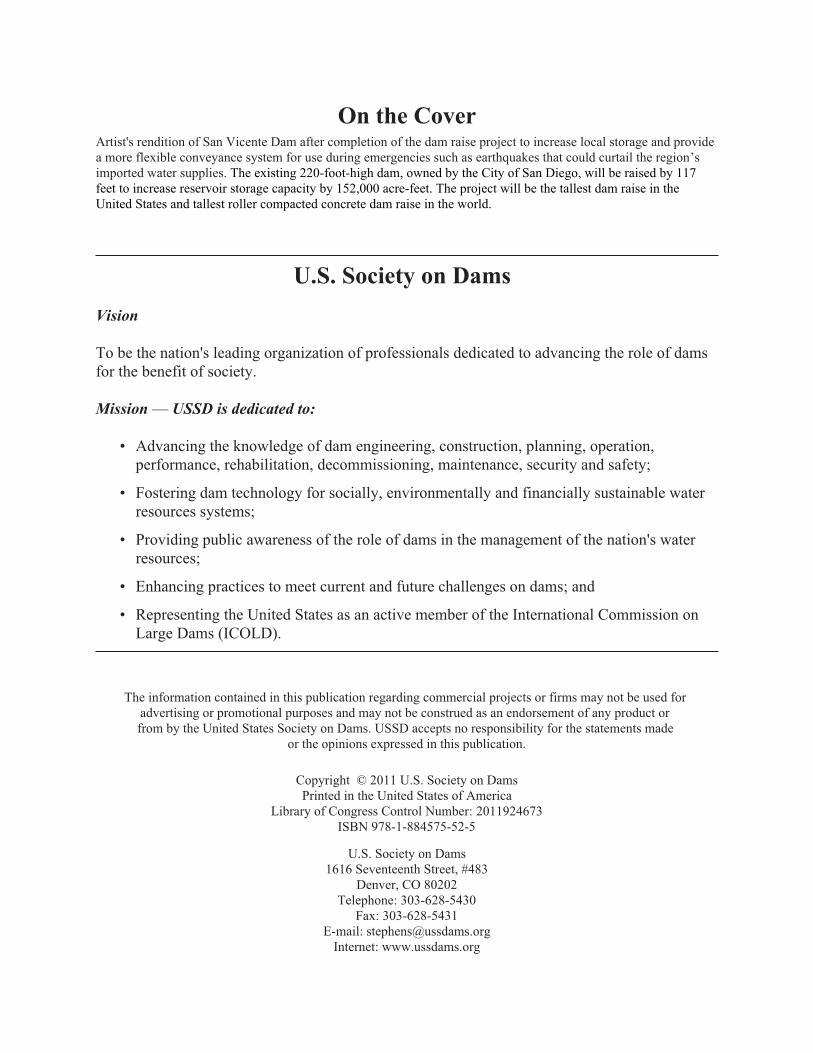
Each inundation atlas opens on a notes page, shown in Figure 2 that contains stock information about the data contained in the maps and a legend that applies to the maps.
Figure 2. Information Page
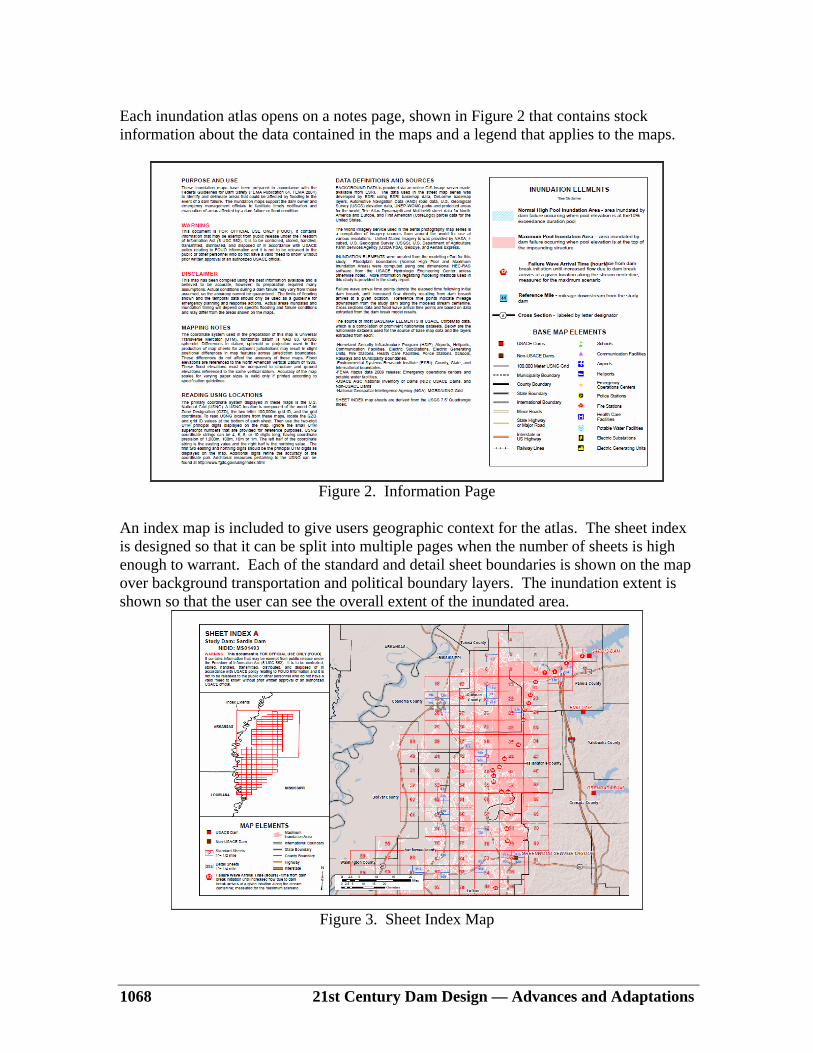
An index map is included to give users geographic context for the atlas. The sheet index is designed so that it can be split into multiple pages when the number of sheets is high enough to warrant. Each of the standard and detail sheet boundaries is shown on the map over background transportation and political boundary layers. The inundation extent is shown so that the user can see the overall extent of the inundated area.
Figure 3. Sheet Index Map

MMC Production Center 1069
As mentioned before, the standard sheets used by the MMC are based on the USGS 7.5 minute quad index. Standard sheets are produced at a scale of 1:31,680, or 1 inch = ½ mile. Match lines indicating the edge of the individual sheet are shown in the maps, providing an indicator of the overlap between adjacent sheets. An example of a standard sheet is shown in Figure 4.
Figure 4. Standard Sheet
The inundation atlases are produced using a street-map background that is designed to be familiar to users that are accustomed to using the popular on-line mapping services provided by companies like Google and Microsoft. The background street map is consumed by the desktop mapping software from on-line services provided by ESRI. Aerial photography is also a popular background data source so the MMC produces the inundation atlases with aerial photography as well. The same ESRI data services are leveraged for nationally available aerial photography. The background data services provide a good context for the maps but more detailed locations of important infrastructures such as police and fire stations was desired. The MMC uses enterprise datasets acquired for the USACE CorpsMap to provide this information.

1070 21st Century Dam Design — Advances and Adaptations
Figure 5. Detail Sheet
In areas of dense population, or complex geography, detail sheets are used to show the area with more detail. The detail sheets are ¼ of the standard sheets and follow the standard sheet in the inundation atlas. Designed to be displayed at a scale of 1:15,840 or 1 inch = ¼ mile, these sheets provide a view of the area at twice the scale of a standard map sheet. All of the symbology used in the standard sheets is preserved in the detail sheets, but inundation timing and elevation information is not displayed. With the variation in backgrounds, care had to be taken when designing the symbology of the layers added to the maps from the modeling output. A single symbology set is important in maintaining continuity throughout all of the mapping products, but it must work with each of the available background datasets. The polygons used to depict the inundated areas use separate symbology settings to distinguish each of the two scenarios shown.

MMC Production Center 1071
Figure 6. Inundation Polygon Symbology The inner polygon depicts the “Normal High” scenario, which is defined as a failure of the dam at the 10% exceedence duration pool for the study dam. The outer polygon is the “Max High” scenario, which is defined as a failure at the highest reasonable pool for the study dam as determined by the modeler. The outer polygon is shown as a transparent solid red color and the internal polygon is shown as a blue and gray hashed polygon shown in Figure 6. This contrast is important especially in areas where the background is variable in tone. Issues such as color blind read-ability have been raised, but issuing the mapping products with the choice of background datasets overcomes the red-green distinguishing problems with aerial photography background mapping products. The standard sheets contain a table of time and elevation data relating to the inundation. This information is calculated by the hydraulic model for the cross section that is shown in the sheet. This cross section is chosen by the mapper as representative of the sheet in question. Information about the arrival time of the flood wave is calculated by looking at the difference between failure and non-failure hydrographs at that location and displayed in the table. The maximum inundation elevation and time from failure is also displayed. The arrival of the flood wave is also depicted on the sheet index map mentioned earlier as the arrival time point layer.

1072 21st Century Dam Design — Advances and Adaptations
Figure 7. Arrival Time Points
This layer is generated by taking the arrival times that are calculated at each of the cross sections and linear referencing the centerline of the modeled reach using that data. Points at a pre-determined interval are then placed along the linear referenced line and displayed in the index map to show the progression of the failure wave downstream from the dam. If opening an inundation atlas on a desk, the map sheets will be on the right side of the binding. On the left or facing page, for the sheets along the modeled centerline will be a page with two graphs. These profile graphs show the progression of the failure wave by displaying the water surface elevation at certain time intervals for the opposite sheet and for a certain extent both up and downstream. The approximate location along the river and elevation are used for the point data shown in the maps to display features such as police and fire stations on the graphs. Cross sections and sheet boundaries are also shown on the graphs to provide the user with a means of translating the information on the graphs to the map sheets.

MMC Production Center 1073
Figure 8. Profile Graph Facing Page
After all of the maps and facing pages are compiled using the data for the study dam, the files are exported to Adobe pdf format and compiled into digital versions of inundation atlases. Four atlases are built, two with the street map background and two with the aerial photography background. Print versions of the atlases include blank pages so that when printed, the sheets lay out correctly. Digital versions eliminate any of the blank pages and are designed for use only on digital platforms. Map Review Once the inundation atlases are produced they are reviewed by the MMC mapping review team to ensure that the standards are being met and that they are cartographically correct. The internal review process allows for as many review iterations as it takes to get the maps right, but normally a single revision is needed to pass the internal review. When the maps have passed the MMC internal review process, they move onto a review by the district that owns the dam. The district receives the maps and the modeling information and provides comments back to the MMC. These comments may be addressed in the mapping products for a final revision, or applied more broadly to the mapping standard as a whole depending on the scope of the comment. Mapping Product Dissemination MMC paper inundation atlases are only one of the ways that the results of inundation modeling are disseminated to the user base. PDF versions of the atlases are provided to the districts for use in printing or supplying maps to emergency response organizations. Google kmz files are also produced with the data for use in Google Earth software available free to anyone.

1074 21st Century Dam Design — Advances and Adaptations
The GIS layers used in the maps are compiled into a single database that is used to display the information over web mapping applications available internally to USACE users. Release of the data to external entities is authorized only on a need-to-know basis as determined by the district that is responsible for the study dam.
CONSEQUENCE ESTIMATION Consequence Analysis In a process that occurs parallel to the development of MMC inundation atlases, economists within USACE take the hydraulic modeling output and develop consequence models that estimate both economic losses and life loss due to dam failure. Direct consequence models are developed using HEC-FIA software and indirect consequences are compiled by the economists. The USACE Hydrologic Engineering Center (HEC) is responsible for developing hydrologic and hydraulic modeling products for USACE use. HEC also has developed a consequence model called Flow Impact Analysis (FIA), designed to consume the hydraulic output of their RAS software along with Census data pulled from the FEMA HAZUS datasets to calculate economic and life loss statistics. Many assumptions are made when doing economic loss calculations. The FIA software uses structure information stored in Census block data to create a structure inventory of points within the impacted area. The structures are given populations depending on the statistics from the Census. The default location of the structures is an even distribution with the census block. The modeler can adjust these locations based on aerial photo-graphy or other better information sources to increase the accuracy of the estimations. Economic losses are calculated based on the depth of flooding at individual structures. Loss curves have been developed over years of research for each kind of structure. Variations in construction types are taken into account. The loss values are then aggregated based on pre-defined impact areas, usually counties and reported at that level. Life loss is calculated by FIA based on a modified version of the LifeSim model developed by David Bowles of Utah State University. The version of the model used in FIA makes simplified assumptions about the evacuation of residents of the structures. Each structure is given a population by the model based on Census data. Evacuation curves calculating the percentage of people that will evacuate over time have been developed using empirical data. These curves provide the probability that an individual will leave a structure and head to dry ground or stay in the structure and evacuate vertically within the structure. Survival curves have also been developed for many structure types based on depth as well as for those who do evacuate but are caught by the inundation. Life loss is calculated for the populations of each of the structures and then aggregated to the same level as the economic losses. The MMC economists refine the models to provide the best possible information, but as with any consequence estimation effort, there is an inherent level of uncertainty.