modeling of adsorption isotherms of phenol and...
TRANSCRIPT
A
2finapt(iw©
K
1
ipiawmho
etc
0d
Journal of Hazardous Materials 147 (2007) 401–411
Modeling of adsorption isotherms of phenol and chlorophenolsonto granular activated carbon
Part II. Models with more than two parameters
Oualid Hamdaoui a,∗, Emmanuel Naffrechoux b
a Department of Process Engineering, Faculty of Engineering, University of Annaba, P.O. Box 12, 23000 Annaba, Algeriab Laboratoire de Chimie Moleculaire et Environnement, ESIGEC, Universite de Savoie, 73376 Le Bourget du Lac Cedex, France
Received 28 August 2006; received in revised form 8 January 2007; accepted 8 January 2007Available online 12 January 2007
bstract
The adsorption equilibrium isotherms of five phenolic compounds, phenol, 2-chlorophenol, 4-chlorophenol, 2,4-dichlorophenol, and,4,6-trichlorophenol, from aqueous solutions onto granular activated carbon were studied and modeled. In order to determine the best-t isotherm, the experimental equilibrium data were analyzed using thirteen adsorption isotherm models with more than two-parameter;ine three-parameter equations – the Redlich–Peterson, Sips, Langmuir–Freundlich, Fritz–Schlunder, Radke–Prasnitz (three models), Toth,nd Jossens isotherms – three four-parameter equation – the Weber–van Vliet, Fritz–Schlunder, and Baudu isotherms – and one five-arameter equation – the Fritz–Schlunder isotherm. The results reveal that the adsorption isotherm models fitted the experimental data in
he order: Baudu (four-parameter) > Langmuir–Freundlich (three-parameter) > Sips (three-parameter) > Fritz–Schlunder (five-parameter) > Toththree-parameter) > Fritz–Schlunder (four-parameter) > Redlich–Peterson (three-parameter). The influence of solution pH on the adsorptionsotherms of 4-CP was investigated. It was shown that the solution pH has not an effect on the adsorption isotherms for pH < pKa. The pH athich the uptake decreased was found to be dependent on the adsorptive pKa and the pHPZC.2007 Elsevier B.V. All rights reserved.ictt
omadbae
eywords: Modeling; Adsorption; Isotherms; Phenol; Chlorophenols; GAC
. Introduction
Activated carbon, the most important commercial adsorbent,s a carbonaceous material with a large surface area and highorosity. Adsorption of organic solutes from the aqueous phases a very important application of activated carbons. This coverswide spectrum of systems such as drinking water and wasteater treatments, and applications in the food, beverage, phar-aceutical and chemical industries. Activated carbon adsorption
as been cited by the US Environmental Protection Agency asne of the best available environmental control technologies [1].
Adsorption of phenols on carbons is an important subject
specially because of ecological aspects. Phenol and its deriva-ives belong to a group of ordinary contaminants of water. Theyause an unpleasant taste and odor even at low concentrations∗ Corresponding author. Tel.: +213 71 59 85 09; fax: +213 38 87 65 60.E-mail address: [email protected] (O. Hamdaoui).
tliestt
304-3894/$ – see front matter © 2007 Elsevier B.V. All rights reserved.oi:10.1016/j.jhazmat.2007.01.023
n water. Most of these compounds are recognized as toxicarcinogens. The European Union and US Environmental Pro-ection Agency have listed phenol and phenolic compounds onhe priority-pollutants list.
Adsorption equilibria information is the most important piecef information in understanding an adsorption process. Noatter how many components are present in the system, the
dsorption equilibria of pure components are the essential ingre-ient for the understanding of how much those components cane accommodated by a solid adsorbent. The description of thedsorption isotherms onto activated carbon can be based on mod-ls with two, three, even with more parameters [2–6]. Despitehe progress in computer simulations, it is still necessary toook for the elegant analytical formulas describing adsorptionsotherms and being suitable for a wide range of scientist and
ngineers. Additionally, the two-parameter models habituallyhowed a limit of application. Moreover, the models with morehan two parameters were developed to mitigate deficiencies ofhe simple models with two-parameter [2,3,5,6].
402 O. Hamdaoui, E. Naffrechoux / Journal of Hazardous Materials 147 (2007) 401–411
Nomenclature
A the Redlich–Peterson isotherm constant (L g−1)and the Fritz–Schlunder model parameter
b Langmuir constant related to the free energy ofadsorption (L mg−1)
b0 the Baudu isotherm equilibrium constantB the Redlich–Peterson isotherm parameter
(L mg−1)β and the Fritz–Schlunder modelparameter
Ce the equilibrium concentration of the solute in thebulk solution (mg L−1)
F the Jossens equation parameterGAC granular activated carbonH the Jossens equation parameterKF Freundlich constant indicative of the relative
adsorption capacity of the adsorbent(mg1−1/n L1/n g−1)
KFS the Fritz–Schlunder equilibrium constant(L mg−1)
KLF the equilibrium constant for a heterogeneous solidKRPI the Radke–Prausnitz-I equilibrium constantKRPII the Radke–Prausnitz-II equilibrium constantKRPIII the Radke–Prausnitz-III equilibrium constantKS the Sips equilibrium constant (L mg−1)m
KT the Toth equilibrium constantK1, K2 the Fritz–Schlunder equation parametermFS the Fritz–Schlunder model exponentmLF the heterogeneity parameter, lies between 0 and 1mRPI the Radke–Prausnitz-I model exponentmRPII the Radke–Prausnitz-II model exponentmRPIII the Radke–Prausnitz-III model exponentmS the Sips model exponentmT the Toth model exponentm1, m2 the Fritz–Schlunder equation exponentsn Freundlich constant indicative of the intensity of
the adsorptionN the number of experimental pointsp the Jossens equation parameterP1 parameter of the Weber–van Vliet equationP2 parameter of the Weber–van Vliet equationP3 parameter of the Weber–van Vliet equationP4 parameter of the Weber–van Vliet equationqe the amount of solute adsorbed per unit weight of
adsorbent (mg g−1)qmFS the Fritz–Schlunder maximum adsorption capac-
ity (mg g−1)qmFS5 the maximum adsorption capacity (mg g−1) in the
five-parameter Fritz–Schlunder modelqmL the Langmuir maximum adsorption capacity
(mg g−1)qmLF the Langmuir–Freundlich maximum adsorption
capacity (mg g−1)qmRPI the Radke–Prausnitz-I maximum adsorption
capacity (mg g−1)
qmRPII the Radke–Prausnitz-II maximum adsorptioncapacity (mg g−1)
qmRPIII the Radke–Prausnitz-III maximum adsorptioncapacity (mg g−1)
qmS the Sips maximum adsorption capacity (mg g−1)qmT the Toth maximum adsorption capacity (mg g−1)qm0 the maximum adsorption capacity (mg g−1) in the
Baudu isotherm equationr coefficient of correlationx the Baudu isotherm parametery the Baudu isotherm parameter
Greek lettersα exponent in the Fritz–Schlunder model that lies
between 0 and 1β exponent in the Redlich–Peterson and
iPR–Feptsw
2
2
p
2
idtp
twse2s
r
Fritz–Schlunder isotherms that lies between 0and 1
For the second part of this study, thirteen adsorptionsotherms, nine three-parameter equations – the Redlich–eterson, Sips, Langmuir–Freundlich, Fritz–Schlunder,adke–Prasnitz (three models), Toth, and Jossens isotherms
three four-parameter equation – the Weber–van Vliet,ritz–Schlunder, and Baudu isotherms – and one five-parameterquation – the Fritz–Schlunder isotherm – were examined forhenol and chlorophenols adsorption onto GAC for their abilityo model the equilibrium adsorption data. The influence ofolution pH on the adsorption isotherms of 4-CP onto GACas investigated.
. Materials and methods
.1. Adsorbent and adsorbates
The adsorbent and adsorbates used were presented in the firstart of this work.
.2. Equilibrium isotherms
The procedure for the determination of the adsorptionsotherms of the five phenolic compounds onto GAC wasescribed in the first part of this study. The solution pH forhe five phenolic compounds was 5.5. At this pH all the testedhenolic compounds are in their protonated forms.
For the study of the effect of pH on equilibrium data, adsorp-ion isotherms experiments were carried out with accuratelyeighted amount of GAC (0.05–1 g L−1) that were continuously
tirred at 400 rpm with 90 mL of 100 mg L−1 of 4-CP at differ-
nt pH (2.3, 5.5, 8, and 11). The temperature was controlled at1 ◦C. Agitation was provided for 4 days, which is more thanufficient time to reach equilibrium.All experiments were conducted in triplicate, and sometimesepeated again and the mean values have been reported.
of Ha
2
mwshabrtptTh
3
3
3
itoa
q
watca
r
q
wa
btt(
A
3
aut
c
q
weSl
3
q
wq
(Ki
3
q
weFtt
3
a
q
q
q
wq
cteR
3
O. Hamdaoui, E. Naffrechoux / Journal
.3. Boehm titration
The surface functional groups containing oxygen were deter-ined according to Boehm titration [7]. A 1 g carbon sampleas placed in 50 mL of 0.1 N of the following solutions:
odium hydroxide, sodium carbonate, sodium bicarbonate, andydrochloric acid. The vials were sealed and agitated for 24 hnd then filtered; 5 ml of the filtrate was pipetted, and the excessase or acid was titrated with HCl (0.1 N) or NaOH (0.1 N),espectively. The number of acidic sites was determined underhe assumption that NaOH neutralizes carboxylic, lactonic, andhenolic groups; and Na2CO3 neutralizes carboxylic and lac-onic groups; and NaHCO3 neutralizes only carboxylic groups.he number of basic sites was calculated from the amount ofydrochloric acid that reacted with the carbon.
. Theoretical background
.1. Three-parameter models
.1.1. Redlich–Peterson modelThe Redlich–Peterson [8] isotherm is an empirical isotherm
ncorporating three parameters. It combines elements from bothhe Langmuir and Freundlich equations, and the mechanismf adsorption is a hybrid and does not follow ideal monolayerdsorption:
e = ACe
1 + BCβe
(1)
here A is the Redlich–Peterson isotherm constant (L g−1), B islso a constant having unit of (L mg−1)β, and β is an exponenthat lies between 0 and 1. Ce is the equilibrium liquid-phase con-entration of the adsorbate (mg L−1) and qe is the equilibriumdsorbate loading onto the adsorbent (mg g−1).
At high liquid-phase concentrations of the adsorbate, Eq. (1)educes to the Freundlich equation, i.e.:
e = A
BC1−β
e (2)
here A/B and (1 − β) present, respectively, the parameters KFnd 1/n of the Freundlich model.
For β = 1, Eq. (1) reduces to the Langmuir equation, with= B is the Langmuir adsorption constant (L mg−1) related to
he energy of adsorption and A = bqmL , where qmL signifieshe Langmuir maximum adsorption capacity of the adsorbentmg g−1).
For β = 0, Eq. (1) reduces to the Henry’s equation, with/(1 + B) is the Henry’s constant.
.1.2. Sips model
Recognizing the problem of the continuing increase in thedsorbed amount with an increase in concentration in the Fre-ndlich equation, Sips [9] proposed an equation similar in formo the Freundlich equation, but it has a finite limit when the
els
zardous Materials 147 (2007) 401–411 403
oncentration is sufficiently high:
e = qmSKSCmSe
1 + KSCmSe
(3)
here qe is the adsorbed amount at equilibrium (mg g−1), Ce thequilibrium concentration of the adsorbate (mg L−1), qmS theips maximum adsorption capacity (mg g−1), KS the Sips equi-
ibrium constant (L mg−1)m, and mS is the Sips model exponent.
.1.3. Langmuir–Freundlich modelThe Langmuir–Freundlich equation is given by [9]:
e = qmLF (KLFCe)mLF
1 + (KLFCe)mLF(4)
here qe is the adsorbed amount at equilibrium (mg g−1),mLF the Langmuir–Freundlich maximum adsorption capacitymg g−1), Ce the adsorbate equilibrium concentration (mg L−1),LF the equilibrium constant for a heterogeneous solid, and mLF
s the heterogeneity parameter, lies between 0 and 1.
.1.4. Fritz–Schlunder modelThe Fritz–Schlunder [10] equation has the following form:
e = qmFSKFSCe
1 + qmCmFSe
(5)
here qe is the adsorbed amount at equilibrium (mg g−1), Ce thequilibrium concentration of the adsorbate (mg L−1), qmFS theritz–Schlunder maximum adsorption capacity (mg g−1), KFS
he Fritz–Schlunder equilibrium constant (L mg−1), and mFS ishe Fritz–Schlunder model exponent.
.1.5. Radke–Prausnitz modelsThe three Radke–Prausnitz [11] isotherms can be represented
s
e = qmRPIKRPICe
(1 + KRPICe)mRPI(6)
e = qmRPIIKRPIICe
1 + KRPIICmRPIIe
(7)
e = qmRPIIIKRPIIICmRPIIIe
1 + KRPIIICmRPIII−1e
(8)
here qe is the adsorbed amount at equilibrium (mg g−1), qmRPI ,mRPII , and qmRPIII are the Radke–Prausnitz maximum adsorptionapacities (mg g−1), Ce the adsorbate equilibrium concentra-ion (mg L−1), KRPI, KRPII, and KRPIII are the Radke–Prausnitzquilibrium constants, and mRPI, mRPII, and mRPIII are theadke–Prausnitz models exponents.
.1.6. Toth model
Toth [12] has modified the Langmuir equation to reduce therror between experimental data and predicted values of equi-ibrium adsorption data. The application of his equation is bestuited to multilayer adsorption similar to BET isotherms which
4 of Ha
iv
q
wtte
3
osna
C
wtFd
3
3
w
C
wtP
3
tI
q
wtBF
r
q
wa
w
tn(
3
macb
b
q
Ga
i
q
wttl
u
q
3
3
el
q
wttK
4
4
na
04 O. Hamdaoui, E. Naffrechoux / Journal
s a special type of Langmuir isotherm and has very restrictivealidity [3]. The Toth correlation is given as
e = qmTCe
(1/KT + CmTe )1/mT
(9)
here qe is the adsorbed amount at equilibrium (mg g−1), Cehe equilibrium concentration of the adsorbate (mg L−1), qmT
he Toth maximum adsorption capacity (mg g−1), KT the Tothquilibrium constant, and mT is the Toth model exponent.
.1.7. Jossens modelThe model of Jossens et al. [13] is based on a distribution
f the energy of interactions adsorbate–adsorbent on adsorptionites. It considers that the activated carbon surface is heteroge-eous, with respect to the interactions which it engages with thedsorbate:
e = qe
Hexp(Fqp
e) (10)
here qe is the adsorbed amount at equilibrium (mg g−1), Cehe equilibrium concentration of the adsorbate (mg L−1), and H,, and p are the parameters of the equation of Jossens. H and Fepend only on temperature.
This equation can be reduced to Henry’s law at low capacities.
.2. Four-parameter models
.2.1. Weber–van Vliet modelWeber and van Vliet [14] have proposed an empirical relation
ith four parameters to describe equilibrium data:
e = P1q(P2q
P3e +P4)e (11)
here qe is the adsorbed amount at equilibrium (mg g−1), Cehe equilibrium concentration of the adsorbate (mg L−1), and1, P2, P3, and P4 are the isotherm parameters.
.2.2. Fritz–Schlunder modelAnother four-parameter equation of Langmuir–Freundlich
ype was developed empirically by Fritz and Schlunder [10].t is expressed by the equation:
e = ACαe
1 + BCβe
with α and β ≤ 1 (12)
here qe is the adsorbed amount at equilibrium (mg g−1), Cehe equilibrium concentration of the adsorbate (mg L−1), A and
are the Fritz–Schlunder parameters, and α and β are theritz–Schlunder equation exponents.
At high liquid-phase concentrations of the adsorbate, Eq. (12)educes to the Freundlich equation, i.e.:
e = A
BCα−β
e (13)
here A/B and (α − �) present, respectively, the parameters KFnd 1/n of the Freundlich model.
For α = β = 1, Eq. (12) reduces to the Langmuir equation,ith b = B is the Langmuir adsorption constant (L mg−1) related
tm
w
zardous Materials 147 (2007) 401–411
o the energy of adsorption and A = bqmL , where qmL sig-ifies the monolayer adsorption capacity of the adsorbentmg g−1).
.2.3. Baudu modelBaudu [15] has remarked that the calculation of the Lang-
uir coefficients, b and qmL , by the measurement of tangentst different equilibrium concentrations shows that they are notonstants in a broad concentration range. Their variations cane written in the following forms:
= b0Cxe (14)
mL = qm0Cye (15)
raphical study of ln b = f(ln Ce) and ln qmL = f (ln Ce) givesccess to b0, qm0, x, and y.
Baudu has transformed the Langmuir equation to the follow-ng expression:
e = qm0b0C(1+x+y)e
1 + b0C(1+x)e
with (1 + x + y) and (1 + x) < 1
(16)
here qe is the adsorbed amount at equilibrium (mg g−1), Cehe equilibrium concentration of the adsorbate (mg L−1), qm0he Baudu maximum adsorption capacity (mg g−1), b0 the equi-ibrium constant, and x and y are the Baudu parameters.
For lower surface coverage, Eq. (16) reduces to the Fre-ndlich equation, i.e.:
e = qm0b0C(1+x+y)e
1 + b0(17)
.3. Five-parameter models
.3.1. Fritz–Schlunder modelFritz and Schlunder [10] have proposed a five-parameter
mpirical expression which can represent a broad field of equi-ibrium data:
e = qmFS5K1Cm1e
1 + K2Cm2e
with m1 and m2 ≤ 1 (18)
here qe is the adsorbed amount at equilibrium (mg g−1), Cehe equilibrium concentration of the adsorbate (mg L−1), qmFS5
he Fritz–Schlunder maximum adsorption capacity (mg g−1) and1, K2, m1, and m2 are the Fritz–Schlunder parameters.
. Results and discussion
.1. Equilibrium isotherms modeling
The adsorption equilibrium data for phenol and chlorophe-ols onto GAC were analyzed by non-linear curve fittingnalysis, using Microcal(TM) Origin® software, to fit the
hree-parameter, four-parameter, and five-parameter isothermodels.The experimental values of qe and Ce are initially treated
ith the models in order to determine the equations parameters
of Hazardous Materials 147 (2007) 401–411 405
aTrcd(tu
A
w
4
PPttai
ptmraTtctaiiit
Fn
Fn
Ke
cTtLSoea
ocatasth
O. Hamdaoui, E. Naffrechoux / Journal
nd the isotherms are reconstituted using the determined values.he isotherm curves showed the superposition of experimental
esults (points) and the theoretical calculated points (lines). Theorrelation coefficients (r) showed the fit between experimentalata and isotherm equations while the average percentage errorsAPE) calculated according to Eq. (19) indicated the fit betweenhe experimental and predicted values of adsorption capacitysed for plotting isotherm curves:
PE (%) =∑N
i=1|((qe)experimental − (qe)predicted)/(qe)experimental|N
× 100 (19)
here N is the number of experimental data.
.1.1. Three-parameter modelsThe abilities of the three-parameter equations, Redlich–
eterson, Sips, Langmuir–Freundlich, Fritz–Schlunder, Radke–rausnitz (three models), Toth, and Jossens isotherms, to model
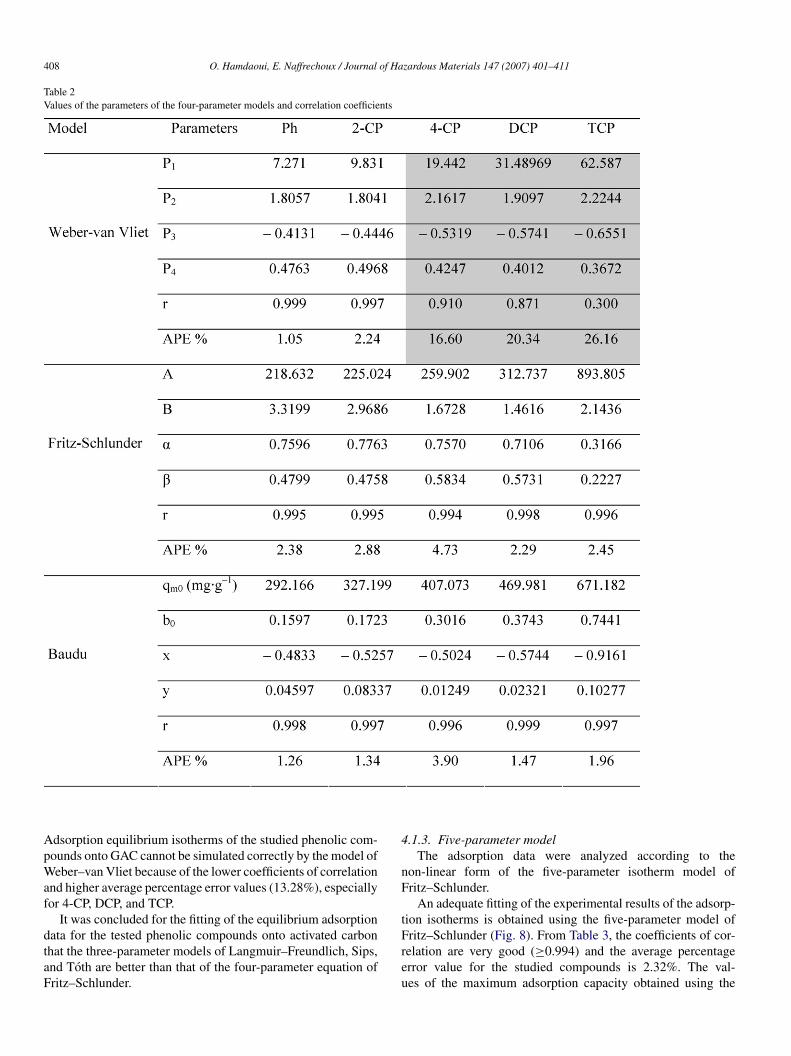
he equilibrium adsorption data were examined. Table 1 showshe isotherms parameters obtained using the non-linear fittingnalysis. The worse fits of the equilibrium isotherms are givenn grey frames (Table 1).
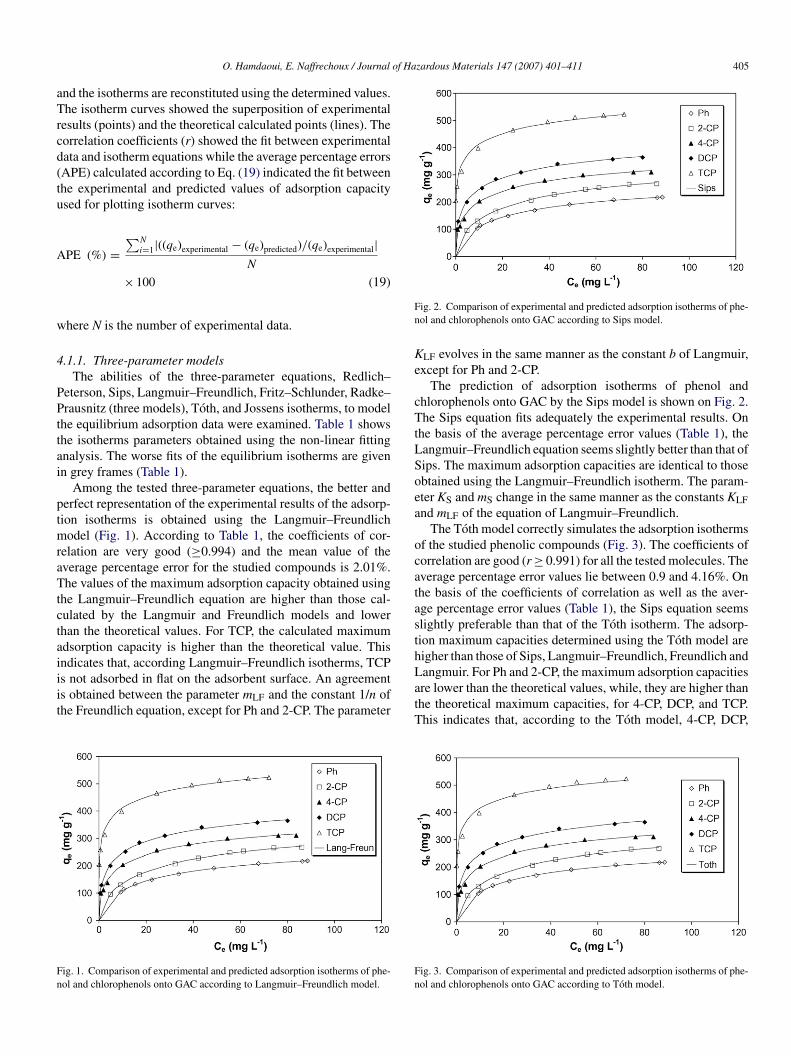
Among the tested three-parameter equations, the better anderfect representation of the experimental results of the adsorp-ion isotherms is obtained using the Langmuir–Freundlich
odel (Fig. 1). According to Table 1, the coefficients of cor-elation are very good (≥0.994) and the mean value of theverage percentage error for the studied compounds is 2.01%.he values of the maximum adsorption capacity obtained using
he Langmuir–Freundlich equation are higher than those cal-ulated by the Langmuir and Freundlich models and lowerhan the theoretical values. For TCP, the calculated maximumdsorption capacity is higher than the theoretical value. This
ndicates that, according Langmuir–Freundlich isotherms, TCPs not adsorbed in flat on the adsorbent surface. An agreements obtained between the parameter mLF and the constant 1/n ofhe Freundlich equation, except for Ph and 2-CP. The parameterig. 1. Comparison of experimental and predicted adsorption isotherms of phe-ol and chlorophenols onto GAC according to Langmuir–Freundlich model.
LatT
Fn
ig. 2. Comparison of experimental and predicted adsorption isotherms of phe-ol and chlorophenols onto GAC according to Sips model.
LF evolves in the same manner as the constant b of Langmuir,xcept for Ph and 2-CP.
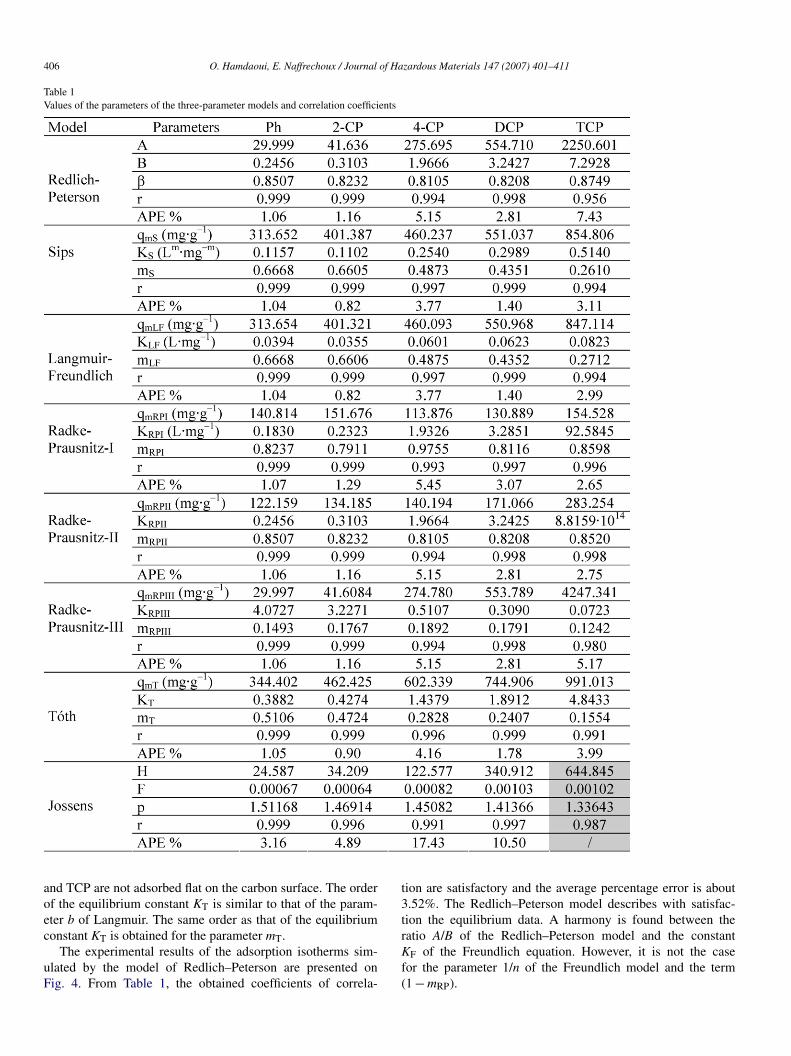
The prediction of adsorption isotherms of phenol andhlorophenols onto GAC by the Sips model is shown on Fig. 2.he Sips equation fits adequately the experimental results. On
he basis of the average percentage error values (Table 1), theangmuir–Freundlich equation seems slightly better than that ofips. The maximum adsorption capacities are identical to thosebtained using the Langmuir–Freundlich isotherm. The param-ter KS and mS change in the same manner as the constants KLFnd mLF of the equation of Langmuir–Freundlich.
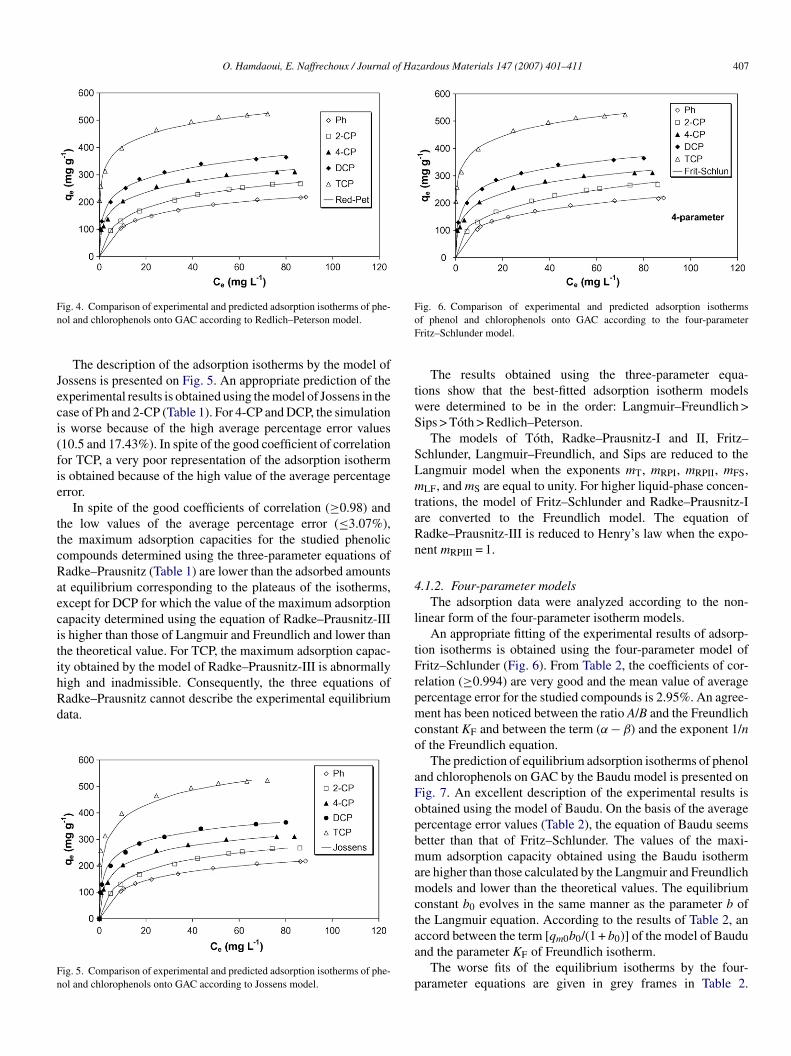
The Toth model correctly simulates the adsorption isothermsf the studied phenolic compounds (Fig. 3). The coefficients oforrelation are good (r ≥ 0.991) for all the tested molecules. Theverage percentage error values lie between 0.9 and 4.16%. Onhe basis of the coefficients of correlation as well as the aver-ge percentage error values (Table 1), the Sips equation seemslightly preferable than that of the Toth isotherm. The adsorp-ion maximum capacities determined using the Toth model areigher than those of Sips, Langmuir–Freundlich, Freundlich and
angmuir. For Ph and 2-CP, the maximum adsorption capacitiesre lower than the theoretical values, while, they are higher thanhe theoretical maximum capacities, for 4-CP, DCP, and TCP.his indicates that, according to the Toth model, 4-CP, DCP,ig. 3. Comparison of experimental and predicted adsorption isotherms of phe-ol and chlorophenols onto GAC according to Toth model.
406 O. Hamdaoui, E. Naffrechoux / Journal of Hazardous Materials 147 (2007) 401–411
Table 1Values of the parameters of the three-parameter models and correlation coefficients
aoec
uF
t3t
nd TCP are not adsorbed flat on the carbon surface. The orderf the equilibrium constant KT is similar to that of the param-ter b of Langmuir. The same order as that of the equilibrium
onstant KT is obtained for the parameter mT.The experimental results of the adsorption isotherms sim-lated by the model of Redlich–Peterson are presented onig. 4. From Table 1, the obtained coefficients of correla-
rKf(
ion are satisfactory and the average percentage error is about.52%. The Redlich–Peterson model describes with satisfac-ion the equilibrium data. A harmony is found between the
atio A/B of the Redlich–Peterson model and the constantF of the Freundlich equation. However, it is not the caseor the parameter 1/n of the Freundlich model and the term1 − mRP).
O. Hamdaoui, E. Naffrechoux / Journal of Hazardous Materials 147 (2007) 401–411 407
Fn
Jeci(fie
ttcRaecitihRd
Fn
FoF
twS
SLmtaRn
4
l
tFr
ig. 4. Comparison of experimental and predicted adsorption isotherms of phe-ol and chlorophenols onto GAC according to Redlich–Peterson model.
The description of the adsorption isotherms by the model ofossens is presented on Fig. 5. An appropriate prediction of thexperimental results is obtained using the model of Jossens in thease of Ph and 2-CP (Table 1). For 4-CP and DCP, the simulations worse because of the high average percentage error values10.5 and 17.43%). In spite of the good coefficient of correlationor TCP, a very poor representation of the adsorption isotherms obtained because of the high value of the average percentagerror.
In spite of the good coefficients of correlation (≥0.98) andhe low values of the average percentage error (≤3.07%),he maximum adsorption capacities for the studied phenolicompounds determined using the three-parameter equations ofadke–Prausnitz (Table 1) are lower than the adsorbed amountst equilibrium corresponding to the plateaus of the isotherms,xcept for DCP for which the value of the maximum adsorptionapacity determined using the equation of Radke–Prausnitz-IIIs higher than those of Langmuir and Freundlich and lower thanhe theoretical value. For TCP, the maximum adsorption capac-ty obtained by the model of Radke–Prausnitz-III is abnormallyigh and inadmissible. Consequently, the three equations of
adke–Prausnitz cannot describe the experimental equilibriumata.ig. 5. Comparison of experimental and predicted adsorption isotherms of phe-ol and chlorophenols onto GAC according to Jossens model.
pmco
aFopbmamctaa
p
ig. 6. Comparison of experimental and predicted adsorption isothermsf phenol and chlorophenols onto GAC according to the four-parameterritz–Schlunder model.
The results obtained using the three-parameter equa-ions show that the best-fitted adsorption isotherm modelsere determined to be in the order: Langmuir–Freundlich >ips > Toth > Redlich–Peterson.
The models of Toth, Radke–Prausnitz-I and II, Fritz–chlunder, Langmuir–Freundlich, and Sips are reduced to theangmuir model when the exponents mT, mRPI, mRPII, mFS,LF, and mS are equal to unity. For higher liquid-phase concen-
rations, the model of Fritz–Schlunder and Radke–Prausnitz-Ire converted to the Freundlich model. The equation ofadke–Prausnitz-III is reduced to Henry’s law when the expo-ent mRPIII = 1.
.1.2. Four-parameter modelsThe adsorption data were analyzed according to the non-
inear form of the four-parameter isotherm models.An appropriate fitting of the experimental results of adsorp-
ion isotherms is obtained using the four-parameter model ofritz–Schlunder (Fig. 6). From Table 2, the coefficients of cor-elation (≥0.994) are very good and the mean value of averageercentage error for the studied compounds is 2.95%. An agree-ent has been noticed between the ratio A/B and the Freundlich
onstant KF and between the term (α − β) and the exponent 1/nf the Freundlich equation.
The prediction of equilibrium adsorption isotherms of phenolnd chlorophenols on GAC by the Baudu model is presented onig. 7. An excellent description of the experimental results isbtained using the model of Baudu. On the basis of the averageercentage error values (Table 2), the equation of Baudu seemsetter than that of Fritz–Schlunder. The values of the maxi-um adsorption capacity obtained using the Baudu isotherm
re higher than those calculated by the Langmuir and Freundlichodels and lower than the theoretical values. The equilibrium
onstant b0 evolves in the same manner as the parameter b ofhe Langmuir equation. According to the results of Table 2, an
ccord between the term [qm0b0/(1 + b0)] of the model of Baudund the parameter KF of Freundlich isotherm.The worse fits of the equilibrium isotherms by the four-arameter equations are given in grey frames in Table 2.
408 O. Hamdaoui, E. Naffrechoux / Journal of Hazardous Materials 147 (2007) 401–411
Table 2Values of the parameters of the four-parameter models and correlation coefficients
ApWaf
dtaF
4
nF
t
dsorption equilibrium isotherms of the studied phenolic com-ounds onto GAC cannot be simulated correctly by the model ofeber–van Vliet because of the lower coefficients of correlation
nd higher average percentage error values (13.28%), especiallyor 4-CP, DCP, and TCP.
It was concluded for the fitting of the equilibrium adsorption
ata for the tested phenolic compounds onto activated carbonhat the three-parameter models of Langmuir–Freundlich, Sips,nd Toth are better than that of the four-parameter equation ofritz–Schlunder.Freu
.1.3. Five-parameter modelThe adsorption data were analyzed according to the
on-linear form of the five-parameter isotherm model ofritz–Schlunder.
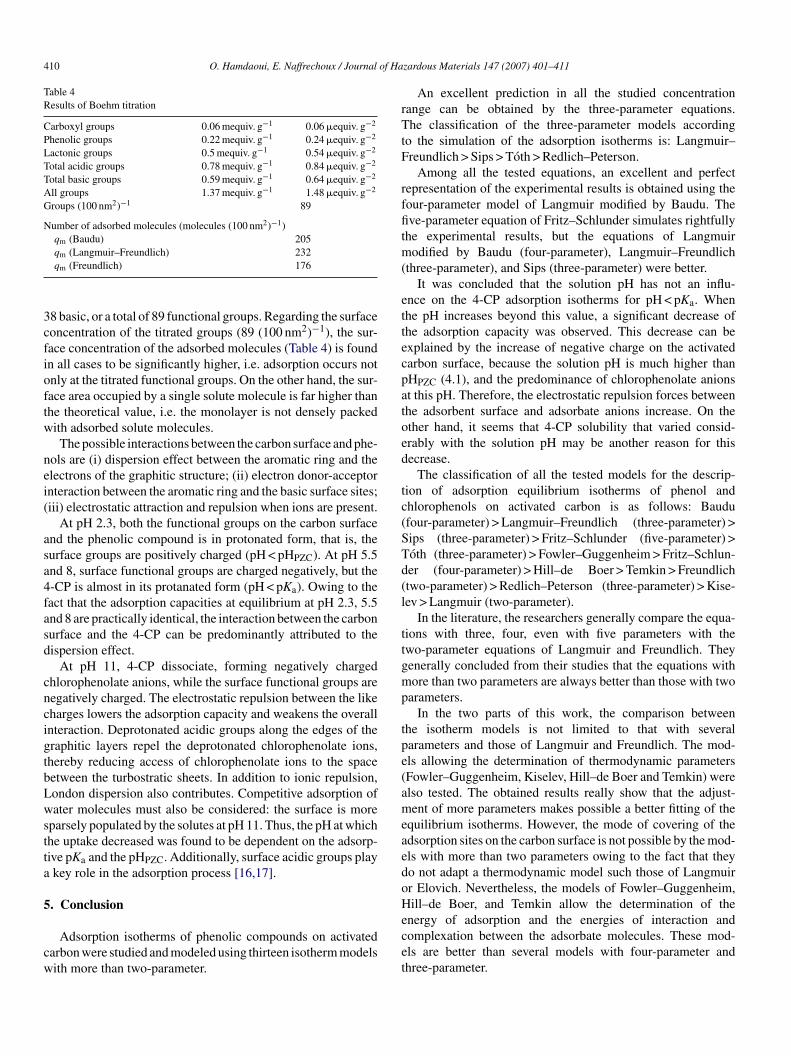
An adequate fitting of the experimental results of the adsorp-ion isotherms is obtained using the five-parameter model of
ritz–Schlunder (Fig. 8). From Table 3, the coefficients of cor-elation are very good (≥0.994) and the average percentagerror value for the studied compounds is 2.32%. The val-es of the maximum adsorption capacity obtained using the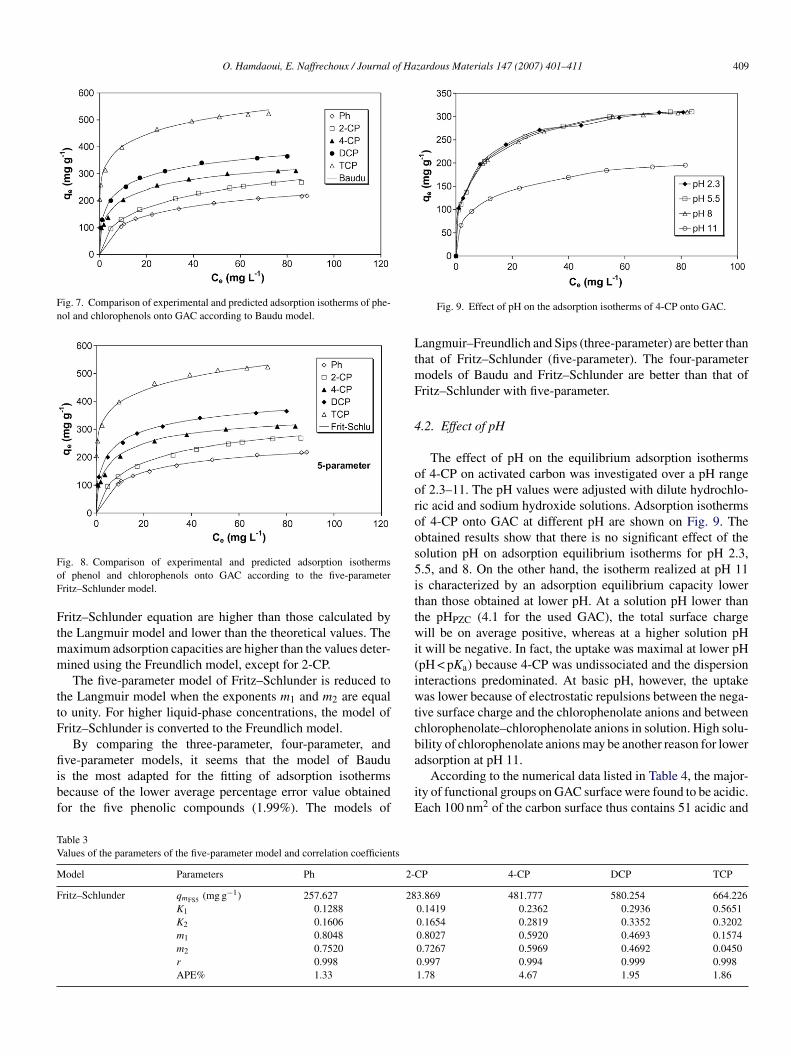
O. Hamdaoui, E. Naffrechoux / Journal of Hazardous Materials 147 (2007) 401–411 409
Fig. 7. Comparison of experimental and predicted adsorption isotherms of phe-nol and chlorophenols onto GAC according to Baudu model.
FoF
Ftmm
ttF
fiibf
LtmF
4
ooroos5ittwi(iwtcb
TV
M
F
ig. 8. Comparison of experimental and predicted adsorption isothermsf phenol and chlorophenols onto GAC according to the five-parameterritz–Schlunder model.
ritz–Schlunder equation are higher than those calculated byhe Langmuir model and lower than the theoretical values. The
aximum adsorption capacities are higher than the values deter-ined using the Freundlich model, except for 2-CP.The five-parameter model of Fritz–Schlunder is reduced to
he Langmuir model when the exponents m1 and m2 are equalo unity. For higher liquid-phase concentrations, the model ofritz–Schlunder is converted to the Freundlich model.
By comparing the three-parameter, four-parameter, and
ve-parameter models, it seems that the model of Baudus the most adapted for the fitting of adsorption isothermsecause of the lower average percentage error value obtainedor the five phenolic compounds (1.99%). The models of
a
iE
able 3alues of the parameters of the five-parameter model and correlation coefficients
odel Parameters Ph 2-C
ritz–Schlunder qmFS5 (mg g−1) 257.627 28K1 0.1288K2 0.1606m1 0.8048m2 0.7520r 0.998APE% 1.33
Fig. 9. Effect of pH on the adsorption isotherms of 4-CP onto GAC.
angmuir–Freundlich and Sips (three-parameter) are better thanhat of Fritz–Schlunder (five-parameter). The four-parameter
odels of Baudu and Fritz–Schlunder are better than that ofritz–Schlunder with five-parameter.
.2. Effect of pH
The effect of pH on the equilibrium adsorption isothermsf 4-CP on activated carbon was investigated over a pH rangef 2.3–11. The pH values were adjusted with dilute hydrochlo-ic acid and sodium hydroxide solutions. Adsorption isothermsf 4-CP onto GAC at different pH are shown on Fig. 9. Thebtained results show that there is no significant effect of theolution pH on adsorption equilibrium isotherms for pH 2.3,.5, and 8. On the other hand, the isotherm realized at pH 11s characterized by an adsorption equilibrium capacity lowerhan those obtained at lower pH. At a solution pH lower thanhe pHPZC (4.1 for the used GAC), the total surface chargeill be on average positive, whereas at a higher solution pH
t will be negative. In fact, the uptake was maximal at lower pHpH < pKa) because 4-CP was undissociated and the dispersionnteractions predominated. At basic pH, however, the uptakeas lower because of electrostatic repulsions between the nega-
ive surface charge and the chlorophenolate anions and betweenhlorophenolate–chlorophenolate anions in solution. High solu-ility of chlorophenolate anions may be another reason for lower
dsorption at pH 11.According to the numerical data listed in Table 4, the major-ty of functional groups on GAC surface were found to be acidic.ach 100 nm2 of the carbon surface thus contains 51 acidic and
P 4-CP DCP TCP
3.869 481.777 580.254 664.2260.1419 0.2362 0.2936 0.56510.1654 0.2819 0.3352 0.32020.8027 0.5920 0.4693 0.15740.7267 0.5969 0.4692 0.04500.997 0.994 0.999 0.9981.78 4.67 1.95 1.86
410 O. Hamdaoui, E. Naffrechoux / Journal of Ha
Table 4Results of Boehm titration
Carboxyl groups 0.06 mequiv. g−1 0.06 �equiv. g−2
Phenolic groups 0.22 mequiv. g−1 0.24 �equiv. g−2
Lactonic groups 0.5 mequiv. g−1 0.54 �equiv. g−2
Total acidic groups 0.78 mequiv. g−1 0.84 �equiv. g−2
Total basic groups 0.59 mequiv. g−1 0.64 �equiv. g−2
All groups 1.37 mequiv. g−1 1.48 �equiv. g−2
Groups (100 nm2)−1 89
Number of adsorbed molecules (molecules (100 nm2)−1)qm (Baudu) 205
3cfioftw
nei(
asa4fasd
cncigtbLwstta
5
cw
rTtF
rffitm(
ettecpatoed
tc(STd(l
ttgmp
tpe(ameaedoH
qm (Langmuir–Freundlich) 232qm (Freundlich) 176
8 basic, or a total of 89 functional groups. Regarding the surfaceoncentration of the titrated groups (89 (100 nm2)−1), the sur-ace concentration of the adsorbed molecules (Table 4) is foundn all cases to be significantly higher, i.e. adsorption occurs notnly at the titrated functional groups. On the other hand, the sur-ace area occupied by a single solute molecule is far higher thanhe theoretical value, i.e. the monolayer is not densely packedith adsorbed solute molecules.The possible interactions between the carbon surface and phe-
ols are (i) dispersion effect between the aromatic ring and thelectrons of the graphitic structure; (ii) electron donor-acceptornteraction between the aromatic ring and the basic surface sites;iii) electrostatic attraction and repulsion when ions are present.
At pH 2.3, both the functional groups on the carbon surfacend the phenolic compound is in protonated form, that is, theurface groups are positively charged (pH < pHPZC). At pH 5.5nd 8, surface functional groups are charged negatively, but the-CP is almost in its protanated form (pH < pKa). Owing to theact that the adsorption capacities at equilibrium at pH 2.3, 5.5nd 8 are practically identical, the interaction between the carbonurface and the 4-CP can be predominantly attributed to theispersion effect.
At pH 11, 4-CP dissociate, forming negatively chargedhlorophenolate anions, while the surface functional groups areegatively charged. The electrostatic repulsion between the likeharges lowers the adsorption capacity and weakens the overallnteraction. Deprotonated acidic groups along the edges of theraphitic layers repel the deprotonated chlorophenolate ions,hereby reducing access of chlorophenolate ions to the spaceetween the turbostratic sheets. In addition to ionic repulsion,ondon dispersion also contributes. Competitive adsorption ofater molecules must also be considered: the surface is more
parsely populated by the solutes at pH 11. Thus, the pH at whichhe uptake decreased was found to be dependent on the adsorp-ive pKa and the pHPZC. Additionally, surface acidic groups playkey role in the adsorption process [16,17].
. Conclusion
Adsorption isotherms of phenolic compounds on activatedarbon were studied and modeled using thirteen isotherm modelsith more than two-parameter.
ecet
zardous Materials 147 (2007) 401–411
An excellent prediction in all the studied concentrationange can be obtained by the three-parameter equations.he classification of the three-parameter models according
o the simulation of the adsorption isotherms is: Langmuir–reundlich > Sips > Toth > Redlich–Peterson.
Among all the tested equations, an excellent and perfectepresentation of the experimental results is obtained using theour-parameter model of Langmuir modified by Baudu. Theve-parameter equation of Fritz–Schlunder simulates rightfully
he experimental results, but the equations of Langmuirodified by Baudu (four-parameter), Langmuir–Freundlich
three-parameter), and Sips (three-parameter) were better.It was concluded that the solution pH has not an influ-
nce on the 4-CP adsorption isotherms for pH < pKa. Whenhe pH increases beyond this value, a significant decrease ofhe adsorption capacity was observed. This decrease can bexplained by the increase of negative charge on the activatedarbon surface, because the solution pH is much higher thanHPZC (4.1), and the predominance of chlorophenolate anionst this pH. Therefore, the electrostatic repulsion forces betweenhe adsorbent surface and adsorbate anions increase. On thether hand, it seems that 4-CP solubility that varied consid-rably with the solution pH may be another reason for thisecrease.
The classification of all the tested models for the descrip-ion of adsorption equilibrium isotherms of phenol andhlorophenols on activated carbon is as follows: Baudufour-parameter) > Langmuir–Freundlich (three-parameter) >ips (three-parameter) > Fritz–Schlunder (five-parameter) >oth (three-parameter) > Fowler–Guggenheim > Fritz–Schlun-er (four-parameter) > Hill–de Boer > Temkin > Freundlichtwo-parameter) > Redlich–Peterson (three-parameter) > Kise-ev > Langmuir (two-parameter).
In the literature, the researchers generally compare the equa-ions with three, four, even with five parameters with thewo-parameter equations of Langmuir and Freundlich. Theyenerally concluded from their studies that the equations withore than two parameters are always better than those with two
arameters.In the two parts of this work, the comparison between
he isotherm models is not limited to that with severalarameters and those of Langmuir and Freundlich. The mod-ls allowing the determination of thermodynamic parametersFowler–Guggenheim, Kiselev, Hill–de Boer and Temkin) werelso tested. The obtained results really show that the adjust-ent of more parameters makes possible a better fitting of the
quilibrium isotherms. However, the mode of covering of thedsorption sites on the carbon surface is not possible by the mod-ls with more than two parameters owing to the fact that theyo not adapt a thermodynamic model such those of Langmuirr Elovich. Nevertheless, the models of Fowler–Guggenheim,ill–de Boer, and Temkin allow the determination of the
nergy of adsorption and the energies of interaction and
omplexation between the adsorbate molecules. These mod-ls are better than several models with four-parameter andhree-parameter.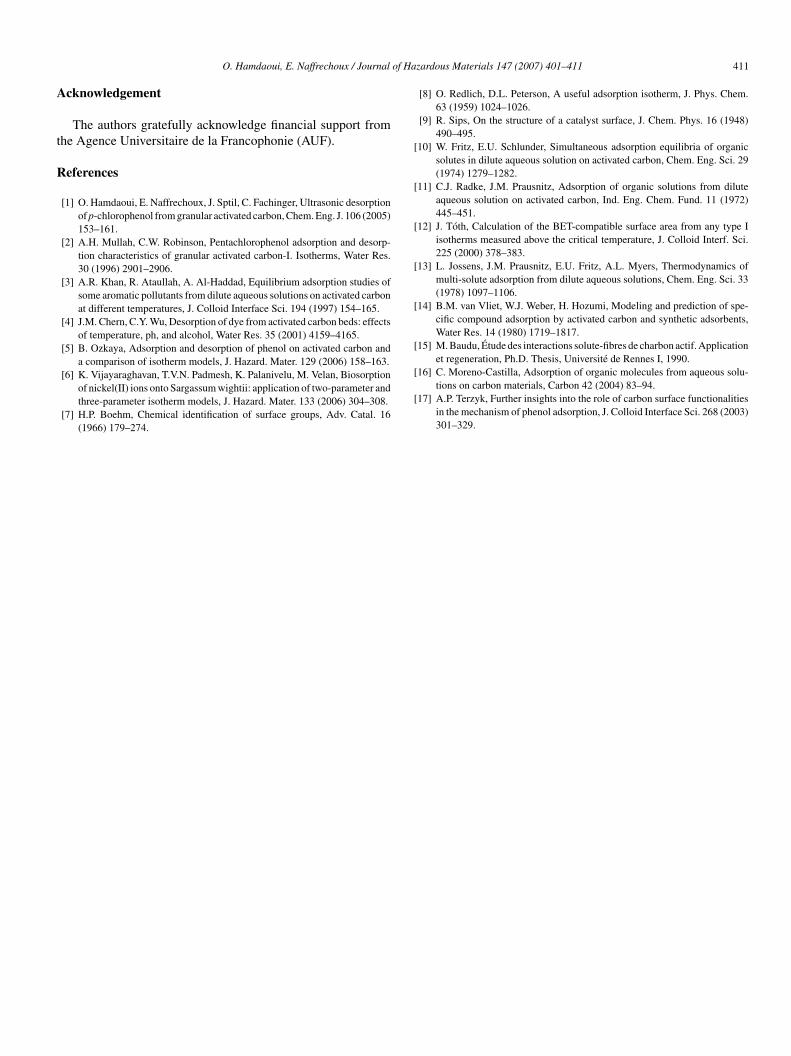
of Ha
A
t
R
[
[
[
[
[
[
O. Hamdaoui, E. Naffrechoux / Journal
cknowledgement
The authors gratefully acknowledge financial support fromhe Agence Universitaire de la Francophonie (AUF).
eferences
[1] O. Hamdaoui, E. Naffrechoux, J. Sptil, C. Fachinger, Ultrasonic desorptionof p-chlorophenol from granular activated carbon, Chem. Eng. J. 106 (2005)153–161.
[2] A.H. Mullah, C.W. Robinson, Pentachlorophenol adsorption and desorp-tion characteristics of granular activated carbon-I. Isotherms, Water Res.30 (1996) 2901–2906.
[3] A.R. Khan, R. Ataullah, A. Al-Haddad, Equilibrium adsorption studies ofsome aromatic pollutants from dilute aqueous solutions on activated carbonat different temperatures, J. Colloid Interface Sci. 194 (1997) 154–165.
[4] J.M. Chern, C.Y. Wu, Desorption of dye from activated carbon beds: effectsof temperature, ph, and alcohol, Water Res. 35 (2001) 4159–4165.
[5] B. Ozkaya, Adsorption and desorption of phenol on activated carbon anda comparison of isotherm models, J. Hazard. Mater. 129 (2006) 158–163.
[6] K. Vijayaraghavan, T.V.N. Padmesh, K. Palanivelu, M. Velan, Biosorptionof nickel(II) ions onto Sargassum wightii: application of two-parameter andthree-parameter isotherm models, J. Hazard. Mater. 133 (2006) 304–308.
[7] H.P. Boehm, Chemical identification of surface groups, Adv. Catal. 16(1966) 179–274.
[
[
zardous Materials 147 (2007) 401–411 411
[8] O. Redlich, D.L. Peterson, A useful adsorption isotherm, J. Phys. Chem.63 (1959) 1024–1026.
[9] R. Sips, On the structure of a catalyst surface, J. Chem. Phys. 16 (1948)490–495.
10] W. Fritz, E.U. Schlunder, Simultaneous adsorption equilibria of organicsolutes in dilute aqueous solution on activated carbon, Chem. Eng. Sci. 29(1974) 1279–1282.
11] C.J. Radke, J.M. Prausnitz, Adsorption of organic solutions from diluteaqueous solution on activated carbon, Ind. Eng. Chem. Fund. 11 (1972)445–451.
12] J. Toth, Calculation of the BET-compatible surface area from any type Iisotherms measured above the critical temperature, J. Colloid Interf. Sci.225 (2000) 378–383.
13] L. Jossens, J.M. Prausnitz, E.U. Fritz, A.L. Myers, Thermodynamics ofmulti-solute adsorption from dilute aqueous solutions, Chem. Eng. Sci. 33(1978) 1097–1106.
14] B.M. van Vliet, W.J. Weber, H. Hozumi, Modeling and prediction of spe-cific compound adsorption by activated carbon and synthetic adsorbents,Water Res. 14 (1980) 1719–1817.
15] M. Baudu, Etude des interactions solute-fibres de charbon actif. Applicationet regeneration, Ph.D. Thesis, Universite de Rennes I, 1990.
16] C. Moreno-Castilla, Adsorption of organic molecules from aqueous solu-tions on carbon materials, Carbon 42 (2004) 83–94.
17] A.P. Terzyk, Further insights into the role of carbon surface functionalitiesin the mechanism of phenol adsorption, J. Colloid Interface Sci. 268 (2003)301–329.