modeling of pneumatic tires by a finite element model for the
TRANSCRIPT
Modeling of Pneumatic Tires by a Finite
Element Model for the Development a Tire
Friction Remote Sensor
H. Holscher 1, M. Tewes, N. Botkin, M. Lohndorf,K.-H. Hoffmann, and E. Quandt
Center of Advanced European Studies and Research (caesar),Ludwig-Erhard-Allee 2, 53175 Bonn, Germany
Abstract
The behavior a pneumatic tire is analyzed and simulated using a finite elementmodel. We calculate the elastic deformations in the contact area of a pneumatic tiretouching the street for different friction conditions between tire and street. The sim-ulations are compared with the experimental results. The comparison demonstratesthat the overall deformation as well as the frictional behavior in the tire/groundcontact area can be successfully simulated by finite element models.
Key words: Intelligent tire, remote passive sensor, tire simulation, tire friction
1 Introduction
Today, nearly all ground vehicles use wheels. These wheels have to support theweight of the vehicle, cushion the vehicle over surface irregularities, providesufficient traction for driving and braking, and provide steering control anddirection stability. Pneumatic tires can perform these functions effectively andefficiently. Consequently, they are universally used in today’s road and off-roadvehicles [1].
In order to enhance the performance of cars with pneumatic tires different ap-proaches were applied to include a sensor into the rubber of the tire measuringthe deformation and forces that occur in the tire/ground contact area [2–8].
1 Now at: Center for NanoTechnology, University of Munster, Gievenbecker Weg11, 48149 Munster, Germany
Preprint submitted to Computers and Structures 28 October 2004

This information can be used for for the registration of the so-called ”slip posi-tion”, which indicates the loss of gripping power even before the tire begins toslip. As a consequence such a sensor can be implemented for the developmentof new tires with improved force transmission at different driving conditionsas well as in the development of improved an antilock braking system (ABS)and/or electronic stability program (ESP) increasing the active vehicle safety.Furthermore, the proposed system might also be able to detect critical condi-tions of the tire itself like insufficient pressure or overheating. Consequently,such an intelligent tire prevents tire explosion and reduces maintenance costsand environmental impact by increasing the tire’s lifetime.
During the last years, several concepts of tire sensors have been reported (see,e.g., [2–8] and references therein). A well established concept is the so-calledDarmstadter Tire Sensor. It is able to detect the deformation of single treadelements in the tire road contact area in x-, y- and z-direction. The sensormeasures the motion of a magnet relative to hall generators which are eitherattached to the tire at the inner side of the belt (kevlar belt tires) or placedwithin a single tread element (standard steel tires). The magnet is alwaysplaced in the tread rubber. The forces acting in the contact patch have beeninvestigated on test stands and with specially prepared cars (see, e.g., Refs.[2–4]).
Another tire sensor system is the sidewall torsion sensor (SWT) [5] developedby Continental AG, Germany. This system is based on the measurement ofthe deformation in the sidewall of a pneumatic tire. The SWT system consistsof a magnetized tire, wheel module with magnetic field sensors and signalprocessing and a central processing unit. The magnetic field of the magnetizedtire is picked by the magneto-resistive sensor that is mounted on the wheelsuspension. The sidewall stiffness depends on the inflation pressure and thelateral force acting in the contact patch. It has been demonstrated by themanufacturer that the sidewall torsion sensor can be used to enhance theoverall behavior of a car.
Recently, we reported on our tire friction remote sensor [8]. To gain a broadacceptance of a tire remote sensor such a system has to meet the generalspecifications of the automotive industry. Especially, the transmission of therapid changing force and strain data from the rotating tire is a challenge. Therequired data rate of some kHz for the improvement of ABS and/or EPS ex-ceeds that of commercial available remote tire pressure measurement systemsby a million. Therefore, the power consumption of an active transponder sys-tem would exceed by far the energy a battery could provide over the tire’slifetime. For that reason our development was focused on the remote readoutof resonant circuits. This approach requires no power supply for the sensoritself and allows a high data transmission rate.
2

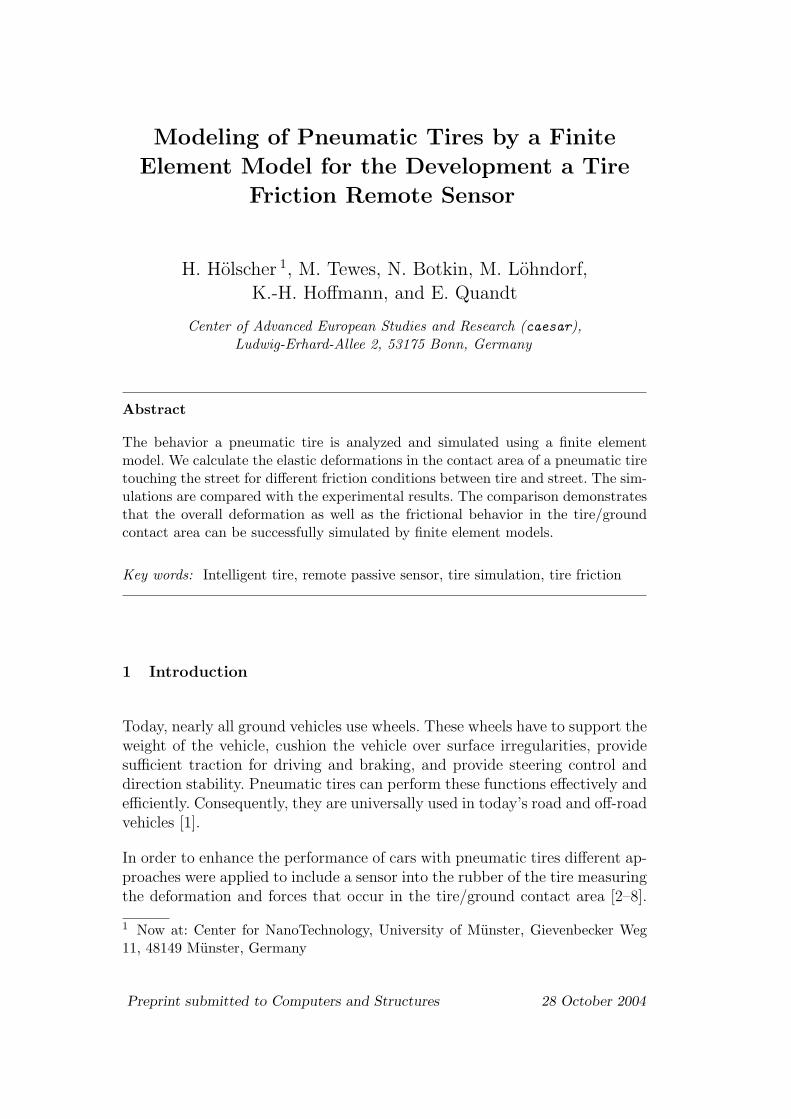
The basic principle of the currently developed remote tire sensor is shownin Fig. 1. The sensor is mounted into the tread of the pneumatic tire. Thephysical properties measured by the sensor (friction, load, tire pressure, . . . )are submitted as radio frequency signals which are detected by a receiver.Subsequently, they can be used as an input to electronic controls like ABSor ESP. The concept of the sensor itself is based on a LC-tag. In this way,the measurement signal is encoded in a detuning of the resonant circuit. Thesensor itself is sensitive to strain or stress.
Here we report about the supporting analysis and simulation of pneumatictires for the development of the tire sensor. The behavior of a pneumatictire is analyzed and simulated with a finite element model (FEM). Using thisapproach it is possible to calculate the elastic deformations in the contactarea of a pneumatic tire touching the street. This is especially valuable be-cause many quantities can be only measured with high experimental effortsat real tires. Therefore, the numerical simulation reduces costs and time forthe development of the tire sensor. The simulations are compared with theexperimental results obtained with different types of sensors. The comparisondemonstrates that the overall deformation as well as the frictional behavior inthe tire/ground contact area can be successfully simulated by finite elementmodels.
2 Modeling and Simulation of Pneumatic Tires
2.1 Constraints to be considered
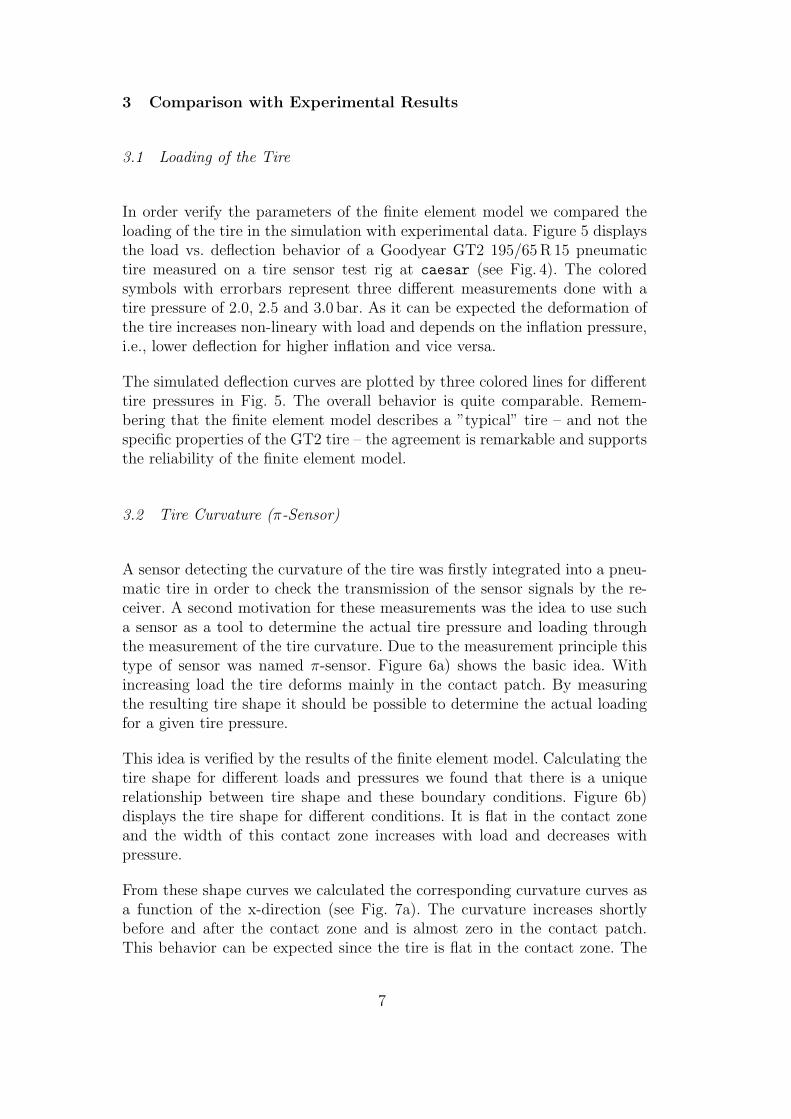
Modern pneumatic tires consist of a specific combination of rubber com-pounds, cord and steel belts (see Fig. 2). The main parts of a modern pneu-matic tire are its body, sidewalls, beads, and tread. The body is made of layersof rubberized fabric, called plies, that give the tire strength and flexibility. Thefabric is made of rayon, nylon, or polyester cord. Covering the plies are side-walls and tread of chemically treated rubber. The sidewalls form the outerwalls of the tire. Embedded in the two inner edges of the tire are steel loops,called beads, that hold the tire to the wheel. In a modern tubeless tire the sealbetween the beads and the wheel rim is airtight and the underside of the tirebody is coated with butyl rubber to keep the air from escaping. The rubbercomponents have different characteristics in dependence of their functionality.The tread for example gets in direct contact with the ground and has to bemuch harder than the sidewall.
When a driving torque is applied to a pneumatic tire, a tractive force is de-veloped at the tire-ground patch [1]. Consequently, the tread before and in
3

the contact area is compressed and a shear deformation of the sidewall of thetire is developed. As the tread is compressed before entering the contact re-gion, the distance that the tire travels when subject to a driving torque willbe less than that in the free rolling case. This phenomenon is the so-calledlongitudinal slip which is usually defined as
slip =
(1− reff
rfree
)× 100% (1)
where reff is the effective radius and rfree the radius of the free rolling tire[1].
When a driving torque is applied, the tire rotates without the equivalent trans-latory progress and a slip results. If the tire is rotating at a certain angularspeed but the linear speed of the tire center is zero, then the longitudinal slipof the tire will be 100%. A situation often observed on icy surfaces.
2.2 Simulation of a Tire by a Finite Element Model
The above constraints had to be considered for the simulation of a pneumatictire by the finite element model. The software packages MSC.MENTAT andMSC.MARC were used for the set-up and the calculation of the model, re-spectively. The results were subsequently analyzed by self-developed softwareroutines. The set-up of the finite element model is based on the model ofTonuk et al. [9,10]. Mainly the reinforcement by cord and steel have beenchanged due to a different software version of MSC.MARC. The simulationprocedure includes the following features:
specific behavior of rubber: (Mooney material) Like many other polymermaterial vulcanized rubber shows a nonlinear stress-strain relationship. Fur-thermore, rubber is incompressible. This behavior is well described by theMooney-Rivlin material formulation which is included in the MSC.MARCprogram.
constant inflation pressure: In a tire, the inflation pressure acts perpen-dicular to its inner surface. This effect is well described by the follower forceoption of MSC.MARC: A constant surface force is added to every elementat the inner surface of the tire and the direction of this force is kept per-pendicular to the surface during each solution increment. In a real inflatedtire, the amount of air is fixed. Therefore, the pressure increases slightly ifthe tire is deformed. This small effect is ignored.
reinforcement by cord and steel: The reinforcement of the tire structureis very important for the overall behavior of pneumatic tires used today. Thecord and steel plies have a well defined orientation and thickness. They are
4

modeled by rebar elements which are superimposed to elements describingthe matrix rubber elements (this feature is included in MSC.MARC, otherfinite element codes use different methods). The rebar elements stabilize thetire and follow all deformations of the rubber elements. 2
tire/rim contact: The contact of the tire to the rim is simplified with theassumption that the tire sticks at the rim. The nodes at the tire/rim contactare fixed at the rim with the glue option of the MSC.MARC program. Thebead bundle, which keeps the tire on the rim and supplies a stiff support ofthe body ply is ignored.
Coulomb friction at tire/street contact: The ground contact of the tirecomplicates the finite element model, since contact and friction problemsare highly nonlinear. Nonetheless, both effects cannot be ignored. The con-tact problem in the FEM model is described by a deformable body (tire) toa rigid body (street) option. The Coulomb friction is modeled by the algo-rithm in MSC.MARC, which considers static and sliding friction betweenthe nodes of the tire and the street modeled a smooth plane. The frictioncoefficient is different if the velocity between two bodies is zero (static fric-tion) or nonzero (sliding friction). This behavior is modeled by an algorithmimplemented in MSC.MARC.
tire rotation and slip: The tire rotation is performed by a discrete rotationof the rim for each increment. Since the tire is fixed to the rim it rotatesand is deformed due to friction in the contact area. The slip between tireand street was controlled by the simultaneous movement of the street, i.e.,for a slip of 90% the optimal street movement was reduced by 10%.
symmetry: In the current stage of the remote tire sensor project, the analysisof tire is simplified and it is assumed that the tire rolls straightforward alongthe roadway. In this case there are no additional lateral (cornering) forces.Therefore, the simple symmetry of the tire is used and only one half ofthe pneumatic tire is modeled by the finite element model (s. Fig. 3). Thenodes at the symmetry plane were perpendicularly fixed to it (along thez-direction).
Figure 3 shows an overview of the described FEM model. The described com-ponents and materials are shown by different colors. The major numericaldifficulties are the geometric non-linearities due to large deformations, theincompressibility of elastomers, and the specific boundary conditions of thetire/street contact. These effects consume the main computer time.
The parameters chosen for the finite element model correspond to a typical195/65R15 tire. Consequently, the simulations provide information over the
2 In difference to Refs. [9,10] we did not use a specific user routine to determine theactual orientation of the matrix rebar element. We found that this is not necessaryin the used MSC.MARC 2000 Version and applied successfully the included rebarorientation option.
5

parameters used values
dimensions 195/65 R15 tire
Mooney constants C10 C01bead filler 14.14 MPa 21.26 MPasidewall 171.8 kPa 830.3 kPaundertread 140.4 kPa 427 kPatread 806.1 kPa 1.805 MPa
reinforcement n A E νsteel belts (±20◦) 1000/m 0.3 mm2 200 GPa 0.3cord ply 1000/m 0.28 mm2 3.97GPa 0.3
Table 1Summary of the parameters used in the finite element model.
overall behavior of a tire with these dimensions. The specific values of theused parameters are summarized in Fig. 1. The Mooney constants of the usedrubber components are values given in Ref. [10]. The parameters used for therebar elements in the simulation are typical values for modern pneumatic tires[10,12].
Depending on the requested accuracy the size of the elements is adapted andthe number of elements is chosen between 5 000 and 20 000. Since the tireis strongly deformed in the contact area between tire and pavement, moreelements must be used in this region. To obtain a finer grid in the contactareas the tire is splitted into sectors with elements of different size and angle.The sector getting in contact with the street contains elements covering 0.5◦
of the tire circle. This angle is increased to 5◦ in the sector opposite to thecontact region, since this part of the tire is only slightly deformed. We verifiedthat a finer grid does not change the outcome of the simulations. All datashown in the next sections was obtained with 17 496 elements (including therebar elements).
The complete simulation procedure includes three simulation steps. First, thetire was inflated to a pressure between 2 and 3 bar. In a second step the tireis pressed on a flat plane modeling the contact with a real pavement. Typicalapplied normal loads range from 2000N to 4000N. Finally, the tire rotates androlls over the street, where we considered different friction coefficients and slipvalues.
6
3 Comparison with Experimental Results
3.1 Loading of the Tire
In order verify the parameters of the finite element model we compared theloading of the tire in the simulation with experimental data. Figure 5 displaysthe load vs. deflection behavior of a Goodyear GT2 195/65R15 pneumatictire measured on a tire sensor test rig at caesar (see Fig. 4). The coloredsymbols with errorbars represent three different measurements done with atire pressure of 2.0, 2.5 and 3.0 bar. As it can be expected the deformation ofthe tire increases non-lineary with load and depends on the inflation pressure,i.e., lower deflection for higher inflation and vice versa.
The simulated deflection curves are plotted by three colored lines for differenttire pressures in Fig. 5. The overall behavior is quite comparable. Remem-bering that the finite element model describes a ”typical” tire – and not thespecific properties of the GT2 tire – the agreement is remarkable and supportsthe reliability of the finite element model.
3.2 Tire Curvature (π-Sensor)
A sensor detecting the curvature of the tire was firstly integrated into a pneu-matic tire in order to check the transmission of the sensor signals by the re-ceiver. A second motivation for these measurements was the idea to use sucha sensor as a tool to determine the actual tire pressure and loading throughthe measurement of the tire curvature. Due to the measurement principle thistype of sensor was named π-sensor. Figure 6a) shows the basic idea. Withincreasing load the tire deforms mainly in the contact patch. By measuringthe resulting tire shape it should be possible to determine the actual loadingfor a given tire pressure.
This idea is verified by the results of the finite element model. Calculating thetire shape for different loads and pressures we found that there is a uniquerelationship between tire shape and these boundary conditions. Figure 6b)displays the tire shape for different conditions. It is flat in the contact zoneand the width of this contact zone increases with load and decreases withpressure.
From these shape curves we calculated the corresponding curvature curves asa function of the x-direction (see Fig. 7a). The curvature increases shortlybefore and after the contact zone and is almost zero in the contact patch.This behavior can be expected since the tire is flat in the contact zone. The
7

corresponding experimental results show reasonable agreement with the sim-ulation.
In Fig. 7b), the experimentally obtained curvature curves are plotted as afunction of position along the traveling path of a real tire. They show thesame overall behavior as the theoretical curves. The results shows that thewidth and the height of curvature curve depend on pressure and loading. Thisenables the π-sensor to detect, if pressure is correct for the actual loading. Theanalysis of experimental results show that the tire pressure can be measuredwith an accuracy of 0.1 bar which is a reliable value for many practical reasons.
3.3 Stress and Strain in the Contact Area (Friction Sensor)
Future sensor systems have to detect not only the tire loading and pressure. butalso the actual street conditions like icy roads. Therefore, our work focused onthe influence of different friction coefficients on the deformation of a pneumatictire. In order measure the forces acting laterally to the contact patch, thesimulations now analyze the stress and strain along the traveling path of thewheel.
The basic effects of different friction conditions on the deformation of thecontact patch is described by the theory of Julien reviewed in Ref. [1]. Thecontact patch is divided into two regions. In the adhesion region the rubberis deformed but there is no sliding between the tire tread and the street. Thisregion is in the front of the contact patch. The sliding region, however, is inthe end of the contact patch. Here the tractive forces are so large that therubber tread slides over the street.
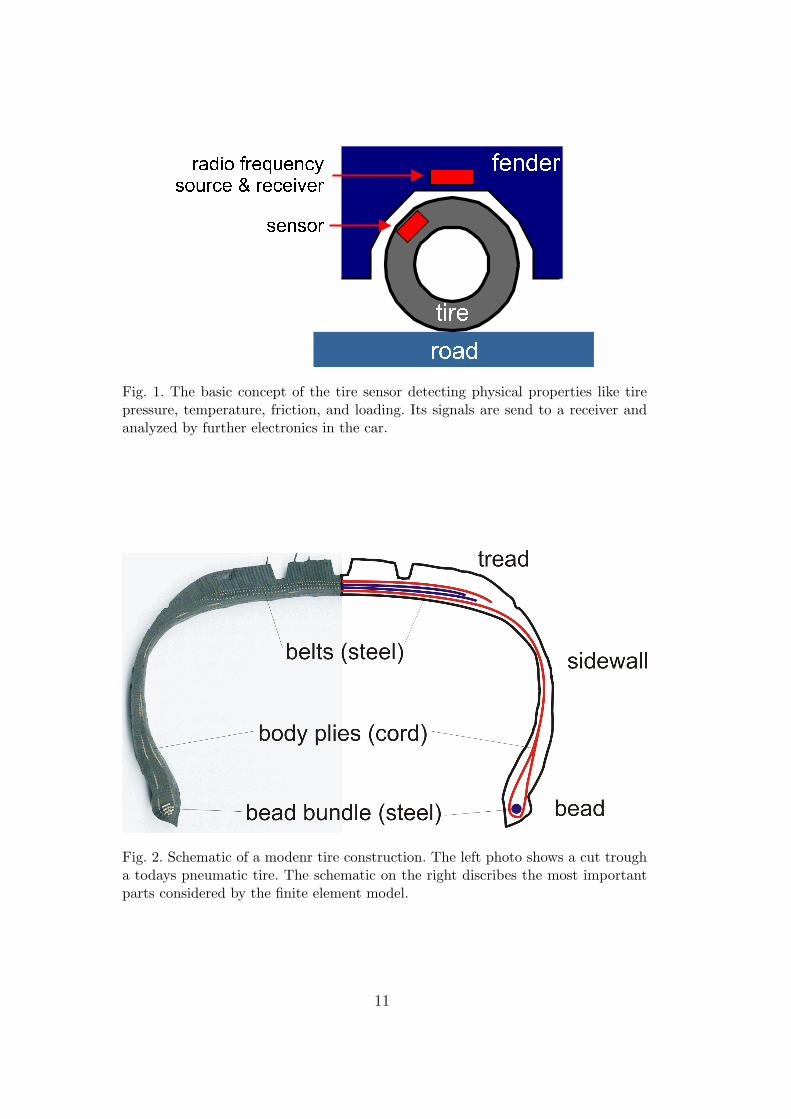
In order to analyse the basic features of a wheel/street contact for differentfriction coefficient we begun our simulations with a simplified two-dimensionaltire model. This model consists of a fixed rim covered with solid rubber(E = 14MPa and µ = 0.5). Calculating the stress along the x-direction weobtained different curves in dependence on the actual friction conditions. Asshown in Fig. 8a) this behavior is most prominent in the back area of the con-tact patch, where the maximum of the longitudinal stress increases with thefriction coefficient. However, it is important to mention that even without anyfriction (µ = 0.0) the stress is not constant along the x-direction. This effectsuperimposes the stress caused by friction and results from the simultaneousloading of the tire. Nonetheless, the result demonstrates that friction has in-deed an influence on the deformation of a pneumatic tire. Consequently, thiseffect can be used as an indicator for the actual road conditions.
The stress in the contact patch changes also with slip. This is shown in Fig. 8b).With increasing slip the minimum of the curves shifts to the left and in-
8

creases. Furthermore the area where the frictional forces between tire androad are given by static friction decreases. This is shown in both graphs bythick lines marking the adhesion region. This part of the curves is identified bythe Coulomb friction mechanism implemented in MSC.MARC, i.e., the nodesof the finite element model are divided into nodes which are in a static orsliding friction state. It can be observed that the complete contact patch isin the sliding regime for a slip of 20%, i.e., tire and street slide against eachother.
Comparable results are obtained with the three-dimensional tire model. Thestress and strain in the contact patch are shown in Fig. 9 for different street andslip conditions. As in the two-dimensional model the deformation of the tireis superimposed by its loading, but the expected effect – different deformationfor different road conditions – is clearly observed.
Stress and strain change with the actual friction coefficient µ. The minimaand maxima of the curves change there positions and absolute values in de-pendence of the street conditions. The overall behavior of the strain curves iscomparable to the results found with the Darmstadter Tire Sensor [2]. Theabsolute differences of the curves are more pronounced in the strain curve.This effect is caused by the nonlinear stress-strain relationship of the rubber(Mooney-material).
Furthermore, the stress and strain curves change with the actual slip value.This is shown by the red dashed line for the friction coefficient of 0.5. Thereis a remarkable change of the stress and strain curve, if the slip is increasedfrom 0 to 5%.
4 Summary
To summarize, the presented finite element model is able describe the overallbehavior of a real pneumatic tire. Experimental results could be confirmed bythe simulations. The load vs. deflection relationship and the curvature curves(π-sensor) measured with the test facilities at caesar are in agreement withthe finite element model. The calculation of stress and strain in the contactarea verified that the deformation of the tire provide information about theactual road (µ-value) and driving (slip) conditions.
9

Acknowledgment
It is a pleasure to acknowledge helpful discussions about this project with C.Boes, R. Zimmerer (Goodyear, Luxemburg) and U. Gleu (Technical Univer-sity, Berlin, Germany). Furthermore, we thank E. Tonuk (Middle East Tech-nical University, Ankara, Turkey) for sending us a copy of his Ph. D. Thesis.This work was supported by the EU via BMBF project 03N30089 (EUREKAproject !2375: Tyre friction remote sensor using giant magneto-impendance).
References
[1] J. Y. Wong: Theory of Ground Vehicles, 3rd ed., Wiley-Interscience (2001).
[2] D. Ludwig, Ph. D. Thesis, Technische Universitat Darmstadt (1997).
[3] Th. Bachmann, Ph. D. Thesis, Technische Universitat Darmstadt (1997).
[4] M. Fach, V. Bachmann, B. Breuer: Der Darmstadter Reifensensor im Laborund am Fahrzeug in 2. Darmstadter Reifenkolloquium, B. Breuer (Ed.),VDIFortschrittsberichte Nr. 362 (1998).
[5] Th. Becherer: The Sidewall Torsion Sensor System, in 2. DarmstadterReifenkolloquium, B. Breuer (Ed.), VDI Fortschrittsberichte Nr. 362 (1998).
[6] A. Pohl, R. Steindl, L. Reindl, IEEE Trans. on Instr. Meas. 48, 1041 (1999).
[7] O. Yilmazoglu, M. Brandt, J. Sigmund, E. Genc, H. L. Hartnagel, Sensor andActuators 94, 59 (2001).
[8] M. Tewes, M. Lohndorf, A. Ludwig, E. Quandt, Technisches Messen 68, 292(2002).
[9] E. Tonuk, Ph. D. Thesis, Middle East Technical University, Ankara, Turkey(1998)
[10] E. Tonuk, Y. S. Unlusoy, Comput. Struct. 79, 1219 (2001).
[11] MSC.MARC Handbook (2000).
[12] U. Gleu, Ph. D. Thesis, Technische Universitat Berlin (2000).
10
��������� ������ ������������ ������ � ���������������
���� !��"�#
$&%('*)+%-,
.0/2143
576+8:9
Fig. 1. The basic concept of the tire sensor detecting physical properties like tirepressure, temperature, friction, and loading. Its signals are send to a receiver andanalyzed by further electronics in the car.
Fig. 2. Schematic of a modenr tire construction. The left photo shows a cut trougha todays pneumatic tire. The schematic on the right discribes the most importantparts considered by the finite element model.
11

a)
b)
Fig. 3. a) Sideview of the tire. b) Cut through the finite element model. The differentmaterials can be identified by colors.
12

Fig. 4. The tire test rig at allows measurement with ≈ 70 km/h and a loading up to3700 N.
0 1000 2000 3000 4000
loading [N]
0
5
10
15
20
defle
ctio
n [m
m]
GT2 2.0 barGT2 2.5 barGT2 3.0 barFEM 2.0 barFEM 2.5 barFEM 3.0 bar
Fig. 5. The load vs. deflection behavior of the GT2 tire in dependence of the tirepressure. The symbols and lines show experimental and FEM results, respectively.
13

a)
load
contact patchb)
-0.15 -0.1 -0.05 0 0.05 0.1 0.15x-direction [m]
-0.31
-0.30
-0.29
-0.28
-0.27
-0.26
y-di
rect
ion
[m]
2.5 bar, 0 N2.5 bar, 2000 N2.5 bar, 4000 N2.0 bar, 0 N2.0 bar, 2000 N2.0 bar, 4000 N
Fig. 6. a) Illustration of the basic idea of the π-sensor. b) The shape of the tire ascalculated with the finite element model for different loads and pressures.
14

a)
-0.2 -0.15 -0.1 -0.05 0 0.05 0.1 0.15x-direction [m]
-1
0
1
2
3
4
5
6
7
8cu
rvat
ure
[1/m
]
2.5 bar, 0 N2.5 bar, 2000 N2.5 bar, 4000 N2.0 bar, 0 N2.0 bar, 2000 N2.0 bar, 4000 N
b)0 0.03 0.06 0.09 0.12 0.15
rolling path [m]
-1.8
-1.5
-1.2
-0.9
-0.6
-0.3
0
sens
or s
igna
l [a.
u.]
2.5 bar, 1056 N2.5 bar, 1680 N2.0 bar, 1056 N2.0 bar, 1680 N
Fig. 7. a) The curvature curves calculated from the simulated data shown in Fig.6b). b) The curvature curves measured with the π-sensor on the test rig.
15
a)0.1 0.2 0.3 0.4
x-direction [m]
-4e+06
-2e+06
0
2e+06
4e+06
stre
ss in
x-d
irec
tion
µ= 0.4µ= 0.8µ= 0.0
b)0.1 0.2 0.3 0.4
path in x-direction [m]
-4e+06
-2e+06
0
2e+06
4e+06
stre
ss in
x-d
irec
tion
0 % slip10 % slip20 % slip
Fig. 8. a) Stress in x-direction at the simple 2D-model without slip. The curvesshow the result for different road conditions (µ-values). The thick lines mark stickingnodes, i.e., the static friction area. b) Stress curves for different slip conditions. Thefriction coefficient was assumed to be µ = 0.4.
16

a)
1.3 1.4 1.5 1.6x-direction [m]
-8×10⁵
-6×10⁵
-4×10⁵
-2×10⁵
0
2×10⁵
4×10⁵
xx-s
tres
s
µ = 0.2µ = 0.55 % slipµ = 0.8
b)
1.3 1.4 1.5 1.6x-direction [m]
-0.04
-0.02
0.00
0.02
0.04
0.06
xy-s
trai
n [m
]
µ = 0.2µ = 0.55 % slipµ = 0.8
Fig. 9. Stress in x-direction a) and xy-strain b) at the 3D-model. The sensor wasassumed to be located inside of the tread. The curves are calculated without slipfor different road conditions and with a slip of 5 % for a µ-value of 0.5.
17