modeling of safety barriers in risk analyses - core · modeling of safety barriers in risk...
TRANSCRIPT

Modeling of Safety Barriers in Risk Analyses
Kjetil Holter Næss
Master of Science in Product Design and Manufacturing
Supervisor: Stein Haugen, IPKCo-supervisor: Astrid Folkvord Janbu, Det Norske Veritas
Department of Production and Quality Engineering
Submission date: June 2012
Norwegian University of Science and Technology


v
Preface
The following report is the dissertation written in partial fulfillment of the MSc program
in mechanical engineering, focusing on Reliability, Availability, Maintainability and Safety
(RAMS) at the Department of Production and Quality Engineering (IPK) at the Norwe-
gian University of Science and Technology (NTNU), in cooperation with Det Norske Veritas
(DNV). The thesis was written during the spring semester of 2012. The topic of barrier
modeling in risk analyses was proposed by DNV and developed further by professor Stein
Haugen at IPK.
Trondheim, June 8, 2012
Kjetil Holter Næss

vi
Acknowledgment
Throughout the process of preparing and writing this report, several people have provided
important input and guidance. I would like to express my appreciation and gratitude to
the following people for their invaluable contributions: First and foremost, I would like to
thank my supervisor at the Norwegian University of Science and Technology, Professor Stein
Haugen, for his help and guidance throughout the process of writing this report. A special
thank you also goes to Astrid Folkvord Janbu, my supervisor at Det Norske Veritas (DNV), for
her assistance and practical guidance. I would like to thank everybody at DNV who provided
additional input, particularly Andreas Falck, Henning Olin, Inger Elise Bjørkedal, Kirstine
Kenich and Sondre Øie, as well as Tom Arne Bakken for making this thesis a possibility. Last
but not least, I would like to thank DNV for the hospitality during my visits to the Høvik
office, as well as practical help with housing during these visits.
K.H.N.

vii
Summary and Conclusions
In recent years, the concept of safety barriers has become increasingly popular in regulations
and standards for the offshore oil and gas industry, both in Norway and internationally.
There are requirements from the Petroleum Safety Authority Norway and operators in the
oil and gas industry that the condition of both technical and human/organizational safety
barriers on installations should be reflected in risk analyses. However, implementing this in
a manner which supports appropriate analysis- and decision making processes has proved
to be difficult. The peformance of barriers is often not explicitly modeled in analyses, and
human/organizational aspects are often not addressed in detail.
This master thesis examines how safety barriers can be modeled in risk analyses, and to
which level of detail this can be achieved. A comprehensive literature review is performed in
order to examine how the concept of safety barriers is defined, and which barrier properties are
used to categorize and measure the performance of barriers. In addition, relevant standards
and guidelines for the offshore oil and gas industry are reviewed in order to identify which
barriers are important for offshore operations. A brief case study of blowouts is performed
to illustrate how safety barriers are implemented on oil and gas installations.
Methods and techniques for modeling safety barriers in risk analyses are reviewed and
presented. The different objectives of risk analysis, and the relevant barrier properties for risk
analyses, are discussed. The tools developed in Barrier and Operational Risk Analysis, Hybrid
Causal Logic in Offshore Risk Analysis and Risk Modelling - Integration of Organizational,
Human and Technical Factors are included in the discussion. The current approach for
quantitative risk analysis in DNV is presented briefly.
Based on these discussions, two main suggestions for improvement are identified:
1. Include relevant barrier functions for each scenario as events in event tree models.
2. When appropriate and practicable, the technical and human/organizational condition of
barriers should be taken into account using fault tree and/or Risk Influence Diagram/
Bayesian Belief Network models.
Safety barriers should be included more consistently in event trees in order to better
illustrate the effect of barriers on major accident risk, and to allow for explicit modeling of

viii
the barrier systems implemented to perform each barrier function. Fault tree and bayesian
belief network analysis can be applied to model both the technical and human/organizational
condition of barrier systems.
It is suggested that simplified methods for adjusting industry average probabilities are
applied for the modeling of risk influencing factors. Because of the massive workload and
amount of data required for detailed statistical modeling of each risk influencing factor, these
simplified methods are considered to be a more feasible alternative.
While it may seem inappropriate to tamper with probabilities which are based on historical
data, it is important to consider whether the historical data accurately reflects the object
under analysis. If conditions deviate from the industry average, industry average numbers
will not reflect the reality of the specific installation. Using adjusted probabilities will be
particularly useful when barriers are found to be in worse condition than than the industry
average, because this means the average frequencies will be artificially optimistic. In this
case, an adjusted probability will be a conservative estimate.
It should be noted that the energy-barrier perspective has received criticism from some
researchers because it is based on linear causal chains, and does not account for complex
interactions in larger socio-technical systems. While the approach does have its shortcomings,
methods based on the barrier approach have proved to be useful and suitable for a number of
applications. The approach is also continuously improved, as manifested by the introduction
of bayesian belief networks in traditional risk analysis.

ix
Sammendrag
Konseptet om sikkerhetsbarrierer har i senere tid blitt gjenstand for økende popularitet i
offshore olje- og gassindustrien bade her hjemme og internasjonalt. Det er krav fra Petroleum-
stilsynet og operatørene i industrien om at tilstand pa tekniske og menneskelige/organisatoriske
sikkerhetsbarrierer skal reflekteres i risikoanalyser. Imidlertid har det vist seg a være vanske-
lig a implementere dette pa en mate som sikrer hensiktsmessige analyse- og beslutningsstøt-
teprosesser. Paliteligheten til barrierer modelleres ofte ikke i detalj i analyser, og menneskelige
og /eller organisatoriske aspekter tas ofte ikke hensyn til i det hele tatt.
Formalet med denne masteroppgaven er a se pa hvordan barrierene kan reflekteres i risiko-
analyser, og pa hvilket detaljeringsniva dette kan gjøres. Et grundig litteraturstudium er
gjennomført for a undersøke hvordan barrierebegrepet er definert, samt hvilke egenskaper
som brukes til a kategorisere og male effekten av sikkerhetsbarrierer. I tillegg er relevante
standarder og retningslinjer for offshoreindustrien gjennomgatt for a undersøke hvilke barri-
erer som beskrives som viktige for offshoreinstallasjoner. Et kort casestudie er gjennomført
for utblasningsulykker, for a illustrere rollene forskjellige barrierer har i praksis.
Metoder og teknikker for modellering av barrierer i risikoanalyser gjennomgas og pre-
senteres. Ulike malsetninger for risikoanalyser diskuteres utifra hvilke beslutningsprosesser
analysene skal støtte. Barriereegenskaper som er viktige for risikoanalysen diskuteres kort.
Verktøyene som er utviklet i prosjektene Barrier and Operational Risk Analysis, Hybrid
Causal Logic in Offshore Risk Analysis og Risk Modelling - Integration of Organizational,
Human and Technical Factors behandles i rapporten. Den naværende fremgangsmaten for
risikoanalyse i DNV presenteres, og pa grunnlag av dette er to forslag for forbedring presen-
tert:
1. Relevante barrierefunksjoner bør inkluderes som egne hendelser i hendelstrær.
2. I sa stor grad som mulig bør den tekniske og menneskelige/organisatoriske tilstanden til
barrierer tas hensyn til, ved hjelp av metoder som feiltrær og/eller risikopavirkningsdi-
agram/bayesianske nettverk.
Barrierefuksjoner bør inkluderes mer konsekvent i analysene. Dette vil tydeligjøre sikker-
hetsbarrierenes rolle i forhold til risiko, og vil tilrettelegge for systematisk modellering av

x
barrierefunksjoner og -systemer. Feiltrær og bayesianske nettverk kan benyttes for a mod-
ellere bade tekniske og menneskelige/organisatoriske faktorer i barrieresystemene.
Forenklede metoder for justering av gjennomsnittlige sannsynligheter basert pa historiske
data er anbefalt for modellering av risikopavirkende faktorer, pa bekostning av detaljert
beregning av hver enkelt faktor. Denne typen justering anbefales fordi bade mengden av
data og arbeid som kreves for detaljert modellering er sa stor at dette vil være vanskelig a
gjennomføre i praksis.
I utgangspunktet kan det virke unaturlig a tukle med sannsynligheter som er basert pa
historiske data, men det er viktig a tenke pa om datagrunnlaget reflekterer situasjonen som
skal beskrives i analysen. Hvis tilstanden pa en installajon avviker fra gjennomsnittet, vil ikke
gjennomsnittsdata reflektere virkeligheten pa installasjonen. Bruk av justerte sannsynligheter
vil være spesielt nyttig dersom barrierer viser seg a være i darligere stand enn gjennomsnit-
tet, ettersom gjennomsnittstall i en slik situasjon vil være kunstig optimistiske. En justert
sannsynlighet vil da være et konservativt estimat.
Det bør bemerkes at energi- og barriereperspektivet har mottatt kritikk fra enkelte forskere
fordi det baserer seg pa lineære arsaksforhold, og ikke tar hensyn til de komplekse arsaks-
forhold som finnes i større sosiotekniske systemer. Selv om perspektivet kanskje kommer til
kort pa enkelte omrader, har metoder basert pa barrieretenking vist seg a være passende
og nyttige for en rekke applikasjonsomrader. I tillegg er prinsippene i stadig forbedring, for
eksempel illustrert ved introduksjonen av bayesianske nettverk i de tradisjonelle metodene.
Contents
Master Thesis Assignment . . . . . . . . . . . . . . . . . . . . . . . . . . . . . . . . . . . i
Preface . . . . . . . . . . . . . . . . . . . . . . . . . . . . . . . . . . . . . . . . . . . . . . v
Acknowledgment . . . . . . . . . . . . . . . . . . . . . . . . . . . . . . . . . . . . . . . . vi
Summary and Conclusions . . . . . . . . . . . . . . . . . . . . . . . . . . . . . . . . . . vii
Summary and Conclusions (Norwegian) . . . . . . . . . . . . . . . . . . . . . . . . . . . ix
1 Introduction 1
1.1 Background . . . . . . . . . . . . . . . . . . . . . . . . . . . . . . . . . . . . . . . . 1
1.2 Problem Formulation . . . . . . . . . . . . . . . . . . . . . . . . . . . . . . . . . . 2
1.3 Objectives . . . . . . . . . . . . . . . . . . . . . . . . . . . . . . . . . . . . . . . . . 2
1.4 Limitations & Scope . . . . . . . . . . . . . . . . . . . . . . . . . . . . . . . . . . . 3
1.5 Approach . . . . . . . . . . . . . . . . . . . . . . . . . . . . . . . . . . . . . . . . . 3
1.6 Structure of the Report . . . . . . . . . . . . . . . . . . . . . . . . . . . . . . . . . 3
2 Safety Barriers 5
2.1 Introduction . . . . . . . . . . . . . . . . . . . . . . . . . . . . . . . . . . . . . . . . 5
2.2 The Safety Barrier Concept . . . . . . . . . . . . . . . . . . . . . . . . . . . . . . . 5
2.3 Barrier Classification . . . . . . . . . . . . . . . . . . . . . . . . . . . . . . . . . . . 8
2.3.1 Categorization by Function . . . . . . . . . . . . . . . . . . . . . . . . . . 8
2.3.2 Categorization by System . . . . . . . . . . . . . . . . . . . . . . . . . . . 10
2.4 Barrier Performance Criteria . . . . . . . . . . . . . . . . . . . . . . . . . . . . . . 12
2.5 Comments . . . . . . . . . . . . . . . . . . . . . . . . . . . . . . . . . . . . . . . . . 13
xi
xii CONTENTS
3 Safety Barriers on Offshore Oil & Gas Installations 15
3.1 Introduction . . . . . . . . . . . . . . . . . . . . . . . . . . . . . . . . . . . . . . . . 15
3.2 Barriers in NORSOK Z-013 . . . . . . . . . . . . . . . . . . . . . . . . . . . . . . . 16
3.3 Barriers in NORSOK S-001 . . . . . . . . . . . . . . . . . . . . . . . . . . . . . . . 20
3.4 Company Internal Guidelines . . . . . . . . . . . . . . . . . . . . . . . . . . . . . . 21
3.5 Human & Organizational Barriers . . . . . . . . . . . . . . . . . . . . . . . . . . . 21
3.6 Case Study: Well Blowout . . . . . . . . . . . . . . . . . . . . . . . . . . . . . . . 22
3.6.1 Introduction . . . . . . . . . . . . . . . . . . . . . . . . . . . . . . . . . . . 22
3.6.2 Accident Scenario & Related Barriers . . . . . . . . . . . . . . . . . . . . 23
3.6.3 Classification . . . . . . . . . . . . . . . . . . . . . . . . . . . . . . . . . . . 26
3.7 Comments . . . . . . . . . . . . . . . . . . . . . . . . . . . . . . . . . . . . . . . . . 27
4 Barrier Performance Modeling in Risk Analysis 29
4.1 Introduction . . . . . . . . . . . . . . . . . . . . . . . . . . . . . . . . . . . . . . . . 29
4.2 Objectives of Risk Analyses . . . . . . . . . . . . . . . . . . . . . . . . . . . . . . . 30
4.3 The Effect of Barrier Properties on Risk . . . . . . . . . . . . . . . . . . . . . . . 32
4.4 Barrier Modeling in Risk Analyses . . . . . . . . . . . . . . . . . . . . . . . . . . . 32
4.4.1 The BORA Project . . . . . . . . . . . . . . . . . . . . . . . . . . . . . . . 33
4.4.2 Hybrid Causal Logic in Offshore Risk Analysis . . . . . . . . . . . . . . . 36
4.4.3 The Risk OMT Approach . . . . . . . . . . . . . . . . . . . . . . . . . . . 40
4.5 Current Practice in DNV . . . . . . . . . . . . . . . . . . . . . . . . . . . . . . . . 42
4.6 Comments and Suggestions . . . . . . . . . . . . . . . . . . . . . . . . . . . . . . . 44
5 Summary 49
5.1 Introduction . . . . . . . . . . . . . . . . . . . . . . . . . . . . . . . . . . . . . . . . 49
5.2 Summary . . . . . . . . . . . . . . . . . . . . . . . . . . . . . . . . . . . . . . . . . 49
5.3 Conclusions . . . . . . . . . . . . . . . . . . . . . . . . . . . . . . . . . . . . . . . . 51
5.4 Recommendations for Further Work . . . . . . . . . . . . . . . . . . . . . . . . . . 53
Appendices 55
A Definitions 57

CONTENTS xiii
B Acronyms 59
C List of Statoil Performance Standards 61
D Suggested Event Tree for Hydrocarbon Release 63
E Pre-Study Report 71
F Progress Report 77
References 83

List of Figures
2.1 Simplified illustration of barriers in the energy model. . . . . . . . . . . . . . . . 7
2.2 Simplified bow-tie diagram. . . . . . . . . . . . . . . . . . . . . . . . . . . . . . . . 9
2.3 Classification of safety barriers. . . . . . . . . . . . . . . . . . . . . . . . . . . . . 11
3.1 BP list of barriers which contributed to the Deepwater Horizon accident pre-
sented as a swiss cheese diagram. . . . . . . . . . . . . . . . . . . . . . . . . . . . 25
4.1 Risk influence diagram. . . . . . . . . . . . . . . . . . . . . . . . . . . . . . . . . . 35
4.2 Example BBN. . . . . . . . . . . . . . . . . . . . . . . . . . . . . . . . . . . . . . . 37
4.3 The HCL framework. . . . . . . . . . . . . . . . . . . . . . . . . . . . . . . . . . . 38
4.4 The basic principles of modeling in Risk OMT (and similarly in BORA) . . . . 42
xiv

List of Tables
3.1 An overview of the safety barriers required by section 7.5 of NORSOK Z-013. . 17
3.2 Barriers mentioned in NORSOK Z-013, ability to intervene in an accident
sequence, and possibility of modeling in a traditional event tree/fault tree
analysis. . . . . . . . . . . . . . . . . . . . . . . . . . . . . . . . . . . . . . . . . . . 19
3.3 Activities during which a blowout may occur. . . . . . . . . . . . . . . . . . . . . 23
3.4 Well barriers for ”Drilling, coring and tripping with shearable drill string” . . . 24
3.5 Reactive barriers related to blowouts during drilling from rig. . . . . . . . . . . 24
3.6 Classification of barrier functions as proactive or reactive. . . . . . . . . . . . . 26
4.1 A suggested distinction between three main categories of QRAs . . . . . . . . . 31
4.2 Generic RIFs categorized by groups in BORA. . . . . . . . . . . . . . . . . . . . 34
4.3 Barriers related to process accidents according to NORSOK Z-013, and how
they are currently treated in DNV QRAs. . . . . . . . . . . . . . . . . . . . . . . 44
xv


Chapter 1
Introduction
1.1 Background
Since the origin of human beings, safety barriers have been used to protect humans and
property from enemies and natural hazards (Sklet, 2006). The notion of safety barriers in
industry is based on the accident theory known as the energy model, pioneered by Gibson
(1961) and Haddon (1980). Since the idea was developed, the safety barrier concept has
evolved from simple physical barriers protecting against harmful energies to include successive
risk reducing measures either of a technical, human or organizational nature. The concept of
safety barriers has become increasingly popular in regulations and standards for the offshore
oil and gas industry, both in Norway and internationally.
There are requirements from the Petroleum Safety Authority Norway (PSA) and operators
in the oil and gas industry that the condition of both technical and human/organizational
safety barriers on installations should be reflected in risk analyses. However, implementing
this in a manner which supports appropriate analysis- and decision making processes has
proved to be difficult. The peformance of barriers is often not explicitly modeled in analyses,
and human/organizational aspects are often not addressed in detail.
1

2 CHAPTER 1. INTRODUCTION
1.2 Problem Formulation
The purpose of this master thesis is to examine how safety barriers can be modeled in risk
analyses, and to which level of detail this can be achieved. The report will examine how
the concept of safety barriers is defined and which types of barriers are most important for
offshore oil and gas installations. The decision-making processes that different risk analyses
should support will be identified in order to evaluate what information the analyses should
contain. Different types of barriers and barrier classification will be discussed and important
properties of barrier performance will be identified. Relevant methods for barrier analysis
and quantification of barrier properties will be presented, and the current QRA approach will
be discussed. Based on this, the report will discuss how the performance of safety barriers
may be quantified and implemented in Quantitative Risk Analyses (QRAs), including both
technical and human/organizational aspects. Possibilities of doing this both within the scope
of existing analyses and other methods will be examined.
1.3 Objectives
The main objectives of the master thesis are as follows:
1. Literature study - What does the safety barrier concept entail? Identify relevant liter-
ature and summarize briefly.
2. Which barriers are relevant for offshore installations? A specific case (a major accident
scenario) is chosen and used as an example. The barriers are classified in different ways
to allow for quantification.
3. Which decision processes affecting barriers should the risk analyses provide input to?
Decisions are classified into groups/categories.
4. What are important properties of barriers which affect the risk/risk analysis?
5. Which of these can be quantified, how can they be quantified, and how can they be
modeled in risk analyses? Possibilities of doing this both within the scope of existing
analyses and other methods shall be considered.

1.4. LIMITATIONS & SCOPE 3
1.4 Limitations & Scope
The following master thesis is developed in cooperation with Det Norske Veritas (DNV)
Safety Risk Assessment, with the objective of examining how barriers can be modeled in
risk analyses. Possibilities of doing this will be examined both within the scope of existing
analyses and other methods. Development of a complete approach for barrier modeling in
risk analyses is, however, not within the scope of this report. While large parts of the report
will provide a general discussion on the topic of safety barriers and risk analysis, the results
of this report will be based on, and reflect, the specific needs of DNV Safety Risk Assessment
QRAs.
The report is based on standards and regulations applicable to the offshore oil and gas
industry on the Norwegian Continental Shelf (NCS), and will be specific to this industry. In
addition, the scope of the report is limited to focus on major accident risk.
1.5 Approach
The report is the result of the following work process:
• A literature study of literature on safety barriers, risk analysis, and relevant standards
and regulations for oil and gas activities on the NCS
• A case study of barriers relating to blowouts
• A review and discussion of relevant approaches for QRA
• Informal meetings and interviews with DNV personnel and review of a typical DNV
QRA
1.6 Structure of the Report
The rest of the report is structured in the following manner: Chapter 2 contains an intro-
duction to the concept of safety barriers, based on a comprehensive literature review on the
subject. Chapter 3 presents a number of important barriers for offshore oil and gas instal-
lations, along with a brief case study of barriers related to blowouts. Chapter 4 examines

4 CHAPTER 1. INTRODUCTION
how barriers can be modeled in risk analyses. Chapter 5 contains a brief summary and the
conclusions of the report, as well as suggestions for further work on the subject.

Chapter 2
An Introduction to Safety Barriers
2.1 Introduction
The concept of safety barriers is relatively well known in the oil and gas industry, and the
industry has seen a considerable focus on safety barriers in recent years. However, the
concept is often loosely defined, and a number of similar concepts exist and are often used
interchangeably when referring to safety barriers. The Management Regulation (PSA, 2001)
contains several references to safety barriers, but the concept itself is not defined in the
regulation. An increased focus on barriers from the PSA, has made the need for a common
definition of safety barriers more obvious. This chapter will present a brief literature survey
on the topic of safety barriers. A selection of literature on the subject will be presented and
discussed. Different ways of categorizing barriers will be presented, as will common properties
related to barrier performance.
2.2 The Safety Barrier Concept
In colloquial speech, the word barrier is often used to dscribe an obstacle, physical or oth-
erwise, which prevents something from happening. A fence is a typical example of a bar-
rier, restricting access to either side. Language differences is often referred to as a non-
physical barrier, preventing communication between people of different nationalities. The
Merriam-Webster online dictionary defines the word barrier in the following two relevant
5

6 CHAPTER 2. SAFETY BARRIERS
ways (Merriam-Webster, 2012):
1. a: something material that blocks or is intended to block passage
b: a natural formation or structure that prevents or hinders movement or action
2. something immaterial that impedes or separates
A safety barrier in industry can be explained as a barrier which prevents an accident
from happening, or reduces the consequences. The introduction of the term safety barriers
is often accredited to the work of Gibson (1961) and Haddon (1970, 1980), who developed
the accident perspective known as the energy-barrier model. The model describes accidents
as the potential consequence of a vulnerable target or asset being affected by the release of a
harmful energy. Barriers were introduced to separate targets from harmful energies, thereby
preventing the harmful energies from affecting the target. This idea is illustrated in figure
2.1. Haddon introduced his famous ten strategies for accident prevention. The ten strategies
focus on eliminating or modifying the hazard, limiting the exposure of the assets or victims
to the hazard (e.g. by physical barriers), and on protecting and rehabilitating the assets or
victims (Haddon, 1970).
Similar approaches, using a number of similar terms have been developed in different
industries. In addition to safety barriers or simply barriers, terms such as countermeasures,
safety functions/systems, safety critical functions/systems, defenses, lines of defense, defense
in depth, levels/layers of protection and safeguards are used in literature (Rausand, 2011;
Sklet, 2006). While all these terms are used to describe the same concept, there are often
slight differences in their definitions. The interchangeable use of many of these different terms
can be a source of confusion. As an illustration, Sklet (2006) notes that the International
Atomic Energy Agency (IAEA, 1999) describes defense in depth as a concept ”. . . centred on
several levels of protection, including successive barriers preventing the release of radioactive
material to the environment. . . ”. This definition mixes together three of the terms presented
above: Barriers are presented as a subset of levels of protection, which itself is used to describe
the defense in depth principle.
Today, the term safety barrier is often used in a broader sense, including virtually any
thinkable measure implemented to reduce the risk related to an activity. Reason (1997)

2.2. THE SAFETY BARRIER CONCEPT 7
Figure 2.1: Simplified illustration of barriers in the energy model. Based on Haddon (1980).
defines barriers (although using the term defences) as ”various means by which ensuring the
safety of people and assets can be achieved”. Hollnagel (2004) even includes what he calls
symbolic and immaterial barriers in his classification of barriers. A symbolic barrier is one
that requires interpretation, such as traffic lights or warning signs. An immaterial barrier
is one that is not physically present, such as supervision or guidelines. The issue of barrier
classification will be discussed further in section 2.3.
The NORSOK Z-013 (2010) standard defines safety barriers in the following way:
• Safety barrier: Physical or non-physical means planned to prevent, control, or mitigate
undesired events or accidents.
Because the term safety barrier may be used in reference to both systems and their
intended functions, it is common to distinguish between barrier function and barrier system
(Sklet, 2006). NORSOK Z-013 (2010) provides the following definitions:
• Barrier function: Function planned to prevent, control, or mitigate undesired or ac-
cidental events. (The standard also uses the term safety function which has similar
meaning.)

8 CHAPTER 2. SAFETY BARRIERS
• Barrier system: System designed and implemented to perform one or more barrier
function (sic).
• Barrier element: Physical, technichal or operational component in a barrier system.
These definitions are almost identical to those proposed by Sklet (2006). PSA (2011)
proposes the terms barrier, barrier function and barrier element. Here, the term barrier
is used to describe a barrier system, while the definitions of barrier functions and barrier
elements are similar to those mentioned above.
2.3 Barrier Classification
In order to distinguish between barriers of different types, and to facilitate barrier managment,
barriers are often categorized based on different properties. Several ways of categorizing
barriers, based on a variety of properties, have been introduced in literature. As shown
by Sklet (2006), some methods categorize barriers based on properties one would normally
attribute to barrier functions, while others categorize barriers based on properties one would
normally attribute to barrier systems. This section will present a selection of ways in which
barrier functions and barrier systems may be categorized.
2.3.1 Categorization by Function
When safety barriers are categorized by function, it is often related to the effect the barrier
function has on the accident scenario. The definition of safety barriers introduced in section
2.2 states that barriers are physical or non-physical means which either prevent, control or
mitigate undesired events or accidents. Using the verbs prevent, control and mitigate to
classify barrier functions is common when the functions are related to an accident or event
sequence (Sklet, 2006). Barriers are often related to the accident model known as the bow-tie
diagram. A bow-tie diagram shows the relationships between a hazardous event (sometimes
called the Initiating Event (IE)), and barriers limiting either its causes or its consequences.
The diagram has its name from its characteristic shape, illustrated in figure 2.2. The bow-tie
diagram shows barriers which reduce the frequency of the event on the left side, and barriers

2.3. BARRIER CLASSIFICATION 9
which reduce the consequences of the event on the right. It is therefore often purposeful to
classify barriers as proactive and reactive (Rausand, 2011). Hollnagel (2004) uses the terms
prevention and protection. The classification of prevent, control and mitigate is based on
the same logic, but reactive barriers have been divided into control and mitigation. Barriers
intended to prevent escalation are classified as control, while barriers intended to reduce the
effects of a hazardous event are classified as mitigation. Sklet (2006) argues that control
functions, which are intended to prevent escalation, can be considered both as proactive and
reactive barriers depending on how the IE is defined.
Figure 2.2: Simplified bow-tie diagram (Rausand, 2011, p. 6).
The ARAMIS-project which focuses on the release of hazardous material goes one step
further, distinguishing between avoidance and prevention on the left side of the bow-tie
diagram, and control and protection on the right side (Andersen et al., 2004). The frequency
of an event can be reduced either by avoiding the hazard completely, or by preventing one
or more of the potential causes of the undesired event. Control refers to barrier functions
which help keep the operating situation in a normal state even if the undesired event occurs,
such as pressure release valves, while protect refers to barrier functions which protect the
environment from the consequences of the hazardous event (Sklet, 2006).
Reason (1997) classifies barriers according to more practical objectives. Seven objectives
are suggested (adapted from Rausand (2011)):
• Create understanding and awareness of local hazards
• Give clear guidance on how to operate safely
• Provide alarms and warnings when danger is imminent

10 CHAPTER 2. SAFETY BARRIERS
• Restore the system to a safe state in an off-normal situation
• Interpose safety barriers between the hazards and the potential losses
• Contain and eliminate the hazards should they escape this barrier
• Provide the means of escape and rescue should hazard containment fail
As such, it could be argued that this classification is more comparable to the ten strategies
for accident prevention introduced by Haddon (1980) than the other classification schemes
presented in this section.
2.3.2 Categorization by System
Taking another look at the definition of safety barriers in section 2.2, safety barriers are
defined either as physical or non-physical means. This is a common classification of barrier
systems. Some authors distinguish between physical and technical barriers on the physical
side (Svenson, 1991, e.g.), and some distiguish between procedural/administrative barriers
and human actions on the non-physical side (Neogy et al., 1996). Others distinguish between
active and passive barriers (Kjellen, 2000; CCPS, 2001, e.g.). Passive barriers are inherent
in the design of the workplace and do not require any sort of activation or utilities, while
active barriers is dependent on an operator, an automated system, and/or other utilities to
perform its function (Rausand, 2011). IEC 61511 (2003) categorizes safety measures as safety
instrumented systems (SIS), other technology-related systems, or external risk reduction
facilities.
Sklet (2006) presents a recommended hierarchy (See fig. 2.3) for classification of barrier
systems based on the classification methods introduced above, among others. As a comment,
barrier systems do not necessarily fall into only one of the suggested categories. Active
barrier systems in particular tend to consist of a combination of both human/organizational
and technical elements.
Hollnagel (2004) proposes a classification based on the nature of the barriers, using four
categories: material, functional, symbolic and immaterial barriers. Material barriers physi-
cally prevent an event from taking place, functional barriers perform an active function (e.g.
a password), symbolic barriers require interpretation (e.g. signs, instructions) and immaterial

2.3. BARRIER CLASSIFICATION 11
barriers are not physically present (e.g. competence, safety principles)(Rausand, 2011).
Other classification schemes include a categorization based on the barriers’ ability to
perform a barrier function on its own. Barriers which are able to completely prevent the
progression of an accident scenario are called full barriers. Barriers which can only partially
prevent the progression of an accident scenario are called partial barriers.
Figure 2.3: Classification of safety barriers. Adapted from Sklet (2006).
In accordance with the defense in depth principle barriers are sometimes classified accord-
ing to the order in which they should be activated in case of an undesired event (i.e. primary,
secondary, tertiary) (Rausand, 2011). The Norwegian Oil Industry Association (OLF, 2001)
distinguishes between global and local safety functions. In addition, barrier systems may be
classified with relation to time. This includes distinguishing between barriers which either
perform their functions continually or on demand (Sklet, 2006). Some barriers are also tem-
porary, which means they are only present or active during specific operations or external
conditions (Hollnagel, 2004).

12 CHAPTER 2. SAFETY BARRIERS
2.4 Barrier Performance Criteria
In his famous swiss cheese model, Reason (1990) describes safety barriers as slices of cheese.
Holes in the slices of cheese represent the idea that a barrier can not be expected to perform
its function with 100% success at all points in time. In order to measure and describe the
ability of a barrier system to perform its intended function, a series of different performance
criteria have been introduced in literature. PSA (2002) suggests that barrier performance
can include, among others, the following properties:
• Capacity
• Reliability
• Availability
• Ability to withstand loads
• Integrity
• Robustness
These criteria can be categorized in three groups. Both availability and reliability describe
the ability of the barrier to function when necessary. Robustness and ability to withstand
loads describe the ablity of the barrier to withstand external impacts and accident loads.
Capacity is a property which describes the ability of the barrier to sufficiently perform its
intended function.
Rausand (2011) presents the following criteria for barrier performance, adapted from
CCPS (1993), Hollnagel (2004) and HSE (2008):
• Specificity: The ability of the barrier to detect and prevent or mitigate the consequence
of a specified hazardous event
• Adequacy: The ability of the barrier to prevent accidents within the design basis and
meet regulatory requirements, as well as the capacity of the barrier
• Independence: Ideally, a barrier should be independent of all other barriers related to
the specific hazardous event
• Dependability: The ability of the barrier to perform its intended function on demand
• Robustness: The ability of the barrier to withstand extreme events, and not be disabled
by the activation of another barrier

2.5. COMMENTS 13
• Auditability: The ability of the barrier to permit periodic validation of the barrier
function (i.e. testing, maintenance)
After a comprehensive literature review of performance attributes, Sklet (2006) proposes
another set of criteria recommended for the characterization of barrier performance. Which
properties are relevant will depend on the type of barrier. The recommended criteria are as
follows:
• Functionality/effectiveness: The ability to perform a specified function under given
technical, environmental, and operational conditions
• Reliability/availability: The ability to perform a function with an actual functionality
and response time while needed, or on demand
• Response time: The time from a deviation occurs that should have activated a safety
barrier, to the fulfillment of the specified barrier function
• Robustness: The ability to resist given accident loads and function as specified during
accident sequences
• Triggering event or condition: The event or condition that triggers the activation of a
barrier
The triggering event or condition is not a property of the barrier itself, but an important
key to understanding how a barrier will function.
2.5 Comments
As the NORSOK standards regulate activity in the Norwegian oil and gas industry, the
definitions described in NORSOK Z-013 (2010) will also be used for the puspose of this
report.
As mentioned in this chapter, the barrier concept is often used in a broad sense, and the
concept can appear rather vague at first glance. As can be seen in section 2.3, a variety
of different measures can fall within the definition of barriers, depending on the author’s
interpretation of the barrier concept. Sklet (2006) suggests that a barrier function should
have a direct and significant effect on risk (i.e. the occurence and consequences of an undesired

14 CHAPTER 2. SAFETY BARRIERS
event), adding that a function which has at most an indirect effect should not be classified
as a barrier function but as a Risk Influencing Factor (RIF). An element in a barrier system
which can not, by itself, fulfill a barrier function is a barrier element. Because it may be
difficult to determine the exact meaning of a direct and significant effect, this report will
suggest a further delimitation of the barrier concept to only apply to functions which can
have a direct effect on the accident event sequence (i.e. the release of energy). This means
that this report will likely treat many non-physical barriers (e.g. organizational/operational
aspects), which are classified as barriers by many authors, as RIFs. Barriers which have
a direct influence on the accident sequence will usually consist of techical systems and/or
human actions.
The continued use of the term safety barrier can be the source of some confusion. Al-
though adequate in daily use, the distinction between barrier function and barrier system
serves no purpose if standards, regulations and risk analyses continue to use the term safety
barrier. In these cases it is unclear whether the term safety barrier refers to a barrier sys-
tem, barrier function, both, or none of these terms. Sklet (2006) relates barriers to actions
or systems, while Hollnagel (1999) states that the term is largely synonymous with barrier
functions in daily language.
A further specification of the exact meanings of the related terms, and a more clear
definition of which safety measures can be classified as barriers and which cannot, is needed
if a common understanding of barriers is to be achieved. While many authors use the word
barrier to describe virtually all types of safety measures, this report will treat barriers as a
specific type of safety measure, which can have a direct effect on an event sequence leading
to an undesired event or accident. This creates a distinction beween barriers and other safety
related measures which both helps identify safety measures wich actually prevent an accident
from happening, and facilitates barrier modeling.

Chapter 3
Safety Barriers on Offshore Oil & Gas
Installations
3.1 Introduction
One of the characteristics of offshore oil and gas operations is the potential for catastrophic
consequences if an accident should occur. A major accident on an offshore installation can
lead to severe losses of both human life and economical resources, as well as significant en-
vironmental consequences. The main focus regarding safety barriers on offshore installations
in this report is therefore on those barriers related to major accident risk. According to
PSA (2011), a barrier strategy should always be based on an initial risk analysis and hazard
identfication in the design phase . This is supported by Sklet (2006) who states that ”a
safety barrier is related to a hazard, an energy source or an event sequence”. This section
will present some of the most important barriers related to offshore oil and gas installations.
Requirements regarding barriers in relevant standards and company specific guidelines will
be examined.
As an example, a brief case study of barriers related to blowouts will be presented. Rele-
vant barriers related to the accident scenario will be identified and discussed.
15

16 CHAPTER 3. SAFETY BARRIERS ON OFFSHORE OIL & GAS INSTALLATIONS
3.2 Barriers in NORSOK Z-013
The NORSOK Z-013 (2010) standard is the standard for risk and emergency preparedness
assessment in the Norwegian petroleum industry. It was developed to support regulations
issued by PSA and the Norwegian Ministry of the Environment regarding risk analysis in
petroleum activities (Rausand, 2011). Clause 5.4 of the standard establishes requirements for
the identification and analysis of IEs and the causes of these in risk analyses. The following
IEs are listed as a minimum to be included in a QRA, as long as the scenarios are relevant
for the specific hazard:
• Process accidents
• Risers/landfall and pipeline accidents
• Storage accidents (of liquid and gas)
• Loading/offloading accidents
• Blowouts and well releases
• Accidents in utility systems (e.g. leaks of chemichals, fires, explosion of transformers
etc)
• Accidents caused by external impact and environmental loads (e.g. collision, falling/swinging
loads, helicopter crash, earthquake, waves)
• Structural failure (including gross errors)
• Loss of stability and/or buoyancy (including failure of marine systems)
For each scenario, a number of important barriers should be in place in order to control
the risk of an accident. A required minimum selection of barriers to be considered in a con-
sequence analysis is listed in section 7.5 of the standard. The required barriers are presented
in table 3.1.

3.2. BARRIERS IN NORSOK Z-013 17
Initiating Events Safety Barriers
Process accidents
DetectionEmergency shutdown system (ESD) and blowdownControl of ignitionControl of spillsEmergency power systemFire and gas systemActive fire protectionPassive fire protectionExplosion mitigation and protection systemsEvacuation, escape and rescueSegregation of main areasStructural integrity and stability
Pipeline and riser accidents
DetectionEmergency shutdown system (ESD) and blowdownControl of ignitionFire and gas systemFire protectionEvacuation, escape and rescueStructural integrity and stability
Accidents in utility systems N/A
Storage accidents*
BundsPassive and active fire protectionPressure relief systemPurge gasWater curtains etc
Blowouts and well releases
Riser marginMud balance systemPressure balance systemDiverter systemControl of ignitionControl of spillsEmergency systems related to well operations anddrillingAnnulus safety valvesBlowout preventer (BOP)X-mas treeDown hole safety valveBarrier functions as for process accidents
External impact - Ship collisions
Planned operational restrictions for vesselsCollision resistance of the facility (including risers)Planned traffic surveillancePlanned emergency preparedness measures
External impact - Falling and swinging loads N/AExternal impact - Other N/AHelicopter accidents N/AMarine hazards N/A
Environmental ConsequencesDetectionDrain system
Table 3.1: An overview of the safety barriers required by section 7.5 of NORSOK Z-013 (2010).N.B. The initiating events do not correspond to those listed in clause 5.4 of the same standard.* Referred to as safety functions, not barriers.
18 CHAPTER 3. SAFETY BARRIERS ON OFFSHORE OIL & GAS INSTALLATIONS
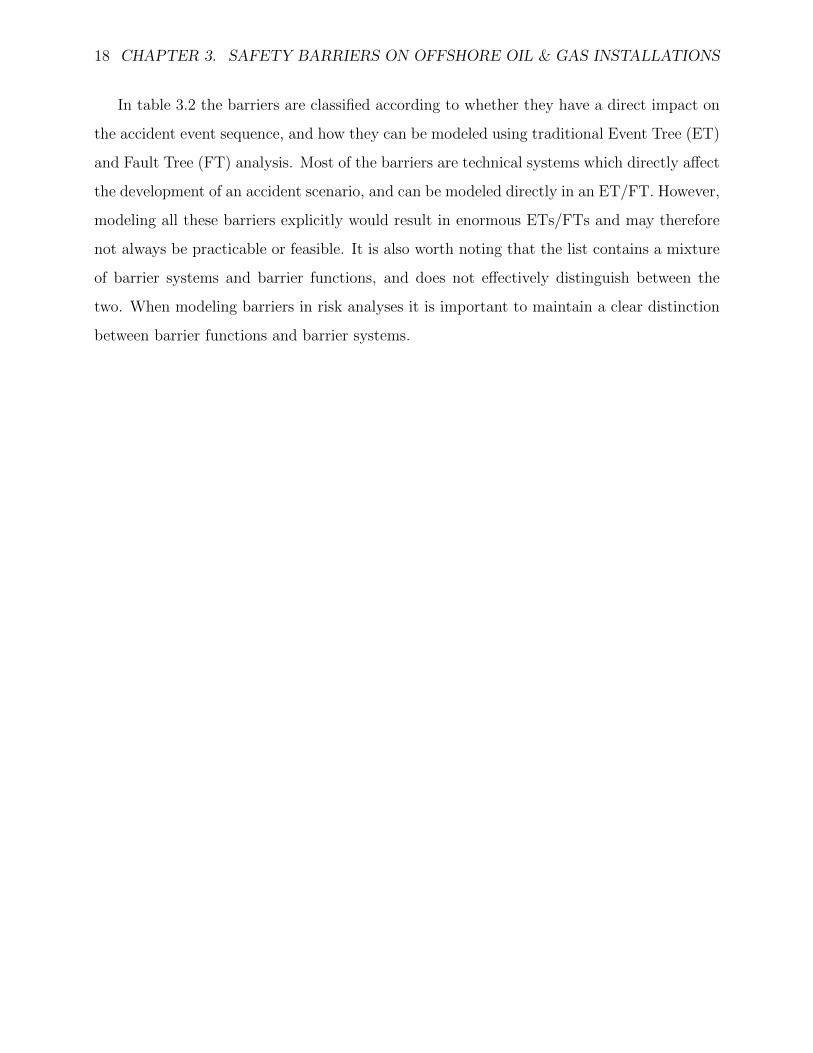
In table 3.2 the barriers are classified according to whether they have a direct impact on
the accident event sequence, and how they can be modeled using traditional Event Tree (ET)
and Fault Tree (FT) analysis. Most of the barriers are technical systems which directly affect
the development of an accident scenario, and can be modeled directly in an ET/FT. However,
modeling all these barriers explicitly would result in enormous ETs/FTs and may therefore
not always be practicable or feasible. It is also worth noting that the list contains a mixture
of barrier systems and barrier functions, and does not effectively distinguish between the
two. When modeling barriers in risk analyses it is important to maintain a clear distinction
between barrier functions and barrier systems.

3.2. BARRIERS IN NORSOK Z-013 19
Safety Barrier Affects Event Seq. ModelingDetection Directly Directly in ET/FTEmergency shutdown system (ESD) and blow-down
Directly Directly in ET/FT
Control of ignition Directly Directly in ET/FTControl of spills Directly Directly in ET/FTEmergency power system Directly Directly in ET/FTFire and gas system Directly Directly in ET/FTActive fire protection Directly Directly in ET/FTPassive fire protection Directly Directly in ET/FTExplosion mitigation and protection systems Directly Directly in ET/FTEvacuation, escape and rescue Directly Directly in ET/FTSegregation of main areas Indirectly RIFStructural integrity and stability Directly Directly in ET/FTAccidents in utility systems N/A N/A (RIF)Bunds Directly Directly in ET/FTPressure relief system Directly Directly in ET/FTPurge gas Directly Directly in ET/FTWater curtains etc Directly Directly in ET/FTMud balance system/Riser margin Directly Directly in ET/FTPressure balance system Directly Directly in ET/FTDiverter system Directly Directly in ET/FTEmergency systems related to well operations anddrilling
Directly Directly in ET/FT
Annulus safety valves Directly Directly in ET/FTBlowout preventer (BOP) Directly Directly in ET/FTX-mas tree Directly Directly in ET/FTDown hole safety valve Directly Directly in ET/FTPlanned operational restrictions for vessels Indirectly RIFCollision resistance of the facility (including ris-ers)
Directly Directly in ET/FT
Planned traffic surveillance Indirectly RIFPlanned emergency preparedness measures Indirectly RIFDrain system Directly Directly in ET/FT
Table 3.2: Barriers mentioned in NORSOK Z-013 (2010), ability to intervene in an accident se-quence, and possibility of modeling in a traditional event tree/fault tree analysis. (N/A: Cannot bedefined as a barrier)

20 CHAPTER 3. SAFETY BARRIERS ON OFFSHORE OIL & GAS INSTALLATIONS
3.3 Barriers in NORSOK S-001
The NORSOK S-001 (2008) standard is the standard for technical safety in the Norwegian
petroleum industry. The standard does not address safety barriers explicitly, but describes
requirements for the management of technical safety regarding implementation of technolo-
gies and emergency preparedness, in order to ensure a sufficient level of safety. The standard
describes the roles, interfaces, required utilities, functional requirements and survivability re-
quirements for 20 different safety systems/functions. The identified safety systems/functions
are:
• Layout
• Structural integrity
• Containment
• Open drain
• Process safety
• Emergency shutdown (ESD)
• Blow down and flare/vent system
• Gas detection
• Fire detection
• Ignition source control (ISC)
• Human-machine interface (HMI)
• Natural ventilation and heating, ventilation and air conditioning (HVAC)
• Public address, alarm and emergency communication
• Emergency power and lighting
• Passive fire protection
• Fire fighting systems
• Escape and evacuation
• Rescue and safety equipment
• Marine systems and position keeping
• Ship collision barrier

3.4. COMPANY INTERNAL GUIDELINES 21
The roles of the safety functions/systems describe the functions that the safety systems
should fulfill, such as minimizing release of hazardous material, minimizing the probability
of ignition or pressure relief. Interfaces are listed if a system/function interacts with one or
more other systems/functions. If the safety system/function is dependent on any utilities such
as uninterruptable power supply, hydraulic power or instrument air, these are listed under
utilities. The functional requirements for each system/function contain general requirements
and requirements for specific safety systems or system elements which must be fulfilled for
the safety system to adequately perform its intended function. Survivability requirements
for the safety functions/systems contain minimum requirements for safety systems or system
elements to ensure that the safety systems will survive the Dimensioning Accidental Loads
(DALs).
3.4 Company Internal Guidelines
Some companies have developed their own guidelines for safety systems and barriers. Norwe-
gian operator Statoil has developed a set of proprietary performance standards for important
safety systems. The Statoil performance standards contain detailed design requirements for
approximately the same safety systems/functions required by NORSOK S-001 (2008) and is
closely related to the Technical Conditions Safety Audit (TTS) approach which is a general-
ized approach for reviewing the technical condition of safety systems based on performance
standards (Thomassen and Sørum, 2002). Statoil uses performance standards for 22 safety
systems and barriers for offshore operations. For comparison with the NORSOK standard,
a full list of Statoil performance standards can be found in appendix C (Statoil, 2009).
3.5 Human & Organizational Barriers
The focus of the standards presented in this report in terms of barriers is almost exclusively on
what is often called technical barriers. However, human and organizational aspects can also
have a significant impact on risk. Human actions can be important parts of barrier systems,
although they rarely fulfill a barrier function on their own. Organizational or operational

22 CHAPTER 3. SAFETY BARRIERS ON OFFSHORE OIL & GAS INSTALLATIONS
factors generally affect the performance of other barrier systems. In this report, these aspects
will typically be considered as RIFs or as barrier elements.
As mentioned in section 2.3, active barrier systems often contain both technical and human
elements. The human elements will often be human actions or inputs, such as processing and
understanding information from a system, or manual activation of a safety system. Common
examples of organizational ”barriers” include maintenance, testing, operational procedures,
operator training and competence.
3.6 Case Study: Well Blowout
3.6.1 Introduction
In order to illustrate the importance of barriers in accident scenarios, this section of the report
will present a brief case study of barriers related to blowouts. The Macondo well blowout, and
subsequent explosion, on the Deepwater Horizon (DWH) drilling rig in April 2010 showed the
world the catastrophic potential of blowout accidents. The failure of safety critical equipment,
combined with a lack of understanding of barrier performance and integrity, was identified
as a direct cause of the accident (DNV, 2011; Tinmannsvik et al., 2011). This section will
present a case study identifying relevant barriers for the prevention of blowouts and related
consequences. The barriers will also be classified according to the theory presented in chapter
2.
Blowouts often occur during well operations performed by a drilling rig or less frequently
from platforms; situations when formation fluids are not intended to escape the well. Bar-
riers related to drilling activities are somewhat different from those related to production
platforms, such as those presented earlier in this chapter. A drilling rig is not intended to
extract and store petroleum products, and while an oil production platform is usually sta-
tionary, a drilling rig is mobile and will be used for different types of drilling operations at
different locations. The risk of a blowout accident is very much dependent on the specifics
of the well operation, in addition to the specifics of the drilling installation. However, the
methodology of classifying and modeling the barriers will be applicable for either type of
accident scenario.

3.6. CASE STUDY: WELL BLOWOUT 23
3.6.2 Accident Scenario & Related Barriers
In an oil or gas well, formation fluids are contained by a series of barriers. If formation fluids
unintentionally start flowing into the well, this is called a kick. A blowout occurs when a kick
cannot be contained by the barriers in place to seal the well, and formation fluids are released
uncontrollably. The technical and physical barriers present in order to prevent a blowout will
vary depending on the type of well operation performed. Holand (1997) describes six types
of blowouts. NORSOK D-010 (2004) uses a different, slightly more detailed set of activities.
Both classifications of blowouts are presented in table 3.3. Shallow gas blowouts, as defined
by Holand, are blowouts occuring at shallow drilling depths when the mud column is the only
barrier preventing an unwanted release.
Holand (1997) NORSOK D-010 (2004)Exploration drilling blowouts which may be: Drilling activities• Shallow gas blowouts Testing activities• Deep blowouts Completion activitiesDevelopment drilling blowouts which may be: Production activities• Shallow gas blowouts Sidetracks, suspension & abandonment activi-
ties• Deep blowouts Wireline operationsCompletion blowouts Coiled tubing operationsWorkover blowouts Snubbing operationsProduction blowouts Under balanced drilling & completion opera-
tionsWireline blowouts Pumping operations
Table 3.3: Activities during which a blowout may occur according to Holand (1997) and NOR-SOK D-010 (2004)
During these operations, the barrier situation may be dynamic or relatively static.
NORSOK D-010 (2004) covers barrier systems related to well integrity (ie. the barriers
which prevent the release of fluids), and groups barrier elements into two barrier systems:
The primary and secondary well barrier. Two independent well barriers has long been a PSA
requirement (Holand, 1997). For simplicity, this case study will focus on just one type of
activity: Drilling, coring and tripping with shearable drill string. The well barriers required
for this type of equipment are shown in table 3.4

24 CHAPTER 3. SAFETY BARRIERS ON OFFSHORE OIL & GAS INSTALLATIONS
Barrier Elements CommentsPrimary Barrier
Fluid columnSecondary barrier
Casing cementCasing Last casing setWellheadHigh pressure riser If installedDrilling blowout preventer (BOP)
Table 3.4: Well barriers for ”Drilling, coring and tripping with shearable drill string” under drillingactivities. Adapted from NORSOK D-010 (2004)
If the drill string cannot be sheared by the BOP, the drill string and stab-in safety valve
will act as elements in the secondary barrier (NORSOK D-010, 2004).These barrier systems
can be defined as frequency-reducing or proactive barriers with reference to a blowout as the
initiating/top event, and fulfill the barrier function containment. As a comment, these barri-
ers fall within a very traditional definition of barriers in that they physically prevent formation
fluids from escaping the well. If these barriers fail and a blowout occurs, consequence-reducing
or reactive barriers will be necessary. A set of reactive barriers found in relevant standards
are presented in table 3.5. The barrier functions identified can be realized by different types
of barrier systems.
Reactive BarriersDiverter system SystemGas detection FunctionIgnition control FunctionFire detection FunctionLayout (Separation) FunctionExplosion protection FunctionActive fire protection FunctionPassive fire protection FunctionControl of spills Function
Table 3.5: Reactive barriers related to blowouts during drilling from rig. Loosely based on NOR-SOK Z-013 (2010); NORSOK S-001 (2008)
After the DWH accident, BP (2010) identified a number of barriers which failed and
contributed to the development of the accident scenario. These barriers are presented in
figure 3.1. The accident occured while the well was being sealed for temporary abandonment,
awaiting completion as the exploration well was being converted to a production well, which
means the well barriers were slightly different than those presented above.

3.6. CASE STUDY: WELL BLOWOUT 25
Figure 3.1: BP list of barriers which contributed to the Deepwater Horizon accident presented as aswiss cheese diagram. BP (2010, p. 32).
The barriers presented in this figure are different than those presented previously in this
section, and is not very intuitive using the logic presented in this report. Rather, it appears
to be presented in the order of the specific nature of the DWH accident sequence. BP lists
Pressure Integrity Testing, Well Monitoring, Well Control Response and BOP Emergency
Operation as critical barriers. These are examples of human/organizational or operational
barriers, which have not yet been addressed in this case study. The operation of the BOP
may certainly have been an important factor in the DWH accident, but the BOP is part of the
mechanical barrier system which is included further to the left in the diagram. The emergency
operation may have affected the performance of the BOP, but can hardly be considered an
independent barrier within the scope of this report. Well monitoring and pressure integrity
testing will not be able to directly affect the frequency or the consequences of a blowout,
but will affect the performance of well barriers and facilitate risk-informed decision-making.
While they are certainly important factors affecting risk, this type of measures does not meet
the critera for being defined as a barrier in this report, presented in chapter 2. They will
therefore not be treated as barriers in this report.
Also, activities related to emergency perparedness such as escape, evacuation and rescue

26 CHAPTER 3. SAFETY BARRIERS ON OFFSHORE OIL & GAS INSTALLATIONS
will affect the likelihood of fatalities, but are not considered barriers for the purpose of this
case study.
3.6.3 Classification
Because the concept of barriers in this report is more narrow than the concept of barriers
used in most modern literature on the subject, a classification of barrier systems based on
the schemes presented in section 2.3.2 will not be particularly meaningful. Many of the
types of barriers mentioned in this section are not considered barriers in the narrow sense
recommended in this report. Rather, this report will focus more on the distinction between
barrier function and barrier systems with relation to risk analysis. It is therefore important to
distinguish between barrier systems and functions, and begin by identifying relevant barrier
functions. Table 3.5 has identified a set of barrier functions, along with one barrier system.
If this system is assumed to fulfill the barrier function pressure relief, the barrier functions
identified in this case study are as follows: containment, pressure relief, gas detection, ignition
control, fire detection, layout (separation), explosion protection, passive fire protection, active
fire protection and control of spills. Barrier functions may be identified either as high-order
functions or low-order functions, as high-order barrier functions can often be broken down
into sub-functions. If there is a desire to avoid large event trees in risk analysis, using barrier
functions of a higher order is recommended. For each barrier function, an analysis of relevant
barrier systems can then be performed at an appropriate level of detail.
Proactive Barriers Reactive BarriersContainment Pressure Relief
Gas detectionIgnition controlFire detectionLayout (Separation)Explosion protectionActive fire protectionPassive fire protectionControl of spills
Table 3.6: Classification of barrier functions as proactive or reactive.
Depending on how barriers are analyzed and how the IE is defined, it may also be helpful
to identify which barriers are proactive and which are reactive. This will also facilitate risk
3.7. COMMENTS 27
analysis in accordance with NORSOK Z-013 (2010), which distinguishes between analysis of
IEs and analysis of consequences. In this case study, the blowout was identified as the IE.
The proactive and reactive barrier functions for this scenario are listed in table 3.6
3.7 Comments
The standards presented in this chapter present a list of important barrier functions and
barrier systems that will normally be found on offshore installations, as well as a small case
study related to blowouts. There is an evident focus on technical barriers in the standards,
and the human/organizational perspective is not emphasized. The lists also contain both
barrier functions and barrier systems, with no apparent distinction between them. This
can cause considerable confusion, which could be prevented if theory and practice in these
standards were made more consistent. In risk analysis, a functional requirement will often
be given for barrier function which can be included in relatively simple event trees. These
functions can be divided into sub-functions and be realized by a number of barrier systems.
A clean-up of NORSOK Z-013 (2010) in particular, consistent with the definitions of barrier
functions and system, could be in place. Requirements for barrier functions to consider in a
QRA could be listed for each scenario. Where a certain barrier system is of special importance
this could be stated, but the system should always be related to a barrier function to avoid
confusion.
This chapter has presented a selection of important safety barriers for offshore oil and
gas operations. However, because the classification of barrier functions and systems depend
heavily on the definitions of the barrier concept and accident scenarios, this selection should
not in any way be considered as a complete list of important barriers. For each specific instal-
lation or operation, the specific risk should always be considered, and appropriate barriers
should be applied. It is important to note that different barrier systems may be suitable
given the characteristics of each specific installation.

28 CHAPTER 3. SAFETY BARRIERS ON OFFSHORE OIL & GAS INSTALLATIONS

Chapter 4
Barrier Performance Modeling in Risk
Analysis
4.1 Introduction
In chapter 2 and chapter 3 of this report, a basic understanding of the roles of safety barriers
on offshore installations was established. This chapter will address the issues related to
accounting for safety barriers in QRAs. At first, in order to establish the requirements of
the QRAs performed, common objectives of risk analyses will be identified and discussed.
Important barrier properties which contribute to risk will also be identified. How barriers
can be made more visible in risk analyses (i.e. how the QRA can be structured to include
safety barriers more explicitly) and how these barriers can be analyzed quantitatively will
be discussed. Special attention will be given to how the technical and human/organizational
condition of barriers can be taken into account in the QRAs. A selection of methods for
analysis and quantification of barrier performance will be reviewed and discussed briefly.
The results of this review will then be compared with the current practice in DNV Safety
Risk Assessment, and comments and suggestions for improving the current QRA methodology
with respect to barriers will be presented.
29
30 CHAPTER 4. BARRIER PERFORMANCE MODELING IN RISK ANALYSIS
4.2 Objectives of Risk Analyses
NORSOK Z-013 (2010) defines the following general objectives for risk analyses:
• identify hazardous situations and potential accidental events
• identify initiating events and describe their potential causes
• analyse accidental sequences and their possible consequences
• identify and assess risk reducing measures
• provide a nuanced and overall picture of the risk, presented in a way suitable for the
various target groups/users and their specific needs and use
In addition to this, QRAs can be performed with a number of different objectives, for a
number of different applications. Depending on which decision making processes an analysis
should support, the analysis should be tailored to provide the information which will facilitate
those processes. For offshore oil and gas installations, the scope of an analysis will often be
limited (e.g. with respect to life-cycle phases, specific operations or specific equipment). Risk
analyses can be performed during the design phase, during operation, for special operations
or interventions (repair etc) where there will be an altered risk picture, or decommissioning.
If a QRA is performed of an installation in the design phase, it will have a predominant
focus on technical issues and design parameters in order to provide support to the design
process. A QRA of an installation in the operational phase will require an increased focus on
technical and operational conditions on the specific installation, in order to provide input to
operational safety processes. This report suggests a distinction between three main categories
of QRAs, described in table 4.1.
Section 5.2 of NORSOK Z-013 (2010) describes the process of defining the objectives and
scope of a QRA, and how this should be reflected in the analysis. Typical main objectives of
QRAs performed by DNV for customers operating on the NCS include the following:
• To identify major hazards of the present design that may constitute a risk to personnel,
main safety functions, the environment or assets.
• To establish a total risk picture, expressed in terms of personnel, impairment of main
safety functions, frequency of oil spill to the environment and asset loss.

4.2. OBJECTIVES OF RISK ANALYSES 31
• To compare and assess the risk versus Norwegian Authority Requirements and Company
requirements.
• To provide DALs as input to the platform design process.
• To provide advice to customer on potential risk reducing measures.
These objectives are deemed to be representative for the bulk of QRAs performed by
DNV Safety Risk Assessment, and this type of analysis will be used as a basis for discussion
in this chapter. However, the third objective is found to be somewhat beside the scope of
this report, and will not be treated in detail.
The first objective can be met in a qualitative or semi-quantitative manner, by identifying
obvious major hazards and/or relative differences between the contribution to risk of different
hazards. This will not necessarily require a high level of detail, as the important outcome is to
identify the major risk contributors and areas for improvement. The most detailed analysis
will be required to meet the second and third objectives, which include the calculation of
important risk-related indicators and comparing these with legal requirements. However, the
level of detail will often be limited by the scope and objectives of the analyses, among other
factors. While modeling can be done at a very high level of detail, it may not be feasible to
create such models which represent the total risk picture of an installation. In practice, a
trade-off between sufficient detail and computational ability, resources, and/or available data
usually has to be made. Different modeling tools are suitable for different types of analyses,
and the appropriate tools should be selected based on the data and resources available, the
required level of detail and the objectives of each analysis (Røed et al., 2009).
Design Phase QRA Operational Phase QRA Situational QRAShould give design support: Usually assesses the risk level Usually either an analysis of aAssess whether the design is safe(ie. within legal requirements),highlight areas which particu-larly affect risk, determine designloads etc.
of an installation in operation,and should take the specific tech-nical and operational conditionof the installation into account
specific operation or specificequipment, or an update of aQRA due to a change in riskpicture (e.g. installation of newequipment, defective barrier sys-tems/elements)
Table 4.1: A suggested distinction between three main categories of QRAs

32 CHAPTER 4. BARRIER PERFORMANCE MODELING IN RISK ANALYSIS
4.3 The Effect of Barrier Properties on Risk
In a strict sense, every property related to a barrier can be argued to have an effect on risk,
either directly or indirectly. In a QRA, the risk usually determined based on the probability
of barrier functions being fulfilled by barrier systems, for instance using the performance
measures described in chapter 2. Ultimately, these likelihoods form the basis of a QRA. It
is important that the different performance measures are taken into consideration. As an
example, the reliability of a gas detection system will describe the probability of the system
being in working order. However, a working gas detection system will only detect a leak if a
sufficient amount of gas reaches the sensors. In order to obtain these figures, we may have
to use models which describe how barrier systems work and how they might fail. This can
include traditional failure analysis, RIF analysis and/or fire and gas modeling (e.g. using
Computational Fluid Dynamics (CFD)). Depending on the level of detail in the analysis,
generic failure data will often be used in place of detailed modeling of the failure mechanisms
of barrier systems. In operational phase QRAs, an important yet challenging objective is to
include the effect that RIFs have on barrier performance. Possible methods for doing this
will be discussed later on in this chapter.
While it can be argued that barriers may actually also introduce risk to a system, it will
be assumed for the purpose of this report that the effect barriers have on risk is limited to
risk reduction. Properties such as those proposed by Sklet (2006) and presented in chapter 2
will affect the probability of a barrier system performing its barrier function in an adequate
manner. If barriers are to be included in a QRA, it is these probabilities which will be relevant
for the modeling of accident scenarios.
4.4 Barrier Modeling in Risk Analyses
Traditionally, a QRA is performed by modeling total risk as the combined likelihood of a
set of accident scenarios, which in turn are modeled based on the bow-tie principle. This
is also how risk analyses are performed in accordance with NORSOK Z-013 (2010). Ac-
cident scenarios are usually modeled using traditional ET/FT methods. ETs are used to
represent the accident scenarios, while FTs usually describe the failure modes of technical

4.4. BARRIER MODELING IN RISK ANALYSES 33
systems. Failure frequencies (e.g. leak data) for different equipment types are usually based
on generic industry averages, multiplied by the number of equipment units on the specific
installation. In recent years, a number of QRA approaches have been developed which in-
clude human/organizational factors as well as the technical properties of barriers. Three
similar and somewhat related approaches will be presented in this section: Barrier & Oper-
ational Risk Analysis, Hybrid Causal Logic in Offshore Risk Analysis and Risk OMT. The
applicability of these methods for DNV QRAs will be discussed further in section 4.6.
4.4.1 The Barrier & Operational Risk Analysis Project
The Barrier and Operational Risk Analysis (BORA) Project was an extensive research project
on barriers and operational risk analyses carried out between 2003 and 2006. The project
focused on hydrocarbon release, and attempted to develop a methodology for barrier analysis
addressing some of the issues presented in section 1.1 of this report. A detailed description
of the generalized methodology can be found in Vinnem et al. (2009).
According to Vinnem et al. (2009), around half of the hydrocarbon leaks on the NCS oc-
cur as a result of human interventions where barriers are either inhibited or deactivated. The
intention of the BORA approach is therefore to consider how deviations from normal oper-
ation, including human intervention, may affect barrier performance and cause hydrocarbon
leaks.
The BORA methodology differs from traditional analysis in that it views initiating events
as conditions deviating from normal, either technically or organizationally, in place of the
traditional IE ”hydrocarbon release”. The starting point of the model is a set of generic
work operations and equipment types, such as ”corrective maintenance on depressurized
hydrocarbon containing equipment”. A set of errors related to these working operations
are defined as the IEs. The IEs can be related directly to the manual intervention or to
technical causes (e.g. ”incorrect fitting of flanges or bolts during replacement of a flange
gasket”, or ”degradation of flange gasket”). Barriers which are intended to prevent the IE
leading to a hydrocarbon release are modeled in Barrier Block Diagrams (BBDs). BBDs are
diagrams similar to ETs, in which all nodes represent barrier functions realized by barrier
systems (Vinnem et al., 2009). The modeling principles of BORA is similar to those used in

34 CHAPTER 4. BARRIER PERFORMANCE MODELING IN RISK ANALYSIS
Risk OMT, which will be presented in section 4.4.3 (see fig. 4.4).
Barrier performance is modeled using FT analysis, where the top event is defined as a
failure or degradation of a barrier system. These failures are categorized in three groups:
insufficient or inadequate functionality, technical failures and human errors. Often, industry
average frequencies or probabilities of IEs and basic events in FTs can be found in data
sources. In order to reflect the specific nature of each installation, the probability of the IEs
and basic events are influenced by a set of RIFs. RIFs are modeled using risk influence dia-
grams which were developed as part of the BORA project. The generic RIFs are categorized
in five groups. The RIFs associated with each group are shown in table 4.2. Different RIFs
will be relevant for the different generic IEs.
RIF Groups Generic RIFsPersonal characteristics Competence
Working load/StressFatigueWork environment
Task characteristics MethodologyTask complexityTime pressureToolsSpares
Characteristics of the Equipment designtechnical system Material Properties
Process complexityHMI (labels, alarms, ergonomic factors)Maintainability/accessibilitySystem feedbackTechnical condition
Administrative control ProceduresDisposable work descriptions
Organizational factors/ ProgramsOperational philosophy Work practice
SupervisionCommunicationAcceptance criteriaManagement of changes
Table 4.2: Generic RIFs categorized by groups in BORA (Aven et al., 2006a).
For each IE and basic event, Risk Influence Diagrams (RIDs) are used to model the effect
of the RIFs on the event in question (see fig. 4.1). In order to assess the RIFs, each RIF is
given a score. The scoring system is based on the TTS approach (Thomassen and Sørum,
2002), with scores ranging from A to F where A is the best industry standard and F is worst

4.4. BARRIER MODELING IN RISK ANALYSES 35
practice. The scoring can be based on different sources, such as expert judgement or TTS
data.
In order to determine the effect each RIF has on the event, the RIFs are weighted according
to the relative difference between the frequencies or probabilities of the basic event if the RIFs
score is changed from the best standard to worst practice (Aven et al., 2006a,b). This is done
based on expert judgement. The most important RIF is given a weight of 10, and the rest
is given relative weights compared to this, on the scale 10-8-6-4-2. The weights are then
normalized so the sum of weights is equal to 1.
Figure 4.1: Risk influence diagram (Aven et al., 2006b).
The RIFs can then be used to adjust the industry average frequencies identified in the
analysis using the following equation:
Pr ev (A) = Pave (A)n∑
i=1wi Qi (4.1)
Where Pr ev (A) is the revised probability of event A, Pave (A) is the industry average
probability, wi is the respective weights of the RIFs, and Qi is an expression reflecting the
score of each RIF. In the BORA methodology a triangular distribution is assumed for each
RIF, where Qi is Plow /Pave for the best standard, Qi is 1 for the industry average, and Qi is
Phi g h/Pave for worst practice. Here, Phi g h and Plow are the highest and lowest imaginable
probabilities or frequencies as decided by expert judgement. The revised probabilities or
frequencies can then be included in the risk model.
The BORA approach as an alternative to traditional QRAs has both strengths and weak-
nesses. The most important difference from the traditional approach is the modeling of IEs

36 CHAPTER 4. BARRIER PERFORMANCE MODELING IN RISK ANALYSIS
as a function of the number or manual operations performed on the equipment. As a signifi-
cant part of leaks on the NCS occur during this type of operations, this approach appears to
have significant potential. This is, however, somewhat outside the scope of this report which
will discuss the treatment of barriers. As part of its generalized methodology, the BORA
approach uses BBDs to model barriers between the IE and the end state, which is hydrocar-
bon release. Using barrier functions realized by barrier systems in the ET provides a robust
approach to accident modeling, less dependent on the actual event sequence of the accident.
BORA provides a relatively simple, generalized methodology for adjusting industry average
frequencies based on installation-specific survey data or expert judgement, with RIFs in-
cluding both technical and human/organizational factors (Aven et al., 2006b). However, the
adjustment scheme will be based on assumptions about the distribution of the RIFs which,
while intuitive, may have a weak relation to actual risk. In addition, the BORA approach
describes only one level of RIFs, and RIFs which influence other RIFs are not included.
It should be noted that BORA is an approach specifically designed for calculating leak
frequencies based on a set of generic scenarios, and is therefore not applicable for other QRA
purposes. In addition, some of the operational barriers included in the BORA approach
might not fall within the strict definition of safety barriers suggested in this approach. This
does not mean that the modeling approach introduced by BORA is incompatible with the
ideas of this report, but simply that the concept of barriers is slightly different.
4.4.2 Hybrid Causal Logic in Offshore Risk Analysis
A Bayesian Belief Network (BBN) is a network of nodes connected by arrows which indicate a
statistical influence on the following node. BBNs have become more popalur in recent years,
because of their ability to model non-deterministic causal relationships such as human and
organizational factors. However, the use of BBNs in practice has been limited because of
the significant amount of conditional probabilities required to calculate even relatively small
networks (Røed et al., 2009). Large BBNs are challenging both in terms of describing the
relationships between RIFs and in terms of computational ability. BBNs will not be explained
in detail in this report, but information on the subject is readily available in literature (Jensen,
2001; Rausand, 2011, etc.). A small example of a BBN is presented in fig. 4.2.

4.4. BARRIER MODELING IN RISK ANALYSES 37
Figure 4.2: Example BBN (Røed et al., 2009).
In order to combine the modeling ability of BBNs and the intuitiveness and relative
simplicity of ET/FT methods, a framework known as Hybrid Causal Logic (HCL) has been
developed (Wang, 2007; Mohaghegh et al., 2009). The HCL framework consists of three
integrated levels of analysis, illustrated in figure 4.3 (Wang, 2007):
1. Analysis of the accident scenario, using ET or Event Sequence Diagram (ESD) methods
2. Analysis of the system failures identified in the ESD, using FTs
3. Analysis of potential human and organizational factors which may contribute to the
likelihood of events in the ET or failures in the FTs, through the use of BBNs.
Røed et al. (2009) proposes an adapted framework for the offshore oil and gas industry
based on HCL. The method attempts to reconcile parts of the BORA approach and the
TTS approach with the HCL framework. The TTS method is suggested for determining the
states of the RIFs in the BBNs. The Operational Condition Safety (OTS, Sklet et al., 2010)
approach was not part of the study, but is suggested as a possible method for determining
the states of operational RIFs. Røed et al. (2009) proposes and describes a six-step process
for applying HCL in the offshore industry:
1. Define RIFs and causal relationships for the relevant basic events of FTs
2. Identify concurrent RIFs
3. Build a BBN
4. Assign conditional probability tables
5. Evaluate performance, and assign a state for (some) RIFs
6. Calculate results
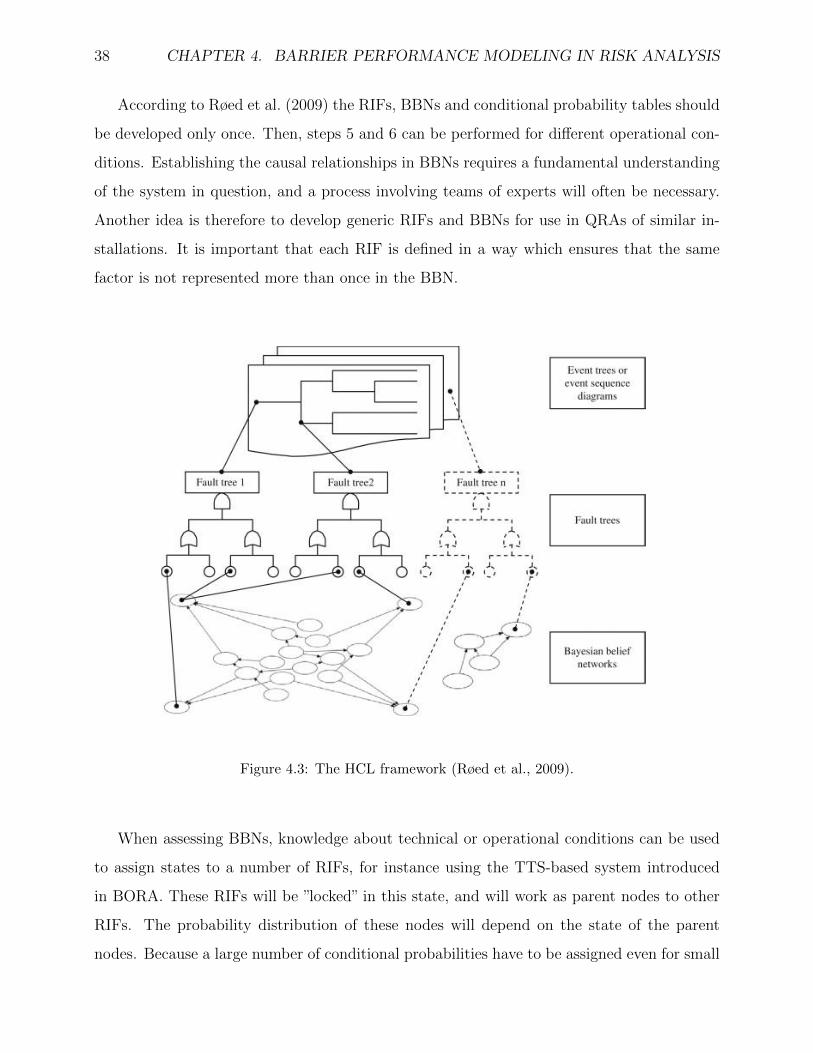
38 CHAPTER 4. BARRIER PERFORMANCE MODELING IN RISK ANALYSIS
According to Røed et al. (2009) the RIFs, BBNs and conditional probability tables should
be developed only once. Then, steps 5 and 6 can be performed for different operational con-
ditions. Establishing the causal relationships in BBNs requires a fundamental understanding
of the system in question, and a process involving teams of experts will often be necessary.
Another idea is therefore to develop generic RIFs and BBNs for use in QRAs of similar in-
stallations. It is important that each RIF is defined in a way which ensures that the same
factor is not represented more than once in the BBN.
Figure 4.3: The HCL framework (Røed et al., 2009).
When assessing BBNs, knowledge about technical or operational conditions can be used
to assign states to a number of RIFs, for instance using the TTS-based system introduced
in BORA. These RIFs will be ”locked” in this state, and will work as parent nodes to other
RIFs. The probability distribution of these nodes will depend on the state of the parent
nodes. Because a large number of conditional probabilities have to be assigned even for small

4.4. BARRIER MODELING IN RISK ANALYSES 39
BBNs, a semi-mechanistic method of assigning these probabilities is proposed by Røed et al.
(2009). A probability distribution is assumed, where the probability of the RIF being in a
state j is expressed as:
P j = e−R Z j∑ fj=a e−R Z j
P j ∈ [0,1] (4.2)
Here, Z j is a measure reflecting the distance between the RIF in question and the weighted
average state of the parent RIFs, expressed as:
Z j =n∑
i=1|Zi j |wi Z j ∈ [0,6] (4.3)
Where Zi j is the distance (i.e. number of states) between the parent node and the RIF
in question. wi is the weight of the parent RIF i, assigned using the same approach as in
BORA (see sec. 4.4.1).
R in eq. 4.2 is a shaping factor. The distribution will become narrower as R increases.
A method for assigning a value to R based on expert judgement is suggested by Røed et al.
(2009).
The approach for adjusting generic probabilities introduced in BORA is suggested for cal-
culating the probablility of the binary events (i.e. events in the ET/FT structure). However,
because the probability of the binary events are conditional on the states of the RIFs, the
calculation of the revised probability is slightly different:
Pr ev = Pbasi s
n∑i=1
wi
f∑k=a
Pi kQi k P j ∈ [0,1] (4.4)
Here, Pi k are the probability of RIF i being in a state k, and Qi k is the adjustment factor
used in the BORA approach.
The HCL approach takes advantage the strengths of BBNs without having to face the
challenges related to full BBN implementation for accident scenarios. The use of BBNs in RIF
models enables a more detailed analysis of RIFs than the RIDs used in BORA, as interactions
between RIFs can be included in the model. A problem with the hybrid approach is that when
small BBNs are assumed to influence basic events independently, the same RIFs will often

40 CHAPTER 4. BARRIER PERFORMANCE MODELING IN RISK ANALYSIS
be used in several BBNs. This creates dependencies between events which are not accounted
for statistically in the model. To avoid this, a few larger BBNs should be developed which
are linked to several events in the ET/FT structure (Røed et al., 2009). Algorithms and
techniques for the calculation of hybrid models, which account for these dependencies, have
been developed as part of the HCL approach (Groth et al., 2010; Mohaghegh et al., 2009).
In general, the exact approach will give a more conservative estimate, and will amplify the
effect of the RIFs on risk compared to the simplified approach (Vinnem et al., 2012).
4.4.3 The Risk OMT Approach
The Risk OMT (Risk Modelling - Integration of Organizational, Human and Technical Fac-
tors) approach is a further development of the BORA approach, including elements from the
HCL approach and the OTS program (Vinnem et al., 2012). A comprehensive approach for
modeling leak frequencies is developed, through the identification of generic scenarios related
to work operations, as introduced in BORA. One of the biggest differences between BORA
and Risk OMT is the introduction of BBNs in RIF modeling. With its relation to the OTS
approach, Risk OMT has a more detailed focus on the effect of human and organizational
factors than BORA. Scenarios are modeled using BDDs and FTs like in BORA, but these are
developed with a more elaborate and detailed focus on human error and operational barriers
(see fig. 4.4).
Two modeling approaches are suggested by Vinnem et al. (2012). One is similar to that
described by Røed et al. (2009), while the other approach describes a method of combining
the FT and BBN logic of HCL in one large BBN . Barrier systems are initially modeled
using FT analysis, and BBNs describe the effect of RIFs on the basic events. The FTs in
Risk OMT are generally given the top event ”failure or degradation of . . . the barrier system”,
which is then classified in two groups (Vinnem et al., 2012):
• Inadequate or insufficient functionality of the barrier system
• Human failure
The taxonomy of human failures used in Risk OMT is based on the theories of Reason
(1990), and covers violations, mistakes and slips and lapses. These failures are called failures

4.4. BARRIER MODELING IN RISK ANALYSES 41
of execution, while failures of omission describe activities which are simply not carried out.
The process of developing this taxonomy is described in section 3 of Vinnem et al. (2012).
A BBN model is suggested with RIFs structured in two levels, where the first level RIFs
have a direct influence on binary events and second level RIFs influence the factors on the first
level. The RIFs for all the generic scenarios in the method are grouped into two generic RIF
structures: One for planning activities and one for execution and control activities. However,
the generic structures may have to be adapted somewhat for each scenario. The same scoring
practice is used as in BORA (taken from OTS and TTS), assigning scores from A to F, using
these scores to update the probability distributions of RIFs.
Risk OMT represents an improvement of the BORA approach with respect to the detailed
modeling of human and operational factors. With its extensive use of BBNs, and human and
operational failure data, it also requires significantly more work than the BORA method. If
the distributions of each RIF is assigned individually, for instance using bayesian updating,
the work load will also be considerably higher than that introduced for the HCL approach
by Røed et al. (2009). The application of Risk OMT is limited to the calculation of leak
frequencies focusing on human and operational factors, but the approach introduces methods
for analyzing barrier performance and RIFs which can potentially be extended to other
purposes. As an example, similar methods could be developed which take into account the
effect of operational RIFs on technical barrier systems.

42 CHAPTER 4. BARRIER PERFORMANCE MODELING IN RISK ANALYSIS
Figure 4.4: The basic principles of modeling in Risk OMT (and similarly in BORA). (Vinnem et al.,2012).
4.5 Current Practice in DNV
In accordance with regulations for operations on the NCS, risk analyses in DNV are performed
using the general methodology and process described by NORSOK Z-013 (2010). Accident
scenarios are developed using ETs, and fire and explosion scenarios are modeled using CFD,
or simplified modeling tools. A typical event tree in a QRA is developed to be applicable for
a class of accident scenarios. For instance, a single ET will be developed for process accidents
initiated by hydrocarbon release. Similar ETs can be used for process accidents, riser and
pipeline accidents and blowout accidents. An ET like this will generally contain the following
or similar branches:
• Leak (IE)
• Immediate ignition
• Early detection
• Delayed ignition
• Explosions escalating to other areas
• Explosions escalating to other equipment given no escalation to other areas

4.5. CURRENT PRACTICE IN DNV 43
• Isolation failure
• Escalation to Equipment
• Escalation to adjacent areas
Here, early detection and isolation represent barrier functions. Other barriers are usually
covered more indirectly, or assumptions are made regarding their functionality. As an ex-
ample, leak frequencies are based on reliability data for hydrocarbon containing equipment
which fulfill the barrier function containment. Table 4.3 describes how the safety barriers re-
lated to process accidents in NORSOK Z-013 (2010) are currently treated in QRAs. Usually,
the most important technical barriers are accounted for, at least implicitly, while operational
factors are not accounted for.

44 CHAPTER 4. BARRIER PERFORMANCE MODELING IN RISK ANALYSIS
Safety Barrier Treated in QRADetection Gas detection modeled as part of igni-
tion modeling (e.g. using CFD) andtakes into account amount of detectorsetc. It is often assumed that leakswill be detected either automatically ormanually. Detection is normally as-sumed for fires.
ESD and blowdown Modeled as barriers both with respectto reliability, response time etc.
Control of ignition Part of ignition probabilities. Includesno. of ignition sources, shut-down timeetc
Control of spills Taken into account for environmentalrisk, and in pool size calculations forfire/explosion modeling
Emergency power system N/AFire and gas system Ventilation included in CFD models
(For other systems, see detection andactive/passive fire protection)
Active fire protection Often not included due to PSA require-ments for DAL calculation, but can bemodeled including reliability, capacityetc.
Passive fire protection Included in CFD models and escalationprobabilities
Explosion mitigation and protection Included in CFD models and escalationprobabilities
Evacuation, escape and rescue N/ASegregation of main areas Included in CFD models and escalation
probabilitiesStructural integrity and stability Usually not modeled ind detail, but as-
sumptions for the integrity of structuresare included
Table 4.3: Barriers related to process accidents according to NORSOK Z-013 (2010), and how theyare currently treated in DNV QRAs.
4.6 Comments and Suggestions
While most barrier functions are accounted for at least partly in DNV QRAs, not all barriers
are modeled with the same level of detail. Some barriers are only accounted for in con-
sequence modeling, while assumptions are made for the reliability and functionality of the
barriers. Many types of barrier systems usually have a very low probability of failure, and
the probability of success of these barriers is often assumed to be one. This might not always
be a sound assumption, especially in the operational phase when barrier systems may have
deteriorated. Other barriers are taken into account in risk models, but this is not visible from

4.6. COMMENTS AND SUGGESTIONS 45
the ET scenarios. The QRAs in general, and ETs in particular, could be designed to provide
more information about the impact of safety barriers on major accident risk. In order to
include the effect of different barriers in the ET models, the first suggestion for improvement
identified in this report can be defined as:
1. Include relevant barrier functions for each scenario as events in ET models.
By including barrier functions more systematically as nodes in the ETs, a much more
robust scenario model can be developed. The end states developed will be dependent on
the success or failure of relevant safety barrier functions, providing a more nuanced risk
picture. Inferences can be drawn about the importance of barriers simply by looking at the
ET, and changes in the barrier situation (e.g. loss of a barrier function/system) can easily
be accounted for in the ET model. As an example of how this can be done, a new tree for
process accidents is proposed and illustrated in appendix D. When creating ETs with barrier
functions as nodes, the risk analyst should be aware that dependencies may be introduced if
the same barrier system contributes to more than one barrier function in the ET.
These ETs will account for barriers on the right side of the bow-tie model. Depending on
the definition of the IE, barriers on the left side of the bow-tie can also be modeled explicitly.
As an example, BORA describes how barriers can be taken into account for hydrocarbon
release rates, and FT models for well barriers can be used to synthesize blowout frequencies.
Another advantage of including safety barriers explicitly in ETs is that it allows for system-
atic modeling of safety barrier performance, including both technical and human/organizational
factors. A combination of FTs and RIDs/BBNs can be used to model the performance and
condition of the barrier systems which realize each barrier function.
The level of detail of these models can be adjusted based on the specific requirements
and objectives of the QRA. In some cases, additional modeling may not be necessary and a
standard event frequency can be applied. If there is uncertainty related to the appropriateness
of these frequencies, further analysis can be performed. Methods such as those described in
the HCL approach proposed by Røed et al. (2009) or in BORA can be applied to account
for both technical and human/organizational factors. This may be particularly useful in
the operational phase, when there is a need to model the specific technical and operational
46 CHAPTER 4. BARRIER PERFORMANCE MODELING IN RISK ANALYSIS
condition of barriers on an installation. The second suggestion for improvement identified in
this report will be the following:
2. When appropriate and practicable, the technical and human/organizational condition
of barriers should be taken into account using FT or RID/BBN models.
Approximate methods for adjusting standard frequencies, such as that proposed by Røed
et al. (2009), are recommended as a feasible addition to the current QRA approach. While
not as accurate as the approach described in the Risk OMT framework (Vinnem et al., 2012),
these methods can give valuable input regarding installation specific conditions. For most
applications, the amount of system knowledge, data and work required to implement the full
BBN approach suggested by Vinnem et al. (2012) makes it unlikely to be practicable for
QRAs today.
It can be argued that this type of analysis will introduce uncertainty to the models, as
the use of non-deterministic causal relationships and expert judgement make it difficult to
know whether the adjusted probabilities reflect the ”true likelihood” of an event (Røed et al.,
2009). It may seem inappropriate to tamper with numbers based on historical data, as the
data can be argued to reflect ”reality”. While this criticism is valid, the alternative is to
simply ignore the effect of RIFs and use historical data which may not be appropriate. If
inappropriate numbers are applied, these numbers will describe a different reality than that of
the object under analysis If conditions deviate from the industry average, the industry average
numbers will not reflect the reality of the specific installation. Even a qualitative discussion of
installation-specific conditions will give important input on whether the historical data used
in QRAs are appropriate for each specific application. The tools suggested in this report
provides a systematic approach to RIF modeling which will be less subjective than a purely
qualitative, high-level discussion of barrier conditions. Especially for situations where barrier
conditions are assessed to be worse than the industry average, it will be more appropriate
to use an adjusted estimate than an optimistic industry average probability. The adjusted
average probability will then be a conservative estimate.
While the objective of this report is to examine how safety barriers can be taken into
account to improve QRAs, it should be noted that the concept of safety barriers is not entirely
4.6. COMMENTS AND SUGGESTIONS 47
undisputed. The energy-barrier perspective has received criticism from some researchers
because it is based on linear causal chains, and does not account for complex interactions in
larger socio-technical systems. The term ”organizational accidents” is often used to describe
major accidents which have several contributing causes, involving interactions between people
and technology at different levels within an organization (Reason, 1997). Researchers such as
Hollnagel et al. (2006) and Rasmussen (1997) have argued that the traditional approach does
not sufficiently account for the mechanisms that cause such accidents, and have developed
alternative approaches. However, all models represent a simplification of reality, highlighting
certain aspects of problems which are often too complex to understand without simplification.
Rosness et al. (2010) discusses how alternative approaches can be used to highlight different
aspects of an accident. Røed et al. (2009) argues that while critical discussion of the causal
chain and event modeling approach is important, these methods are suitable and useful for a
number of applications. Also, possibilities of including organizational factors in these models
have been enabled through the introduction of BBNs and hybrid approaches.

48 CHAPTER 4. BARRIER PERFORMANCE MODELING IN RISK ANALYSIS

Chapter 5
Summary and Recommendations for
Further Work
5.1 Introduction
In the previous chapters of this report, the many aspects of safety barriers have been presented
and discussed, and potential ways of modeling barriers in QRAs have been examined. This
final chapter will provide a brief summary and the conclusions of the report. In addition, a
brief list of recommendations for further work on the subject will be presented, based on the
findings of this report.
5.2 Summary
In chapter 2, the concept of safety barriers was presented and discussed based on a com-
prehensive literature review on the subject. Because the concept of safety barriers is often
loosely defined and used interchangeably with similar terms, there is a need for a common
understanding of the term within the Norwegian oil and gas industry. In accordance with
the NORSOK Z-013 standard, safety barriers are defined as:
• Safety barrier: Physical or non-physical means planned to prevent, control, or mitigate
undesired events or accidents.
49

50 CHAPTER 5. SUMMARY
In addition, a distinction between barrier function and barrier system is suggested. A
barrier function is a function which is planned to prevent, control, or mitigate an undesired
event or accident. A barrier system is a system which is designed to perform one or more
barrier functions.
A number of methods for categorizing safety barriers exist. Sometimes barriers are cate-
gorized by function, and sometimes they are categorized by system properties. When safety
barriers are categorized by function, it is often related to the effect the barrier function has on
the accident scenario. A common categorization is based on the bow-tie model, distinguishing
between frequency-reducing and consequence-reducing barriers. Frequency-reducing barrier
functions can be further divided into avoidance and prevention, while consequence reducing
barrier functions can be divided into control and protection or mitigation. Barrier systems
are often classified as either physical or non-physical, or as passive or active.
Several properties have also been suggested to measure the performance of safety barriers.
Common performance measures, which describe different aspects of barrier performance,
inlude functionality/effectiveness, reliability/availability, response time and robustness.
An introduction to common safety barriers in offshore oil and gas operations on the
Norwegian Continental Shelf was presented in chapter 3. Important relevant safety barriers
in standards for offshore operations were identified, and a brief case study of barriers related to
blowout accidents was performed. In the standards, even though there is a formal distinction
between the terms, barrier functions and barrier systems are often mentioned interchangeably.
In chapter 4, possible ways of modeling safety barriers in risk analyses were examined.
The specific requirements and objectives of different types of risk analyses were discussed, and
three main categories of risk analyses was suggested: Design phase QRAs, operational phase
QRAs, and situational QRAs. The relevant barrier properties for risk analyses were discussed
briefly. Three relatively new QRA approaches, which include methods for analyzing safety
barriers, were presented. The BORA approach was developed as a method for synthesizing
process leak frequencies based on human interventions to hydrocarbon containing systems.
The approach is based on generic accident scenarios, initiated by a deviation from normal
condition, with safety barriers modeled in barrier block diagrams. A method for modeling
RIFs, based on the TTS approach, is suggested. The TTS approach is used to give scores to

5.3. CONCLUSIONS 51
RIFs, which are modeled in risk influence diagrams. A mathematical algorithm for adjusting
industry average frequencies based on these scores is proposed.
A framework known as HCL has been developed, which combines the ability of BBNs to
model non-deterministic causal relationships between RIFs, and the intuitiveness and relative
simplicity of ET/FT methods. The framework uses BBNs to model RIFs for binary events
in ETs/FTs. A method attempting to apply HCL to the oil and gas industry, building
on elements from the BORA and TTS approaches, has been developed. An algorithm for
adjusting average probabilities similar to that proposed in BORA is suggested, applying
BBNs for more detailed RIF modeling.
Risk OMT is a further development of the BORA approach, including elements of HCL
and the OTS program. The Risk OMT approach introduces BBNs both for modeling RIF
structures and the traditional FT structures. Detailed methods for modeling human and
operational errors are described. The extensive use of BBNs and human and operational
failure data makes the approach require significantly more work than the simplified methods
presented in this report.
The current approach for risk analysis in DNV was also discussed. Technical barriers
are usually accounted for in DNV QRAs today, but not all barriers are modeled explicitly
in ET models, or with the same level of detail. Human and organizational aspect are often
not modeled explicitly. Suggestions for improvement of the current approach were identified,
based on the theory reviewed.
The conclusions of the report will be summarized below, in section 5.3.
5.3 Conclusions
This report has identified the following suggestions for improvement of QRAs with respect
to safety barrier analysis:
1. Include relevant barrier functions for each scenario as events in ET models.
2. When appropriate and practicable, the technical and human/organizational condition
of barriers should be taken into account using FT or RID/BBN models.

52 CHAPTER 5. SUMMARY
It is suggested that only functions or systems which have a direct effect on the accident
scenario should be classified as safety barriers. This means that some non-physical measures
which are often classified as barriers, such as operational barriers, may not be classified as
barriers in this report. Functions which only have an indirect effect on the accident scenario
should be treated as RIFs. Barriers which have a direct effect on accidents can be modeled
in ETs, while influencing factors can be modeled as RIFs. It is also important to maintain a
clear distinction between barrier functions and barrier systems. This could be facilitated by
improving relevant standards for risk analysis with respect to barriers.
Including barriers in ETs helps illustrate the effect of barriers on major accident risk,
and allows for explicit modeling of the barrier systems implemented to perform each barrier
function, as well as RIFs which affect barrier performance. FT and BBN models can be
applied to analyze both the technical and human/organizational condition of barrier systems.
It is suggested that simplified methods for adjusting industry average probabilities such as
those introduced in BORA or the HCL approach for the oil and gas industry are applied for
RIF modeling, as these methods will require a more practicable workload than the detailed
approach suggested in Risk OMT.
While it may seem inappropriate to tamper with probabilities which are based on histori-
cal data, it is important to consider whether the historical data accurately reflects the object
under analysis. If conditions deviate from the industry average, industry average numbers
will not reflect the reality of the specific installation. Using adjusted probabilities will be
particularly useful when RIFs have a lower score than the industry average, because the av-
erage frequencies will be artificially optimistic. An adjusted probability will be a conservative
estimate.
It should be mentioned that the energy-barrier perspective has received criticism from
some researchers because it is based on linear causal chains, and does not account for complex
interactions in larger socio-technical systems. While the approach does have its shortcomings,
methods based on the barrier approach have proved to be useful and suitable for a number
of applications. In addition, the approach is continuously improved with respect to more
complex causal relationships, for instance through the development of BBNs.

5.4. RECOMMENDATIONS FOR FURTHER WORK 53
5.4 Recommendations for Further Work
This report has identified a set of suggestions for how safety barriers can be modeled in risk
analyses, but a complete approach for doing this has not been developed. In order to further
examine how barriers can be successfully modeled in QRAs, the following recommendations
for further work have been identified:
• Event trees with focus on barrier functions, like that proposed in this report, should
be developed for all relevant accident scenarios. The ET proposed in this report is
indended as an illustration, and should also be developed further.
• BBNs and/or RIDs should be tested in pilot projects. An appropriate method for
integrating these models in DNV QRAs should be developed. Appropriate RIFs for
different accident scenarios and events should be identified, and data sources should be
identified or developed.


Appendices


Appendix A
Definitions
Barrier element Physical, technichal or operational component in a barrier system (NOR-
SOK Z-013, 2010).
Barrier function Function planned to prevent, control, or mitigate undesired or accidental
events (NORSOK Z-013, 2010).
Barrier system System designed and implemented to perform one or more barrier functions
(NORSOK Z-013, 2010).
Hazard Potential source of harm (NORSOK Z-013, 2010).
Major accident Acute occurrence of an event such as a major emission, fire, or explosion,
which immediately or delayed, leads to serious consequences to human health and/or
fatalities and/or environmental damage and/or larger economical losses (NORSOK Z-
013, 2010).
Safety barriers Physical or non-physical means planned to prevent, control, or mitigate
undesired events or accidents (NORSOK Z-013, 2010).
Safety function Physical measures which reduce the probability of a situation of a hazard
and accident occuring, or which limit the consequences of an accident (NORSOK Z-013,
2010).
57

58 APPENDIX A. DEFINITIONS
Technical safety Technical safety management in project development and design processes
comprises activities to identify risks, develop safety strategies and performance require-
ments for safety systems and barriers. Technical safety management shall also facilitate
the design process to ensure that studies, analysis and reviews are performed in due
time and properly documented with due consideration of the needs for timely input to
design and procurement processes (NORSOK S-001, 2008).

Appendix B
Acronyms
ALARP As Low As Reasonably Practicable
BBD Barrier Block Diagram
BBN Bayesian Belief Network
BOP Blowout Preventer
BORA Barrier and Operational Risk Analysis
CFD Computational Fluid Dynamics
DAL Dimensioning Accidental Load
DNV Det Norske Veritas
DWH Deepwater Horizon
ESD Emergency Shutdown
ET Event Tree
FT Fault Tree
HCL Hybrid Causal Logic
HMI Human-Machine Interface
59

60 APPENDIX B. ACRONYMS
HSE Health, Safety and Environment
HVAC Heating, Ventilation and Air Conditioning
IAEA International Atomic Energy Agency
IE Initiating Event
ISC Ignition Source Control
IPK Department of Production and Quality Engineering
NCS Norwegian Continental Shelf
NTNU Norwegian University of Science and Technology
OLF Norwegian Oil Industry Association
OTS Operational Conditions Safety Audit
PSA Petroleum Safety Authority Norway
QRA Quantitative Risk Analysis
RAMS Reliability, Availability, Maintainability and Safety
RID Risk Influence Diagram
RIF Risk Influencing Factor
SIS Safety Instrumented System
TTS Technical Conditions Safety Audit

Appendix C
List of Statoil Performance Standards
1 Containment
2 Natural ventilation and HVAC
3 Gas detection
4 Emergency shut down (ESD)
5 Open drain
6 Ignition source control
7 Fire detection
8 Emergency depressurisation and flare/vent system
9 Active fire protection
10 Passive fire protection
11 Emergency power and lighting
12 Process Safety
13 Alarm and communication system for use in emergency situations
14 Escape, evacuation and rescue (EER)
61

62 APPENDIX C. LIST OF STATOIL PERFORMANCE STANDARDS
15 Layout design principles and explosion barriers
16 Offshore cranes
16 (B) Drilling hoisting system
17 Well integrity
18 Ballast water and position keeping
19 Ship collision barriers
20 Structural integrity
21 N/A
22 Human machine interface & alarm management
Source: Statoil (2009)

Appendix D
Suggested Event Tree for
Hydrocarbon Release
As an example of how barrier functions can be included in models, an ET has been developed
for the scenario of hydrocarbon release. The new ET is based on the tree described in section
4.5, and has been altered to more explicitly contain barrier functions. The tree is intended
to contain the same information about the scenario as the current tree. The end states of the
ET will reflect the possible consequences of a leak, dependent on the performance of relevant
safety barriers.
It should be noted that delayed ignition is placed in different places in the ET branches.
If detection is successful, isolation will hopefully be attempted before ignition. If there is no
detection, isolation will not be attempted until after ignition. The probability of successful
isolation will then be dependent on delayed ignition. Conversely, if detection is successful,
the probability of delayed ignition might be dependent on isolation.
63

64 APPENDIX D. SUGGESTED EVENT TREE FOR HYDROCARBON RELEASE
In order to simplify the ET, a number of assumptions has been made for the scenario:
• It is assumed that immediate ignition will not have the potential to cause an explosion.
Fire will be assumed as the only hazardous consequence of immediate ignition. Because
of the amount of flammable material in the area, delayed ignition will be assumed to
cause an explosion (of a size dependent on leak rate, response time etc.).
• Immediate ignition is assumed to be independent of Ignition Source Control. Delayed
ignition, however, is assumed to be dependent on Ignition Source Control. Ignition
Source Control is assumed not to be relevant when detection fails.
• There is no specific branch for escalation in the new tree. However, it is assumed that
the probability of escalation due to explosions is the same as the probability of failure
of the barrier function explosion mitigation and protection.
• The availability of data was not considered during the development of the tree. It is
assumed that sufficient data will be available for the modeling of each basic event.
These assumptions have been made in order to simplify the ET, and have not been verified
for any type of application. In addition, several barrier functions are not included in the tree.
As such, this ET should only be viewed as an illustration for the purpose of this report.
Before the ET can be put into use, the assumptions should be tested and verified. Further
development of the tree might then be required.

65

66 APPENDIX D. SUGGESTED EVENT TREE FOR HYDROCARBON RELEASE
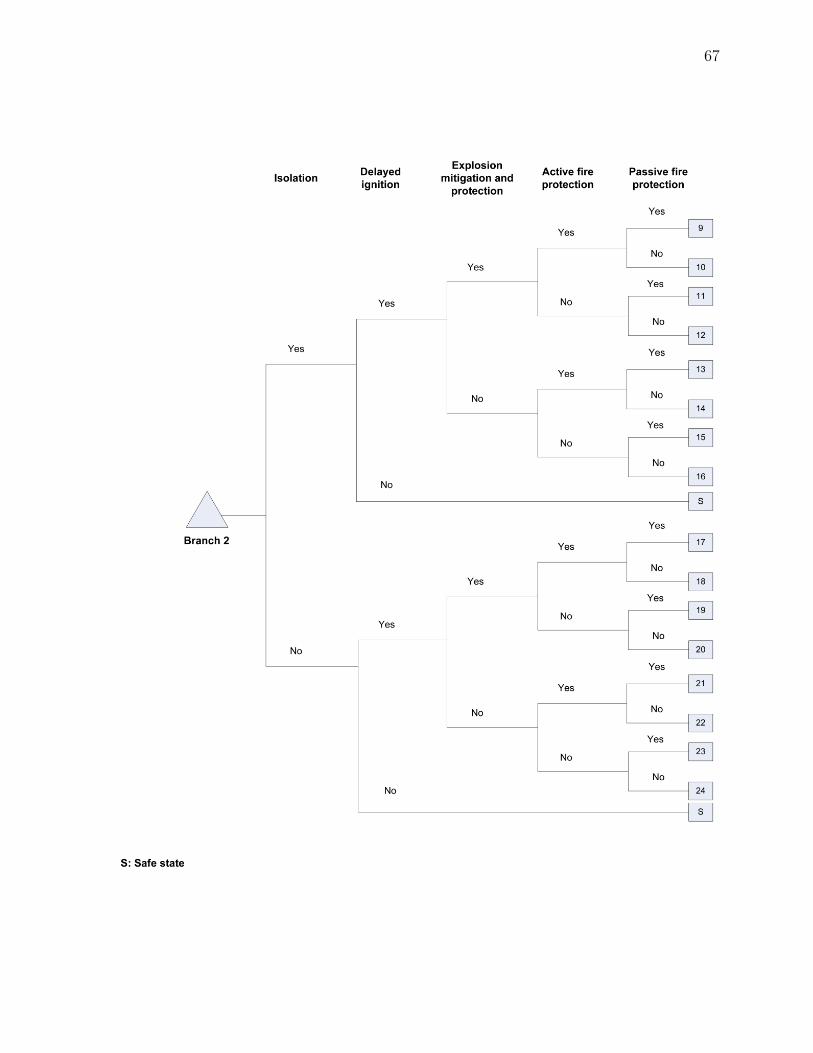
67

68 APPENDIX D. SUGGESTED EVENT TREE FOR HYDROCARBON RELEASE

69

70 APPENDIX D. SUGGESTED EVENT TREE FOR HYDROCARBON RELEASE

Appendix E
Pre-Study Report
71

Modeling of Safety Barriers in Risk Analyses - Pre-study
Report
Kjetil Holter Næss
January 31, 2012
1 Preface
This is the pre-study report for the the master thesis Modeling of Safety Barriers inRisk Analysis, written as part of the Master of Science (MSc) program in mechanichalengineering at the Department of Production of Production and Quality Engineering(IPK) at the Norwegian University of Science and Technology (NTNU). The thesis willbe written in cooperation with IPK and Det Norske Veritas (DNV), under the supervisionof professor Stein Haugen at IPK, and Astrid Folkvord Janbu at DNV.
2 Introduction
There are requirements from both the Petroleum Safety Authority Norway (PSA) andcompanies in the oil and gas industry that the condition of technical and human/organizationalsafety barriers on an installation should be reflected in the risk analysis of the instal-lation. However, implementing this using existing methods, in a way that supportsappropriate analysis- and decision making processes, has proved to be a challenge.
The master thesis will be performed in cooperation with DNV, provider of services forrisk management, with the objective of examining how safety barriers can be modeledin risk analyses, and to which level of detail this can be done.
This pre-study report is intended as a preliminary work plan and break-down of themaster thesis assignment. The pre-study report will present an analysis of the assignmentobjectives, a description of the tasks to be performed presented as a work breakdownstructure, and a work schedule including deadlines and important milestones presentedas a Gantt chart. This will serve as a foundation and work plan for the thesis work, andas a basis for subsequent progress reports.
1
72 APPENDIX E. PRE-STUDY REPORT
3 Thesis Obejctives
The main objective of the master thesis is to examine how safety barriers can better bemodeled in risk analyses, and to which level of detail this can be done. In order to acheivethis main goal, the assignment has been divided into the following objectives:
1. Literature study - What does the safety barrier concept entail? Identify relevantliterature and summarize briefly.
2. Which barriers are relevant for offshore installations? A specific case (a majoraccident scenario) is chosen and used as an example. The barriers are classified indifferent ways to allow for quantification.
3. Which decision processes affecting barriers should the risk analyses provide inputto? Decisions are classified into groups/categories.
4. What are important properties of barriers which affect the risk/risk analysis?
5. Which of these can be quantified, how can they be quantified, and how can theybe modeled in risk analyses? Possibilities of doing this both within the scope ofexisting analyses and other methods shall be considered.
The work on these objectives will be based on relevant standards and practical guidelineswhich exist and are recommended in use, in addition to theory identified in the literaturestudy.
An analysis with additional comments to the objectives is presented below:
1. The literature study should identify important literature on the subject of safetybarriers and present a summary of this literature, along with a short discussionof which issues are being discussed today and which questions remain unsolved.This should include a discussion on the definition of safety barriers and relatedconcepts.
2. A list of important barriers on offshore installations should be developed beforethe case study is performed, preferably in cooperation with DNV. This could befounded in barrier functions defined by the PSA, company sepecific definitionsand/or national or international standards. A typical major accident scenarioshould be investigated. The barriers identified in the case study should then beclassified in different ways to allow for quantification, and a discussion of whichtype of classification is most suitable for integration with risk analyses should beperformed. For instance, the effect of human and organizational barriers comparedto technical barriers could be investigated.
3. The decision processes regarding barriers which should be supported by the riskanalyses, both as intended in current DNV practices and ideally should be consid-ered.
2
73

4. Determining which barrier properties affect risk/risk analyses could require a com-bination of analytical thinking, discussion with DNV, as well as studying literature.It is important to determine the relevance of each property for the risk under as-sessment.
5. After the relevant barrier properties have been determined, possible ways of quan-tifying these properties, and how they can be integrated into the risk analyses,should be examined. This is perhaps the most challenging objective in terms ofgeneration of knowledge, and should therefore rely on a thorough review of existingmethods and methods under development in the field of risk assessment. Severalmethods are in use and under development today, and these should be presentedin detail. If possible, the case study could be compared with a typical DNV riskassessment to investigate how the analyses account for the condition of safety bar-riers, and if this can be done in a sufficient manner. A recommendation of furtherresearch required on the subject should be presented.
4 Approach
The work will begin with a literature study, which will provide a foundation for thesubsequent tasks. The report will be written as a scientific report, based both on theoryin literature and standards and cooperation with DNV. Work on the objectives presentedin this pre-study report will tentatively be performed in the order presented in this pre-study report, involving both supervisors from DNV and IPK as necessary.
5 Work Description
This section of the pre-study report will provide a description of the tasks necessaryto acheive the aforementioned objectives. The work on each objective is broken downinto subtasks. In addition to this, the actual writing of the report document will be acontinuous process throughout the semester, where finished work can be revisited andrevised to ensure that a coherent, intuitive report is produced.
A break-down of tasks to be performed is presented below, in table 1:
3
74 APPENDIX E. PRE-STUDY REPORT
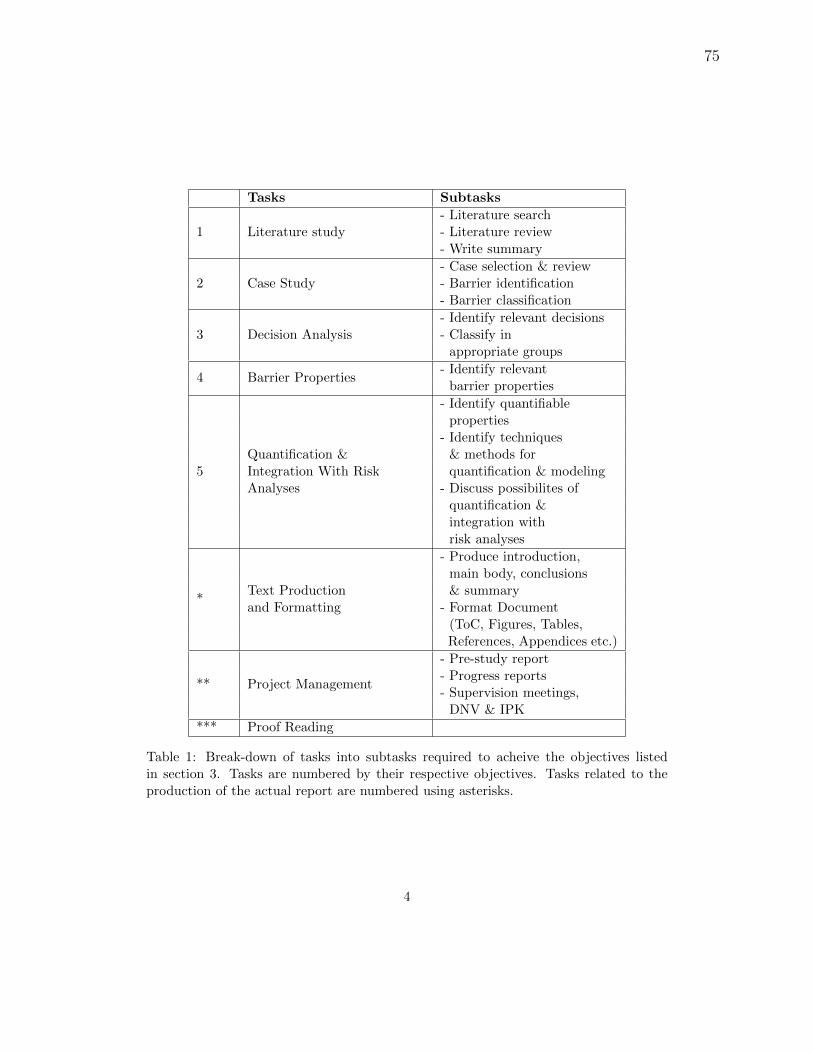
Tasks Subtasks
1 Literature study- Literature search- Literature review- Write summary
2 Case Study- Case selection & review- Barrier identification- Barrier classification
3 Decision Analysis- Identify relevant decisions- Classify in
appropriate groups
4 Barrier Properties- Identify relevant
barrier properties
5Quantification &Integration With RiskAnalyses
- Identify quantifiableproperties
- Identify techniques& methods forquantification & modeling
- Discuss possibilites ofquantification &integration withrisk analyses
*Text Productionand Formatting
- Produce introduction,main body, conclusions& summary
- Format Document(ToC, Figures, Tables,References, Appendices etc.)
** Project Management
- Pre-study report- Progress reports- Supervision meetings,
DNV & IPK
*** Proof Reading
Table 1: Break-down of tasks into subtasks required to acheive the objectives listedin section 3. Tasks are numbered by their respective objectives. Tasks related to theproduction of the actual report are numbered using asterisks.
4
75

6 Work Schedule
In order to ensure that the tasks presented in section 5 are performed in a timely manner,a tentative schedule for completion of the respective tasks is presented in the followingGantt chart:
Week
Task 4 5 6 7 8 9 10 11 12 13 14 15 16 17 18 19 20 21 22 23
1 Literature study
2 Case study & Barrier classification
3 Decision Analysis
4 Barrier property identification
5 Quantification & Modeling
* Writing & Formatting
** Project management Pre-study Report
Progress assurance
*** Proof reading
Figure 1: Gantt chart describing the proposed work schedule.
Important milestones with absolute deadlines:
• Pre-study report due: January 6.
• Progress reports due: To be determined.
• Thesis due: June 11.
Deadlines for the respective tasks are tentatively set at the end of the weeks as presentedin the Gantt chart in figure 1.
The master thesis course is worth 30 ECTS credits which equals a full course loadper semester. This means an estimated 48 hours of work should be required per weekthroughout the semester. Each planned week of work is therefore assumed to be 48hours. Where two tasks are planned in parallel, work should be split between the tasksas necessary.
7 Potential Challenges
The most important challenges in acheiving the objectives set forth in this pre-studyreport include the difficulties of including human and operational barriers, as well ashuman and operational factors in technical barriers, in risk analyses. In addition to this,a key question is how the condition of barriers, which is currently assessed mostly as”still frames” taken at a specific point in time, can be appropariately accounted for inrisk analyses which should analyze the risk associated with the installation throughouta defined period of time.
5
76 APPENDIX E. PRE-STUDY REPORT

Appendix F
Progress Report
77

Modeling of Safety Barriers in Risk Analyses - Progress
Report
Kjetil Holter Næss
April 13, 2012
1 Preface
This is the progress report for the the master thesis Modeling of Safety Barriers inRisk Analysis, written as part of the Master of Science (MSc) program in mechanichalengineering at the Department of Production of Production and Quality Engineering(IPK) at the Norwegian University of Science and Technology (NTNU).
2 Introduction
The objective of this report is to provide an update on the progress of writing the mastersthesis, as outlined in the pre-study report, as per April 13, 2012. The progress reportwill discuss the development of the report compared to the original scope and objective,as well as the progress with regards to time. Deviations from the plan will be discussed,and measures taken to address the deviations will be presented.
3 Thesis Obejctives
The thesis objectives and the scope of the report as described in the pre-study reportremains unchanged:
1. Literature study - What does the safety barrier concept entail? Identify relevantliterature and summarize briefly.
2. Which barriers are relevant for offshore installations? A specific case (a majoraccident scenario) is chosen and used as an example. The barriers are classified indifferent ways to allow for quantification.
3. Which decision processes affecting barriers should the risk analyses provide inputto? Decisions are classified into groups/categories.
1
78 APPENDIX F. PROGRESS REPORT

4. What are important properties of barriers which affect the risk/risk analysis?
5. Which of these can be quantified, how can they be quantified, and how can theybe modeled in risk analyses? Possibilities of doing this both within the scope ofexisting analyses and other methods shall be considered.
The key points discussed in the pre-study report in relation to these objectives have beenfollowed according to plan, with the exception of parts the second and third objective.It was intended that the barriers identified in fulfilment of the second objective shouldbe classified and categorized in groups. Due to a delimitation of the barrier concept, itbecame apparent that this specific task would have limited value. This issue is discussedin the report.
The third objective was found to be somewhat unclear. It was agreed between thesupervisor and the author that the report should should perhaps contain a discussion ofthe different objectives of risk analyses, rather than a dicussion and classification of thedecisions themselves.
The scope has not been delimited further, but has been specified in order to make itclear that:
• While the report contains a general discussion of possibilities for improving QRAswith regards to barriers, the findings of the report will be specific to the needs ofDNV for their QRAs.
• The report has a clear focus on major accident risk, and does not discuss otherelements of risk such as occupational risk in any specific detail.
• Issues related to safety barrier management is outside the scope of the report.The report focuses on analysis of barriers in QRAs (which can be used as decisionsupport for barrier management processes).
4 Approach
The work related to the development of the masters thesis has, to this point, consistedof:
• A literature study of literature on safety barriers, barrier analysis, and relevantstandards and regulations for oil and gas activities on the NCS
• A case study of barriers relating to blowouts
• Informal meetings with DNV personnel and review of a DNV QRA report
2
79

5 Work Description
A break-down of tasks was presented in the pre-study report, and is included here intable 1:
Tasks Subtasks
1 Literature study- Literature search- Literature review- Write summary
2 Case Study- Case selection & review- Barrier identification- Barrier classification
3 Decision Analysis- Identify relevant decisions- Classify in
appropriate groups
4 Barrier Properties- Identify relevant
barrier properties
5Quantification &Integration With RiskAnalyses
- Identify quantifiableproperties
- Identify techniques& methods forquantification & modeling
- Discuss possibilites ofquantification &integration withrisk analyses
*Text Productionand Formatting
- Produce introduction,main body, conclusions& summary
- Format Document(ToC, Figures, Tables,References, Appendices etc.)
** Project Management
- Pre-study report- Progress reports- Supervision meetings,
DNV & IPK
*** Proof Reading
Table 1: Break-down of tasks into subtasks required to acheive the objectives listedin section 3. Tasks are numbered by their respective objectives. Tasks related to theproduction of the actual report are numbered using asterisks.
This work break-down remains unchanged, with one exception: The work packages re-lated to the case study have been altered slightly. Important barriers for oil & gasinstallations have been identified and presented based on relevant standards and guide-lines, separately from the case study. The scope of case study has been reduced slightly,and the classification of barriers in groups has been excluded.
3
80 APPENDIX F. PROGRESS REPORT

6 Work Schedule
In the pre-study report, a Gantt chart of the work schedule for the development of thereport was presented:
Week
Task 4 5 6 7 8 9 10 11 12 13 14 15 16 17 18 19 20 21 22 23
1 Literature study
2 Case study & Barrier classification
3 Decision Analysis
4 Barrier property identification
5 Quantification & Modeling
* Writing & Formatting
** Project management Pre-study Report
Progress assurance
*** Proof reading
Figure 1: Gantt chart describing the proposed work schedule.
The first two work packages were finished on time. As per April 13, work on the decisionanalysis part of the report is not entirely finished, but work on work packages 4 and 5has already started. As a whole, the project is running ahead of time. It is howeverpossible that work related to the completion of the report will be more comprehensivethan planned, and this extra time could be needed as the deadline comes closer.
Important milestones with absolute deadlines were identified in the pre-study report:
• Pre-study report due: January 6.
• Progress reports due: To be determined.
• Thesis due: June 11.
No due date was set for the delivery of the progress reports. This progress reportdescribes the status of the project on April 13, 2012, the end of week 15. It, along withpotential new progress reports will be handed in as part of the main report on June 11,2012.
4
81

82 APPENDIX F. PROGRESS REPORT
References
Andersen, H., Casal, J., Dandrieux, A., Debray, B., Dianous, V. D., Dujim, N., Delvosalle, C.,
Fievez, C., Goossens, L., Gowland, R., Hale, A., Hourtolou, D., Mazzarotta, B., Pipart, A.,
Planas, E., Prats, F., Salvi, O., and Tixier, J. (2004). ARAMIS User Guide. EC Contract
number EVG1-CT-2001-00036.
Aven, T., Hauge, S., Sklet, S., and Vinnem, J. E. (2006a). Methodology for incorporating
human and organizational factors in rsk analysis for offshore installations. International
Journal of Materials & Structural Reliability, 4(1):1–14.
Aven, T., Sklet, S., and Vinnem, J. E. (2006b). Barrier and operational risk analysis of
hydrocarbon releases (bora-release): Part i. method description. Journal of Hazardous
Materials, 137(2):681 – 691.
BP (2010). Deepwater horizon. Accident investigation report.
CCPS (1993). Guidelines for Safety Automation of Chemical Processes. Center for Chemical
Process Safety of the American Institute of Chemical Engineers, New York.
CCPS (2001). Layer of Protection Analysis Simplified Process Risk Assessment. Center for
Chemical Process Safety of the American Institute of Chemical Engineers, New York.
DNV (2011). Final report for united states department of the interior bureau of ocean energy
management, regulation, and enforcement washington, dc 20240 - forensic examination of
deepwater horizon blowout preventer. Forensic Report Contract Award No. M10PX00335,
Report No. EP030842, Det Norske Veritas.
83

84 REFERENCES
Gibson, J. J. (1961). The contribution of experimental psychology to the formulation of
the problem of safety - a brief for basic research. In Behavioral Approaches to Accident
Research, pages 77–89. Association for the Aid of Crippled Children, New York.
Groth, K., Wang, C., and Mosleh, A. (2010). Hybrid causal methodology and software
platform for probabilistic risk assessment and safety monitoring of socio-technical systems.
Reliability Engineering & System Safety, 95(12):1276–1285.
Haddon, W. (1970). On the escape of tigers: An ecological note. American Journal of Public
Health and the Nation’s Health.
Haddon, W. (1980). Advances in the epidemiology of injuries as a basis for public policy.
Public Health Rep., 95 (5):411–421.
Holand, P. (1997). Offshore Blowouts: Causes and Control. Gulf Professional Publishing.
Hollnagel, E. (1999). Memo - Accident Analysis and Barrier Functions. Institutt for Ener-
giteknikk, Halden.
Hollnagel, E. (2004). Barriers and Accident Prevention. Ashgate, Aldershot, UK.
Hollnagel, E., Woods, D. D., and Leveson, N. (2006). Resilience Engineering: Concepts and
Precepts. Ashgate Pub Co.
HSE (2008). Optimising hazard management by workforce engagement and supervision.
Research Report RR679, Health and Safety Executive, London, UK.
IAEA (1999). Basic safety principles for nuclear power plants. 75-INSAG-3, rev. 1. Vienna:
The International Atomic Energy Agency.
IEC 61511 (2003). Functional Safety - Safety Instrumented Systems for the Process Industry
Sector. Interation Electrotechnical Commission (IEC).
Jensen, F. V. (2001). Bayesian networks and decision graphs. Springer.
Kjellen, U. (2000). Prevention of Accidents Through Experience Feedback. Taylor & Francis.

REFERENCES 85
Merriam-Webster (2012). Barrier - definition and more from the free merriam-webster dic-
tionary. Online.
Mohaghegh, Z., Kazemi, R., and Mosleh, A. (2009). Incorporating organizational factors into
probabilistic risk assessment (pra) of complex socio-technical systems: A hybrid technique
formalization. Reliability Engineering & System Safety, 94(5):1000 – 1018.
Neogy, P., Hanson, A., Davis, P., and Fenstermacher, T. (1996). Hazard and Barrier Analysis
Guidance Document. US Department of Energy, Office of Operating Experience Analysis
and Feedback.
NORSOK D-010 (2004). Well integrity in drilling and well operations. Standards Norway.
NORSOK S-001 (2008). Technical Safety. Standards Norway.
NORSOK Z-013 (2010). Risk and Emergency Preparedness Assessment. Standards Norway.
OLF (2001). Recommended Guidelines for the Application of IEC 61508 and IEC 61511 in
the Petroleum Activities on the Norwegian Continental Shelf. The Norwegian Oil Industry
Association, Stavanger, Norway.
PSA (2001). Regulations Relating to Management in the Petroleum Activities (The Manage-
ment Regulations). Petroleum Safety Authority Norway.
PSA (2002). Guidelines to Regulations Relating to Management in the Petroleum Activities
(The Management Regulations). Petroleum Safety Authority Norway.
PSA (2011). Prinsipper for barrierestyring i petroleumsvirksomheten. Petroleum Safety Au-
thority Norway.
Rasmussen, J. (1997). Risk management in a dynamic society: A modeling problem. Safety
Science, 27(2/3).
Rausand, M. (2011). Risk Assessment: Theory, Methods, and Applications. Statistics in
Practice. John Wiley & Sons.
Reason, J. (1990). Human Error. Cambridge University Press, Cambridge.

86 REFERENCES
Reason, J. T. (1997). Managing the Risks of Organizational Accidents. Ashgate, Aldershot,
UK.
Røed, W., Mosleh, A., Vinnem, J. E., and Aven, T. (2009). On the use of the hybrid causal
logic method in offshore risk analysis. Reliability Engineering & System Safety, 94(2):445
– 455.
Rosness, R., Grøtan, T. O., Guttormsen, G., Herrera, I. A., Steiro, T., Størseth, F., Tin-
mannsvik, R. K., and Wærø, I. (2010). Organisational accidents and resilient organisations:
six perspectives. Report, SINTEF.
Sklet, S. (2006). Safety barriers: Definition, classification, and performance. Journal of Loss
Prevention in the Process Industries, 19:494–506. Trondheim, Norway.
Sklet, S., Ringstad, A. J., Steen, S. A., Tronstad, L., Haugen, S., Seljelid, J., Kongsvik, T.,
and Wærø, I. (2010). Monitoring of human and organizational factors influencing the risk
of major accidents. SPE International Conference on Health, Safety and Environment in
Oil and Gas Exploration and Production. Rio De Janeiro, Brazil, 12-14 April.
Statoil (2009). Performance Standards for Safety Systems and Barriers - Offshore. Health,
safety, security and the environment (HSE), Technical and professional requirement,
TR1055. Ver. 4.01. Internal.
Svenson, O. (1991). The accident evolution and barrier function (aeb) model applied to
incident analysis in the processing industries. Risk Analysis, 11 (3):499–507.
Thomassen, O. and Sørum, M. (2002). Mapping and monitoring the technical safety safety
level. SPE 73923. Society of Petroleum Engineers.
Tinmannsvik, R., Albrechtsen, E., Bratveit, M., Carlsen, I., Fylling, I., Hauge, S., Haugen,
S., Hynne, H., Lundteigen, M., Moen, B., Okstad, E., Onshus, T., Sandvik, P., and Øien,
K. (2011). Deepwater horizon-ulykken: Arsaker, lærepunkter og forbedringstiltak for norsk
sokkel. Report, SINTEF.

REFERENCES 87
Vinnem, J., Bye, R., Gran, B., Kongsvik, T., Nyheim, O., Okstad, E., Seljelid, J., and Vatn,
J. (2012). Risk modelling of maintenance work on major process equipment on offshore
petroleum installations. Journal of Loss Prevention in the Process Industries, 25(2):274 –
292.
Vinnem, J., Seljelid, J., Haugen, S., Sklet, S., and Aven, T. (2009). Generalized methodology
for operational risk analysis of offshore installations. Proceedings of the Institution of
Mechanical Engineers, Part O: Journal of Risk and Reliability, 223(1):87–97.
Wang, C. (2007). Hybrid Causal Logic for Risk Assessment. PhD thesis, University of
Maryland, Center for Risk and Reliability, College Park, MD.
