modeling of wastewater and sludge management …
TRANSCRIPT

Molhemarical Moddhg. Vol. 4, pp. 427-438. 1983 0270-0255/83 $3.00 + .oO Printed in the USA. All rights reserved, Copyright 0 1984 Pergamon Press Ltd.
MODELING OF WASTEWATER AND SLUDGE MANAGEMENT SYSTEMS
YAKIR HASIT
Department of Civil Engineering and Environmental Studies Institute Drexel University
Philadelphia, Pennsylvania 19 104
DAVID L. SIMMONS
Department of Geography and Environmental Engineering Johns Hopkins University
Baltimore, Maryland 21218
RICHARD I. DICK
Department of Environmental Engineering Cornell University
Ithaca, New York 14853
Abstract-The Optimal Sludge Management Program (OSMP) is a computer program used to optimize the design and to simulate the steady-state operation of wastewater and sludge management systems. In its development, fundamental and rational process models were used, resorting to empiricism only when no rational models were available. Waste- water and sludge treatment processes were linked so that the impacts of recycle streams on processes were incorporated. For the optimization procedure, a sequential uncon- strained minimization technique was used in which an interior penalty function was minimized by the Davidon-Fletcher-Powell method. Optimization and simulation examples showing the use of OSMP are included in the paper.
INTRODUCTION
Many attempts have been made to simulate or optimize the design and operation of wastewater treatment plants using mathematical models. However, most of these studies have either focused on individual treatment processes or have not incorporated sludge (wastewater solid residuals) treatment and disposal processes. Due to the interactions among various processes, the optimization of individual processes is unlikely to lead to the optimal design and operation of entire treatment plants. Similarly, failure to include sludge management processes limits the utility of such studies, because, regardless of plant size, these processes are a primary source of failures and maintenance problems in wastewater treatment plants [I]. Furthermore, their management is as costly as the treatment of wastewaters [2].
Studies which consider both wastewater treatment and sludge handling and disposal processes usually contain deterministic, steady-state models. The majority of these studies resort to simulation rather than optimization due to the computational difficulties in handling detailed process models. The computer programs developed in these attempts are usually executed numerous times to determine the “best” processes and/or their sizes. One of the first such programs was developed by Smith [3], and was later expanded with the assistance of Eilers [4]. Similar efforts include a simulation program by Parkin and Dague [5] which
brought to you by COREView metadata, citation and similar papers at core.ac.uk
provided by Elsevier - Publisher Connector

428 Y. HASIT, D. L. SIMMONS, AND R. I. DICK
considers only anaerobic and aerobic digestion for sludge handling, and CAPDET, a program originally developed by the Army Corps of Engineers [6]. Rossman extended Smith’s work by incorporating a heuristic optimization algorithm which could also select the cost-optimal processes and rank alternate solutions [7, 81. Anand et al. developed a simulation program for the chemical-physical treatment of wastewater and sludges [9]. While all simulation programs mentioned above were based on steady-state models, Stenstrom and Andrews presented a dynamic simulation model for the analysis of treatment plants already in operation [lo]. Their model contained only gravity thickening and anaerobic digestion for sludge handling. Others have used various nonlinear programming (NLP) techniques for the optimal design of treatment plants with designated treatment chains. Among these are works by Bowden et af. [1 11, Voelkel and Polkowski [12], Tyteca [13], Tyteca and Smeers [14], Dick et a1.[15] and Dick and Hasit [16, 171. There have also been some stochastic NLP studies [18, 191; however, sludge treatment processes were either neglected or their costs were simply added to the value of the objection function as fixed charges.
OPTIMAL SLUDGE MANAGEMENT PROGRAM
The mathematical models discussed in this paper were used in the Optimal Sludge Management Program (OSMP), a computer program developed by Dick et al. [15] and expanded by Dick and Hasit [16, 171, for simulating and optimizing the operation and preliminary design of wastewater treatment plants. OSMP, which contains about 4500 FORTRAN IV statements, can be used to minimize total system costs by determining cost-optimal process sizes (such as activated sludge aeration tank volume, gravity thickener surface area, etc.) and values of operational variables (such as mean cell retention time in biological treatment). For this purpose, optimization routines written by Ratner and Fox [20] were incorporated into the program. The approach used is sequential unconstrained minimization technique (SUMT) in which an interior penalty function is minimized using the Davidon-Fletcher-Powell method. The objective function is the sum of annualized capital costs and annual operation and maintenance (0 & M) costs of all processes in the treatment chain. The set of constraints consists of linear and nonlinear flow and mass balance equations and performance models, along with nonequality constraints imposing required treatment levels and limits on some variables. Due to the detailed representation of each treatment process, OSMP can also be used as a simulation program given a treatment chain. The values of various decision variables and parameters can be fixed while others can be successively varied; thus, the effects of individual parameters on overall system costs and process performance can be evaluated.
MODELS IN OSMP
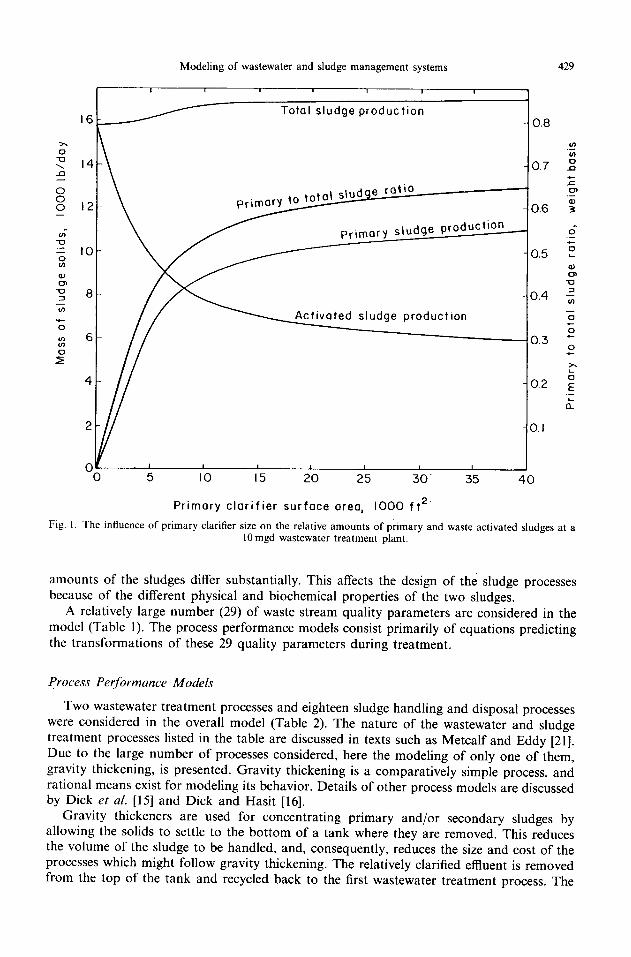
OSMP accomodates extensive integration between individual wastewater and sludge treatment processes. This was achieved by using process models which took into consid- eration the physical, biological, and chemical characteristics of sludges based on the type of treatment they previously received. Furthermore, sludge process recycle streams were included in order to account for their impact on primary and secondary wastewater treatment. The bases for developing process performance models were either taken from the literature or developed from data obtained in laboratory experiments. When possible, fundamental and rational process performance models were used; empiricism was used only when no basis for developing rational models was available. The importance of process integration, for example in a secondary wastewater treatment plant, is illustrated in Fig. 1. By varying the area of the primary clarifier, the generated quantities of primary and secondary sludges change. Although the total mass of solids shows little variation, the relative
Modeling of wastewater and sludge management systems
I I I 1 I I I
Total sludge production - 0.8
429
0 u 5 IO I5 20 25 30’ 35 40
I I I I - _
Primary clarifier surface area, 1000 ft2
Fig. I. The influence of primary clarifier size on the relative amounts of primary and waste activated sludges at a 10 mgd wastewater treatment plant.
amounts of the sludges differ substantially. This affects the design of the sludge processes because of the different physical and biochemical properties of the two sludges.
A relatively large number (29) of waste stream quality parameters are considered in the model (Table 1). The process performance models consist primarily of equations predicting the transformations of these 29 quality parameters during treatment.
Process Performance Models
Two wastewater treatment processes and eighteen sludge handling and disposal processes were considered in the overall model (Table 2). The nature of the wastewater and sludge treatment processes listed in the table are discussed in texts such as Metcalf and Eddy [21]. Due to the large number of processes considered, here the modeling of only one of them, gravity thickening, is presented. Gravity thickening is a comparatively simple process, and rational means exist for modeling its behavior. Details of other process models are discussed by Dick et al. [15] and Dick and Hasit [16].
Gravity thickeners are used for concentrating primary and/or secondary sludges by allowing the solids to settle to the bottom of a tank where they are removed. This reduces the volume of the sludge to be handled, and, consequently, reduces the size and cost of the processes which might follow gravity thickening. The relatively clarified effluent is removed from the top of the tank and recycled back to the first wastewater treatment process. The

430
Flow rate
Y. HASIT, D. L. SIMMONS, AND R. I. DICK
Table 1. Stream parameters in the Optimal Sludge Management Program
Wastewater and sludge constituents
. Total and dissolved Biochemical Oxygen Demand (BOD)
. Total and fixed suspended solids, biodegradable and refractory volatile suspended solids, and biomass solids
l Particulate and dissolved phosphorus
l Particulate nitrogen, ammonia nitrogen plus dissolved organic nitrogen, and nitrate plus nitrite nitrogen
. Alkalinity
l Particulate and dissolved cadmium, zinc, copper, lead, nickel and mercury
Physical parameters
l Settleability constants (a. n) in (5)
l Cake constant (a) and compressibility coefficient (s) in:
where r = a(P/P,) r = specific resistance to filtration,
P = pressure differential P,, = reference pressure (one atmosphere)
Table 2. Processes included in the Optimal Sludge Management Program
Wastewater ireatment Sludge handling and disposal
(continued)
Primary treatment
l primary sedimentation
Secondary treatment
l activated sludge process
Sludge handling and disposal
Thickening
. gravity thickening
. flotation thickening
Stabilization
. anaerobic digestion
. aerobic digestion
Conditioning
. ferric chloride and lime conditioning
l polymer conditioning
l elutriation
Dewatering
l vacuum filtration
l pressure filtration
Inactivation
. irradiation
Reduction
l incineration
Transportation
l truck
l railroad
l barge
l pipeline
Ultimate disposal
. land application
l landfilling
l ocean disposal
following is a presentation of the gravity thickening models predicting the transformations of the 29 quality parameters and one quantity parameter shown in Table 1.
The quantity of the flows can be predicted from the continuity and solid mass balance equations:
Qe = Qo - Qu,
co - ce Qu=-Q,,
cu - cc!
(1)
(2)

Modeling of wastewater and sludge management systems 431
I-
Q u ,cu Fig. 2. A schematic representation of the gravity thickening process.
where Q is the flow rate, c is the suspended solids concentration, o is the influent index, e is the effluent index, and u is the underflow index (Fig. 2). The values of c, and Q, in (1) and (2) are already determined in the primary and/or secondary treatment models which precede gravity thickening. Thus, models for predicting the values of c, and c, and, consequently, of Q, and Q, are required.
The model used for predicting the value of c, is predicated on work by Kynch [22], Yoshioka et al. [23], Shannon et al. [24], and Dick [25]. The basis of the model is that movement of solids through a thickener is caused by two mechanisms, gravity sedimentation and removal of thickened sludge from the bottom of the tank. The rate of downward passage of solids per unit area and time (the total flux) through a horizontal layer with concentration, c,, is
Gi = G,i + G,i, (3)
where Gsi is the flux due to sedimentation, and GUi is the flux due to the withdrawal of thickened sludge from the bottom of the tank.
The flux due to sedimentation (batch flux) can be expressed as
Gsi = CiUsrr (4)
where a,, is the gravity sedimentation velocity of solids at concentration c,. To evaluate G,, over a range of horizontal layers, i, it is necessary to know the relationship
between c, and u,,. Because no comprehensive rational model exists to explain this relationship for various types of sludges, the following empirical model developed by Dick and Young [26] was used for this purpose.
Vsi = ac;“, (5)
In this equation, a and n are empirically determined constants which characterize the sedimentation properties of a given sludge. While this equation has been found to satis- factorily describe the relationship between settling velocity and concentration, care must be

432 Y. HASIT, D. L. SIMMONS, AND R. I. DICK
exercised to avoid extrapolation of the equation beyond the range of its applicability. If deemed appropriate, other empirical equations could also be used in place of (5).
The second term in (3) can be written as
G,i = civ,, (6)
where v, is the underflow velocity. A basic assumption of the gravity thickening process model is that the removal of thickened sludge from the bottom of the gravity thickener produces a uniform downward velocity throughout the cross-sectional area of the thickener. According to this assumption, the underflow velocity at any depth in the thickener is given by
where A is the area of the thickener. The successful operation of a gravity
Q. vu=--,
A (7)
thickener requires that the rate of application of sludge solids be less than the minimum of Gi, otherwise the solids would build up in the thickener faster than they could be removed. This minimum value can be determined by combining (3-7) to give (8)
G,=uc;-"+%c,,
differentiating (8) with respect to ci, and setting it equal to zero. Then the limiting concentration, cL, that is, the concentration of sludge with the minimum capacity for transmitting solids, becomes
,,=[,(, - l,$
Substituting (9) into (8) gives the limiting solids transmitting capacity (limiting flux) of a gravity thickener as
G, = [a@ - l)] l,n[*($)l”-““, (10)
Note the value of n must be greater than 1. When a thickener operates at capacity and captures essentially all applied solids, i.e. when
c, r 0, the limiting flux equals the applied loading
Furthermore, when c, g 0, (2) reduces to
Q/&5.
CU
(11)
(12)
Combining (10-12) and rearranging give the underflow concentration as
Modeling of wastewater and sludge management systems 433
(13)
Note that A is both a design and decision variable and appears in the objective function. To make sure that the performance of the thickener is not unacceptable, a concentration
constraint is entered into the model:
c, 2 c,. (14)
Furthermore, to assure feasibility also a nonnegativity constraint is entered:
A 20. (15)
In the above derivation, the thickener effluent solids concentration, c,, was assumed to be zero. Although this assumption does not effect the accuracy of the above derivation (because C, is usually about two orders of magnitude smaller than c, and c,), the impact of solids recycle streams on wastewater treatment has to be accounted for. Unfortunately, adequate funda- mental means for predicting c, do not exist, therefore, some reasonable value should be assigned to c,. For example, values in the range of 150 to 300 mg/!, which were reported by Malina and DiFilippo [27], could be entered into the program.
For purposes of modeling the concentration of dissolved and suspended species of the other quality parameters (Table 1) in the effluent and underflow, it was assumed that no transformations within or between liquid, gaseous, and solid phases occur during thickening. That is.
D,=D,=D,, (16)
where D is the concentration of any dissolved species, and
(17)
(18)
where S is the concentration of any suspended species. Similarly, it was also assumed that settleability and dewaterability coefficients (Table 1) do not change during gravity thickening. However, in some cases these assumptions may be inadequate and future improvements in the model could relax these assumptions. Example of transformations which may occur include biological denitrification of a previously nitrified sludge [28], and release of phos- phorus from biological sludge under anaerobic conditions [29].
Process Cost Models
For the processes shown in Table 2, cost models were included in OSMP. These costs consisted of annualized capital costs, and annual 0 & M costs based on plant operation and maintenance wages, power and fuel costs, cost of chemicals, replacement parts and other materials. Most of the cost models were based on data given by Metcalf and Eddy [30] and Ettlich [31]. In the analysis presented in this paper, these costs were updated to March 1980

434 Y. HASIT, D. L. SIMMONS, AND R. I. DICK
using the appropriate Engineering News Record and Producer Price indices. The capital costs were annualized using a 7 percent annual interest rate (tax free municipal bonds) and a 20 year period. Due to the relatively large number of processes, in this section only the cost models used for gravity thickening are presented.
The following models of gravity thickening costs were developed from the data given in Metcalf and Eddy [30]:
Capital cost = b,A bz, (19)
Annual 0 & M cost = b, W,Ab4 + b, W,,,Ab6 + b,EAb8, (20)
where b, through b, are regression coefficients, W, is operation wage, W, is maintenance wage, E is unit cost of electricity and A is the thickener area.
OSMP APPLICATIONS
In the following sections optimization and simulation examples illustrating the application of OSMP are presented. These examples are intended to demonstrate advantages to be realized by rational design techniques that take into account the interactions between sludge management and wastewater treatment processes. However, caution must be exercised in interpreting and generalizing the analysis, because specific assumptions were made in the development of the process performance and cost models. Also, the use of different program input, such as the quantity and quality of wastewater to be treated, affect the analysis. Therefore, OSMP should be only viewed as a guide, and the relevant sources [15, 16, 171 should be checked before its use.
Optimization Example: Efect of Primary Treatment on Other Processes
Conventionally, municipal wastewater treatment plants consist of primary (plain sedimen- tation) treatment followed by secondary (usually biological) treatment. It is, thus, of interest to examine whether the conventional approach of joining primary and secondary facilities is cost effective.
As mentioned earlier, when the size of the primary sedimentation tank is varied, the relative amounts of primary and waste activated sludges vary (Fig. 1). Because the two sludges have different physical properties, the thickening and dewatering properties of the blended sludges change as the tank area changes. Furthermore, due to their differences in biodegradability, the design and operation of stabilization processes are affected.
The influence of the size of the primary sedimentation tank on the total annual cost of wastewater treatment and sludge management for a 10 million gallons per day (mgd) wastewater treatment plant (that is, a plant serving roughly the equivalent of 75,000 people) is illustrated in Fig. 3. This figure was developed by determining the optimal sizes of the treatment processes at various primary sedimentation tank sizes. The process chain consisted of primary and activated sludge treatment for wastewaters, with the primary and waste activated sludges combined, gravity thickened, anaerobically digested, conditioned with lime and ferric chloride, dewatered with vacuum filters and trucked for 20 miles to an agricultural land application site. Results indicate a reduction in sludge management costs when primary treatment is provided (Fig. 3). However, sludge management costs are not sensitive to the size of the primary treatment facilities once the relative quantities of both sludges remain relatively constant (Fig. 1). Sludge thickening characteristics were the major factors account- ing for the influence of primary sedimentation tank size on sludge management costs. When the sludge mixture consisted of mostly waste activated sludge (i.e. small primary sedimen-

Modeling of wastewater and sludge management systems 435
I200
I I 00
\ 1000
900
800
$ 700
E Z
I I r 7- ,
Sludge management
Activated sludge treatment
/ Anaerobic digestio
OO V 5 IO I5 1 20 1 25 I 30 I
Primary clarifier surface area, 1000 sq ft
Fig. 3. The effect of primary clarifier size on the annual cost of wastewater and sludge management at a IOmgd wastewater treatment plant.
tation tank area), due to the relatively poor sedimentation characteristics of activated sludge, the thickened mixture was more dilute and, thus, more voluminous. Therefore, larger anaerobic digestion tanks were required for stabilization causing an increase in capital and energy (heating) costs for digesters. Furthermore, due to the poorer dewatering characteristics of waste activated sludge, also vacuum filtration costs were higher.
The cost of wastewater treatment alone increased continuously with an increase in the primary sedimentation tank area; that is, the reduction in the loading on the activated sludge process due to increasing amounts of primary treatment was never adequate to cover the

436 Y. HASIT, D. L. SIMMONS, AND R. I. DICK
increased cost of primary treatment. When wastewater treatment and sludge management costs were considered together, however, an optimal sedimentation tank area in the order of 5000 sq. ft. resulted. Conventional design practice, on the other hand, would have given an area of about 10,000 sq. ft. for a 10mgd plant [32], and the corresponding total cost of wastewater treatment and sludge management would have been only about 5 percent more than the minimum found in this analysis.
Another point of interest is that the use of larger primary sedimentation tanks reduces energy costs for wastewater treatment and sludge management. The reasons are reduced costs for aeration and recycle of activated sludge and the improved efficiency in anaerobic digestion. Energy savings in anaerobic digestion caused by primary treatment are due to the better digestibility of primary solids and the smaller volumes required to digest thicker sludges. For the example shown in Fig. 3, total energy costs were 35 percent less for a plant with a conventional size primary sedimentation tank (10,000 sq. ft.) than a plant using only activated sludge treatment. The difference was almost evenly divided between activated sludge treatment and anaerobic digestion. It is anticipated that future increases in energy costs will make primary sedimentation a more attractive component of wastewater treatment plants.
Simulation Example: Efect of Distance to the Point of Ultimate Disposal
The purpose of this exercise was to analyze the effect of ultimate disposal site location on the economics of water pollution control. The design parameters and variables of the processes described in the previous example were fixed, while the transportation type and distance were varied. In the case of liquid sludge transport and disposal, vacuum filtration and chemical conditioning were excluded from the analysis. Similarly, in the case of barge transport, agricultural land application was not included in the analysis (with barge transport, ocean disposal was considered to be the method of ultimate disposal).
9.0-
8.0 -
3.0 -
1 I I , I L I 5 IO 20 40 80 160 320
One way distance to ullimafe disposal, mi
Fig. 4. The e&t of distance to the point of ultimate sludge disposal on the total cost of wastewater PIUS sludge management at a 50mgd plant.

Modeling of wastewater and sludge management systems 437
The results of the analysis for a 50 mgd wastewater treatment plant are shown in Fig. 4. The figure shows that ocean disposal is the most economical alternative at all distances. For land-based alternatives, pipeline transport becomes the most economical one when the disposal site is within about 40 miles of the plant. Because the capital cost of pipelines is proportional to their length, for longer distances the transport of dewatered sludge becomes more cost effective. If pipeline transport is not possible, for short distances (about 25 miles or less) dewatering costs outweigh the savings incurred due to the transport of dewatered sludge, and transport of liquid sludge by rail is most economical.
SUMMARY
The design and operation of water pollution control facilities were investigated by (1)
developing mathematical models for the performance of wastewater and sludge management processes in terms of basic design and operational variables, (2) developing equations for the capital, energy, and other operation and maintenance costs in terms of basic design and operational variables, and (3) using optimization and simulation procedures for examining the mathematical models to identify favorable design and operation conditions.
Acknowledgements-This study was funded by the National Science Foundation, Directorate for Engineering, Grant No. ENV 77-22947.
REFERENCES
I.
2. 3.
4.
5.
6.
7.
8.
9.
IO.
II.
12.
13.
14.
15.
16.
17.
18.
19.
S. J. Hadeed, Sludge treatment/handling, preliminary treatment, and instrumentation top 0 & M problem list. J. War. Pollut. Control Fed. 53, 412420 (1981). G. L. Gulp, Handbook of Sludge-Handling processes. Garland STPM Press, New York (1979). R. Smith, Preliminary design of wastewater treatment systems. J. Sanit. Engng Div. Am Sot. Civ. Engrs. 95, 117~145 (1969). R. Smith and R. G. Eilers, Computer evaluation of sludge handling and disposal costs, Proc. 1975 Natl. Conf. Munic. Sludge Management and Disposal, 30-59, Inf. Transfer, Rockville, MD (1975). G. F. Parkin and R. R. Dague, Optimal design of wastewater treatment systems by enumeration. J. Sunit. Engng. Dir. Am. Sot. Civ. Engrs. 98, 833-851 (1972). U.S. Envir. Prot. Ag. and U.S. Army Corps of Engrs., Computer Assisted Procedure for the Design and Evaluation of Wastewater Treatment Systems (CAPDET+User’s Guide, 430/9-79X)1, U.S. Envir. Prot. Ag., Washington, DC (1979). L. A. Rossman, Computer Aided Synthesis of Wastewater Treatment and Sludge Disposal Systems. EPA-600/2- 79-158, U.S. Envir. Prot. Ag.. MERL, Cincinnati. OH (1979). L. A. Rossman, Synthesis ofwaste treatment systems by‘implicit enumeration. J. Wut. Pollut. Control Fed. 52, 148-160 (1980). A. Anand, J. Gibbs, W. C. Laughlin, Jr., and R. J. Sherwood, Computer simulation of wastewater treatment by chemical-physical processes. Efluenf War. Treat. J. 14, 155-160 (1974). M. K. Stenstrom and J. F. Andrews, Cost interactions in activated sludge systems. J. Enuir. Engng. Div. Am. Sot. Civ. Engrs. 106, 787-796 (1980). K. Bowden, R. S. Gale, and D. E. Wright, Evaluation of the CIRIA prototype model of the design of sewage treatment works. War. Pollut. Control 75, 192-205 (1976). K. G. Voelkel and L. B. Polkowski, Sensitivity analysis of wastewater treatment plant design parameters, Proc. 1980 Nat]. Conf. Envir. Engng., Am. Sot. Civ. Engrs. 307-319 (1980). D. Tyteca, Nonlinear programming model of wastewater treatment plant. J. Envir. Engng. Div. Am. Sot. Ciu. Engrs. 107, 747-765 (1981). D. Tyteca and Y. Smeers, Nonlinear programming design of wastewater treatment plant. J. Envir. Engng. Div. Am. Sot. Cit. Engrs. 107, 767-779 (1981). R. I. Dick, D. L. Simmons, R. 0. Ball, K. Perlin, and M. W. O’Hara, Process Selection for Optimal Management of Regional Wastewater Residuals, PB-295950, Natl. Tech. Inf. Serv., Springfield, VA (1978). R. 1. Dick and Y. Hasit, Integration of Processes for Wastewater Residuals Management, Project Report, Natl. Sci. Found., Grant No. ENV 77-22947 (1981). R. I. Dick and Y. Hasit, Integration of Processes for Wastewater Residuals Management-Computer Program, Project Report, Natl. Sci. Found., Grant No. ENV 77-22947 (1981). P. M. Berthouex and L. B. Polkowski, Optimum waste treatment plant design under uncertainty. J. War. Pollut. Control Fed. 42, 1589-1613 (1970). A. R. Tarrer, C. P. L. Grady, Jr., H. L. Lim and L. B. Koppel, Optimal activated sludge design under uncertainty. J. Envir. Engng. Div. Am. Sot. Civ. Engrs. 103, 657-673 (1976).

438 Y. HASIT, D. L. SIMMONS, AND R. I. DICK
20. 21.
22. 23.
24.
25. 26.
27.
28.
29.
30.
31. 32.
M. W. Ratner and R. L. Fox, CMfN14 users Guide. Chi Corp., Cleveland, OH (1975). Metcalf and Eddv. Inc.. Wasrewater Ennineerina: Treatment Disposal Reuse, 2nd ed., McGraw-Hill Book Co., New York (1979j.’ G. J. Kynch, A theory of sedimentation. Trans. Faraday Sot. 48, 166176 (1952). N. Yoshioka, Y. Hotta, S. Tanaka, S. Naito and S. Tsugani, Continuous thickening of homogeneous flocculated slurries. Chem. Engng. Tokyo 21, 6674 (1957). P. T. Shannon, E. Stroupe and E. M. Tory, Batch and continuous thickening. Ind. Engng. Chem. 2, 203-211 (1963). R. I. Dick, Gravity thickening of waste sludges. Proc. of fhe F&r. Society, Filtr. Sep. 9, 177-183 (1972). R. I. Dick and K. W. Young, Analysis of thickening performance of final settling tanks, Proc. 27th Ind. Waste Conf., Purdue Univ., Engng. Ext. Ser. No. 141, 33-53 (1974). J. F. Malina, Jr. and J. DiFilippo, Treatment of supematants and liquids associated with sludge treatment. Wut. Sewage Wks. 118, R3&R38 (1971). C. N. Sawyer and L. Bradney, Rising of activated sludge in final settling tanks. Sewage Wks. J. 17, 1191-1209 (1945). J. Shapiro, G. V. Levin and Z. G. Humberto, Anoxically induced release of phosphate in wastewater treatment. J. Wut. Poliuf. Control Fed. 39, 181&1818 (1967). Metcalf and Eddy, Inc., Water Pollution Abatement Technology: Capabilities and Cost, Vol. 3. PB-250690-3, Natl. Tech. Inf. Serv., Springfield, VA (1976). W. F. Ettlich, Transport of Sewage Sludge, EPA-600/2-77-216, U.S. Envir. Prot. Ag., Cincinnati, OH (1977). Great Lakes-Upper Mississippi River Board of State Sanitary Engineers, Recommended Standards for Sewage Works. Health Educ. Serv., Inc., Albany, NY (1978).