modeling potential wildlife-wind energy conflict areas
TRANSCRIPT
Modeling PotentialWildlife-Wind Energy Conflict Areas

This project was sponsored by a grant from the Center for Rural Pennsylvania, a legislative agency of the
Pennsylvania General Assembly.
The Center for Rural Pennsylvania is a bipartisan, bicameral legislative agency that serves as a resource for rural
policy within the Pennsylvania General Assembly. It was created in 1987 under Act 16, the Rural Revitalization
Act, to promote and sustain the vitality of Pennsylvania’s rural and small communities.
Information contained in this report does not necessarily reflect the views of individual board members or the
Center for Rural Pennsylvania. For more information, contact the Center for Rural Pennsylvania, 200 North Third
St., Suite 600, Harrisburg, PA 17101, telephone (717) 787-9555, email: [email protected].
Modeling Potential Wildlife-Wind Energy Conflict Areas
By:Brian W. Okey, Ph.D. and Michael J. Kuzemchak, M.S.
Indiana University of Pennsylvania
May 2009

4 The Center for Rural Pennsylvania
Executive SummaryRenewable energy policies and Appalachian ridges combine to make Pennsylvania a
favorable setting for wind energy facilities. But a proliferation of proposals and develop-
ments has created new challenges for local governments, which are ultimately responsible
for permitting commercial installations on private lands. Rows of wind turbines bring the
promise of emissions-free energy, but the tall, moving structures possess a broad develop-
ment footprint encompassing hundreds or thousands of acres.
Their unique form and site requirements threaten some of the
state’s most significant wildlife habitats in upland areas. In
Somerset County and elsewhere, for example, grassroots resis-
tance to commercial wind proposals has grown, in part, due to
environmental concerns.
This research aimed to provide a tool to more comprehensively
address land use decisions involving commercial wind energy. The
researchers developed an approach to highlight areas where
competing demands of wind development and wildlife protection
are likely to emerge.
Commercial wind energy is a new and largely unregulated land
use in the state. Other than federal stormwater or wetlands permit-
ting requirements, few policy mechanisms exist to ensure that
ecological considerations are addressed in wind development
proposals. For example, a Pennsylvania Department of Environ-
mental Protection model ordinance offers a template to address
public health and welfare but offers no guidance on wildlife
concerns. Consequently, municipal officials may lack the informa-
tion and resources crucial to the siting of wind turbines. Wind
energy facilities have a potential for direct and indirect threats to
wildlife—particularly bats and birds—in the airspace swept by the
turbine blades and along the forested ridges cleared to permit
service roads and other associated infrastructure. In some cases,
rates of bird and bat mortality inflicted by wind turbines have
caused alarm over the vulnerability of species populations.
The researchers used a statewide geographic information systems
database, compiled by the Pennsylvania Natural Heritage Program
(PNHP), to produce township-scale maps for use by municipal
officials. PNHP data highlight areas of outstanding importance to
the state’s wildlife. The researchers combined this data with wind
speed data to model likely areas of conflict between wildlife
habitat and commercial development interests. In all, 235 town-
ships in 39 counties were found to contain areas of potential
conflict.
The research findings and conclusions are presented in two
publications. The information in this report describes the work completed to identify
likely areas of conflict. The companion manual, Using Pennsylvania Natural HeritageProgram Data for Wind Energy Planning: A Manual for Townships, includes the maps
that show likely areas of conflict. It also may aid local officials in using the maps to
create restricted zones or ordinances to reduce wildlife risks and steer development
proposals to locations more appropriate for wind energy generation.
While they are not substitutes for detailed site reviews in proposed development areas,
these publications are proactive tools that may better ensure the coexistence of wind
energy and wildlife populations in Pennsylvania.
Introduction .................................................... 5The Context for Wind Energyin Pennsylvania ......................................... 5Threats to Wildlife from WindEnergy Developments ............................... 6Legally Protected Species ......................... 7A GIS Approach ......................................... 7
Goals and Objectives ................................... 8Data Acquisition and Preparation ............. 8Analysis: Data Overlays andIndex Development ................................... 8Generation of Township Maps .................. 8User’s Manual ........................................... 8
Methods ......................................................... 9Data ............................................................ 9File Conversion and Conflict Index ........... 9Map Preparation ...................................... 10
Results ......................................................... 10Conclusions ................................................. 10Policy Considerations ................................. 11References .................................................. 12Appendix: List of Townships PossessingConflicts Between Class 4 or GreaterWinds and PNHP Conservation Areas ....... 14
Table of Contents

Modeling Potential Wildlife-Wind Energy Conflict Areas 5
IntroductionAgainst the backdrop of rising energy demands and
concerns over the contribution of fossil fuel combustion
to climate change, it would appear that wind energy’s
time has come. Societal concerns have shaped federal
and state renewable energy policies, creating a favorable
environment for the wind energy industry. While wind
generation remains small as a percentage of electrical
output in the United States, it is growing rapidly, with
more than 19,500 MW of installed capacity as of June
2008 (AWEA, 2008). This growth is manifested in
clusters of turbines that must cover many acres, as each
turbine generates relatively little power compared to
conventional sources. Wind “farms” have a broad
footprint and thus are highly susceptible to the sorts of
land use conflicts evident among other forms of develop-
ment. Community reactions to wind energy proposals in
Pennsylvania and other states are not all positive, and
include fears over impacts to birds and other wildlife.
Scientific research to date, although in need of more
consistent methods and a greater understanding of
migratory and other species behavior, confirms that these
concerns are warranted (GAO, 2005). While “green” in
terms of air quality, wind energy installations are no
different from other human structures in the sense that
they modify habitat and create obstacles for wildlife.
Currently there is a pressing need to understand and
predict the ecological consequences of transforming
Appalachian landscapes for wind power generation
(GAO, 2005). This region, with its remote ridges,
powerful updrafts, and surrounding large population
centers, is especially vulnerable to conflicts.
This research provides a tool, in the form of a manual
and township-level maps, to better anticipate wildlife
impacts and facilitate desirable
outcomes in local planning and
permitting decisions. The research
used geographic information
systems (GIS) technology and data
from Pennsylvania’s Natural
Heritage Program (PNHP).
The Context for Wind Energy inPennsylvania
Pennsylvania currently ranks 16th
overall among states in terms of
installed wind generation capacity
(AWEA, 2008), but is a leader
among northeastern states. Growth
has been facilitated by Act 213,
signed into law in 2004. This
requires that 8 percent of the
state’s energy sold for retail
consumption come from “Tier I”
renewable energy sources, including wind, by 2021. It is
worth noting that surrounding states have also instituted
renewable standards—some more aggressive than
Pennsylvania’s—that will further fuel the market for
renewable electricity generated in Pennsylvania.
Wind energy facilities comprised of several turbines
began operating in Pennsylvania in 2000 (Table 1).
Spurred on by state initiatives for renewable energy and
topographic advantages in the form of ridgetops where
winds are strong and reliable, the industry has developed
rapidly and growth is expected to continue. In August
2008, the Associated Press reported that the Pennsylvania
Department of Environmental Protection (DEP) had
approved plans for the state’s largest wind power devel-
opment on the border of Tioga and Bradford counties; as
has become somewhat routine, the project was chal-
lenged by a local group (AP, 2008).
Wind energy projects in the state are increasing in size,
and can encompass thousands of acres. Turbines them-
selves occupy a small percentage of the area used. For
example, the National Renewable Energy Laboratory
website features a Windfarm Area Calculator1 that
assumes an individual turbine footprint of between 0.25
and 0.5 acres. The majority of project areas are con-
sumed by inter-turbine spacing, land use buffers, access
roads, and other infrastructure. Turbine heights are also
on the rise, and now commonly exceed 300 feet from the
base to the tip of the vertically extended blade.
With few exceptions, such as wetlands, the regulation
of wind energy facility siting on private lands in Penn-
sylvania falls under local jurisdiction (DCNR, 2006).
Local governments possess the power and responsibility
to plan for land use and its regulation under the Munici-
1 http://www.nrel.gov/analysis/power_databook/calc_wind.php.
Table 1: Existing wind power developments in Pennsylvania, 2008(Adapted from AWEA, 2008)

6 The Center for Rural Pennsylvania
palities Planning Code. However, local officials may beill-equipped to manage the unique challenges of windenergy proposals. DEP issued a model ordinance forwind energy facilities intended to protect public health,safety, and welfare, but the model ordinance does notaddress wildlife considerations (DEP, 2006). Promptedby a growing awareness of the potential for conflictsbetween wind energy and wildlife, the U.S. Fish andWildlife Service issued a set of guidelines (USFWS,2003); however, the document lacks regulatory authorityon private lands where Pennsylvania’s existing commer-cial wind turbine developments are located. Althoughsome local jurisdictions in Pennsylvania have adoptedordinances addressing wind energy safety, nuisance, anddecommissioning issues, none had targeted wildlifeinterests during the time of this research.
State agencies have taken steps to address wind powerand wildlife conflicts but they do not fully address localplanning needs. The Pennsylvania Game Commissionissued wind energy review guidelines for state gamelands to ensure that recreational and habitat valuesreceive highest priority and “better than equal” compen-sation if projects are approved. In April 2007, the GameCommission signed a voluntary agreement with 12companies to help safeguard wild resources on privatelands (Pennsylvania Game Commission, 2008). ThePennsylvania Wind and Wildlife Collaborative (PWWC),spearheaded by the Pennsylvania Department of Conser-vation and Natural Resources (DCNR), seeks to developprinciples and practices to address risks to wildlife andhabitat from wind power development; as of the publica-tion of this research, however, it has not producedguidelines applicable by local governments.
Local officials lacking the resources to manage windturbine developments in a comprehensive and consistentmanner are heavily reliant on advice given by projectproponents. Greatly needed are tools accessible to thenonspecialist to quickly screen for potential wind energy-wildlife conflicts and plan accordingly. More informed,objective decision-making regarding appropriate areasfor wind turbines would ultimately improve the pros-pects for wind energy in Pennsylvania. Indeed, currentgrass roots resistance to proposed wind energy develop-ments in the state is arising, in part, out of environmentalconcerns not addressed by local regulatory structures(Bourg, 2007 and SOAR, 2008).
Threats to Wildlife from Wind Energy DevelopmentsWildlife—notably migratory birds and bats—is vulner-
able to collisions with turbine blades (USGAO, 2005).Furthermore, habitat fragmentation and loss affect abroad spectrum of plants and animals. Pennsylvania’snorth central forested areas support the highest diversityof birds and mammals (Yahner, 2003), and much of thestate’s remaining intact forest is found along ridges
avoided by previous forms of land development. Windenergy brings new and novel risks to more natural andoften isolated landscapes that play a critical role insupporting Pennsylvania wildlife.
Bird ImpactsMultiple studies (Hunt, 1997; Orloff and Flannery,
1992, 1996; and Smallwood and Thelander, 2004) at theAltamont Wind Resources Area (AWRA) in Californiahave reported a high number of raptor deaths per year,including 75 to 116 Golden Eagles, 209 to 300 Red-tailed Hawks, and 73 to 333 American Kestrels. Con-structed during the 1980s, the facility predates designfeatures incorporated elsewhere to address aesthetic andecological concerns. AWRA serves as a worst-casescenario and has helped spark close scrutiny of windenergy facilities. In a contrasting example (Osborn et al.,2000), researchers observed less evidence of harm tobirds at the Buffalo Ridge facility in southwest Minne-sota; here only seven fatalities from collisions werefound during a 20-month period. Evidence at BuffaloRidge suggests that birds adjust their flight patterns toavoid turbines (Osborn et al. 1998). However, truecomparisons among existing studies remain problematicdue to inconsistent methods (Kulvesky et al., 2007). Birdmortality rates from wind turbines generally lag behindthose caused by collisions with vehicles, windows,communication towers, and power lines (Erikson et al.,2001). Yet it is important to note that concerns overavian mortality reflect quality as well as quantity; any lossof neotropical migrants or protected birds is cause forconcern because these populations are already stressed byhabitat loss and other impacts (Johnson et al., 2002).Numerous factors, such as bird abundance, presence ofmigration corridors, areal extent, topography, and preyabundance, can all influence the potential for avian mortal-ity at a wind power facility (Nelson and Curry, 1995).
For raptors, the specific relationship among flightbehavior, topography, and wind movement is central indetermining potential fatalities at any wind energyfacility (Hoover and Morrison, 2005). The mortality ofgriffon vultures within wind energy facilities in theStrait of Gibraltar in Spain was found to be related to theinteraction between wind and topography (Barrios andRodriquez, 2004). At AWRA, topography, wind patterns,and prey at the site were all contributors to red-tailedhawk fatalities (Hoover and Morrison, 2005). In Appala-chia, it is known that raptor migration is often concen-trated along higher elevations, such as ridge-tops and theedges of plateaus, where updrafts from deflected surfacewinds are present (Mueller and Berger, 1967). Thesefavorable locations for wind energy, if developed, pose apotential hazard for migrating raptors. Use of Appala-chian ridges during spring and fall migration is poorlyunderstood, however, and more research is needed.

Modeling Potential Wildlife-Wind Energy Conflict Areas 7
Bat ImpactsBats account for nearly a quarter of all mammal
species, yet they are poorly studied. They are exception-
ally vulnerable because of their low reproductive rates
and limited ability to recover from population clashes
(Barclay and Harder, 2003). Bat collisions with televi-
sion towers and other human-made structures are well
documented (Crawford and Baker, 1981), but clear
evidence of collisions at wind energy facilities emerged
more recently (Osborn et al., 1996). Migratory and tree-
roosting bat species appear to be most at risk (Horn et
al., 2008). The cumulative impacts of wind energy
development could significantly increase bat mortality,
particularly along the forested ridges of Appalachia
(Tuttle, 2004). Arnett et al. (2005) studied two ridge-top
wind energy facilities, the Meyersdale Wind Energy
Center in Pennsylvania and the Mountaineer Wind
Energy Center in West Virginia, for impacts to bats. A
total of 262 and 398 bat fatalities were recorded in a six-
week period at the Pennsylvania and West Virginia sites,
respectively. These numbers are among the highest ever
recorded and support the researchers’ contention that
forested ridges are locations of especially high risk for
bat fatalities at wind facilities, where bats may be
attracted to the turbines. The mechanisms behind tur-
bine-related bat fatalities are poorly understood; Kunz et
al. (2007) identified 11 different variables worthy of
investigation, including attractive prey and habitat
features at turbine sites, wind speed effects, and physi-
ological traits of bats that leave them vulnerable or
unable to detect threats from turbines. Very recent
evidence suggests trauma related to air pressure changes
is a factor (Baerwald et al., 2008).
Forest Fragmentation and Habitat ImpactsHabitat impacts specifically resulting from the con-
struction of wind energy facilities have not been exten-
sively studied. However, the ecological significance of
habitat pattern and its alteration through fragmentation
by human activities has been widely researched (Forman,
1995, provides a comprehensive overview). For ex-
ample, in a recent study, Chambers (2008) observed a
preference among salamanders for breeding sites away
from a logging road in south-central Pennsylvania.
While turbines themselves are the most prominent
features of a development, they rest on pads and are
linked by roads and power lines that alter the landscape.
Indeed, habitat fragmentation from this associated
infrastructure is potentially more damaging than direct
impacts from turbine collisions (Kuvlesky et al., 2007).
Fragmentation by roads and other activities causes
several “edge effects” that can extend hundreds of yards
into the interior of a habitat (Forman and Deblinger,
2000). These include greater light intensity, increased
temperature, decreased moisture, decreased leaf litter
accumulation, altered species abundance and composi-
tion, and a decreased nesting success rate among some
songbirds (WPC, 2005). Additionally, roads can serve as
pathways for the spread of invasive exotic species
(Trombulak and Frissell, 2000).
Legally Protected SpeciesApart from ecological concerns are legal concerns for
municipalities and developers stemming from the federal
Endangered Species Act (ESA) and Pennsylvania’s own
Wild Resources Conservation Act (WRCA). Under both
the ESA and WRCA, lists of species deemed to be
endangered or threatened are maintained. Endangered
species are those in danger of extinction throughout most
or all of their range. Threatened species are those likely
to become endangered. The ESA was passed in 1973,
and shortly thereafter, the Pennsylvania General Assem-
bly empowered the Game Commission to adopt and
expand the federal list as the state list. Damage caused to
species (“taking” in legal terminology) on either list carries
the potential for fines and/or imprisonment. It should be
noted, however, that no wind energy facility has been
prosecuted for violation of these acts (GAO, 2005).
Today there are far more state endangered and threat-
ened species than federal ones. Only nine federally listed
species are presently known to occur in the state, includ-
ing three mussels, two plants, two mammals, one reptile,
and one fish. Of these, the Indiana Bat is of most concern
with respect to wind power facilities. Bald eagles were
recently de-listed from the federal list, but remain on the
state list; they are also subject to additional protection
under the Bald and Golden Eagle Protection Act. The
state list includes hundreds of species, the majority of
which are plants. Casual inspection of distribution maps for
protected species indicates that the general ranges occupied
by many of the listed flora and fauna overlap areas of
commercially viable winds along the state’s ridges.
A GIS ApproachA computer-based geographic information system
(GIS) possesses mapping and database management
capabilities that enable rapid analysis and presentation of
spatial information. Geographically-referenced data, such
as road segments, local government boundaries, and
elevation points, are stored in layers that may be displayed
in maps or related mathematically to generate new vari-
ables, such as roads crossing steep slopes in a specific
county. GIS techniques are employed in a variety of land
use contexts, including wind energy development (Wiscon-
sin Department of Natural Resources, 2004; and Rodman
and Meentemeyer, 2006). GIS data representing wind
speeds and natural habitat in Pennsylvania do not currently
exist together in a format readily accessible by local
officials, hampering effective planning and increasing
the likelihood of conflicts arising from wind develop-
ment proposals.
PNHP data collected through the state Natural Heritage

8 The Center for Rural Pennsylvania
Inventory (NHI) are publicly available in GIS form as
Natural Heritage Area (NHA) polygons. The polygons
represent habitat buffers surrounding species point
observations. (The original points and the species they
represent are restricted information.) They carry four
general designations (WPC, 2005):
• Biological Diversity Areas (BDAS) containing plants
or animals of special concern at state or federal levels,
exemplary natural communities, or exceptional native
diversity.
• Landscape Conservation Areas (LCAS), large con-
tiguous areas that are important because of their size,
open space, habitats, and/or inclusion of one or more
BDAs. These typically have not been heavily disturbed
and thus retain much of their natural character.
• Important Bird Areas (IBAS) meeting one of several
criteria developed by the Ornithological Technical
Committee of the Pennsylvania Biological Survey. The
Pennsylvania Audubon Society administers the state’s
IBA Program and defines an IBA as “a site that is part
of a global network of places recognized for their
outstanding value to bird conservation.”
• Important Mammal Areas (IMAS), nominated under
the Important Mammal Areas Project (IMAP) being
implemented by a broad alliance of sportsmen, conser-
vation organizations, wildlife professionals, and
scientists. These must fulfill criteria developed by the
Mammal Technical Committee of the Pennsylvania
Biological Survey.
The county-based NHIs are undertaken by scientists,
including volunteers and employees of the Western
Pennsylvania Conservancy (WPC) and the Nature
Conservancy, with the purpose of “provid[ing] current,
reliable, objective information to help inform environ-
mental decisions,” and “guid[ing] conservation work and
land use planning, ensuring the maximum conservation
benefit with the minimum cost.” The inventories cover
nearly all of the state’s counties, including those with
wind speeds sufficient for commercial development. The
data are frequently historical in nature, and often origi-
nate from public lands—participation by private land-
owners is voluntary. The NHIs offer the best available
body of current ecological data, and are used by state
agencies for tasks, such as National Pollutant Discharge
Elimination System (NPDES) stormwater permit
reviews. Natural heritage information, when combined
with wind speed data, can provide a means of assessing
the potential for conflicts between wildlife management
and wind energy land use objectives.
This research, conducted in 2008, was undertaken to
model where conflicts between ecologically significant
areas and wind energy developments in Pennsylvania are
likely to occur. Furthermore, the model was intended to
function as a means of prioritizing concerns among these
areas of conflict. Objectives centered around the applica-
tion of GIS techniques to develop township-level maps
usable for planning purposes by local officials, and
around the acquisition and use of natural heritage and
wind speed data.
Data Acquisition and PreparationThe first general objective was to compile a database
for use in the GIS analyses. This required the purchase of
wind speed data from a private vendor (AWS Truewind,
LLC) and coordination with the WPC to obtain NHA
data. Because the two data sets were in different, general
purpose formats, they needed to be standardized and
modified to serve the specific demands of the project.
The U.S. Department of Energy classifies wind speed on
a scale ranging from one through seven; wind speeds
below Class 4 are not generally desired for commercial
purposes, and were removed from the dataset.
Analysis: Data Overlays and Index DevelopmentTo relate commercial and wildlife interests displayed
by the map data layers, thereby identifying areas of
potential conflict, the researchers superimposed (over-
laid) wind speed and NHAs. This overlay process was
also needed to show the coexistence of NHAs. The
researchers used the numbers and types of NHAs at a
location as a basis for attributing ecological significance.
To develop an index usable for setting land use priori-
ties, they ranked areas of overlap among wind speeds and
different NHAs in a new map layer. The resulting
“conflict” index was intended to communicate the level
of ecological importance of areas featuring commercially
desirable wind speeds.
Generation of Township MapsTo present the results from the analyses in a format
suitable for use by local officials, the researchers selected
Pennsylvania townships containing areas of conflict, and
constructed separate map files scaled to the individual
townships. They designed a legend scheme to clearly
present the conflict index and added reference features to
orient map readers.
User’s ManualGiven the technical nature of the information pre-
sented, and the specialized procedures employed, the
researchers documented their steps in creating the maps
and developed a user’s manual to help local officials
interpret them. The manual also provides recommenda-
tions on how local officials can use the maps for plan-
ning purposes. The manual, Using Pennsylvania NaturalHeritage Program Data for Wind Energy Planning: AManual for Townships, is available as a separate document.
Goals and Objectives

Modeling Potential Wildlife-Wind Energy Conflict Areas 9
The researchers assessed the vulnerability of ecological
features to wind energy development by creating an
index that assigned ordinal ranks to different classes of
NHA polygons and summed the intersections of the
different polygon types in areas of Class 4 or higher wind
speeds. The researchers used ArcGIS 9.2 software, pro-
duced by the Environmental Systems Research Institute
(ESRI) and licensed to the Indiana University of Pennsyl-
vania Department of Geography and Regional Planning
SEAL Laboratory, to analyze data and create the maps.
The maps were designed as a screening tool to
proactively highlight areas of concern or opportunity.
They are not a substitute for more detailed site analyses
once a permit application has actually been submitted.
DataThe researchers purchased the wind speed data for
Pennsylvania from AWS Truewind, LLC. The data were
originally developed for the U.S. Department of Energy
in 2002 and revised in 2006. They represent predictions
based on a model incorporating terrain and historical
weather data, and have a standard error of 7 percent or
less. The researchers reclassified the wind dataset to identify
areas of wind speeds of 15.7 mph or greater at 164 feet (50
m) above ground. These are areas of at least Class 4 sought
by wind energy developers. (For convenience, “Class 4” is
used to refer to all of the reclassified areas.)
The researchers obtained the NHA polygon data from
the WPC. Information concerning precise points of
species occurrence is restricted; however, NHAs are
corresponding habitats delineated by ecologists and
suitable for land use planning. They are organized into
data files as Biological Diversity Areas (BDAs), Land-
scape Conservation Areas (LCAs), Important Mammal
Area (IMAs), and Important Bird Area (IBAs).
BDAs and LCAs are updated on an ongoing basis
through county NHIs; all PNHP data used were current
as of April 2008. NHAs originate from field observations
by different researchers and organizations, and the above
categories are not mutually exclusive. Areal overlap
among different types of polygons occurs in many cases,
emphasizing the importance of some locations.
Within the county-level NHI reports, NHAs are further
distinguished by their level of significance, such as excep-
tional, high, or notable status. However, the researchers
could not include these rankings in the analyses. Signifi-
cance rankings for polygons were not consistently pro-
vided among the GIS files, and the size of the database
prohibited manual entry of missing information from the
original natural heritage inventory reports.
File Conversion and Conflict IndexThe researchers combined the NHA polygons with the
wind data and made additional modifications to the NHA
files to develop the index.
They later combined six “layers” or types of map
polygons to generate the conflict index. Polygon cells
were assigned values based on the layer to which they
belonged (Table 2). The index was produced by sum-
ming all cell values occupying the same map space.
Higher values represent a greater concentration of
ecological resources, and corresponding risk if developed
for wind energy.
The layer values are weightings developed under the
following assumptions:
1) The information contained in the NHAs and the
qualities they represent may allow one to assign higher
priority to some categories than others, but they do not
allow the true assessment of how much more sensitive
or noteworthy one polygon type is than another. For
example, habitats that are more rare or unique can be
interpreted as more significant, but no all-encompass-
ing unit of measure exists to compare value among
different habitats used by birds, mammals, or other
organisms. Attributing mathematical significance
beyond the ordinal level is not appropriate.
2) Overlaps among the different NHA polygon types
signify that some areas have been deemed significant
under multiple approaches and objectives, such as bird
conservation or mammal conservation. These areas
should be weighted accordingly in the index.
3) A potential problem when adding multiple criteria
in an index is that areas that are truly exceptional in
one respect may achieve lower sums than areas that
simply avoid low scores among the different critieria
(Smith and Theberge, 1987). Because of their tran-
scending importance to many species and their often
undisturbed character, BDAs represent the highest
conservation priority. As a generalization, the presence
of a BDA should outrank any other ecological consid-
erations when using the township conflict maps. (In
practice, critical IBA and IMA features are typically
captured in BDAs.) Further, Core BDAs are of higher
conservation priority than Support BDAs, which act
more to enhance the functions of core areas.
Following this rationale, layer values used in
generating the index are intended to highlight the
significance of BDAs in the map overlays. A value
of 1 is assigned to map cells belonging to LCAs,
IBAs, and IMAs; however, values of 10 and 100 are
applied to Support BDAs and Core BDAs, respec-
tively. Summed layer values – the index – summa-
Methods
Table 2: Values used in conflict index rankings
10 The Center for Rural Pennsylvania
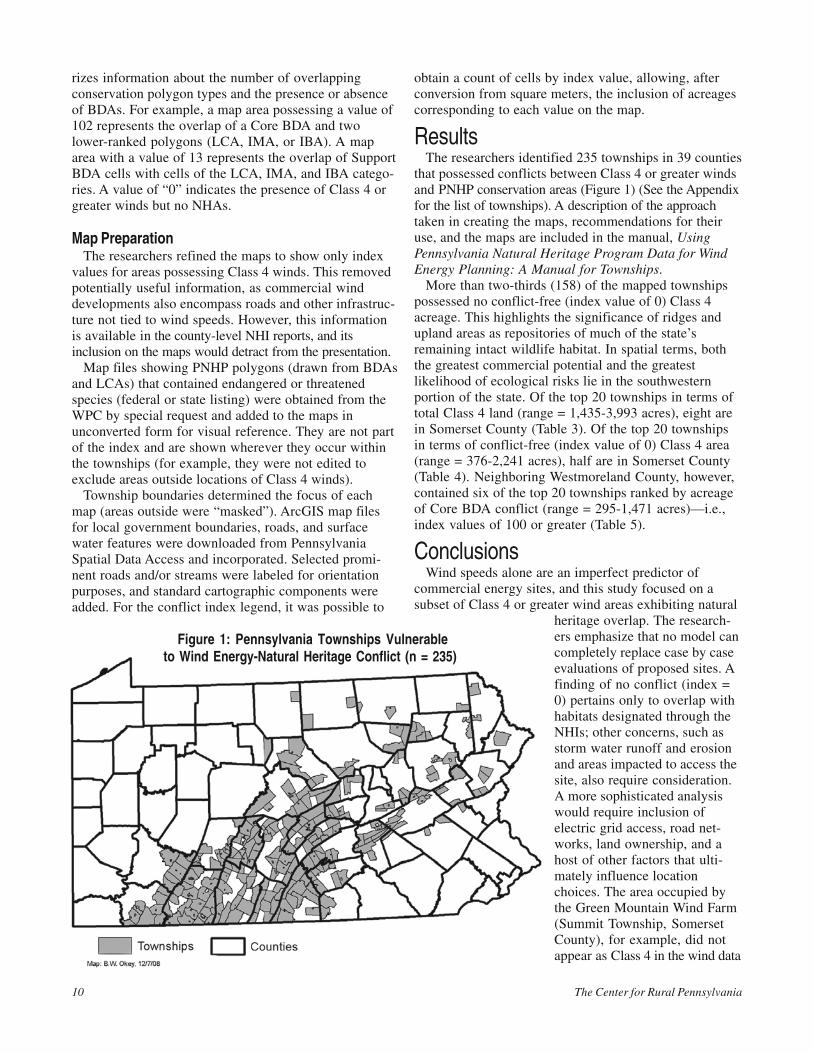
rizes information about the number of overlapping
conservation polygon types and the presence or absence
of BDAs. For example, a map area possessing a value of
102 represents the overlap of a Core BDA and two
lower-ranked polygons (LCA, IMA, or IBA). A map
area with a value of 13 represents the overlap of Support
BDA cells with cells of the LCA, IMA, and IBA catego-
ries. A value of “0” indicates the presence of Class 4 or
greater winds but no NHAs.
Map PreparationThe researchers refined the maps to show only index
values for areas possessing Class 4 winds. This removed
potentially useful information, as commercial wind
developments also encompass roads and other infrastruc-
ture not tied to wind speeds. However, this information
is available in the county-level NHI reports, and its
inclusion on the maps would detract from the presentation.
Map files showing PNHP polygons (drawn from BDAs
and LCAs) that contained endangered or threatened
species (federal or state listing) were obtained from the
WPC by special request and added to the maps in
unconverted form for visual reference. They are not part
of the index and are shown wherever they occur within
the townships (for example, they were not edited to
exclude areas outside locations of Class 4 winds).
Township boundaries determined the focus of each
map (areas outside were “masked”). ArcGIS map files
for local government boundaries, roads, and surface
water features were downloaded from Pennsylvania
Spatial Data Access and incorporated. Selected promi-
nent roads and/or streams were labeled for orientation
purposes, and standard cartographic components were
added. For the conflict index legend, it was possible to
obtain a count of cells by index value, allowing, after
conversion from square meters, the inclusion of acreages
corresponding to each value on the map.
The researchers identified 235 townships in 39 counties
that possessed conflicts between Class 4 or greater winds
and PNHP conservation areas (Figure 1) (See the Appendix
for the list of townships). A description of the approach
taken in creating the maps, recommendations for their
use, and the maps are included in the manual, UsingPennsylvania Natural Heritage Program Data for WindEnergy Planning: A Manual for Townships.
More than two-thirds (158) of the mapped townships
possessed no conflict-free (index value of 0) Class 4
acreage. This highlights the significance of ridges and
upland areas as repositories of much of the state’s
remaining intact wildlife habitat. In spatial terms, both
the greatest commercial potential and the greatest
likelihood of ecological risks lie in the southwestern
portion of the state. Of the top 20 townships in terms of
total Class 4 land (range = 1,435-3,993 acres), eight are
in Somerset County (Table 3). Of the top 20 townships
in terms of conflict-free (index value of 0) Class 4 area
(range = 376-2,241 acres), half are in Somerset County
(Table 4). Neighboring Westmoreland County, however,
contained six of the top 20 townships ranked by acreage
of Core BDA conflict (range = 295-1,471 acres)—i.e.,
index values of 100 or greater (Table 5).
Wind speeds alone are an imperfect predictor of
commercial energy sites, and this study focused on a
subset of Class 4 or greater wind areas exhibiting natural
heritage overlap. The research-
ers emphasize that no model can
completely replace case by case
evaluations of proposed sites. A
finding of no conflict (index =
0) pertains only to overlap with
habitats designated through the
NHIs; other concerns, such as
storm water runoff and erosion
and areas impacted to access the
site, also require consideration.
A more sophisticated analysis
would require inclusion of
electric grid access, road net-
works, land ownership, and a
host of other factors that ulti-
mately influence location
choices. The area occupied by
the Green Mountain Wind Farm
(Summit Township, Somerset
County), for example, did not
appear as Class 4 in the wind data
Results
Conclusions
Figure 1: Pennsylvania Townships Vulnerableto Wind Energy-Natural Heritage Conflict (n = 235)

Modeling Potential Wildlife-Wind Energy Conflict Areas 11
while the location of the neighboring Meyersdale facility
did. However, the conflict index did highlight 16 of 17
townships where the state’s existing commercial wind
turbine arrays are located (Table 1). (Only Clinton
Township, Wayne County, exhibited no natural heritage
conflict and was thus not captured in the study.)
Many of the townships mapped possessed relatively
small amounts of Class 4 area—as little as 3 acres—and
thus may not arouse the interest of developers. Seventy-
one townships contained less than 100 Class 4 acres, with
or without natural heritage conflict, and not necessarily
contiguous. The state’s existing wind developments
typically cover areas ranging from hundreds to thousands
of acres, although only a small portion of the land is
used for the turbines themselves. For example, the
Somerset Wind Power Project (six turbines) occupies
400 acres, while the Meyersdale facility (20 turbines)
encompasses nearly 3,000 acres. The feasibility of
commercial wind developments in townships with small
or fragmented apportionments of Class 4 land will be
heavily influenced by other mitigating factors like land
ownership and accessibility.
This research serves as a first attempt that may cer-
tainly be revised as NHIs are updated, commercial wind
technology evolves, and the nature of risks to specific
species is better understood. Efforts to add missing
information to GIS files derived from NHIs would allow
the inclusion of more criteria and refinements to the
model. Better understanding of flyways used by transitory
migrants, as opposed to resident wildlife populations more
fully captured in the NHAs, could also help to improve
the model and its application in land use regulation.
Policy considerations from this study center on the
municipal level, where natural heritage data would be
applied to zoning ordinances or other local planning
mechanisms. At the state level, such efforts could be
encouraged by agencies such as DEP. The DEP model
ordinance represents a first step in guiding local officials,
however, it could be expanded to address concerns
related to habitats and vulnerable species.
For townships with existing zoning ordinances, overlay
zoning could be used in the development of wind energy
special purpose zones. Overlay zoning places special
districts atop underlying base zones to add provisions to
those zones (Gravin, 2001). These may include regula-
tions or incentives to protect specific resources or
otherwise guide development. The overlay districts may
Table 4: Top 20 townships ranked by Class 4 area withno natural heritage conflict (index = 0)
Table 5: Top 20 townships ranked by area of CoreBDA-Class 4 overlap (index = 100 to 103)
Policy Considerations
Table 3: Top 20 townships ranked by total Class 4 windarea (index = 0 to 103)

12 The Center for Rural Pennsylvania
share base zone boundaries or they may cut across them.
In 2008, among Pennsylvania jurisdictions, only Logan
Township in Blair County has used the overlay zone
approach specifically for commercial wind energy
facilities; this followed an amendment passed by the
supervisors in 2006 that was based, in part, on the DEP
model ordinance.
An overlay zone derived from the conflict index could
supplement DEP’s model ordinance and provide a more
comprehensive method for siting wind energy facilities.
For example, township planners could designate com-
mercial wind development as a permitted land use in
areas possessing an index score of 0. Wind energy might
be declared a conditional land use among areas with
scores ranging from 1 through 13, subject to case-by-
case review. Commercial wind development would be
prohibited in Core BDAs featuring scores of 100 through
103. Such a strategy would allow for development yet
remove areas of greatest ecological concern from
consideration. It would also require administrative
commitment. Staff, technical abilities, and financial
resources are necessary to create a wind energy zone and
maintain a GIS database of current natural heritage data.
Conditional use areas require a review process, perhaps
based on the U.S. Fish and Wildlife Service (2003)
guidelines. Post-construction wildlife impact studies also
need to be considered.
Townships lacking a zoning ordinance might still use
the conflict maps as a basis for establishing setbacks in
wind energy ordinances. In this application, setback
distances would increase with the conflict index score.
Wind developments might be required to locate at least
1,000 feet away from areas with values ranging from
100 to 103, whereas development might be permitted
beyond 500 feet from areas of moderate conflict. No
setbacks would be required for areas scoring 0 on the
index. Consultation with NHI staff and other scientists
would aid in ensuring that distances used reflected local
ecological concerns. Currently, a wind energy ordinance
in Tyrone Borough, Blair County, employs a 2,000-foot
setback from natural heritage and other resource areas.
The above measures, though focused locally, have
potential for cumulative benefits at the regional and state
levels if consistently applied. Ecologically significant
areas frequently transcend political divisions. Continuing
discussions among state resource management agencies,
such as DEP, DCNR, the Game and Fish and Boat
commissions and townships, would help establish
common standards throughout adjoining jurisdictions.
Ultimately, more comprehensive land use planning that
protects ecological assets in Pennsylvania’s rural uplands
can help wind energy live up to its green potential.
Arnett, E.B. (2005). Relationships Between Bats and Wind Turbines in Pennsylvania and West Virginia: An Assessment ofBat Fatality Search Protocols, Patterns of Fatality, and Behavioral Interactions with Wind Turbines. A Final ReportSubmitted to the Bats and Wind Energy Cooperative. Austin, TX: Bat Conservation International.
Associated Press (AP) (2008, August 2). “Wind Power Project Gets OK from State.” The Indiana Gazette, p. 3.
American Wind Energy Association (AWEA) (2008). U.S. Wind Energy Projects. http://www.awea.org/projects/Default.aspx
(last accessed 15 September 2008).
Baerwald, E.F., G.H. D’Amours, B.J. Klug, and R.M.R. Barclay. (2008). “Barotrauma Is a Significant Cause of Bat Fatalities
at Wind Turbines.” Current Biology 18:R695-R696.
Barclay, R. and L. Harder. (2003). “Life Histories in Bats: Life in the Slow Lane.” In Bat Ecology. pp. 209-253. Chicago:
The University of Chicago Press.
Barrios, L. and A. Rodriquez. (2004). “Behavioral and Environmental Correlates of Soaring-Bird Mortality at On-Shore
Wind Turbines.” Journal of Applied Ecology 41:77-81.
Bourg, A. (2007, May 27). “Shaffer Mountain Turbine Fight Taken to Web.” Altoona Mirror, pp. A1, A11.
Chambers, D.L. (2008). “Logging Road Effects on Breeding-Site Selection in Notophthalmus Viridescens (Red-spotted
Newt) and Three Mmbystomatid Salamanders in South-Central Pennsylvania.” Northeastern Naturalist 15:123-130.
Crawford, R.L. and W.W. Baker. (1981). “Bats Killed at a North Florida Television Tower: A 25-Year Record.” Journal ofMammology 62:651-652.
Erikson, W.P., G.D. Johnson, M.D. Strickland, D.P. Young, J.A. Sernka, and R.E. Good. (2001). Avian Collisions with WindTurbines: A Summary of Existing Studies and Comparisons to Other Sources of Avian Collision Mortality in the UnitedStates. National Wind Coordinating Committee: Washington, DC.
Forman, R.T.T. (1995). Land Mosaics: The Ecology of Landscapes and Regions. Cambridge, U.K.: Cambridge University Press.
Forman, R.T.T. and R.D. Deblinger. (2000). “The Ecological Road-Effect Zone of a Massachusetts (USA) Suburban
Highway.” Conservation Biology 14: 36-46.
Gravin, E. (2001). “Making Use of Overlay Zones.” Planning Commissioners Journal 43:16-17.
Hoover, S.L. and M.L. Morrison. (2005). “Behavior of Red-tailed Hawks in a Wind Turbine Development.” Journal ofWildlife Management 69:150-159.
References

Modeling Potential Wildlife-Wind Energy Conflict Areas 13
Horn, J.W., E.B. Arnett, and T.H. Kunz. (2008). “Behavioral Responses of Bats to Operating Wind Turbines.” Journal ofWildlife Management 72:123-132.
Hunt, G. (1997). A Population Study of Golden Eagles in the Altamont Pass Wind Resource Area: Second-Year ProgressReport. Prepared by Predatory Bird Research Group, Santa Cruz, CA for the National Renewable Energy Laboratory,
Golden, CO. Publication NREL SR-440-230-87.
Johnson, G.D., W.P. Erickson, M.D. Strickland, M.F. Shepherd, and S.A. Sarappo. (2002). “Collision Mortality of Local and
Migrant Birds at a Large-Scale Wind-Power Development on Buffalo Ridge, Minnesota.” Wildlife Society Bulletin 30:
879-888.
Kunz, T.H., E.B.Arnett, P.E. Wallace, A.R. Hoar, G.D. Johnson, R.P. Larkin, M.D. Strickland, R.W. Thresher, and M.D. Tuttle.
(2007). “Ecological Impacts of Wind Energy Development on Bats: Questions, Research Needs, and Hypotheses.”
Frontiers in Ecology and the Environment 5:315-324.
Kuvlesky, W.P., L.A. Brennan, M.L. Morrison, K.K. Boydston, B.M. Ballard, and F.C. Bryant. (2007). “Wind Energy Develop-
ment and Wildlife Conservation: Challenges and Opportunities.” Journal of Wildlife Management 71:2487-2498.
Mueller, H.C. and D.D. Berger. (1967). “Wind Drift, Leading Lines, and Diurnal Migration.” Wilson Bulletin 79:50-63.
Nelson, H.K. and R.C. Curry. (1995). “Assessing Avian Interaction with Wind Power Development and Operation.” Transac-tions of the North American Wildlife and Natural Resource Conference 60:266-277.
Orloff, S. and A. Flannery. (1992). Wind Turbine Effects on Avian Activity, Habitat Use, and Mortality in Altamont Pass andSolano County Wind Resources Areas. Prepared by BioSystems Analysis, Inc., Tiburon, CA for the California Energy
Commission, Sacramento.
Orloff, S. and A. Flannery. (1996). A Continued Examination of Avian Mortality in the Altamont Pass Wind Resource Area.
Prepared by BioSystems Analysis, Inc., Tiburon, CA for the California Energy Commission, Sacramento.
Osborn, R.G., C.D. Dieter, K.F. Higgins, and R.E. Usgaard. (1998). “Bird Flight Characteristics Near Wind Turbines in
Minnesota.” American Midland Naturalist 139:29-38.
Osborn, R.G., K.F. Higgins, C.D. Dieter, and R.E. Usgaard. (1996). “Bat Collisions with Wind Turbines in Southwestern
Minnesota.” Bat Research News 37:105-107.
Osborn, R.G., K.F.Higgins, R.E. Usgaard, C.D. Dieter, and R.D. Neiger. (2000). “Bird Mortality Associated with Wind
Turbines at the Buffalo Ridge Wind Resource Area, Minnesota.” American Midland Naturalist 143:41-52.
Pennsylvania Department of Conservation and Natural Resources (DCNR) (2006). Local Land Use Controls in Pennsylva-nia as They Relate to Wind Farm Development. Harrisburg, PA: DCNR.
Pennsylvania Department of Environmental Protection (DEP) (2006). Model Ordinance for Wind Energy Facilities.www.depweb.state.pa.us/energy/lib/energy/docs/wind_model_ordinance_draft_(12-8-06).doc (last accessed 13 September
2008).
Pennsylvania Game Commission (2008). Game Commission Wind Energy Voluntary Cooperative Agreement. http://
www.pgc.state.pa.us/pgc/cwp/view.asp?a=483&q=171755 (last accessed 15 September 2008).
Rodman, L.C., and R.K. Meentemeyer. (2006). “A Geographic Analysis of Wind Turbine Placement in Northern California.”
Energy Policy, 34(15):2137-2149.
Save Our Allegheny Ridges (SOAR) 2008. Save Our Allegheny Ridges. http://www.saveouralleghenyridges.com/ (last
accessed 15 September 2008).
Smallwood, K.S. and C.G. Thelander. (2004). Developing Methods to Reduce Bird Mortality in the Altamont Pass WindResource Area. Public Interest Energy Research Program, Final Project Report 500-04-052, prepared for the California
Energy Commission.
Smith, P.G.R. and J.B. Theberge. (1987). “Evaluating Natural Areas Using Multiple Criteria: Theory and Practice.” Environ-mental Management 11:447-460.
Trombulak, S.C. and C.A. Frissell. (2000). “Review of Ecological Effects of Roads on Terrestrial and Aquatic Communities.”
Conservation Biology 14:18-30.
Tuttle, M. (2004). “Wind Energy and the Threat to Bats.” Bats 22:4-5.
U.S. Fish and Wildlife Service (USFWS) (2003). Interim Guidelines to Avoid and Minimize Wildlife Impacts from WindTurbines. Washington, D.C.: USFWS.
U.S. Government Accountability Office (USGAO) (2005). Wind Power: Impacts on Wildlife and Government Responsibili-ties for Regulating Development and Protecting Wildlife. Publication GAO-05-906. Washington, D.C.: GAO.
Western Pennsylvania Conservancy (WPC) (2005). Somerset County Natural Heritage Inventory. Pittsburgh, PA: Western
Pennsylvania Conservancy.
Wisconsin Department of Natural Resources. (2004). Considering Natural Resource Issues in Windfarm Siting in Wiscon-sin: A Guidance. Wisconsin Department of Natural Resources: Madison, WI.
Yahner, R.H. (2003). “Terrestrial Vertebrates in Pennsylvania: Status and Conservation in a Changing Landscape.” North-eastern Naturalist 10:343-360.
14 The Center for Rural Pennsylvania
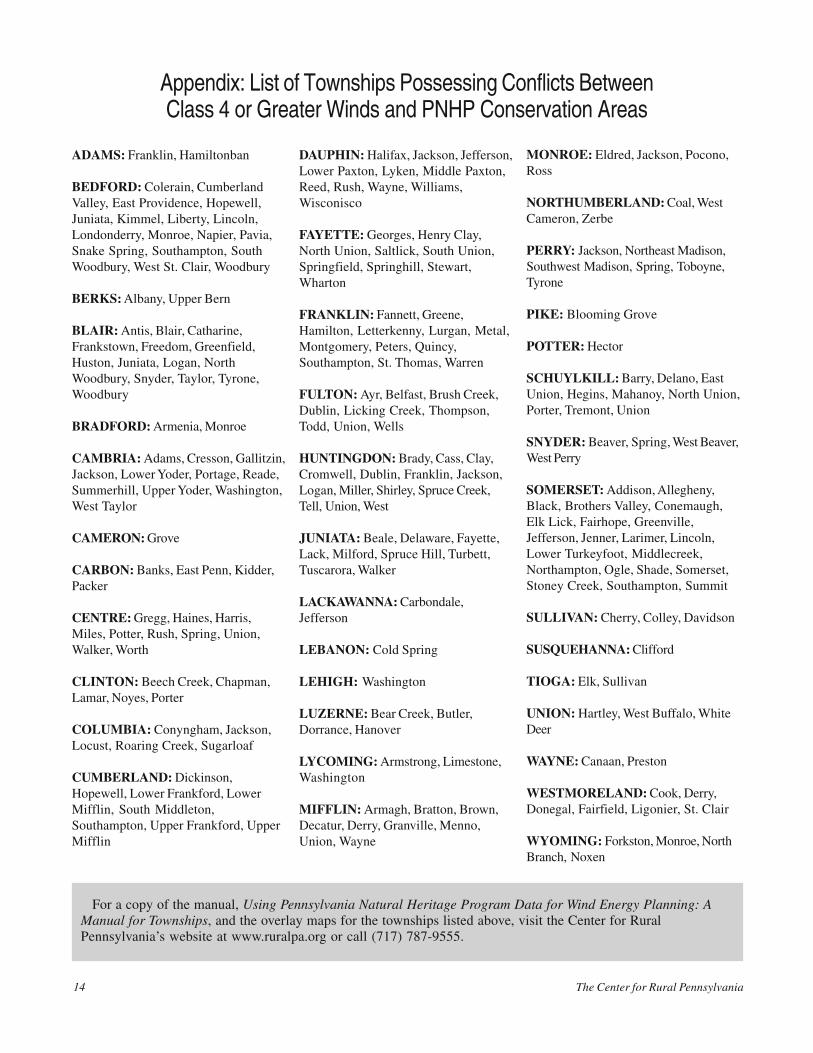
Appendix: List of Townships Possessing Conflicts BetweenClass 4 or Greater Winds and PNHP Conservation Areas
ADAMS: Franklin, Hamiltonban
BEDFORD: Colerain, Cumberland
Valley, East Providence, Hopewell,
Juniata, Kimmel, Liberty, Lincoln,
Londonderry, Monroe, Napier, Pavia,
Snake Spring, Southampton, South
Woodbury, West St. Clair, Woodbury
BERKS: Albany, Upper Bern
BLAIR: Antis, Blair, Catharine,
Frankstown, Freedom, Greenfield,
Huston, Juniata, Logan, North
Woodbury, Snyder, Taylor, Tyrone,
Woodbury
BRADFORD: Armenia, Monroe
CAMBRIA: Adams, Cresson, Gallitzin,
Jackson, Lower Yoder, Portage, Reade,
Summerhill, Upper Yoder, Washington,
West Taylor
CAMERON: Grove
CARBON: Banks, East Penn, Kidder,
Packer
CENTRE: Gregg, Haines, Harris,
Miles, Potter, Rush, Spring, Union,
Walker, Worth
CLINTON: Beech Creek, Chapman,
Lamar, Noyes, Porter
COLUMBIA: Conyngham, Jackson,
Locust, Roaring Creek, Sugarloaf
CUMBERLAND: Dickinson,
Hopewell, Lower Frankford, Lower
Mifflin, South Middleton,
Southampton, Upper Frankford, Upper
Mifflin
DAUPHIN: Halifax, Jackson, Jefferson,
Lower Paxton, Lyken, Middle Paxton,
Reed, Rush, Wayne, Williams,
Wisconisco
FAYETTE: Georges, Henry Clay,
North Union, Saltlick, South Union,
Springfield, Springhill, Stewart,
Wharton
FRANKLIN: Fannett, Greene,
Hamilton, Letterkenny, Lurgan, Metal,
Montgomery, Peters, Quincy,
Southampton, St. Thomas, Warren
FULTON: Ayr, Belfast, Brush Creek,
Dublin, Licking Creek, Thompson,
Todd, Union, Wells
HUNTINGDON: Brady, Cass, Clay,
Cromwell, Dublin, Franklin, Jackson,
Logan, Miller, Shirley, Spruce Creek,
Tell, Union, West
JUNIATA: Beale, Delaware, Fayette,
Lack, Milford, Spruce Hill, Turbett,
Tuscarora, Walker
LACKAWANNA: Carbondale,
Jefferson
LEBANON: Cold Spring
LEHIGH: Washington
LUZERNE: Bear Creek, Butler,
Dorrance, Hanover
LYCOMING: Armstrong, Limestone,
Washington
MIFFLIN: Armagh, Bratton, Brown,
Decatur, Derry, Granville, Menno,
Union, Wayne
MONROE: Eldred, Jackson, Pocono,
Ross
NORTHUMBERLAND: Coal, West
Cameron, Zerbe
PERRY: Jackson, Northeast Madison,
Southwest Madison, Spring, Toboyne,
Tyrone
PIKE: Blooming Grove
POTTER: Hector
SCHUYLKILL: Barry, Delano, East
Union, Hegins, Mahanoy, North Union,
Porter, Tremont, Union
SNYDER: Beaver, Spring, West Beaver,
West Perry
SOMERSET: Addison, Allegheny,
Black, Brothers Valley, Conemaugh,
Elk Lick, Fairhope, Greenville,
Jefferson, Jenner, Larimer, Lincoln,
Lower Turkeyfoot, Middlecreek,
Northampton, Ogle, Shade, Somerset,
Stoney Creek, Southampton, Summit
SULLIVAN: Cherry, Colley, Davidson
SUSQUEHANNA: Clifford
TIOGA: Elk, Sullivan
UNION: Hartley, West Buffalo, White
Deer
WAYNE: Canaan, Preston
WESTMORELAND: Cook, Derry,
Donegal, Fairfield, Ligonier, St. Clair
WYOMING: Forkston, Monroe, North
Branch, Noxen
For a copy of the manual, Using Pennsylvania Natural Heritage Program Data for Wind Energy Planning: AManual for Townships, and the overlay maps for the townships listed above, visit the Center for Rural
Pennsylvania’s website at www.ruralpa.org or call (717) 787-9555.


The Center for Rural PennsylvaniaBoard of Directors
The Center for Rural Pennsylvania
200 North Third Street, Suite 600
Harrisburg, PA 17101
Phone: (717) 787-9555
Fax: (717) 772-3587
www.ruralpa.org
1P0509–500
ChairmanSenator John R. Gordner
Vice ChairmanRepresentative Tina Pickett
TreasurerSenator John Wozniak
SecretaryDr. Nancy Falvo
Clarion University
Representative Tim Seip
Dr. Theodore R. AlterPennsylvania State University
Steve CrawfordGovernor’s Representative
Dr. Stephan J. GoetzNortheast Regional Center for Rural Development
Dr. Keith T. MillerLock Haven University
Dr. Robert J. PackUniversity of Pittsburgh
William SturgesGovernor’s Representative