modeling soot derived from pulverized coal - ira a....
TRANSCRIPT
Modeling Soot Derived from Pulverized Coal
Alexander L. Brown
Department of Mechanical Engineering, Brigham Young University, Provo, Utah 84602
Thomas H. Fletcher*
Department of Chemical Engineering, 350 CB, Brigham Young University, Provo, Utah 84602
Received December 10, 1997
A semiempirical model has been developed for predicting coal-derived soot. The main featureof the model is a transport equation for soot mass fraction. Tar prediction options include eitheran empirical or a transport equation approach, which directly impacts the source term for sootformation. Also, the number of soot particles per unit mass of gas may be calculated using eithera transport equation or an assumed average. Kinetics are based on Arrhenius rates taken frompublished measurements. Radiative properties are calculated as a function of averaged opticalconstants, predicted gas temperatures, predicted gas densities, and the soot mass fractions. Thismodel has been incorporated into a comprehensive coal modeling code and evaluated based oncomparisons with soot, temperature, and NOx measurements for three experimental cases.Accurate predictions of soot yields have been achieved for both laminar and turbulent coal flames.Larger scale turbulent predictions illustrated that inclusion of a soot model changed the localgas temperatures by as much as 300 K and the local NOx concentration by as much as 250 ppm.These predictions demonstrate the necessity for an accurate soot model in coal combustionsystems.
Introduction
Soot is understood to form in many hydrocarbonflames principally from the combination and condensa-tion of acetylene, benzene, or other aromatic hydrocar-bons.1 At high temperatures in many flames, radiationfrom typical quantities of soot impacts the energytransfer.2 Neglecting the soot in a theoretically basedmodel may cause several hundred degrees difference inthe predicted flame region. This error in temperaturecan result in significant error in the chemistry predic-tions, since kinetic predictions are a strong function oftemperature. Soot can also be an emissions problem,even in coal-fired systems. Incorporation of an accuratesoot model into comprehensive coal combustion codesis therefore desirable as a means to help describe NOxemissions, carbon carryover, and fine particle emission.
Very little information regarding soot formation fromcoal is available in the literature,3 and therefore it isimportant to give an overview of soot formation modelsfor simple hydrocarbons. One approach to soot model-ing in simple systems is to develop kinetic mechanismsthat describe the soot formation processes.4,5 Whilelarge kinetic mechanisms can be quite accurate, these
methods are computationally intensive and beyond thecapabilities of most current comprehensive modelingcodes. Despite the inability to use large mechanismsin comprehensive codes, such mechanisms still proveuseful in explaining experimental measurements insimple systems as well as serving as benchmarks forreduced mechanisms. Unfortunately, no soot formationmechanisms are available for coal tar, due the complex-ity of the species involved.
Moss et al.6 developed a relationship for axi-sym-metric laminar gaseous diffusion flames using transportequations for the mass fraction, including nucleation,surface growth, and oxidation source terms. Otherresearchers have recently used variations of this rela-tionship by solving transport equations for soot numberdensity, soot volume fraction and mass fraction ofsoot.7-9 The mass fraction of soot is related to the sootvolume fraction by the ratio of the average local gasdensity to the average soot density:
Most of these studies involve the derivation of new
* Corresponding author.(1) Haynes, B. S. Soot and Hydrocarbons in Combustion. In Fossil
Fuel Combustion; Bartok, W., Sarofim, A. F., Eds.; Wiley & Sons: NewYork, 1991; pp 261-326.
(2) Siegel, R.; Howell, J. R. Thermal Radiation Heat Transfer, 3rded.; Hemisphere Publishing Corporation: Bristol, PA, 1992.
(3) Fletcher, T. H.; Ma, J.; Rigby, J. R.; Brown, A. L.; Webb, B. W.Progress in Energy and Combustion Science 1997, 23, 283-301.
(4) Frenklach, M.; Wang, H. Twenty-Third Symposium (Interna-tional) on Combustion; The Combustion Institute: Pittsburgh, PA,1990; pp 1559-1566.
(5) Leung, K. M.; Lindstedt, P.; Jones, W. P. Combust. Flame 1991,87, 289-305.
(6) Moss, J. B.; Stewart, C. D.; Syed, K. J. Twenty-Second Sympo-sium (International) on Combustion; The Combustion Institute: Pitts-burgh, PA, 1988; pp 413-423.
(7) Kennedy, I. M.; Kollmann, W.; Chen, J. Y. Combust. Flame 1990,81, 73-85.
(8) Honnery, D. R.; Kent, J. H. Twenty-Fourth Symposium (Inter-national) on Combustion; The Combustion Institute: Pittsburgh, PA,1992; pp 1041-1047.
(9) Sivathanu, Y. R.; Gore, J. P. Combust. Flame 1994, 97, 161-172.
fv,C ) (Fg/FC)YC (1)
745Energy & Fuels 1998, 12, 745-757
S0887-0624(97)00220-X CCC: $15.00 © 1998 American Chemical SocietyPublished on Web 05/23/1998
estimates for the nucleation, surface growth, and oxida-tion terms. In a study by Coelho and Carvalho,10 twodifferent soot formation models were coupled with threedifferent oxidation models taken from different research-ers in an effort to determine which models best cor-respond to measured data. These reaction models werecoupled with the conservation equations for the numberdensities and concentrations of soot. Comparisons weremade regarding the predictions of soot in a turbulentpropane diffusion flame between the various combina-tions of models and measured data. More evaluationsusing this general approach have been performed,including modeling of a turbulent three-dimensionalflame.7,11,12 In all of these studies, reasonable agree-ment existed between measured soot volume fractionsand predicted ones.
None of the above-mentioned methods apply to coal-derived soot since tar, rather than acetylene, is theprincipal precursor to soot in coal flames. Coal devola-tilization experiments in inert gas have shown that themass of soot plus tar remains relatively constant afterprimary devolatilization.13-16 Gas products have beenquantified for many coals; acetylene and benzene havenot been shown to exist in significant quantities.17
Three previous attempts at coal soot modeling havebeen made, all of which rely heavily on empiricalassumptions to make the soot predictions. Ubhayakeret al.18 used an empirical relationship based on the molefraction of CO to estimate the amount of soot in a coaldevolatilization experiment, although no soot data werepresented. Adams and Smith19 assumed that due tooxidation, soot exists where the local equivalence ratio(φ) is 1.0 and above, and increases linearly to a maxi-mum value at an equivalence ratio of 2.0 and above.An empirical function was developed to describe thedependence of soot yield on φ:
The maximum soot volume fraction was calculated asa direct function of the amount of volatile carbon foundto exist at that point. It was assumed that 10% of thevolatile carbon forms soot (C1 ) 0.1). The soot volumefraction was then calculated as follows
where âC was the moles of carbon per unit mass in thereactor. It is unclear how the units in this equationwere justified (i.e., a gas density is needed in thenumerator), which may have led to errors in theirmethod. Adams and Smith concluded that the inclusionof a soot radiation model increased predicted radiativetransfer in a pulverized coal flame; however, the maxi-mum local temperature difference between predictionswith and without the soot model was lower thanexpected (only about 50 K). They attributed this resultto the soot absorbing nearly as much radiant energy asit emitted. Also, they addressed the need for a moreadvanced soot model.
Ahluwalia and Im20 took a similar approach, assum-ing that 10% of the volatile carbon given off becomessoot. Soot was restricted to the burner zone. Theirresults indicate that soot is responsible for between 14and 15% of the total heat transfer in the furnacesmodeled.
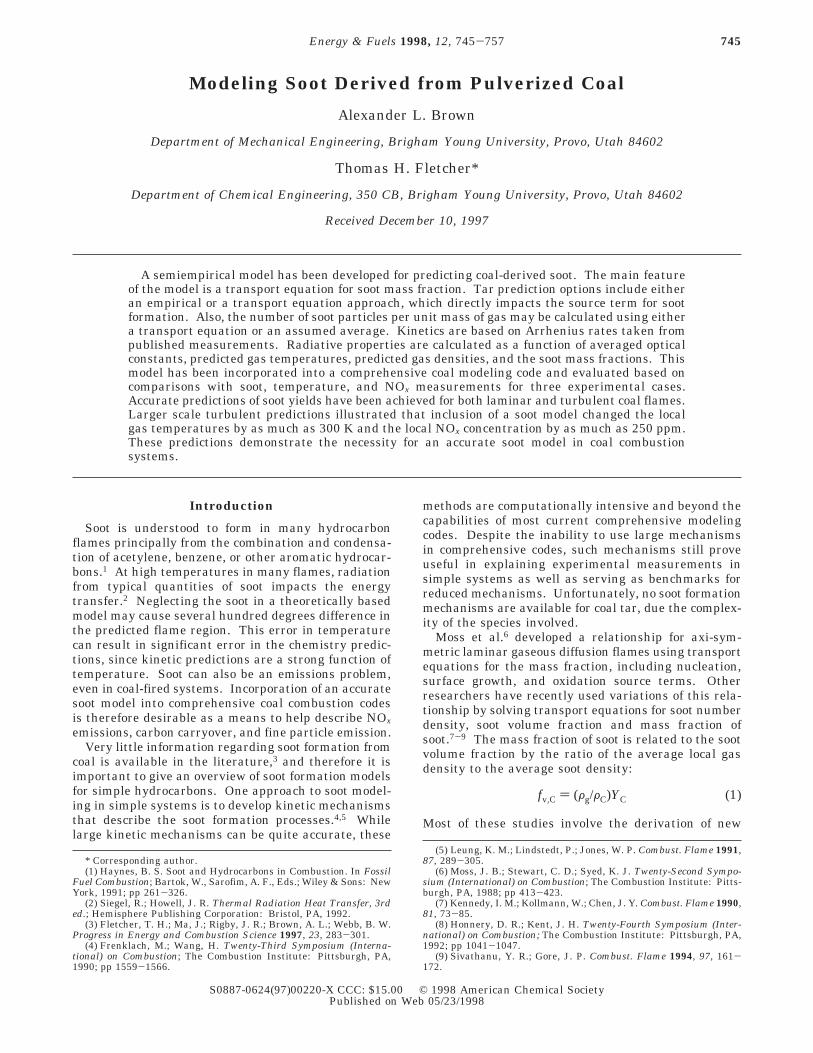
The objective of this research was to develop anadvanced coal soot model that more accurately repre-sents the evolution of the soot. Coal soot is assumed toform from tar, which has a relatively high molecularweight (∼350 amu). Tar yields vary with coal type,temperature, heating rate, and pressure. Figure 1illustrates the assumed pathway for soot formation fromcoal. To accurately describe coal soot formation, themodel should be able to describe both the transport oftar and conversion to soot. Existing coal particle modelscan describe coal devolatilization based on measuredcharacteristics from the coal.21-23 These models usevarious methods of combining statistical, theoretical,and empirical assumptions to predict tar formation.Therefore, in this work, a coal devolatilization modelwas combined with transport equations (in a mannersimilar to the techniques used to model gas-derived soot)to model coal soot formation.
Theoretical Treatment
The approach of Moss et al.6 and Fairweather et al.11
may be applied to coal-derived soot by generating theproper conservation equations, source terms, and bound-ary conditions for three-dimensional calculation of sootmass fraction (YC), soot particles per unit mass (NC),and tar mass fraction (YT). In all of these variables,the “per mass”, or fractional mass, represents the totalmass of soot particles and gas in a given cell. Initially,an average soot number density was assumed followingKennedy et al.,7 but preliminary examinations indicated
(10) Coelho, P. J.; Carvalho, M. G. ASME: Heat Transfer in Fireand Combustion Systems; ASME: Fairfield, NJ, 1994; p 272.
(11) Fairweather, M.; Jones, W. P.; Lindstedt, R. P. Combust. Flame1992, 89, 45-63.
(12) Moss, J. B.; Stewart, C. D.; Young, K. J. Combust. Flame 1995,101, 491-500.
(13) Chen, J. Effect of Secondary Reactions on Product Distributionand Nitrogen Evolution from Rapid Coal Pyrolysis. Ph.D. Dissertation(Mechanical Engineering), Stanford University, Palo Alto, CA, 1991.
(14) Ma, J. Soot Formation and Secondary Reactions During CoalPyrolysis. Ph.D. Dissertation (Chemical Engineering), Brigham YoungUniversity, Provo, UT, 1996.
(15) Nenniger, R. D.;Howard, J. B.; Sarofim, A. F. Proceedings ofthe 1983 International Conference on Coal Science; 1983; p 521.
(16) Wornat, M. J.; Sarofim, A. F.; Longwell, J. P. Energy Fuels 1987,1, 431.
(17) Smith, K. L.; Smoot, L. D.; Smith, P. J. The Structure andReaction Processes of Coal; Plenum: New York, 1994.
(18) Ubhayaker, S. K.; Stickler, D. B.; von Rosenberg, C. W.;Gannon, R. E. Sixteenth Symposium (International) on Combustion;The Combustion Institute: Pittsburgh, PA, 1976; pp 427-436.
(19) Adams, B. R.; Smith, P. J. Combust. Sci. Technol. 1995, 109,121-140.
(20) Ahluwalia, R. K.; Im, K. H. J. Inst. Energy 1994, 67, 23-29.(21) Fletcher, T. H.; Kerstein, A. R.; Pugmire, R. J.; Solum, M. S.;
Grant, D. M. Energy Fuels 1992, 6, 414-431.(22) Niksa, S. A.; Kerstein, R. Energy Fuels 1991, 5, 647-655.(23) Solomon, P. R.; Hamblen, D. G.; Carangelo, R. M.; Serio, M.
A.; Desphande, G. V. Energy Fuels 1988, 2, 405-422.
C2 ) Max(0.0,Min(φ - 1.0,1.0)) (2)
fv,C ) C1C2âCMC/FC (3)
Figure 1. Presumed pathways for coal devolatilization andsoot formation.
746 Energy & Fuels, Vol. 12, No. 4, 1998 Brown and Fletcher
that detailed calculations of the local number densitymay be important to ensure the accuracy of the model.The boundary conditions for soot mass fraction, tar massfraction, and the soot particles per unit mass are similarto the boundary conditions for other flowfield variablessuch as the coal gas mixture fraction (η) and the mixturefraction variance (g), as shown in Table 1.
Axi-symmetric (i.e., 2-D) models in the literature haveincluded an additional thermophoretic velocity in thediffusion term. However, none of the three-dimensionalmodels in the literature employ this term, apparentlyto simplify numeric calculations; this practice wasadopted in the present calculations. The equations forconservation of the mass of soot (YC) and tar (YT) are
assuming that fv,C is small (i.e., Ftot = Fg). The equationfor conservation of number of soot particles (NC) is
where µ is the turbulent viscosity, σ is the turbulentSchmidt number, F is the time-averaged density, and uis the Favre-averaged velocity. Diffusivity is repre-sented through the turbulent Schmidt number; stan-dard values of the Schmidt number (700) are used forthe transport equations for YC and NC.7,11 For the tarmass fraction equation (YT), 0.7 was assumed for theSchmidt number, which is the value commonly assumedfor the gas-phase Schmidt number.24 S represents thesource terms for each transport equation. Soot and tarsource terms were derived based on the assumedpathways illustrated in Figure 1. The source terms forthe NC equation were derived following Fairweather etal.11 The NC agglomeration term comes from theSmoluchowski particle rate equation, as described byHaynes1 and Ulrich.25 The possible contribution fromlight gases to the formation of soot has been neglectedin the formulation of this model. Source terms for eqs4-6 are listed below:
where
The average carbon soot density was assumed to be1950 kg/m3, and the collision frequency constant (Ca)was assumed to be 3. Table 2 gives a description of theArrhenius constants used.
Tar yields were calculated from the Lagrangianparticle phase equations which used the CPD model21
to determine devolatilization rates and tar yields. When13C NMR data were not available as input parametersfor the CPD model, a correlation was used26 to estimate13C NMR parameters from the proximate and ultimateanalysis. One-step rate constants for coal volatilereactions with oxygen for different coals from Shaw etal.27 were used. Since one aim of this research is todevelop a comprehensive model, and Shaw’s data do notcover all of the coals, the rate constants were averagedto obtain the rate reported in Table 2. The errorintroduced by this assumption is thought to be small,since tar is generally released in a fuel-rich region andtherefore rapidly converted to soot before significant tarcombustion occurs. This approach also ignores OH asan oxidizer, which may be particularly important forlean flames;28,29 as accurate models of OH concentra-tions in turbulent coal flames become available, sootoxidation by OH should be included.
Once the value of YC has been calculated from eq 4,the soot volume fraction (fv,C) may be calculated usingeq 1. The soot emissivity may then be determined usingthe following method:30
The emissivity may be related to the absorption coef-ficient through Bouguer’s Law
(24) Hill, S. C.; Smoot, L. D. Energy Fuels 1993, 7, 874-883.(25) Ulrich, G. D. Combust. Sci. Technol. 1971, 4, 47-57.
(26) Genetti, D. B.; Fletcher, T. H. ACS Division of Fuel Chemistry1997, 42, 194-198.
(27) Shaw, D. W.; Zhu, X.; Misra, M. K.; Essenhigh, R. H. Twenty-Third Symposium (International) on Combustion; The CombustionInstitute: Pittsburgh, PA, 1990; pp 1155-1162.
(28) Puri, R.; Santoro, R. J.; Smyth, K. C. Combust. Flame 1994,97, 125-144.
(29) Villasenor, R.; Kennedy, I. M. Twenty-Fourth Symposium(International) on Combustion; The Combustion Institute: Pittsburgh,PA, 1992; pp 1023-1030.
(30) Sarofim, A. F.; Hottel, H. C. In Heat Transfer-1978; HemispherePublishing: Washington, DC, 1978; pp 199-217.
Table 1. Boundary Conditions for the TransportEquations
locationsoot massfraction
tar massfraction
soot particlesper unit mass
primary jet 0.0 0.0 0.0secondary jet 0.0 0.0 0.0walls d/dx⊥ ) 0.0 d/dx⊥ ) 0.0 d/dx⊥ ) 0.0outlet quadratic quadratic quadratic
extrapolation extrapolation extrapolationsymmetry plane d/dx⊥ ) 0.0 d/dx⊥ ) 0.0 d/dx⊥ ) 0.0
∇B‚(FgubYC) ) ∇B‚(µσ∇BYC) + FgSY (4)
∇B‚(FgubYT) ) ∇B‚(µσ∇BYT) + FgSY (5)
∇B‚(FsubNC) ) ∇B‚(µσ∇NBC) + FgSN (6)
SYC) r̆FC - r̆OC (7)
SYT) r̆FT - r̆FC - r̆GT - r̆OT (8)
SNc) (Na/MCCmin)r̆FC - r̆AN (9)
r̆FT ) SPtar (10)
r̆OT ) Fg[cT][cO2]AOTe-EOT/RT (11)
r̆GT ) [cT]AGTe-EGT/RT (12)
r̆FC ) [cT]AeFC-EFC/RT (13)
r̆OC ) SAv,C
pO2
T1/2AOCe-EOC/RT (14)
SAv,C ) (62/3 π1/3 (FgNC)1/3 YC2/3 Fg
2/3)/FC2/3 (15)
r̆AN ) 2Ca(6MC
πFC)1/6 (6kT
FC)1/2 (FgYC
MC)1/6
(FgNC)11/6 (16)
εC ) 1 - (1 + 350 fv,CTLe)-4 (17)
Modeling Soot Derived from Pulverized Coal Energy & Fuels, Vol. 12, No. 4, 1998 747
giving
This absorption coefficient is then summed with thecalculated absorption coefficient for the radiating gases(i.e., CO2 and H2O) to form a total absorption coefficient.More detailed models are reviewed by Brown,31 butuncertainty in the optical constants and the combinedsimplicity and estimated accuracy of this correlation donot warrant a more complex model in this study. Themean beam length (Le) requires the assumption that thegas region of the combustor is a homogeneous isother-mal medium and is described by the following equation:
The comprehensive code used (PCGC-3) uses a mix-ing-limited assumption to predict chemistry in turbulentcoal flames (i.e., the tar transport equation is only usedfor the soot model). Local equilibrium is used inconjunction with an assumed-shape PDF approach formajor species. The equilibrium code does not properlycharacterize the rate-limited behavior of NOx, thereforea NOx postprocessor is used which predicts nonequilib-rium NOx based on the converged predictions from theequilibrium-based code.32,33
The soot model of Adams and Smith19 was also codedfor comparison purposes. Interestingly, upon comparingthe two models,31 the Adams and Smith model appearsto predict high soot yields in regions of high tar yield(predicted by the CPD model). It was therefore postu-lated that Adams’ method could be simply modified topredict a mass fraction of tar rather than a soot volumefraction:
This option was therefore coded using C1 ) 0.35 (tocompensate for the gas density effect) and C2 from eq 2and is presented as an alternative to the more complextransport equation solution. This simplified method forpredicting tar yield is referred to as the empirical taryield method. A simple test indicated that tar yieldsusing this equation were on the order of tar yields fromeq 5 used in conjunction with the CPD model. Sincethe iterative techniques used to solve the transportequations represent a significant part of the total
computational load, empirical models present an at-tractive alternative if correlations for C1 and C2 can bedeveloped to better describe the effects of coal type.
Another alternative considered was to assume anaverage number density, in a manner similar to thatused by Kennedy and co-workers.7 The average valueused for the number density (FNC) by Kennedy and co-workers (1 × 10¹⁶ particles/m3) was adopted in thisresearch and is based on measurements of Axelbaumet al.34 from ethylene counterflow diffusion flames.
This model for coal-derived soot (along with alterna-tive approaches) was incorporated into PCGC-3, acomprehensive coal modeling code developed at BrighamYoung University (BYU).24
Experiments Used for Evaluation
Because data on soot yields in coal flames are difficultto obtain, validation and tuning of the model aredifficult. Three experimental cases were selected toevaluate model performance: (1) measured soot yieldsin a flat flame burner experiment;14,35 (2) measurementsof gas temperatures and NOx concentrations in a practi-cal sized test facility, illustrating the impact of includingthe soot model on overall model performance; and (3)two-color extinction measurements of the average sootvolume fraction across a cross section of a laboratorypulverized coal-fired reactor. Descriptions of the threeexperiments used to evaluate model performance aregiven below.
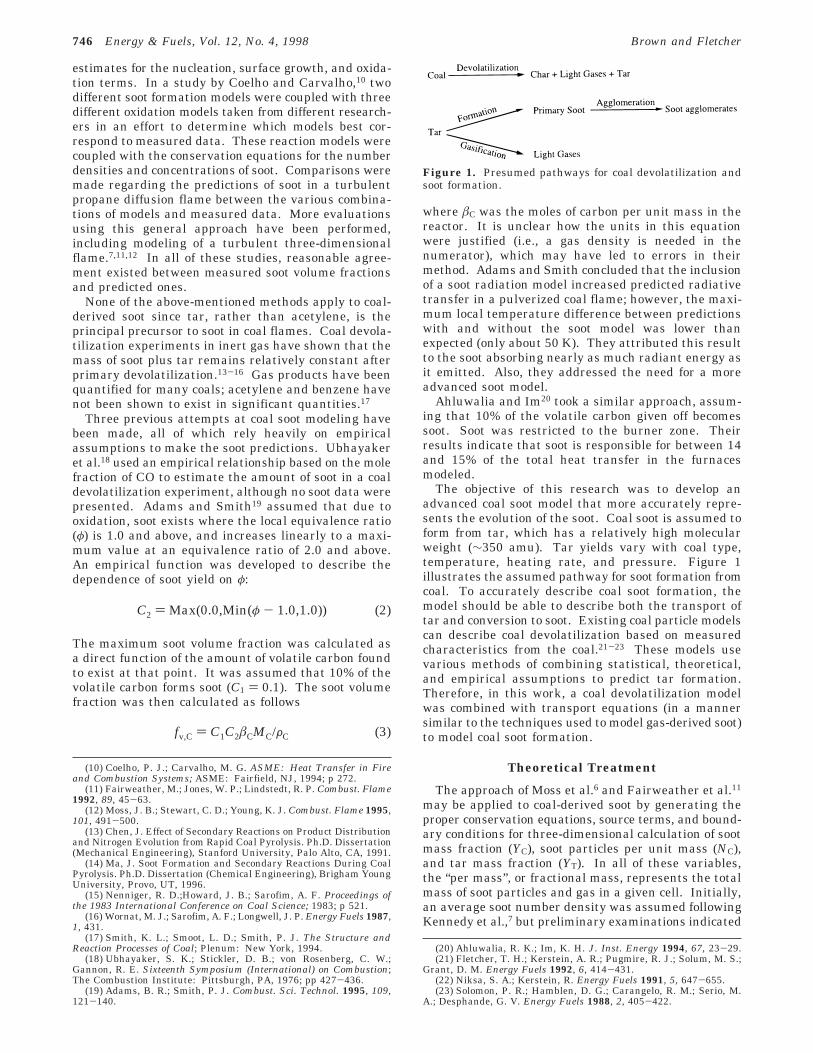
Flat Flame Burner. The flat flame burner (FFB)is a laminar flow reactor at BYU. Methane and air passthrough a 5 cm × 5 cm honeycomb grid to form smalldiffusion flamelets. The gases ignite near the burner,forming a uniform, thin flame sheet. Coal particles areinjected through a narrow 1.5 mm diameter tube in thecenter of the burner slightly above the tip of the flamesheet (Figure 2). The coal particles used in the experi-ment were sieved to maintain sizes between 63 and 75µm. When the FFB is operated in fuel-rich mode, hotproduct gases cause the coal to devolatilize without theoccurrence of oxidation. A suction probe is placed abovethe flame, which collects the char and soot. The charand soot are separated aerodynamically using a virtualimpactor and cyclone system. Total coal-derived sootyields were measured as a function of the height of theprobe above the flame surface.14,35 These data alsoincluded measured temperature profiles at variousheights and axial positions, char and soot yields fromthe coal at various heights, and particle and gas velocitymeasurements at various locations. This apparatus wasmodeled with a 25 × 25 × 28 grid using PCGC-3,assuming laminar flow, for Pittsburgh No. 8, Illinois No.6 and Utah Hiawatha coals at 1800 K.
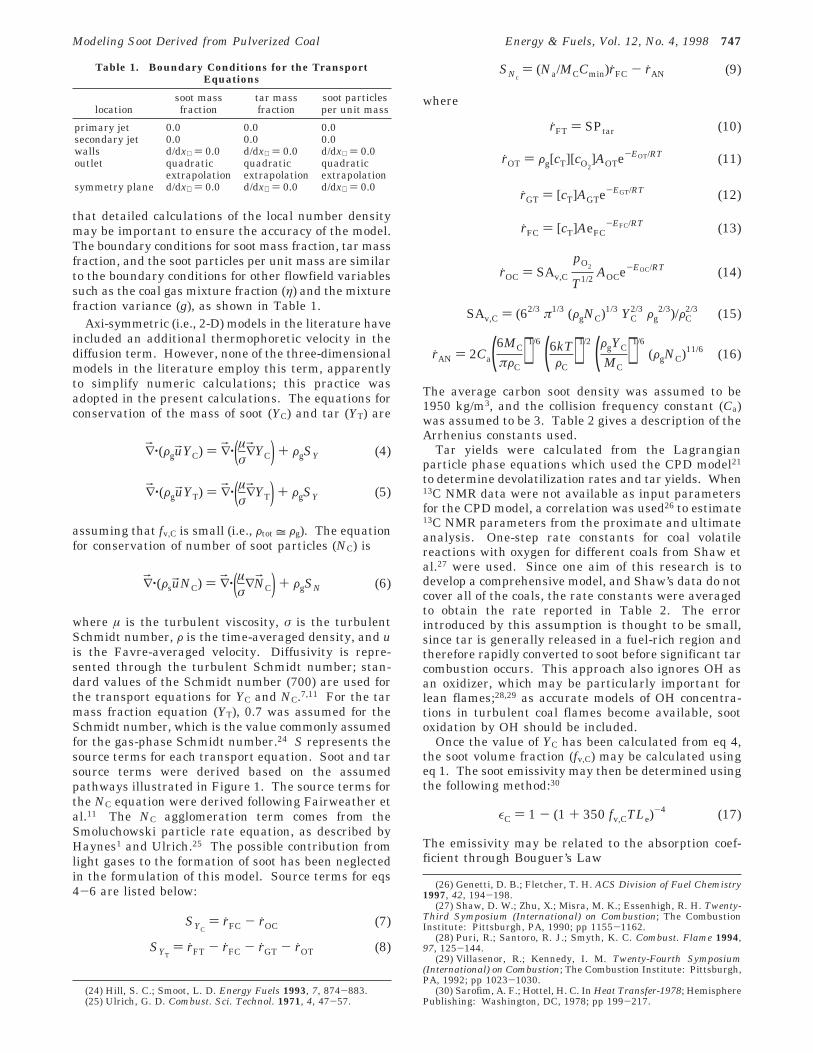
Fireside Performance Test Facility. The ABB/CE fireside performance test facility (FPTF) (Figure 3)is a cylindrical laboratory-scale furnace which was alsoused to make gas temperature and species concentration(31) Brown, A. L. Modeling Soot in Pulverized Coal Flames. M.S.
Thesis (Mechanical Engineering), Brigham Young University, Provo,UT, 1997.
(32) Boardman, R. D.; Eatough, C. N.; Germane, G. J. Combust. Sci.Technol. 1993, 93, 193-210.
(33) Hill, S. C.; Smoot, L. D.; Smith, P. J. Twentieth Symposium(International) on Combustion; The Combustion Institute: Pittsburgh,PA, 1984; pp 1391-1400.
(34) Axelbaum, R. L.; Flower, W. L.; Law, C. K. Combust. Sci.Technol. 1988, 61, 51-73.
(35) Ma, J.; Fletcher, T. H.; Webb, B. W. Twenty-Sixth Symposium(International) on Combustion; The Combustion Institute: Pittsburgh,PA, 1996; pp 3161-3167.
Table 2. Transport Equation Source Terms
term A E (kJ/g‚mol) source
r̆FT N/A N/A particle phase calcnsr̆OT 6.77 × 10⁵ (1/s) 52.3 Shaw et al.27
r̆GT 9.77 × 10¹⁰ (1/s) 286.9 Ma35
r̆FC 5.02 × 10⁸ (1/s) 198.9 Ma35
r̆OC 1.09 × 10⁴ (K1/2/s) 164.5 Lee et al.41
r̆AN N/A N/A Fairweather et al.11
κ ) -(1/Le) ln(1 - ε) (18)
κC ) (4/Le) ln(1 + 350 fv,CTLe) (19)
Le ) 4V/SA (20)
YT ) C1C2MCâC (21)
748 Energy & Fuels, Vol. 12, No. 4, 1998 Brown and Fletcher
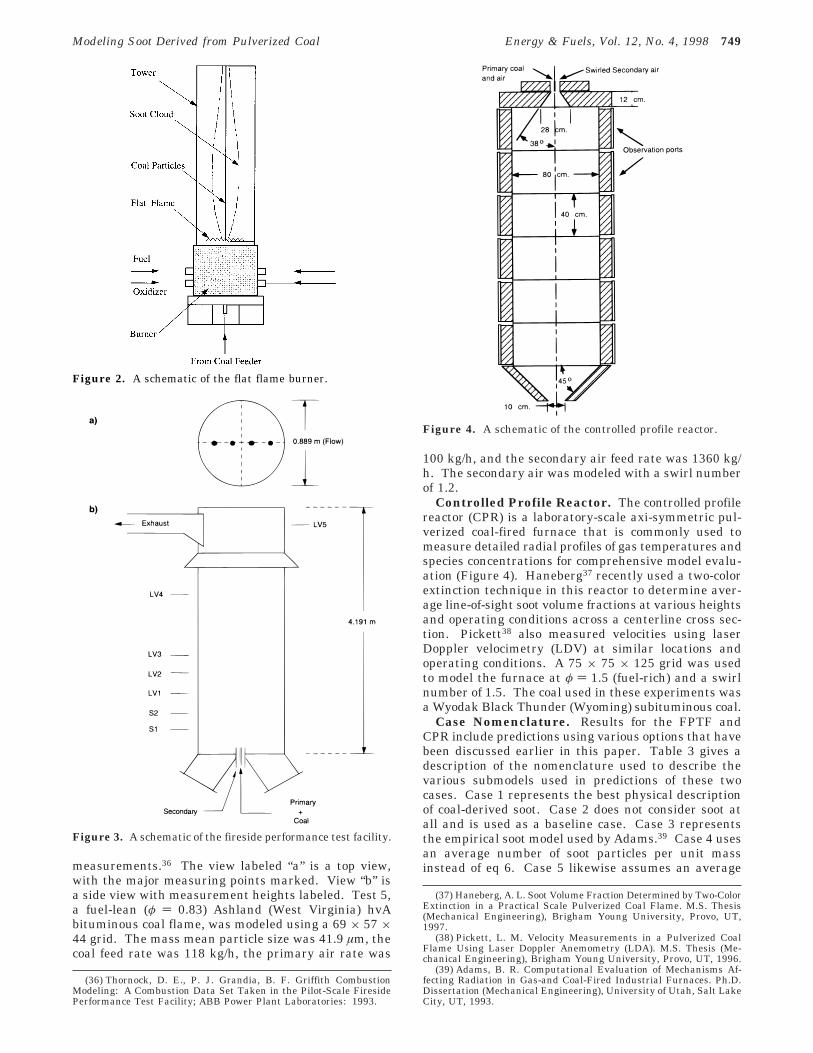
measurements.36 The view labeled “a” is a top view,with the major measuring points marked. View “b” isa side view with measurement heights labeled. Test 5,a fuel-lean (φ ) 0.83) Ashland (West Virginia) hvAbituminous coal flame, was modeled using a 69 × 57 ×44 grid. The mass mean particle size was 41.9 µm, thecoal feed rate was 118 kg/h, the primary air rate was
100 kg/h, and the secondary air feed rate was 1360 kg/h. The secondary air was modeled with a swirl numberof 1.2.
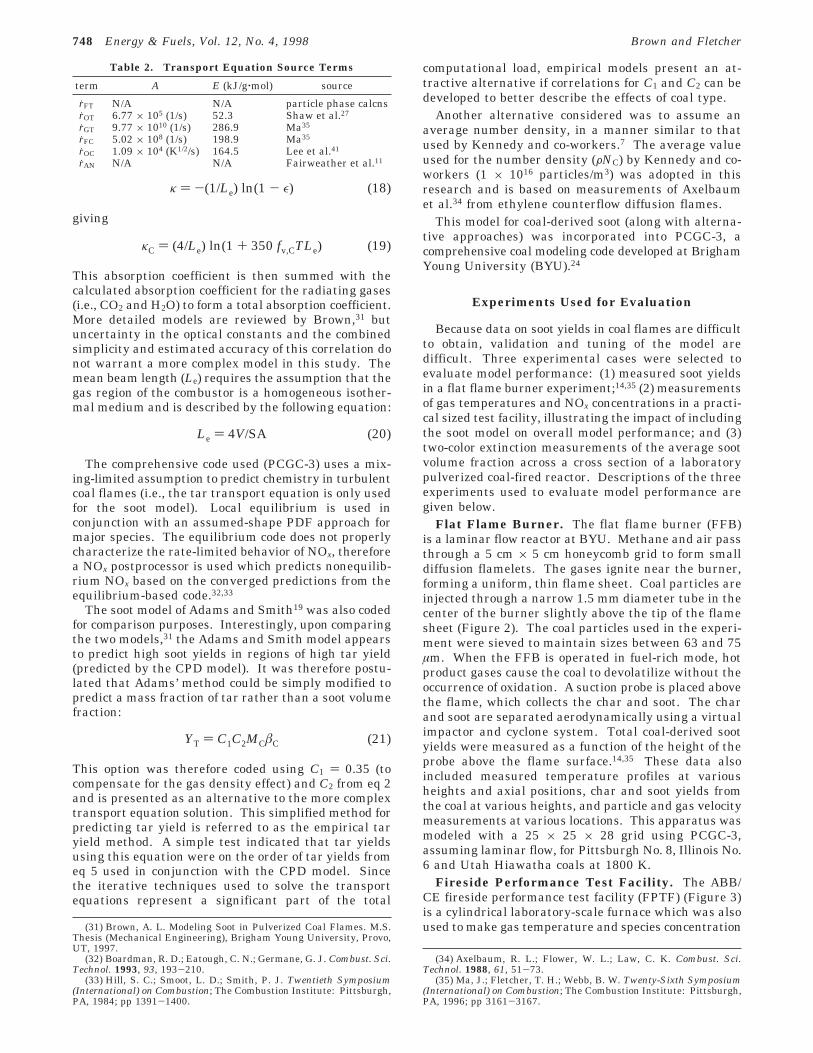
Controlled Profile Reactor. The controlled profilereactor (CPR) is a laboratory-scale axi-symmetric pul-verized coal-fired furnace that is commonly used tomeasure detailed radial profiles of gas temperatures andspecies concentrations for comprehensive model evalu-ation (Figure 4). Haneberg37 recently used a two-colorextinction technique in this reactor to determine aver-age line-of-sight soot volume fractions at various heightsand operating conditions across a centerline cross sec-tion. Pickett38 also measured velocities using laserDoppler velocimetry (LDV) at similar locations andoperating conditions. A 75 × 75 × 125 grid was usedto model the furnace at φ ) 1.5 (fuel-rich) and a swirlnumber of 1.5. The coal used in these experiments wasa Wyodak Black Thunder (Wyoming) subituminous coal.
Case Nomenclature. Results for the FPTF andCPR include predictions using various options that havebeen discussed earlier in this paper. Table 3 gives adescription of the nomenclature used to describe thevarious submodels used in predictions of these twocases. Case 1 represents the best physical descriptionof coal-derived soot. Case 2 does not consider soot atall and is used as a baseline case. Case 3 representsthe empirical soot model used by Adams.39 Case 4 usesan average number of soot particles per unit massinstead of eq 6. Case 5 likewise assumes an average
(36) Thornock, D. E., P. J. Grandia, B. F. Griffith CombustionModeling: A Combustion Data Set Taken in the Pilot-Scale FiresidePerformance Test Facility; ABB Power Plant Laboratories: 1993.
(37) Haneberg, A. L. Soot Volume Fraction Determined by Two-ColorExtinction in a Practical Scale Pulverized Coal Flame. M.S. Thesis(Mechanical Engineering), Brigham Young University, Provo, UT,1997.
(38) Pickett, L. M. Velocity Measurements in a Pulverized CoalFlame Using Laser Doppler Anemometry (LDA). M.S. Thesis (Me-chanical Engineering), Brigham Young University, Provo, UT, 1996.
(39) Adams, B. R. Computational Evaluation of Mechanisms Af-fecting Radiation in Gas-and Coal-Fired Industrial Furnaces. Ph.D.Dissertation (Mechanical Engineering), University of Utah, Salt LakeCity, UT, 1993.
Figure 2. A schematic of the flat flame burner.
Figure 3. A schematic of the fireside performance test facility.
Figure 4. A schematic of the controlled profile reactor.
Modeling Soot Derived from Pulverized Coal Energy & Fuels, Vol. 12, No. 4, 1998 749
value of NC, and also uses the empirical tar yieldassumption for tar formation (eq 21). Case 6, like Case5, uses the empirical tar yield equation (eq 21) butcalculates the number of soot particles per unit massfrom the transport equation (eq 6).
Results
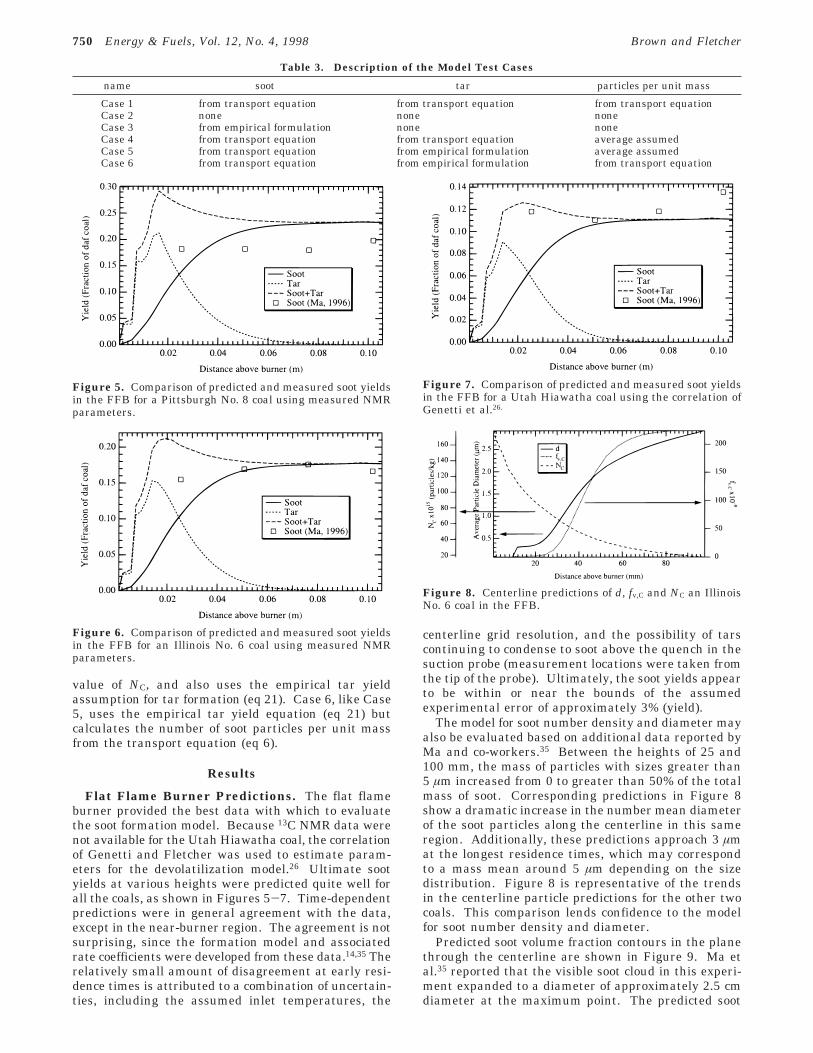
Flat Flame Burner Predictions. The flat flameburner provided the best data with which to evaluatethe soot formation model. Because 13C NMR data werenot available for the Utah Hiawatha coal, the correlationof Genetti and Fletcher was used to estimate param-eters for the devolatilization model.26 Ultimate sootyields at various heights were predicted quite well forall the coals, as shown in Figures 5-7. Time-dependentpredictions were in general agreement with the data,except in the near-burner region. The agreement is notsurprising, since the formation model and associatedrate coefficients were developed from these data.14,35 Therelatively small amount of disagreement at early resi-dence times is attributed to a combination of uncertain-ties, including the assumed inlet temperatures, the
centerline grid resolution, and the possibility of tarscontinuing to condense to soot above the quench in thesuction probe (measurement locations were taken fromthe tip of the probe). Ultimately, the soot yields appearto be within or near the bounds of the assumedexperimental error of approximately 3% (yield).
The model for soot number density and diameter mayalso be evaluated based on additional data reported byMa and co-workers.35 Between the heights of 25 and100 mm, the mass of particles with sizes greater than5 µm increased from 0 to greater than 50% of the totalmass of soot. Corresponding predictions in Figure 8show a dramatic increase in the number mean diameterof the soot particles along the centerline in this sameregion. Additionally, these predictions approach 3 µmat the longest residence times, which may correspondto a mass mean around 5 µm depending on the sizedistribution. Figure 8 is representative of the trendsin the centerline particle predictions for the other twocoals. This comparison lends confidence to the modelfor soot number density and diameter.
Predicted soot volume fraction contours in the planethrough the centerline are shown in Figure 9. Ma etal.35 reported that the visible soot cloud in this experi-ment expanded to a diameter of approximately 2.5 cmdiameter at the maximum point. The predicted soot
Table 3. Description of the Model Test Cases
name soot tar particles per unit mass
Case 1 from transport equation from transport equation from transport equationCase 2 none none noneCase 3 from empirical formulation none noneCase 4 from transport equation from transport equation average assumedCase 5 from transport equation from empirical formulation average assumedCase 6 from transport equation from empirical formulation from transport equation
Figure 5. Comparison of predicted and measured soot yieldsin the FFB for a Pittsburgh No. 8 coal using measured NMRparameters.
Figure 6. Comparison of predicted and measured soot yieldsin the FFB for an Illinois No. 6 coal using measured NMRparameters.
Figure 7. Comparison of predicted and measured soot yieldsin the FFB for a Utah Hiawatha coal using the correlation ofGenetti et al.26.
Figure 8. Centerline predictions of d, fv,C and NC an IllinoisNo. 6 coal in the FFB.
750 Energy & Fuels, Vol. 12, No. 4, 1998 Brown and Fletcher
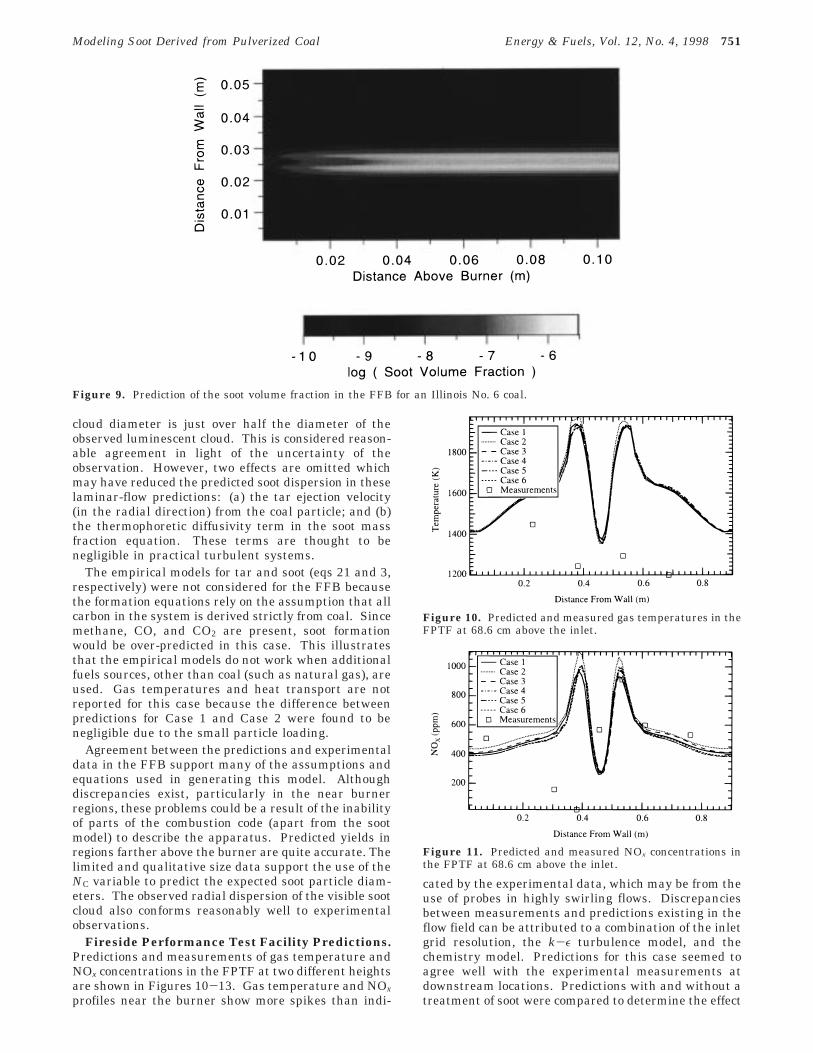
cloud diameter is just over half the diameter of theobserved luminescent cloud. This is considered reason-able agreement in light of the uncertainty of theobservation. However, two effects are omitted whichmay have reduced the predicted soot dispersion in theselaminar-flow predictions: (a) the tar ejection velocity(in the radial direction) from the coal particle; and (b)the thermophoretic diffusivity term in the soot massfraction equation. These terms are thought to benegligible in practical turbulent systems.
The empirical models for tar and soot (eqs 21 and 3,respectively) were not considered for the FFB becausethe formation equations rely on the assumption that allcarbon in the system is derived strictly from coal. Sincemethane, CO, and CO2 are present, soot formationwould be over-predicted in this case. This illustratesthat the empirical models do not work when additionalfuels sources, other than coal (such as natural gas), areused. Gas temperatures and heat transport are notreported for this case because the difference betweenpredictions for Case 1 and Case 2 were found to benegligible due to the small particle loading.
Agreement between the predictions and experimentaldata in the FFB support many of the assumptions andequations used in generating this model. Althoughdiscrepancies exist, particularly in the near burnerregions, these problems could be a result of the inabilityof parts of the combustion code (apart from the sootmodel) to describe the apparatus. Predicted yields inregions farther above the burner are quite accurate. Thelimited and qualitative size data support the use of theNC variable to predict the expected soot particle diam-eters. The observed radial dispersion of the visible sootcloud also conforms reasonably well to experimentalobservations.
Fireside Performance Test Facility Predictions.Predictions and measurements of gas temperature andNOx concentrations in the FPTF at two different heightsare shown in Figures 10-13. Gas temperature and NOxprofiles near the burner show more spikes than indi-
cated by the experimental data, which may be from theuse of probes in highly swirling flows. Discrepanciesbetween measurements and predictions existing in theflow field can be attributed to a combination of the inletgrid resolution, the k-ε turbulence model, and thechemistry model. Predictions for this case seemed toagree well with the experimental measurements atdownstream locations. Predictions with and without atreatment of soot were compared to determine the effect
Figure 9. Prediction of the soot volume fraction in the FFB for an Illinois No. 6 coal.
Figure 10. Predicted and measured gas temperatures in theFPTF at 68.6 cm above the inlet.
Figure 11. Predicted and measured NOx concentrations inthe FPTF at 68.6 cm above the inlet.
Modeling Soot Derived from Pulverized Coal Energy & Fuels, Vol. 12, No. 4, 1998 751
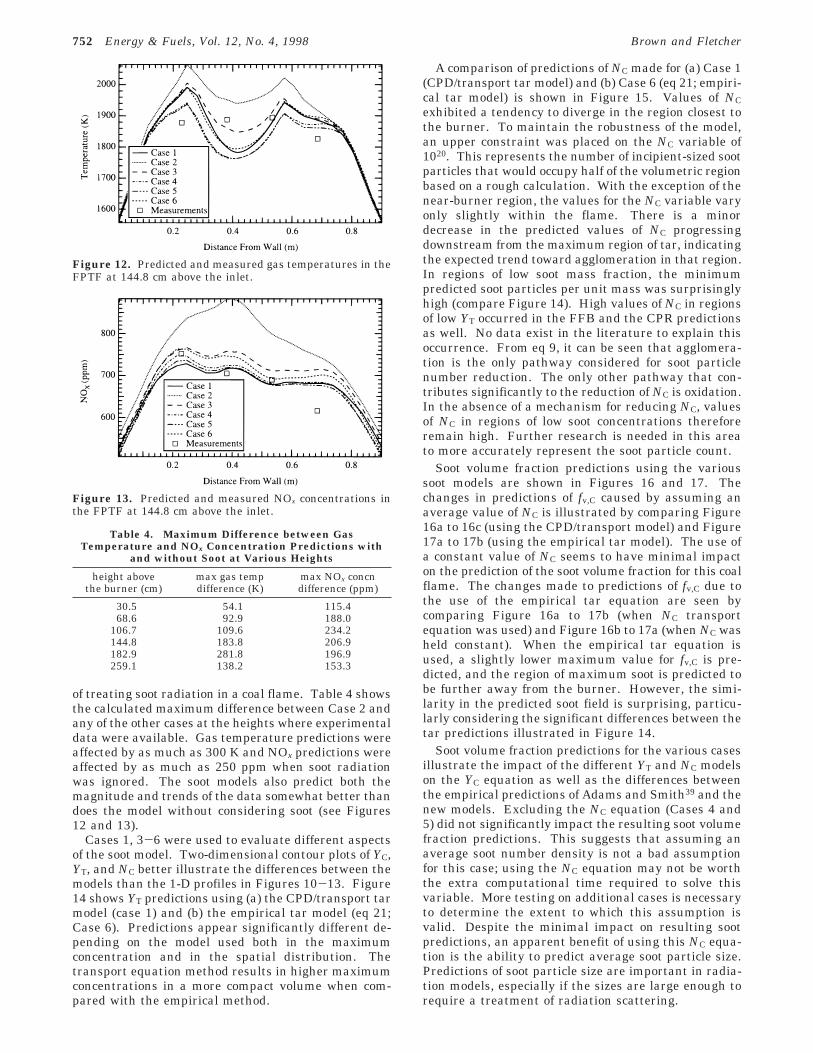
of treating soot radiation in a coal flame. Table 4 showsthe calculated maximum difference between Case 2 andany of the other cases at the heights where experimentaldata were available. Gas temperature predictions wereaffected by as much as 300 K and NOx predictions wereaffected by as much as 250 ppm when soot radiationwas ignored. The soot models also predict both themagnitude and trends of the data somewhat better thandoes the model without considering soot (see Figures12 and 13).
Cases 1, 3-6 were used to evaluate different aspectsof the soot model. Two-dimensional contour plots of YC,YT, and NC better illustrate the differences between themodels than the 1-D profiles in Figures 10-13. Figure14 shows YT predictions using (a) the CPD/transport tarmodel (case 1) and (b) the empirical tar model (eq 21;Case 6). Predictions appear significantly different de-pending on the model used both in the maximumconcentration and in the spatial distribution. Thetransport equation method results in higher maximumconcentrations in a more compact volume when com-pared with the empirical method.
A comparison of predictions of NC made for (a) Case 1(CPD/transport tar model) and (b) Case 6 (eq 21; empiri-cal tar model) is shown in Figure 15. Values of NCexhibited a tendency to diverge in the region closest tothe burner. To maintain the robustness of the model,an upper constraint was placed on the NC variable of1020. This represents the number of incipient-sized sootparticles that would occupy half of the volumetric regionbased on a rough calculation. With the exception of thenear-burner region, the values for the NC variable varyonly slightly within the flame. There is a minordecrease in the predicted values of NC progressingdownstream from the maximum region of tar, indicatingthe expected trend toward agglomeration in that region.In regions of low soot mass fraction, the minimumpredicted soot particles per unit mass was surprisinglyhigh (compare Figure 14). High values of NC in regionsof low YT occurred in the FFB and the CPR predictionsas well. No data exist in the literature to explain thisoccurrence. From eq 9, it can be seen that agglomera-tion is the only pathway considered for soot particlenumber reduction. The only other pathway that con-tributes significantly to the reduction of NC is oxidation.In the absence of a mechanism for reducing NC, valuesof NC in regions of low soot concentrations thereforeremain high. Further research is needed in this areato more accurately represent the soot particle count.
Soot volume fraction predictions using the varioussoot models are shown in Figures 16 and 17. Thechanges in predictions of fv,C caused by assuming anaverage value of NC is illustrated by comparing Figure16a to 16c (using the CPD/transport model) and Figure17a to 17b (using the empirical tar model). The use ofa constant value of NC seems to have minimal impacton the prediction of the soot volume fraction for this coalflame. The changes made to predictions of fv,C due tothe use of the empirical tar equation are seen bycomparing Figure 16a to 17b (when NC transportequation was used) and Figure 16b to 17a (when NC washeld constant). When the empirical tar equation isused, a slightly lower maximum value for fv,C is pre-dicted, and the region of maximum soot is predicted tobe further away from the burner. However, the simi-larity in the predicted soot field is surprising, particu-larly considering the significant differences between thetar predictions illustrated in Figure 14.
Soot volume fraction predictions for the various casesillustrate the impact of the different YT and NC modelson the YC equation as well as the differences betweenthe empirical predictions of Adams and Smith39 and thenew models. Excluding the NC equation (Cases 4 and5) did not significantly impact the resulting soot volumefraction predictions. This suggests that assuming anaverage soot number density is not a bad assumptionfor this case; using the NC equation may not be worththe extra computational time required to solve thisvariable. More testing on additional cases is necessaryto determine the extent to which this assumption isvalid. Despite the minimal impact on resulting sootpredictions, an apparent benefit of using this NC equa-tion is the ability to predict average soot particle size.Predictions of soot particle size are important in radia-tion models, especially if the sizes are large enough torequire a treatment of radiation scattering.
Figure 12. Predicted and measured gas temperatures in theFPTF at 144.8 cm above the inlet.
Figure 13. Predicted and measured NOx concentrations inthe FPTF at 144.8 cm above the inlet.
Table 4. Maximum Difference between GasTemperature and NOx Concentration Predictions with
and without Soot at Various Heights
height abovethe burner (cm)
max gas tempdifference (K)
max NOx concndifference (ppm)
30.5 54.1 115.468.6 92.9 188.0
106.7 109.6 234.2144.8 183.8 206.9182.9 281.8 196.9259.1 138.2 153.3
752 Energy & Fuels, Vol. 12, No. 4, 1998 Brown and Fletcher
The empirical tar equation predicts significantly lowerquantities of tar in the maximum regions, but the taris spread out over a longer region. Overall, this resultsin predictions of quantities of soot similar to those ofthe complete model, and similar soot contours. Whilethe use of the CPD model for tar source term predictions
is likely to result in more accurate tar predictions,results from this model suggest that in the absence ofsuch a model (CPD), the empirical tar formulation mayserve as a reasonable approximation. This result is oneof the most surprising results from this research,especially since the somewhat arbitrarily assumed C1
Figure 14. Predicted contours of YT in the FPTF. The plot labeled “a” is from Case 1, and the plot labeled “b” is from Case 6.
Figure 15. Predicted contours of NC in the FPTF using the transport equation. The plot labeled “a” is from Case 1, and the plotlabeled “b” is from Case 6.
Modeling Soot Derived from Pulverized Coal Energy & Fuels, Vol. 12, No. 4, 1998 753
variable did not need to be modified from the assumedvalue for the empirical soot model (at least for the coalin this experiment). Although the equations used topredict the empirical tar formation understandablyrepresent the coal volatiles to a certain extent, thereason that distinct tar predictions would result in suchsimilar soot volume fraction predictions remains withouta good theoretical explanation. The good agreementbetween the CPD/transport tar model and the empiricaltar model is likely case-dependent. Further testing,particularly with a broader range of coals, is recom-mended to determine the extent of the accuracy of thisempirical assumption for tar formation.
The good agreement between the data and the nu-merical predictions as well as the total impact on gastemperatures and NOx concentrations for this caseillustrate the necessity for including a model that willaccurately predict the soot field and account for theradiative effects.
Controlled Profile Reactor Predictions. Model-ing the BYU controlled profile reactor has been ex-tremely challenging, especially in three dimensions.40
The high degree of swirl in this reactor, along with
operating conditions that seem to cause slow fluctua-tions between partially stable numerical solutions, havemade it difficult to perform meaningful detailed radialcomparisons of simulations and experiments. Suchnumerical instabilities may be indicative of physicalinstabilities in the experiments. In any case, detailedvelocity measurements were available for the inlet andflow regions,38 yet the inlet region still proved toodifficult to model accurately.31,40 However, since theonly optical measurements of soot volume fraction fora coal flame were available in this reactor, it wasdesirable to make at least a semiquantitative compari-son with modeling results. Therefore, the range ofpredicted soot volume fractions from partially convergedsimulations that best represented the inlet flow condi-tions and were nearly stable will be shown here.
The optical measurements were performed along aline-of-sight passing horizontally through the reactorcenterline, and hence the soot volume fraction deducedfrom the extinction measurements corresponds to aspatially averaged value.37 Model predictions of fv,C
(40) Brown, A. L.; Fletcher, T. H. Modeling Soot in Coal CombustionFlames. Western States Section of the Combustion Institute; LosAngeles, CA, 1996.
Figure 16. Predicted contours of fv,C in the FPTF. The plot labeled “a” is from Case 1, the plot labeled “b” is from Case 3, andthe plot labeled “c” is from Case 4.
754 Energy & Fuels, Vol. 12, No. 4, 1998 Brown and Fletcher
were therefore spatially averaged along the same lineof sight as the experiments and are compared with thecorresponding measurements as a function of distancefrom the burner in Figure 18. The range of predictedline-of-sight values shown in Figure 18 are thereforemaximum and minimum values of about 10 differentnearly-converged solutions. The range of spatiallyaveraged values of fv,C for this reactor was the sameorder of magnitude as the optical measurements in thishigh equivalence ratio case. Model predictions wereslightly lower than measurements in regions closer tothe burner. In the two regions further away from theburner, the measurements fell within the spread of thepredictions. The agreement between the data and thepredictions is very encouraging, and should be pursuedin a more quantitative and spatially resolved manner.
Discussion
The proposed soot model, after incorporation into acomprehensive coal combustion model, has been shownto (a) change local predicted gas temperatures in theflame zone by as much as 300 K and (b) change localpredicted NOx concentrations by as much as 250 ppm.The laminar flow predictions in the FFB were able todescribe the effects of coal type using one set of ratecoefficients; only the chemical structure parameters foreach coal type were changed, which in turn changed thetar yield during devolatilization. This agreement helpssupport the proposed formation and oxidation mecha-nisms for soot and tar and suggests that the sootformation mechanisms from coal tar may be largelyindependent of coal type. The relative agreementbetween the predicted soot diameters and the observeddiameter information suggests that the equation for NC
can be used with some confidence. The relative agree-ment between the predicted radial dispersion of the sootcloud (based on fv,C) and the visual observations werealso very encouraging, although some additional pro-cesses such as radial ejection of tar and thermophoresismay need to be treated in order to improve agreement.
The full soot model significantly impacts the conver-gence time. To demonstrate the impact of including thesoot model, the FFB and FPTF predictions were timedfor a single macroiteration, with and without using thesoot model equations. The resulting computational timeis illustrated in Table 5. The use of the full soot modelincreases computational time by 35-48%, due to theinclusion of three new transport equations. Computa-tional time can be reduced by using one or more of theempirical options to start the calculations, followed by
Figure 17. Predicted contours of fv,C in the FPTF. The plot labeled “a” is from Case 5 and the plot labeled “b” is from Case 6.
Figure 18. Comparison of line-of-sight measurements of fv,C
with corresponding spatially averaged predictions at variousheights in the CPR.
Modeling Soot Derived from Pulverized Coal Energy & Fuels, Vol. 12, No. 4, 1998 755
use of the full soot model when flow field calculationsare somewhat converged.
A major benefit of the new soot model is that it isrepresents a reduction in empiricism compared to theprevious modeling efforts. Reduction in empiricism islikely to result in improved robustness as well as moreaccurate predictions. The improved robustness of thenew model is demonstrated in the fact that the empiricalmodels are incapable of predicting soot in the FFB case.Also, no rational method has yet been developed todetermine yield parameters for the empirical soot and/or tar models (i.e., values of C1 and C2). Because thenewly developed method is similar to soot modelingefforts in simpler hydrocarbon flames, the inclusion ofa model to account for acetylene, benzene, or sootderived from similar sources would be simply a matterof adding source terms to the existing equations.However, since coal tar is the principal sooting agentin coal flames, the addition of an acetylene-based sootformation mechanism seems unnecessary at this time.
Despite the somewhat limited agreement with thedata for oxidizing flames, the model demonstrates thenecessity for consideration of soot in comprehensive coalprediction codes. An increase in the amount of predictedsoot causes a change in predicted gas temperatures andNOx concentrations. The fact that inclusion of a sootmodel lowers the predicted local gas temperature in theflame zone by as much as 300 K and NOx concentrationby as much as 250 ppm in the FPTF adds credence tothe assertion that including a soot model in coal flamepredictions is important. Additionally, it appears fromthe FFB, CPR, and FPTF predictions that the effects ofsoot increase with the larger sized furnaces. Since thefurnaces modeled were smaller test scale models, theeffect of accounting for soot may be even more importantfor the large industrial-scale furnaces. This is certainlytrue based on qualitative visual observations of coalflames in industrial processes, which visually appearextremely bright.
Predictions from the model for this reactor showedreasonable agreement with the optical measurementsin a high equivalence ratio coal flame. The range ofmodel predictions was only slightly lower than mea-surements in regions close to the burner, but themeasurements fell within the spread of the predictionsin regions far from the burner. Even though thepredictions and measurements were spatially averagedand only semiquantitative, this is the first knowncomparison of predictions and measurements of soot ina pulverized coal combustion system.
Recommendations
The lack of reliable soot and tar measurements takenin coal flames hindered model evaluation. Measure-ments that overcome the inherent interference fromcoal, char, and ash particles present during the burningof the coal would greatly aid model development andevaluation. Also, the oxidation term for the tar is
questionable, since it was derived from different coalsthan were used in the predictions presented here andsince the rate used was originally developed for simul-taneous combustion of both light gas and tar. Thepredicted tar yield is sensitive to the tar kinetics, anduncertainties in predicted tar yields may detract fromthe reliability of the soot model. Soot oxidation is afunction of the soot particles per unit mass, which hasbeen shown to yield questionable results in regions oflow soot. Although the particle count appears to havea minimal effect on the resulting soot volume fraction,the development of more accurate source terms for theNC equation would provide important details regardingsoot particle sizes.
The variety of methods proposed for calculating coal-derived soot provide various degrees of empiricism. Themost developed method uses three transport equationsand is capable of predicting soot particle sizes. Theaccuracy of these predictions appears to be good basedon results from the FFB, but needs improvement toproperly model regions of low soot volume fraction.Including a source term to account for oxidation of sootparticles may improve the NC model. Assuming anaverage soot number density does not significantly affectthe ultimate soot volume fraction predictions in any ofthe cases considered and may be a reasonable assump-tion to save computational time if specific soot particlesize predictions are not required. The empirical tarequation method predicted significantly different tarcontours in the FPTF than the transport equationmethod, but predicted soot contours in the FPTF andsimilar gas temperature and species concentrations inthe FPTF. However, the less empirical transport equa-tion method is recommended since it can describe effectsof coal type using the CPD model.
A big challenge in computational fluid dynamic codesis accurately predicting turbulence, as was apparent inthe CPR and FPTF results. It is thought that theturbulence may impact soot chemistry and particle sizedistribution; no attempt was made here to describethese effects. Radiative scattering from soot agglomer-ates might influence predictions as well. More accurateradiative properties could also contribute to overallpredictive capabilities. Resorting to Lagrangian statis-tical methods may be necessary for accurate predictionsif the transport equation method is shown to be insuf-ficient. Modeling tar ejection velocities may also beimportant, especially for laminar single particle casessuch as the FFB. Finally, the consideration of OH asan oxidizer instead of just O2 may prove necessary foraccurate predictive capabilities.
Conclusion
A model of soot formation from coal tar was incorpo-rated into a 3-D comprehensive coal combustion code(PCGC-3). Soot oxidation and agglomeration were alsoincluded. The model was tested versus data from ahigh-temperature pyrolysis reactor and two laboratory-scale coal combustors. Based on the predictions made,the following conclusions were reached.
(1) The soot model is capable of predicting sootbehavior in both nonoxidizing and oxidizing environ-ments based on predicted tar yields from the CPD coaldevolatilization model.
Table 5. Single Macroiteration Run Times for TwoModels
model Case 1 (min) Case 2 (min)
FFB 10.7 6.93FPTF 317 235
756 Energy & Fuels, Vol. 12, No. 4, 1998 Brown and Fletcher
(2) Predictions agreed well with high-temperaturesoot yield data from a flat flame burner, including totalsoot yields as a function of coal type and qualitativediameter characteristics.
(3) Computational analysis on the impact of includinga soot model indicates that the gas temperatures in theflame are lowered by as much as 300 K and that localNOx concentrations are lowered by as much as 250 ppm.The most significant differences were observed in thepredictions of the fireside performance test facility,which was the largest furnace modeled. Because theimpact of soot is shown to be significant in a largefurnace, modeling soot in coal-fired flames is thoughtto be important to ensure accurate predictions.
(4) Including a soot model in comprehensive coalcombustion codes is therefore expected to improve thegas temperature and NOx concentration predictions.
(5) The average soot particle diameter seems to becalculated accurately in regions of high soot concentra-tion using the NC equation. Assuming an average valueof NC appears to be a reasonable alternative to savecomputation time without significantly affecting predic-tions of fv,C, provided that predicted soot particle diam-eters are not needed.
(6) Although tar yields were adequately representedthrough an empirical formula in these predictions, usingthe more theoretical and accurate network particledevolatilization models are recommended over empiricalformulas for tar predictions.
(7) The use of a soot model adds significant additionalcomputational time; the full model may add as muchas 50% to the time required to converge. Addedconvergence time requirements may be reduced bystarting the soot model after flow parameters such asvelocities and pressures have approached convergenceor by initially using the quicker, more empirical models.
(8) Additional data on coal-derived soot would greatlyincrease the ability to perform more detailed evaluationsof the model.
(9) Future related research areas involve includingthe effects of modeling soot oxidation by OH, improvingsoot optical properties, improving turbulence models,modeling tar ejection velocities, accounting for scatter-ing of agglomerates, and accounting for the interactionsbetween soot and turbulence.
Acknowledgment. This research was funded by theAdvanced Combustion and Engineering Research Cen-ter at Brigham Young University. Funds for this centerare received from the National Science Foundation, theState of Utah, 43 industrial participants, and theDepartment of Energy.
Glossary
A Arrhenius preexponential factorC1 empirical soot formation constantC2 empirical soot oxidation constantCa collision constantCmin number of carbon atoms per incipient soot particlec concentration (mol/m3)d diameter (m)E Arrhenius activation energy (kJ/g‚mol)f fractiong mixture fraction variancek Boltzman’s constant (J/K) or turbulent kinetic
energy (m2/s2)Le mean beam path length (m)M molecular weightN number of particlesNC soot particles per unit mass (particles/kg)Na Avogadro’s numberp partial pressure (N/m2)R universal gas constantr̆n reaction rate (s-1)S source term (s-1)SA total surface area (m2)SP particle source termT temperature (K)u velocity (m/s)V volume (m3)Y mass fraction
Greek Symbols
â local molar density (mol/kg of mixture)ε emissivity or turbulent kinetic energy dissipation
rate (m2/s3)η coal gas mixture fractionκ absorption coefficient (m-1)µ viscosity (kg/m/s)F density (kg/m3)σ Schmidt numberφ equivalence ratio
Subscripts
AN agglomeration of the particles per unit massC carbon or sootFC formation of sootFT formation of tarGT gasification of targ gasi the i component (i.e., 1, 2, 3...)OC oxidation of sootOT oxidation of tarT tarv volumetric basisλ wavelength⊥ perpendicular to
EF9702207
Modeling Soot Derived from Pulverized Coal Energy & Fuels, Vol. 12, No. 4, 1998 757