modeling tcp in small-buffer networks mark shifrin and isaac keslassy technion (israel)
Post on 21-Dec-2015
216 views
TRANSCRIPT

Modeling TCP Modeling TCP in Small-Buffer Networksin Small-Buffer Networks
Mark Shifrin and Isaac Keslassy
Technion (Israel)

ProblemProblem
How much buffering do routers need?

Why Does Buffer Size Matter?Why Does Buffer Size Matter?
Buffers are costly. Today’s buffers:
1/2 board space 1/3 power consumption
Small buffers: On chip buffers Higher density Lower cost Scalability
[N. McKeown, Stanford]
4
How much Buffer does a Router need?How much Buffer does a Router need?
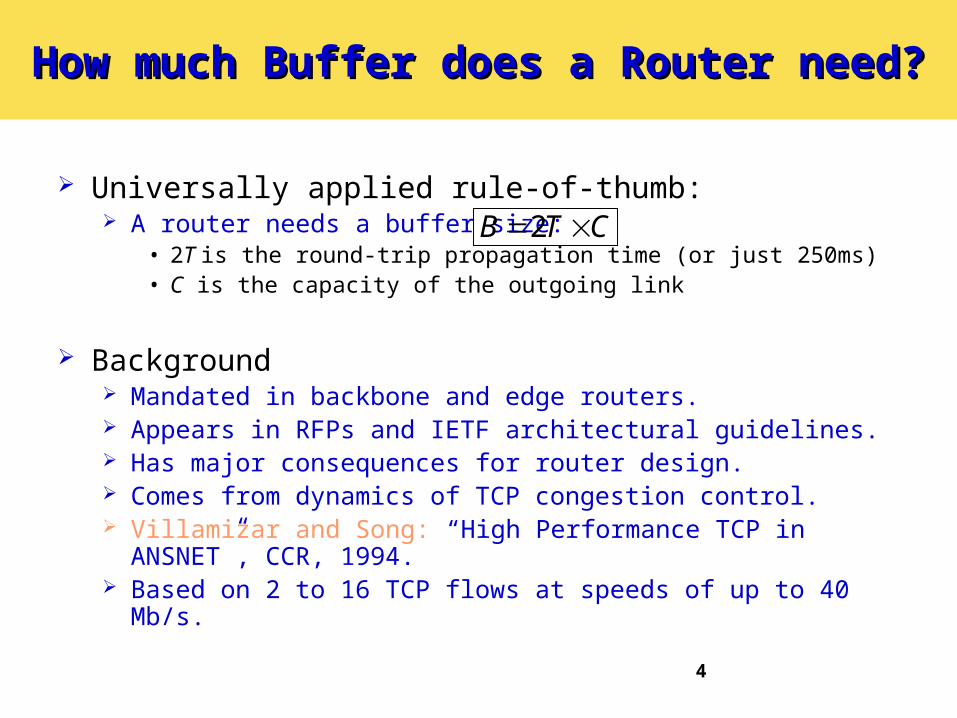
Universally applied rule-of-thumb: A router needs a buffer size:
• 2T is the round-trip propagation time (or just 250ms)• C is the capacity of the outgoing link
Background Mandated in backbone and edge routers. Appears in RFPs and IETF architectural guidelines. Has major consequences for router design. Comes from dynamics of TCP congestion control. Villamizar and Song: “High Performance TCP in ANSNET”,
CCR, 1994. Based on 2 to 16 TCP flows at speeds of up to 40 Mb/s.
CTB 2

Synchronized FlowsSynchronized Flows
Aggregate window has same dynamics Therefore buffer occupancy has same dynamics Rule-of-thumb still holds.
5
2maxW
t
max
2
W
maxW
maxW

Many TCP FlowsMany TCP Flows
6
ProbabilityDistribution
B
0
Buffer Size
W

Stanford ModelStanford Model
[Appenzeller et al., ’04 | McKeown and Wischik, ’05 | McKeown et al., ‘06]
Assumption 1: TCP Flows modeled as i.i.d.
total window W has Gaussian distribution
Assumption 2: Queue is the only variable part
queue has Gaussian distribution: Q=W-CONST
use smaller buffer than in rule of thumb
7

Impact on Router DesignImpact on Router Design
40Gb/s linecard with 1,000,000 flows Rule of thumb: Buffer = 10Gbits
• Requires external, slow DRAM
Stanford model: Buffer = 10Mbits• Can use on-chip, fast SRAM• Delays halved for short-flows

MotivationMotivation
Assumption 1: TCP Flows modeled as i.i.d.
total window W has Gaussian distribution
Assumption 2: Queue is the only variable part
queue has Gaussian distribution: Q=W-CONST
In a small-buffer world…
OK
Queue is small negligible?
Gaussian part is… on the lines!

ContributionsContributions
Distribution models for: Lines Arrival rates to queues Queue sizes Packet loss rates
General closed-loop model for small-buffer networks
Result: queues are not the only variable part in the network

Model Development FlowModel Development Flow
11
cwnd
Q pdf
total arrival rate
li1 pdf
l1i arrival rates
packet loss

Model of lModel of lii11
cwnd
li1 pdf
packet loss

Bursty Model of Window DistributionBursty Model of Window Distribution
13
li3li
1li
5
li2
li4 li
6
• Common Approach 1: Uniform packet distribution. l1(t)i = wi(t)* tpi
1/rtti.
• Approach 2: Bursty Packet Distribution
Bsource dest.
rtti=tp1i+tp2
i+tp3i+tp4
i+tp5i+tp6
i

Bursty Model of Window DistributionBursty Model of Window Distribution
Assumption: All packets in a flow move in a single burst
Conclusion 1: All packets belonging to an arbitrary flow i are present almost always on the same link.
Conclusion 2: The probability of burst of flow i being present on the certain link is equal to the ratio of its propagation latency to the total rtti.
14

Simulation ResultsSimulation Results
15

Model Development FlowModel Development Flow
16
cwnd total arrival rate
li1 pdf
l1i arrival rates

Rate Transmission DerivationRate Transmission Derivation
17
The objective is to find the pdf of the number of packets sent on some link i, ri, in a time unit δt.
Assumptions: The rate on each one of the links in L1 is
statistically independent We assume that the transmissions are bursty. We assume that the rate is proportional to the
distribution of l1i and to the ratio δt/tp1i.

Arrival rate of a single flowArrival rate of a single flow
li1
li2
sourceB
δt
tp1i
li1 *δt/tp1
i
We find the arrival distribution for every flow in δt msec.
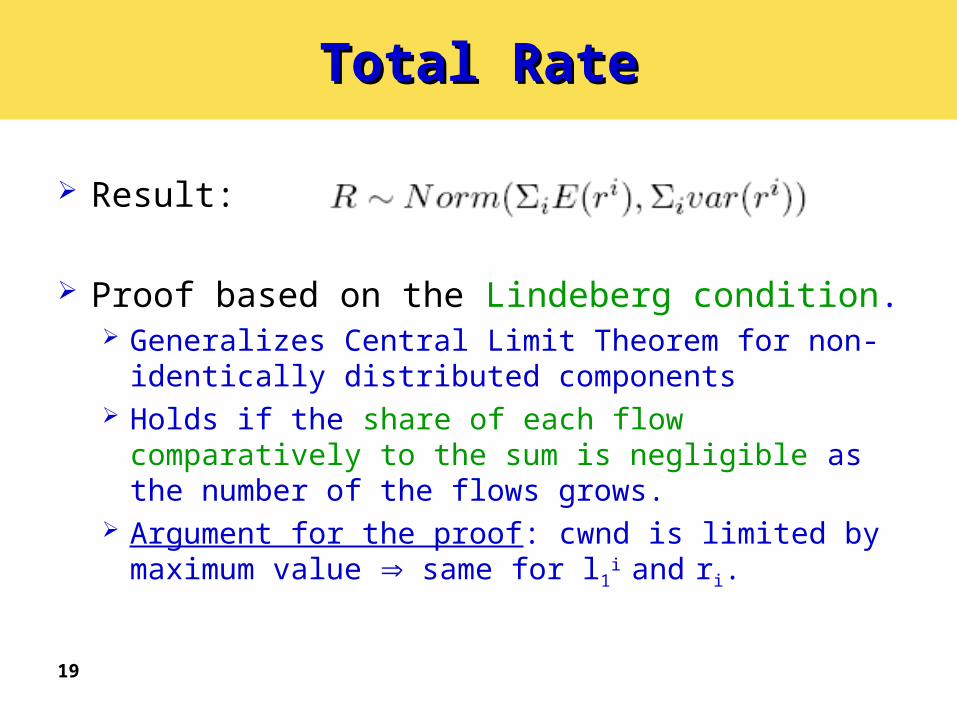
Total RateTotal Rate
Result:
Proof based on the Lindeberg condition. Generalizes Central Limit Theorem for non-identically
distributed components Holds if the share of each flow comparatively to the
sum is negligible as the number of the flows grows. Argument for the proof: cwnd is limited by maximum
value same for l1i and ri.
19

Instantaneous Rate Model - ResultsInstantaneous Rate Model - Results
Probability
Total arrival rate – number of packets per δt
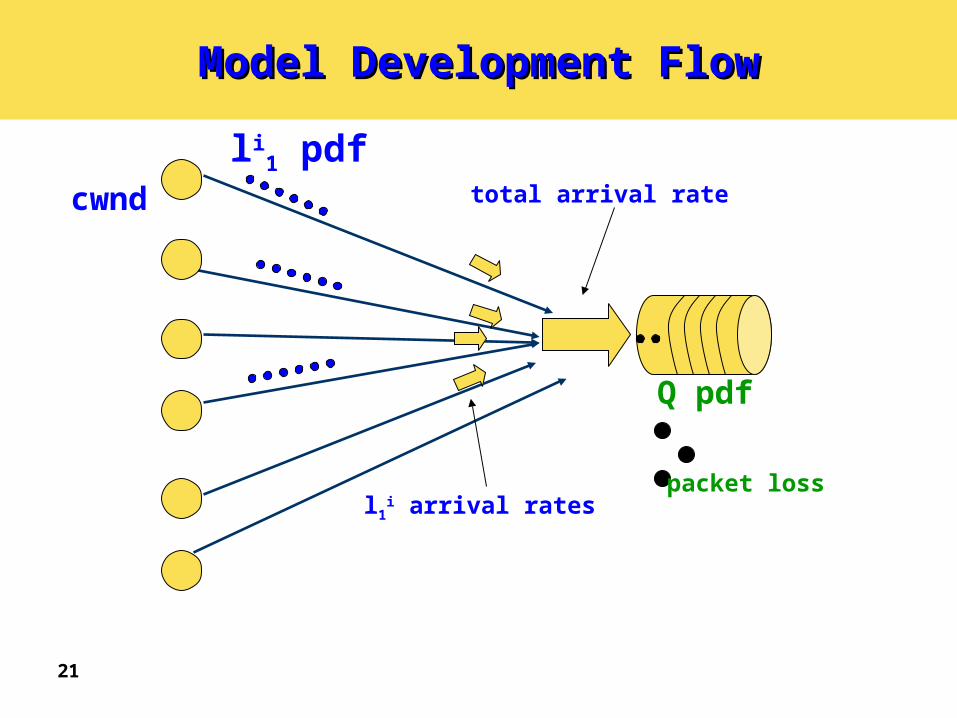
Model Development FlowModel Development Flow
21
cwnd
Q pdf
total arrival rate
li1 pdf
l1i arrival rates
packet loss

PDF for QPDF for Q
To find the queue size distribution: Run Markov Chain simulation (compared with
[Tran-Gia and Ahmadi, ‘88]) Use samples of R for the transitions
Packet loss p is derived from the queue size distribution.
22

PDF of QPDF of Q
23
Probability
Q state – 0 to 585 packets

Fixed Point Solution: Fixed Point Solution: p=f(p)p=f(p)
24
cwnd
Q pdf
total arrival rate
li1 pdf
l1i arrival rates
packet loss

Packet loss - resultsPacket loss - results
Model gives about 10%-25% of discrepancy.
Case 1: Measured: p=2.7%, Model: p=3% Case 2: Measured: p=0.8%, Model: p=0.98% Case 3: Measured: p=1.4%, Model: p=1.82% Case 4: Measured: p=0.452%, Model: p=0.56%
25

The Gaussian distributionsThe Gaussian distributions
NS2 simulation of 500 flows with different propagation times
L4
L2
L1
L5L6
W

Are these lines really Gaussian?Are these lines really Gaussian?
27

SummarySummary
Introduced general closed-loop model for small-buffer networks
Proved wrong the usual assumption that queues are the only variable part in the network
28

Thank you.Thank you.