modeling the costs and benefits of capnography monitoring ... · modeling the costs and benefits of...
TRANSCRIPT
Modeling the costs and benefits of capnographymonitoring during procedural sedation for gastro-intestinal endoscopy
Authors Rhodri Saunders1, Mary Erslon2, John Vargo3
Institutions 1 Ossian Health Economics and Communications, Basel, Switzerland (current affiliation: Coreva Scientific, Freiburg, Germany)2 Covidien, Boulder, Colorado, United States (current affiliation: Medtronic, Boulder, Colorado, United States)3 Cleveland Clinic, Cleveland, Ohio, United States
submitted30. September 2015accepted after revision4. January 2016
BibliographyDOI http://dx.doi.org/10.1055/s-0042-100719Endoscopy International Open2016; 04: E340–E351© Georg Thieme Verlag KGStuttgart · New YorkE-ISSN 2196-9736
Corresponding authorRhodri SaundersCoreva ScientificFreiburgGermanyPhone: [email protected]
License terms
Original articleE340THIEME
Associated presentations: Aspects of this workhave been accepted for poster publication at An-esthesiology 2015 (San Diego, United States) andE-ISPOR 2015 (Milan, Italy)
Introduction!
Diagnostic and therapeutic procedures undertak-en as part of standard healthcare can be unplea-sant, distressing and painful for patients [1,2].Provision of sedation and analgesia to limit pa-tient distress is common and has been shown toincrease the success rate of procedures such as co-lonoscopy [3]. The aim of procedural sedation andanalgesia (PSA) is to reduce patients’ conscious-ness and pain recognition while retaining theircontinuous, independent ventilation, and protec-tive reflexes [4]. The role of PSA has been growingas sedation outside the operating room and/orwithout anesthesiologist assistance becomesmore common [5,6]. A comparison of gastroente-
rology procedures in the United States between2003 and 2009 found that although the numberof procedures performed in Medicare patients re-mained roughly constant, the percentage of pro-cedures using anesthesia increased from 13.5% to30.2% [6].The use of PSA is not without both risks and costs.Reports suggest that PSA accounts for approxi-mately 75% of the time and 40% of the cost asso-ciated with endoscopy [7]. Monitoring of PSA ismandatory because there is a risk of patients pro-gressing into deeper, unintended levels of seda-tion; guidelines recommend that one healthcareprofessional be specifically tasked with monitor-ing [5,8]. Still, adverse events (AEs) such as apnea,desaturation, and hypotension occur. Observa-tional and retrospective studies indicated lowrates of AEs, with 1.6% to 2.4% of patients experi-encing oxygen desaturation<90% during PSA [9–11]. Randomized, controlled trials, however, gen-erally report higher values (13% to 69%) [12–14].
Saunders Rhodri et al. Cost benefit of capnography monitoring… Endoscopy International Open 2016; 04: E340–E351
Background and study aims: The addition of cap-nography to procedural sedation/analgesia (PSA)guidelines has been controversial due to limitedevidence of clinical utility in moderate PSA andcost concerns.Patients and methods: A comprehensive model ofPSA during gastrointestinal endoscopy was devel-oped to capture adverse events (AEs), guidelineinterventions, outcomes, and costs. Randomized,controlled trials and large-scale studies wereused to inform the model. The model comparedoutcomes using pulse oximetry alone with pulseoximetry plus capnography. Pulse oximetry wasassumed at no cost, whereas capnography costUSD 4,000 per monitor. AE costs were obtainedfrom literature review and Premier database a-nalysis. The model population (n=8,000) hadmean characteristics of age 55.5 years, bodymass index 26.2kg/m2, and 45.3% male.
Results: The addition of capnography resulted in a27.2% and 18.0% reduction in the proportion ofpatients experiencing an AE during deep andmoderate PSA, respectively. Sensitivity analysesdemonstrated significant reductions in apneaand desaturation with capnography. The median(95% credible interval) number needed to treatto avoid any adverse event was 8 (2; 72) for deepand 6 (−59; 92) for moderate. Reduced AEs resul-ted in cost savings that accounted for the addi-tional upfront purchase cost. Capnography wasestimated to reduce the cost per procedure byUSD 85 (deep) or USD 35 (moderate).Conclusions: Capnography is estimated to becost-effective if not cost saving during PSA forgastrointestinal endoscopy. Savings were drivenby improved patient safety, suggesting that cap-nography may have an important role in the safeprovision of PSA.
The occurrence of AEs further adds to the care and cost burdenplaced on hospitals [15–17].Standard-of-care monitoring for PSA is pulse oximetry, visual as-sessment and blood pressure measurement, with adjunct moni-toring with capnography a Level B recommendation in the emer-gency room setting and when PSA targets deep sedation forendoscopy [8]. Capnography monitoring evaluates carbon diox-ide in exhaled air and provides a measure of patient ventilation.Randomized, controlled trials have demonstrated that capnogra-phy in addition to pulse oximetry can reduce the occurrence ofspecific AEs in both pediatric patients targeting moderate seda-tion and adults receiving propofol-mediated deep sedation [12–14, 18]. To date, there are no adult studies addressing the utilityof capnography with PSA targeting moderate sedation. Further-more, two studies published in 2015 indicate that capnographyleads to earlier identification of compromise and a reduced needfor intervention [19,20]. Both of these series, however, did not in-volve gastrointestinal endoscopy. There is no meta-analysis thatquantifies the impact of capnography monitoring on AEs to pro-vide the highest level of evidence to inform clinical decision mak-ing. As such, moves to include capnography monitoring in thestandard of care for PSA targeting moderate sedation have beencontroversial and met with resistance [21]. Key objections werethe level of evidence supporting capnography in PSA and inparticular, in adults receiving moderate sedation, the lack ofstandardized outcome definitions for apnea or disordered re-spiration and the added monetary burden of a costly technology[21].Capnography is the standard of care for monitoring sedation inother hospital settings, including PSA targeting deep sedationand monitoring patients receiving mechanical ventilation whereclinical trial data indicate its benefit [14, 22–24]. The highest lev-el of synthesized evidence supporting the patient benefits of cap-nography is, however, lacking and no studies to date have eval-uated the cost of capnography monitoring during PSA. This anal-ysis evaluates whether the cost of adding capnography repre-sents a reasonable barrier to its addition to the standard of careduring PSA. Due to data availability and the fact that AE ratesvary by procedure, the analysis focuses on gastrointestinal endo-scopic procedures.
Patients and methods!
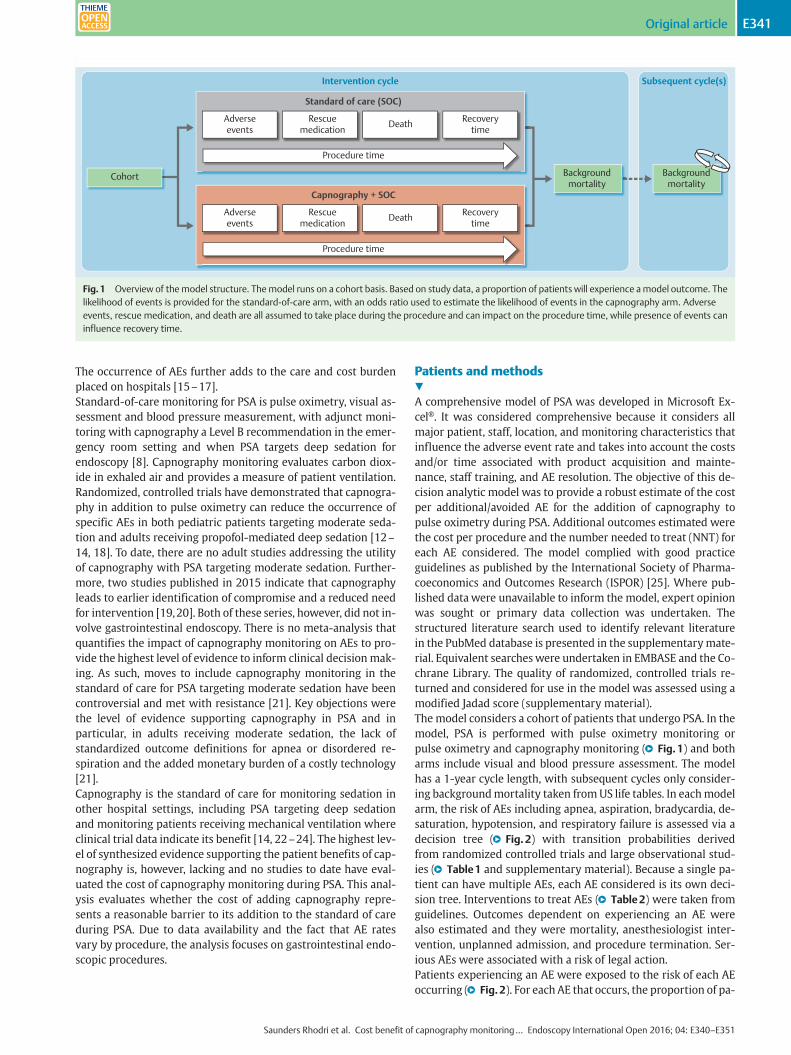
A comprehensive model of PSA was developed in Microsoft Ex-cel®. It was considered comprehensive because it considers allmajor patient, staff, location, and monitoring characteristics thatinfluence the adverse event rate and takes into account the costsand/or time associated with product acquisition and mainte-nance, staff training, and AE resolution. The objective of this de-cision analytic model was to provide a robust estimate of the costper additional/avoided AE for the addition of capnography topulse oximetry during PSA. Additional outcomes estimated werethe cost per procedure and the number needed to treat (NNT) foreach AE considered. The model complied with good practiceguidelines as published by the International Society of Pharma-coeconomics and Outcomes Research (ISPOR) [25]. Where pub-lished data were unavailable to inform the model, expert opinionwas sought or primary data collection was undertaken. Thestructured literature search used to identify relevant literaturein the PubMed database is presented in the supplementarymate-rial. Equivalent searcheswere undertaken in EMBASE and the Co-chrane Library. The quality of randomized, controlled trials re-turned and considered for use in the model was assessed using amodified Jadad score (supplementary material).The model considers a cohort of patients that undergo PSA. In themodel, PSA is performed with pulse oximetry monitoring orpulse oximetry and capnography monitoring (●" Fig.1) and botharms include visual and blood pressure assessment. The modelhas a 1-year cycle length, with subsequent cycles only consider-ing backgroundmortality taken fromUS life tables. In eachmodelarm, the risk of AEs including apnea, aspiration, bradycardia, de-saturation, hypotension, and respiratory failure is assessed via adecision tree (●" Fig.2) with transition probabilities derivedfrom randomized controlled trials and large observational stud-ies (●" Table1 and supplementary material). Because a single pa-tient can have multiple AEs, each AE considered is its own deci-sion tree. Interventions to treat AEs (●" Table2) were taken fromguidelines. Outcomes dependent on experiencing an AE werealso estimated and they were mortality, anesthesiologist inter-vention, unplanned admission, and procedure termination. Ser-ious AEs were associated with a risk of legal action.Patients experiencing an AE were exposed to the risk of each AEoccurring (●" Fig.2). For each AE that occurs, the proportion of pa-
Cohort Backgroundmortality
Backgroundmortality
Adverseevents
Procedure time
Standard of care (SOC)
Intervention cycle Subsequent cycle(s)
Rescuemedication Death Recovery
time
Adverseevents
Procedure time
Capnography + SOC
Rescuemedication Death Recovery
time
Fig.1 Overview of themodel structure. Themodel runs on a cohort basis. Based on study data, a proportion of patients will experience amodel outcome. Thelikelihood of events is provided for the standard-of-care arm, with an odds ratio used to estimate the likelihood of events in the capnography arm. Adverseevents, rescue medication, and death are all assumed to take place during the procedure and can impact on the procedure time, while presence of events caninfluence recovery time.
Saunders Rhodri et al. Cost benefit of capnography monitoring… Endoscopy International Open 2016; 04: E340–E351
Original article E341THIEME
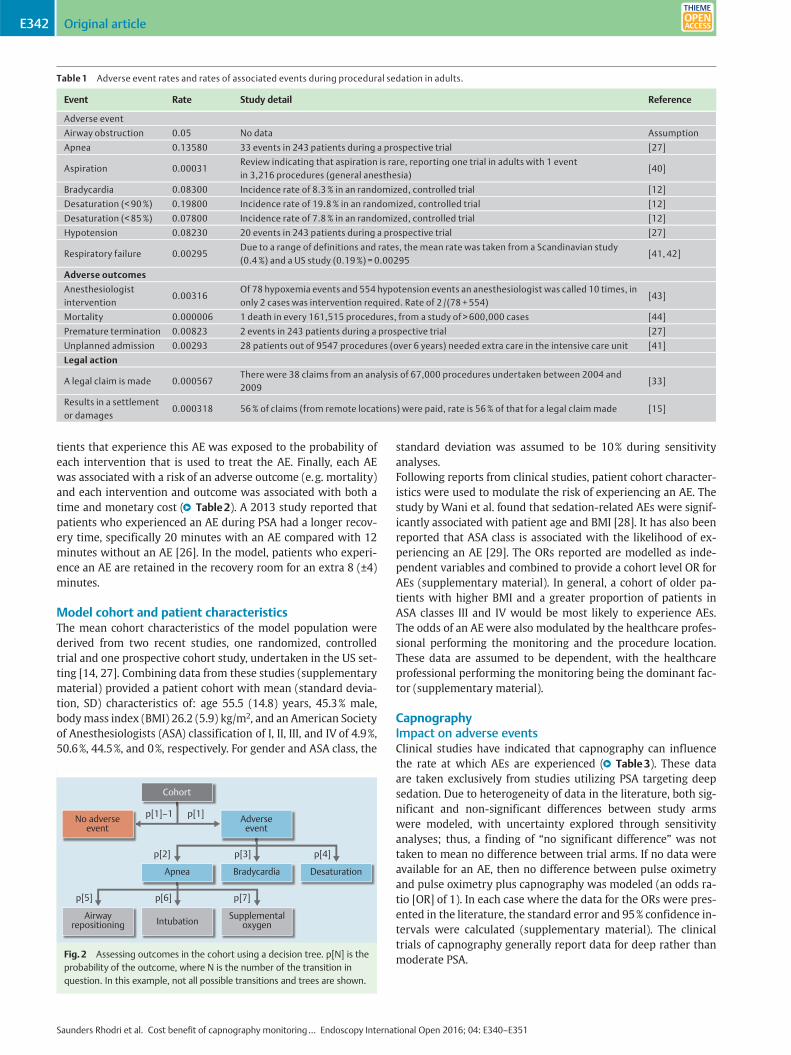
tients that experience this AE was exposed to the probability ofeach intervention that is used to treat the AE. Finally, each AEwas associated with a risk of an adverse outcome (e.g. mortality)and each intervention and outcome was associated with both atime and monetary cost (●" Table2). A 2013 study reported thatpatients who experienced an AE during PSA had a longer recov-ery time, specifically 20 minutes with an AE compared with 12minutes without an AE [26]. In the model, patients who experi-ence an AE are retained in the recovery room for an extra 8 (±4)minutes.
Model cohort and patient characteristicsThe mean cohort characteristics of the model population werederived from two recent studies, one randomized, controlledtrial and one prospective cohort study, undertaken in the US set-ting [14, 27]. Combining data from these studies (supplementarymaterial) provided a patient cohort with mean (standard devia-tion, SD) characteristics of: age 55.5 (14.8) years, 45.3% male,bodymass index (BMI) 26.2 (5.9) kg/m2, and an American Societyof Anesthesiologists (ASA) classification of I, II, III, and IV of 4.9%,50.6%, 44.5%, and 0%, respectively. For gender and ASA class, the
standard deviation was assumed to be 10% during sensitivityanalyses.Following reports from clinical studies, patient cohort character-istics were used to modulate the risk of experiencing an AE. Thestudy by Wani et al. found that sedation-related AEs were signif-icantly associated with patient age and BMI [28]. It has also beenreported that ASA class is associated with the likelihood of ex-periencing an AE [29]. The ORs reported are modelled as inde-pendent variables and combined to provide a cohort level OR forAEs (supplementary material). In general, a cohort of older pa-tients with higher BMI and a greater proportion of patients inASA classes III and IV would be most likely to experience AEs.The odds of an AE were also modulated by the healthcare profes-sional performing the monitoring and the procedure location.These data are assumed to be dependent, with the healthcareprofessional performing the monitoring being the dominant fac-tor (supplementary material).
CapnographyImpact on adverse eventsClinical studies have indicated that capnography can influencethe rate at which AEs are experienced (●" Table3). These dataare taken exclusively from studies utilizing PSA targeting deepsedation. Due to heterogeneity of data in the literature, both sig-nificant and non-significant differences between study armswere modeled, with uncertainty explored through sensitivityanalyses; thus, a finding of “no significant difference” was nottaken to mean no difference between trial arms. If no data wereavailable for an AE, then no difference between pulse oximetryand pulse oximetry plus capnography was modeled (an odds ra-tio [OR] of 1). In each case where the data for the ORs were pres-ented in the literature, the standard error and 95% confidence in-tervals were calculated (supplementary material). The clinicaltrials of capnography generally report data for deep rather thanmoderate PSA.
Table 1 Adverse event rates and rates of associated events during procedural sedation in adults.
Event Rate Study detail Reference
Adverse event
Airway obstruction 0.05 No data Assumption
Apnea 0.13580 33 events in 243 patients during a prospective trial [27]
Aspiration 0.00031Review indicating that aspiration is rare, reporting one trial in adults with 1 eventin 3,216 procedures (general anesthesia)
[40]
Bradycardia 0.08300 Incidence rate of 8.3% in an randomized, controlled trial [12]
Desaturation (< 90%) 0.19800 Incidence rate of 19.8% in an randomized, controlled trial [12]
Desaturation (< 85%) 0.07800 Incidence rate of 7.8% in an randomized, controlled trial [12]
Hypotension 0.08230 20 events in 243 patients during a prospective trial [27]
Respiratory failure 0.00295Due to a range of definitions and rates, the mean rate was taken from a Scandinavian study(0.4%) and a US study (0.19%) = 0.00295
[41, 42]
Adverse outcomes
Anesthesiologistintervention
0.00316Of 78 hypoxemia events and 554 hypotension events an anesthesiologist was called 10 times, inonly 2 cases was intervention required. Rate of 2 /(78 + 554)
[43]
Mortality 0.000006 1 death in every 161,515 procedures, from a study of > 600,000 cases [44]
Premature termination 0.00823 2 events in 243 patients during a prospective trial [27]
Unplanned admission 0.00293 28 patients out of 9547 procedures (over 6 years) needed extra care in the intensive care unit [41]
Legal action
A legal claim is made 0.000567There were 38 claims from an analysis of 67,000 procedures undertaken between 2004 and2009
[33]
Results in a settlementor damages
0.000318 56% of claims (from remote locations) were paid, rate is 56% of that for a legal claim made [15]
Cohort
p[1]–1
p[2]
p[5] p[6] p[7]
p[3] p[4]
p[1]No adverse event
Adverse event
Apnea Bradycardia Desaturation
Airwayrepositioning Intubation Supplemental
oxygen
Fig.2 Assessing outcomes in the cohort using a decision tree. p[N] is theprobability of the outcome, where N is the number of the transition inquestion. In this example, not all possible transitions and trees are shown.
Saunders Rhodri et al. Cost benefit of capnography monitoring… Endoscopy International Open 2016; 04: E340–E351
Original articleE342THIEME
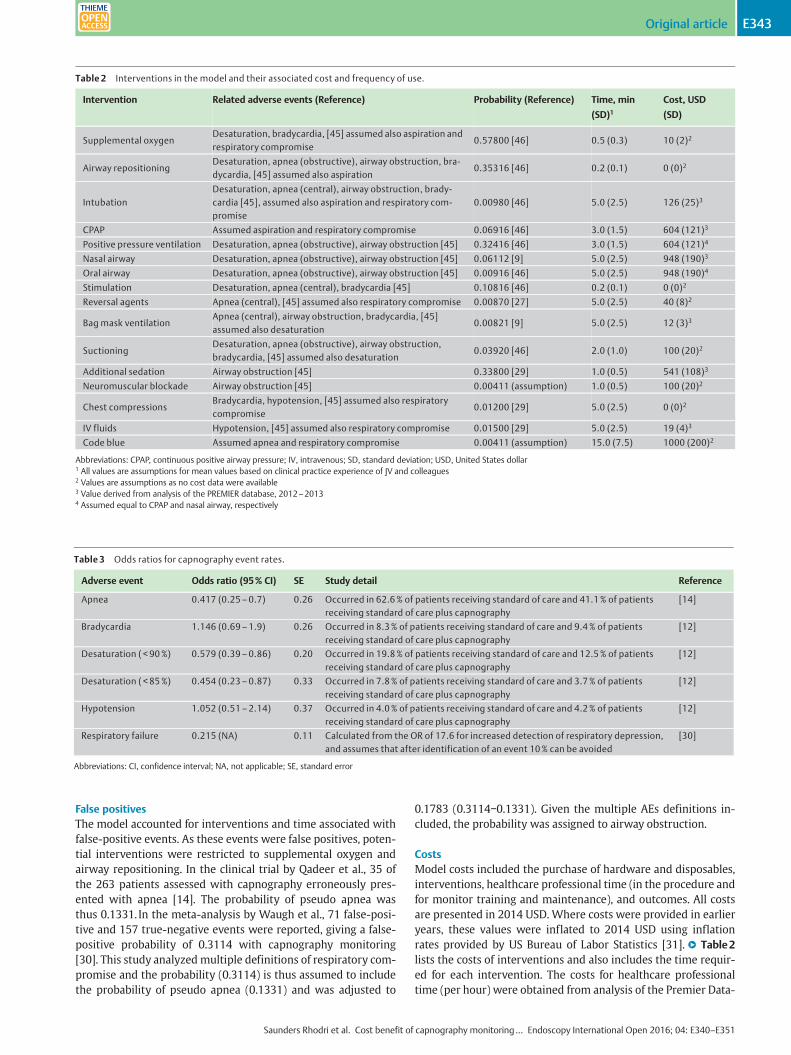
False positivesThe model accounted for interventions and time associated withfalse-positive events. As these events were false positives, poten-tial interventions were restricted to supplemental oxygen andairway repositioning. In the clinical trial by Qadeer et al., 35 ofthe 263 patients assessed with capnography erroneously pres-ented with apnea [14]. The probability of pseudo apnea wasthus 0.1331. In the meta-analysis by Waugh et al., 71 false-posi-tive and 157 true-negative events were reported, giving a false-positive probability of 0.3114 with capnography monitoring[30]. This study analyzedmultiple definitions of respiratory com-promise and the probability (0.3114) is thus assumed to includethe probability of pseudo apnea (0.1331) and was adjusted to
0.1783 (0.3114−0.1331). Given the multiple AEs definitions in-cluded, the probability was assigned to airway obstruction.
CostsModel costs included the purchase of hardware and disposables,interventions, healthcare professional time (in the procedure andfor monitor training and maintenance), and outcomes. All costsare presented in 2014 USD. Where costs were provided in earlieryears, these values were inflated to 2014 USD using inflationrates provided by US Bureau of Labor Statistics [31].●" Table2lists the costs of interventions and also includes the time requir-ed for each intervention. The costs for healthcare professionaltime (per hour) were obtained from analysis of the Premier Data-
Table 2 Interventions in the model and their associated cost and frequency of use.
Intervention Related adverse events (Reference) Probability (Reference) Time, min
(SD)1Cost, USD
(SD)
Supplemental oxygenDesaturation, bradycardia, [45] assumed also aspiration andrespiratory compromise
0.57800 [46] 0.5 (0.3) 10 (2)2
Airway repositioningDesaturation, apnea (obstructive), airway obstruction, bra-dycardia, [45] assumed also aspiration
0.35316 [46] 0.2 (0.1) 0 (0)2
IntubationDesaturation, apnea (central), airway obstruction, brady-cardia [45], assumed also aspiration and respiratory com-promise
0.00980 [46] 5.0 (2.5) 126 (25)3
CPAP Assumed aspiration and respiratory compromise 0.06916 [46] 3.0 (1.5) 604 (121)3
Positive pressure ventilation Desaturation, apnea (obstructive), airway obstruction [45] 0.32416 [46] 3.0 (1.5) 604 (121)4
Nasal airway Desaturation, apnea (obstructive), airway obstruction [45] 0.06112 [9] 5.0 (2.5) 948 (190)3
Oral airway Desaturation, apnea (obstructive), airway obstruction [45] 0.00916 [46] 5.0 (2.5) 948 (190)4
Stimulation Desaturation, apnea (central), bradycardia [45] 0.10816 [46] 0.2 (0.1) 0 (0)2
Reversal agents Apnea (central), [45] assumed also respiratory compromise 0.00870 [27] 5.0 (2.5) 40 (8)2
Bag mask ventilationApnea (central), airway obstruction, bradycardia, [45]assumed also desaturation
0.00821 [9] 5.0 (2.5) 12 (3)3
SuctioningDesaturation, apnea (obstructive), airway obstruction,bradycardia, [45] assumed also desaturation
0.03920 [46] 2.0 (1.0) 100 (20)2
Additional sedation Airway obstruction [45] 0.33800 [29] 1.0 (0.5) 541 (108)3
Neuromuscular blockade Airway obstruction [45] 0.00411 (assumption) 1.0 (0.5) 100 (20)2
Chest compressionsBradycardia, hypotension, [45] assumed also respiratorycompromise
0.01200 [29] 5.0 (2.5) 0 (0)2
IV fluids Hypotension, [45] assumed also respiratory compromise 0.01500 [29] 5.0 (2.5) 19 (4)3
Code blue Assumed apnea and respiratory compromise 0.00411 (assumption) 15.0 (7.5) 1000 (200)2
Abbreviations: CPAP, continuous positive airway pressure; IV, intravenous; SD, standard deviation; USD, United States dollar1 All values are assumptions for mean values based on clinical practice experience of JV and colleagues2 Values are assumptions as no cost data were available3 Value derived from analysis of the PREMIER database, 2012–20134 Assumed equal to CPAP and nasal airway, respectively
Table 3 Odds ratios for capnography event rates.
Adverse event Odds ratio (95% CI) SE Study detail Reference
Apnea 0.417 (0.25–0.7) 0.26 Occurred in 62.6% of patients receiving standard of care and 41.1% of patientsreceiving standard of care plus capnography
[14]
Bradycardia 1.146 (0.69–1.9) 0.26 Occurred in 8.3% of patients receiving standard of care and 9.4% of patientsreceiving standard of care plus capnography
[12]
Desaturation ( < 90%) 0.579 (0.39–0.86) 0.20 Occurred in 19.8% of patients receiving standard of care and 12.5% of patientsreceiving standard of care plus capnography
[12]
Desaturation ( < 85%) 0.454 (0.23–0.87) 0.33 Occurred in 7.8% of patients receiving standard of care and 3.7% of patientsreceiving standard of care plus capnography
[12]
Hypotension 1.052 (0.51–2.14) 0.37 Occurred in 4.0% of patients receiving standard of care and 4.2% of patientsreceiving standard of care plus capnography
[12]
Respiratory failure 0.215 (NA) 0.11 Calculated from the OR of 17.6 for increased detection of respiratory depression,and assumes that after identification of an event 10% can be avoided
[30]
Abbreviations: CI, confidence interval; NA, not applicable; SE, standard error
Saunders Rhodri et al. Cost benefit of capnography monitoring… Endoscopy International Open 2016; 04: E340–E351
Original article E343THIEME
base for years 2012–2013, with the exception of “other” whichwas taken from Couloures et al. 2011 [32]. The Premier database(Premier Inc., Charlotte, North Carolina) includes data on ap-proximately 20% of all US hospitalizations annually. It includesall International Classification of Diseases-9th Revision-ClinicalModification diagnosis and procedure codes recorded by the hos-pital, as well as a limited set of Current Procedural Terminology-4.The discharge-level data also include hospital resource utiliza-tion and charges/costs (for all payers).As no data were available, the mean (standard deviation, SD) costof death, premature termination, and hospital admission was as-sumed to be USD 5,000 (1,000). A mean (SD) cost of a legal claimwas assumed to be USD 25,000 (5,000), and damages (if paid)were taken from the midpoint of the interquartile range present-ed by Ferguson et al., [33] USD 225,000 (45,000).Purchase of a pulse oximetry monitor was assumed to be at nocost, whereas capnography cost USD 4,000 per monitor and USD16 per procedure for disposables (double that for pulse oximetryat USD 8.10). Both types of monitoring were associated withtraining and maintenance requirements. Training for capnogra-phywas assumed to be 2 hours per month per trained staff mem-ber, compared with 0.5 hours for pulse oximetry. Maintenanceand calibration was assumed to require 2 hours of time permonth from one technician (“other”).
Base case analysisIn addition to data presented previously, the base case scenariouses the following parameters: time horizon of 1 year, a cohortof 8,000 patients, four monitors/rooms in use, 16 staff trained touse the monitoring equipment, and three staff present during theprocedure.
Sensitivity analysesThe model supports one-way and probabilistic sensitivity analy-ses, which were programmed in Excel using Visual Basic for Ap-plications. For each simulation in the probabilistic sensitivityanalyses, every model input parameter was set at random, withthe value for each parameter for each simulation sampled from a
distribution. For each parameter, a distribution was defined bythe mean (base case value) and a measure of its variance (stand-ard deviation or standard error). A value between zero and one isthen sampled from a uniform distribution and used to identifythe parameter value for the simulation through lookup on the cu-mulative distribution function.In most cases a normal distribution was used to represent eachinput parameter, the exceptions being ratios that were sampledfrom log-normal distributions. Through probabilistic sensitivityanalyses the variability in model parameters and their influenceon model outcomes can be explored. Results are presented for5,000 simulations as the median and 95% credible interval (CrI).A 95% CrI is the range within which 95% of results lie, with thebottom 2.5% and the top 2.5% of results excluded. In this way itcaptures all “reasonable” results. It differs from a confidence in-terval about the mean (which indicates the range within whichthemean of the true distribution could lie), as it is not a summarymeasure of the distribution but describes the full range of results.The CrI is particularly suited to modelling outcomes because itdoes not require normally distribution of data for it to be valid.One-way sensitivity analyses assessed the robustness of modeloutcomes to changes in the unit cost of items. A further analysiswas undertaken to evaluate the impact of capnography duringmoderate PSA. In this scenario, event rates and odds ratios (sup-plementarymaterial) were updated to reflect those in the studiesfocused on moderate sedation and the patient population wassplit equally between ASA class I and II [34–36].
Results!
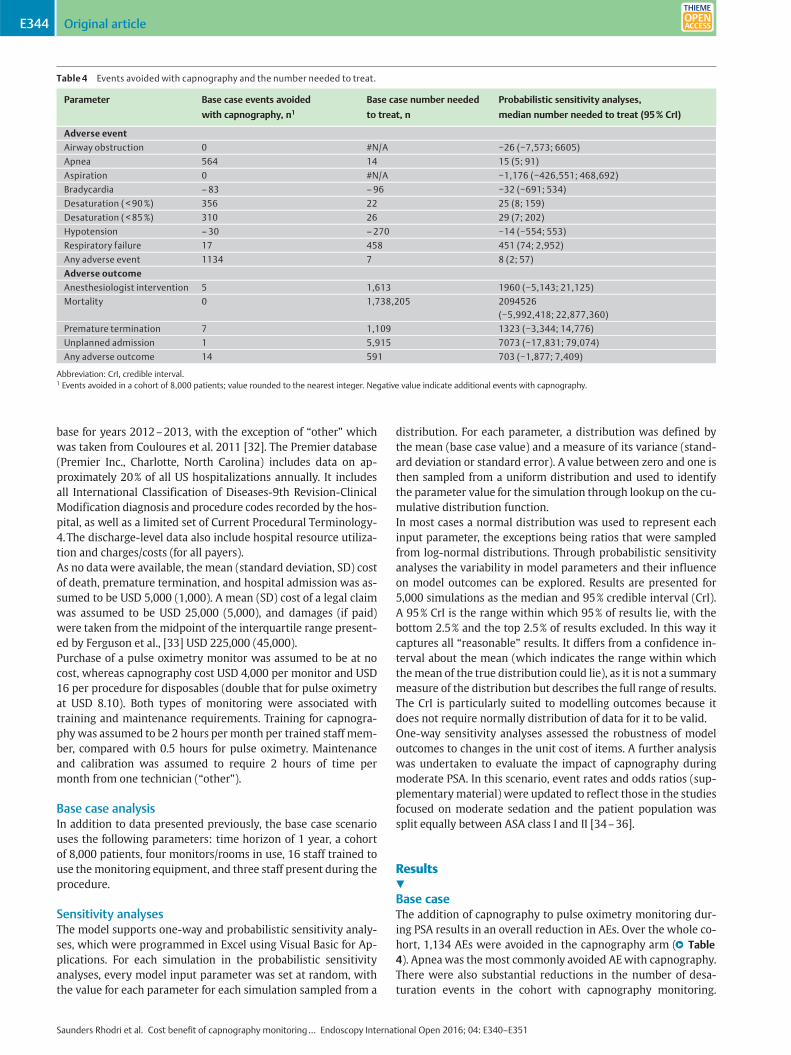
Base caseThe addition of capnography to pulse oximetry monitoring dur-ing PSA results in an overall reduction in AEs. Over the whole co-hort, 1,134 AEs were avoided in the capnography arm (●" Table4). Apneawas the most commonly avoided AEwith capnography.There were also substantial reductions in the number of desa-turation events in the cohort with capnography monitoring.
Table 4 Events avoided with capnography and the number needed to treat.
Parameter Base case events avoided
with capnography, n1
Base case number needed
to treat, n
Probabilistic sensitivity analyses,
median number needed to treat (95% CrI)
Adverse event
Airway obstruction 0 #N/A −26 (−7,573; 6605)
Apnea 564 14 15 (5; 91)
Aspiration 0 #N/A −1,176 (−426,551; 468,692)
Bradycardia –83 –96 −32 (−691; 534)
Desaturation ( < 90%) 356 22 25 (8; 159)
Desaturation ( < 85%) 310 26 29 (7; 202)
Hypotension –30 –270 −14 (−554; 553)
Respiratory failure 17 458 451 (74; 2,952)
Any adverse event 1134 7 8 (2; 57)
Adverse outcome
Anesthesiologist intervention 5 1,613 1960 (−5,143; 21,125)
Mortality 0 1,738,205 2094526(−5,992,418; 22,877,360)
Premature termination 7 1,109 1323 (−3,344; 14,776)
Unplanned admission 1 5,915 7073 (−17,831; 79,074)
Any adverse outcome 14 591 703 (−1,877; 7,409)
Abbreviation: CrI, credible interval.1 Events avoided in a cohort of 8,000 patients; value rounded to the nearest integer. Negative value indicate additional events with capnography.
Saunders Rhodri et al. Cost benefit of capnography monitoring… Endoscopy International Open 2016; 04: E340–E351
Original articleE344THIEME
Two AEs exhibited an increase in occurrence with capnography:30 additional hypotension and 83 additional bradycardia events.In terms of patients experiencing AEs, the percentage of thosewith an AE was 34.18% with pulse oximetry monitoring and24.89% with capnography (absolute reduction 9.29%; relative re-duction 27.18%).The NNT to avoid one AE with the addition of capnography wasseven (●" Table4), while the NNT to avoid one adverse outcome,591, was much larger. Although no single mortality event was a-voided in the base case cohort, estimates indicated that capno-graphy would result in a reduction in patient mortality, withone event avoided every 1.7 million procedures. Due to the lowerincidence of AEs, the addition of capnography was associatedwith a mean reduction in procedure time.Adding capnography during PSAwas estimated to reduce the costper procedure by USD 85 (USD 156 versus USD 241). Becausecapnography reduced the number of AEs and resulted in cost sav-ings compared with pulse oximetry alone, the analysis indicatedthat capnography was dominant to standard of care. In this anal-ysis, cost-effectiveness was influenced by the cohort size becauseprocurement costs were distributed over the number of proce-dures performed. In a breakeven analysis, capnography increasedthe mean cost per procedure if ≤294 procedures were undertak-en, whereas cost savings were realized from procedure number295 onwards.
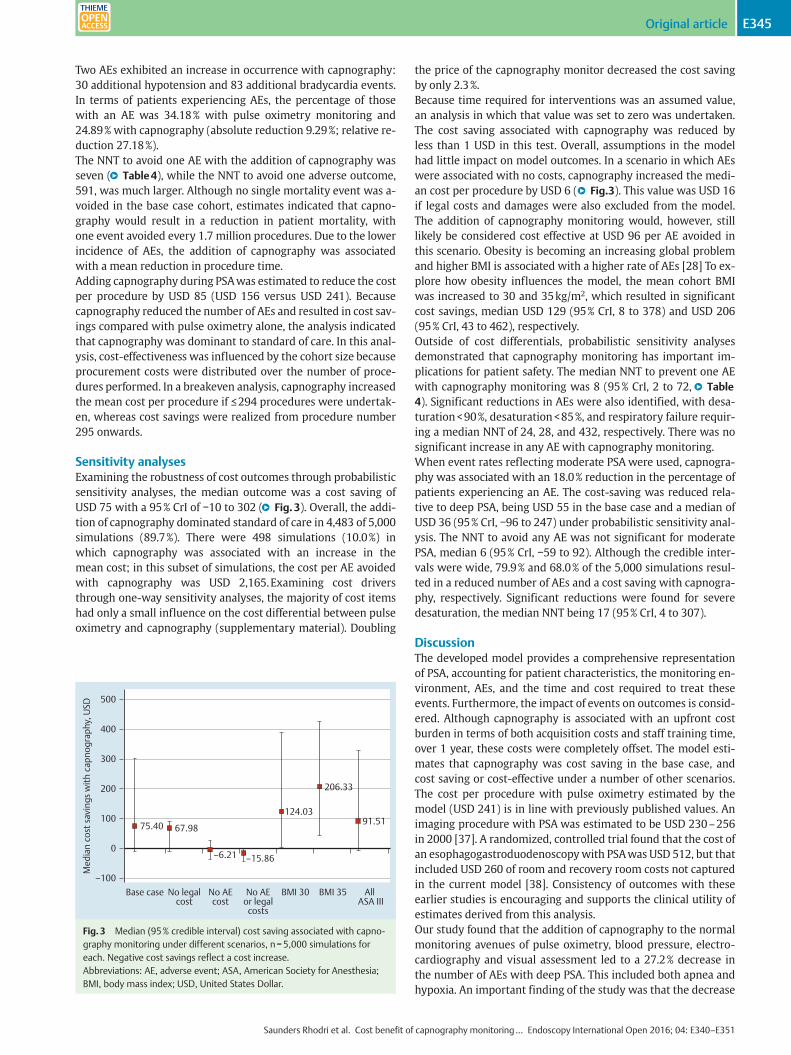
Sensitivity analysesExamining the robustness of cost outcomes through probabilisticsensitivity analyses, the median outcome was a cost saving ofUSD 75 with a 95% CrI of −10 to 302 (●" Fig.3). Overall, the addi-tion of capnography dominated standard of care in 4,483 of 5,000simulations (89.7%). There were 498 simulations (10.0%) inwhich capnography was associated with an increase in themean cost; in this subset of simulations, the cost per AE avoidedwith capnography was USD 2,165.Examining cost driversthrough one-way sensitivity analyses, the majority of cost itemshad only a small influence on the cost differential between pulseoximetry and capnography (supplementary material). Doubling
the price of the capnography monitor decreased the cost savingby only 2.3%.Because time required for interventions was an assumed value,an analysis in which that value was set to zero was undertaken.The cost saving associated with capnography was reduced byless than 1 USD in this test. Overall, assumptions in the modelhad little impact on model outcomes. In a scenario in which AEswere associated with no costs, capnography increased the medi-an cost per procedure by USD 6 (●" Fig.3). This value was USD 16if legal costs and damages were also excluded from the model.The addition of capnography monitoring would, however, stilllikely be considered cost effective at USD 96 per AE avoided inthis scenario. Obesity is becoming an increasing global problemand higher BMI is associated with a higher rate of AEs [28] To ex-plore how obesity influences the model, the mean cohort BMIwas increased to 30 and 35kg/m2, which resulted in significantcost savings, median USD 129 (95% CrI, 8 to 378) and USD 206(95% CrI, 43 to 462), respectively.Outside of cost differentials, probabilistic sensitivity analysesdemonstrated that capnography monitoring has important im-plications for patient safety. The median NNT to prevent one AEwith capnography monitoring was 8 (95% CrI, 2 to 72,●" Table4). Significant reductions in AEs were also identified, with desa-turation<90%, desaturation<85%, and respiratory failure requir-ing a median NNT of 24, 28, and 432, respectively. There was nosignificant increase in any AE with capnography monitoring.When event rates reflecting moderate PSA were used, capnogra-phy was associated with an 18.0% reduction in the percentage ofpatients experiencing an AE. The cost-saving was reduced rela-tive to deep PSA, being USD 55 in the base case and a median ofUSD 36 (95% CrI, −96 to 247) under probabilistic sensitivity anal-ysis. The NNT to avoid any AE was not significant for moderatePSA, median 6 (95% CrI, −59 to 92). Although the credible inter-vals were wide, 79.9% and 68.0% of the 5,000 simulations resul-ted in a reduced number of AEs and a cost saving with capnogra-phy, respectively. Significant reductions were found for severedesaturation, the median NNT being 17 (95% CrI, 4 to 307).
DiscussionThe developed model provides a comprehensive representationof PSA, accounting for patient characteristics, the monitoring en-vironment, AEs, and the time and cost required to treat theseevents. Furthermore, the impact of events on outcomes is consid-ered. Although capnography is associated with an upfront costburden in terms of both acquisition costs and staff training time,over 1 year, these costs were completely offset. The model esti-mates that capnography was cost saving in the base case, andcost saving or cost-effective under a number of other scenarios.The cost per procedure with pulse oximetry estimated by themodel (USD 241) is in line with previously published values. Animaging procedure with PSA was estimated to be USD 230–256in 2000 [37]. A randomized, controlled trial found that the cost ofan esophagogastroduodenoscopywith PSAwas USD 512, but thatincluded USD 260 of room and recovery room costs not capturedin the current model [38]. Consistency of outcomes with theseearlier studies is encouraging and supports the clinical utility ofestimates derived from this analysis.Our study found that the addition of capnography to the normalmonitoring avenues of pulse oximetry, blood pressure, electro-cardiography and visual assessment led to a 27.2% decrease inthe number of AEs with deep PSA. This included both apnea andhypoxia. An important finding of the study was that the decrease
Base case No legalcost
No AEcost
No AEor legal
costs
BMI 30 BMI 35 All ASA III
Med
ian
cost
sav
ings
with
cap
nogr
aphy
, USD
500
400
300
200
100
0
–100
75.40 67.98
–6.21 –15.86
124.03
206.33
91.51
Fig.3 Median (95% credible interval) cost saving associated with capno-graphy monitoring under different scenarios, n=5,000 simulations foreach. Negative cost savings reflect a cost increase.Abbreviations: AE, adverse event; ASA, American Society for Anesthesia;BMI, body mass index; USD, United States Dollar.
Saunders Rhodri et al. Cost benefit of capnography monitoring… Endoscopy International Open 2016; 04: E340–E351
Original article E345THIEME
in AEs was also seen in endoscopic procedures targeting moder-ate sedation, which has been a point of controversy due to theprevious lack of data. Because the vast majority of cardiopulmon-ary AEs are precipitated by ventilation abnormalities or hypoxia,the number needed to treat for these outcomes (8 for hypoxiaand 15 for apnea) appears to be an appropriate investment toavoid AEs for both moderate sedation as well as deeper levels ofsedation. Furthermore, a recent study on consecutive anesthesiapatients found that perioperative hypoxiawas associatedwith in-creased length of time in hospital [39] From a population-basedperspective, the addition of capnography may have multiple ad-vantages and in this analysis, it led to costs savings through itsability to prevent significant AEs and the costs associated withthem.As with all health economic analyses, there are limitations to thisstudy. Respiration can also be monitored using technology suchas chest impedance and acoustic airflow; as no head-to-headtrials have been performed, the comparative effectiveness of thetechnologies is unknown and is not included in this model. Fur-thermore, not all AEs are equal in terms of cost and severity. Themodel described accounts for cost but not severity of AEs. Thereason for this being that no patient quality of life data wereavailable to inform the model. In terms of AE severity, reductionsinmortality, respiratory failure, and severe desaturation aremostimportant from both a patient and provider standpoint.In developing a comprehensive model of PSA, notably a numberof parameters supported by the model could not be sourcedfrom published sources. The percentage of patients experiencingan AE varies considerably between studies, likely due to differen-ces in study design and endpoint definitions. To make compari-sons between monitoring strategies, the number of patients ex-periencing an AE was required. This value in the model was re-stricted due to the rates of AEs used, being mathematically con-strained to between 13.58% and 55.24% in adults. A further keyassumption is that the mean number of AEs experienced per pa-tient is the same for both standard-of-care monitoring and cap-nography monitoring. The impact of assumptions on model out-comes was tested through sensitivity analyses. The fact that re-sults remained relatively consistent provides support to the va-lidity of the model and the robustness of conclusions drawnfrom it. Still, the model is populated with data on gastroendosco-py and results presented should not be assumed to apply to all as-pects of PSA.Overall, estimates from this modeling analysis indicate that cap-nography can reduce the incidence of AEs and increase patientsafety during PSA at no or relatively insignificant extra cost. Con-cerns regarding the additional cost of capnography during PSA
are therefore likely to be unfounded for gastroendoscopy. Out-comes are, however, derived from a model and additional datafrom clinical studies that collect direct costs would be advanta-geous in further informing decisions in this area. Most appropri-ate would be the collection of costs during a randomized, con-trolled trial. Whether such a study is feasible given the patientnumbers required to observe sufficient adverse outcomes is de-batable. Only clinical trials enrolling over 500 patients have beenable to identify respiratory failure and the need for assisted ven-tilation [12]. Early identification and reduced need for interven-tion identified recently for capnography highlights the potentialto reduce failure to rescue [20], which could have an importantimpact on cost-effectiveness. Based on currently available data,this health economic analysis demonstrated that capnography islikely to add to patient safety and reduce costs during PSA. Giventhat cost concerns were central to resistance to including capno-graphy monitoring in guidelines for PSA [21], it may now be timeto revisit this discussion.
Conclusions!
Estimates from this modeling analysis suggest that capnographymonitoring during endoscopy is likely to be cost-effective versusstandard-of-care monitoring. In the base case it was cost savingdue to the reduction in AEs. The reduction in AEs with capnogra-phymonitoring indicates that outside of cost differentials, capno-graphy monitoring has important applications to patient safetyduring endoscopy. Given these estimates, it may be time to revisitthe question of adding capnography monitoring to standard ofcare during PSA for endoscopy.
Supplementary material!
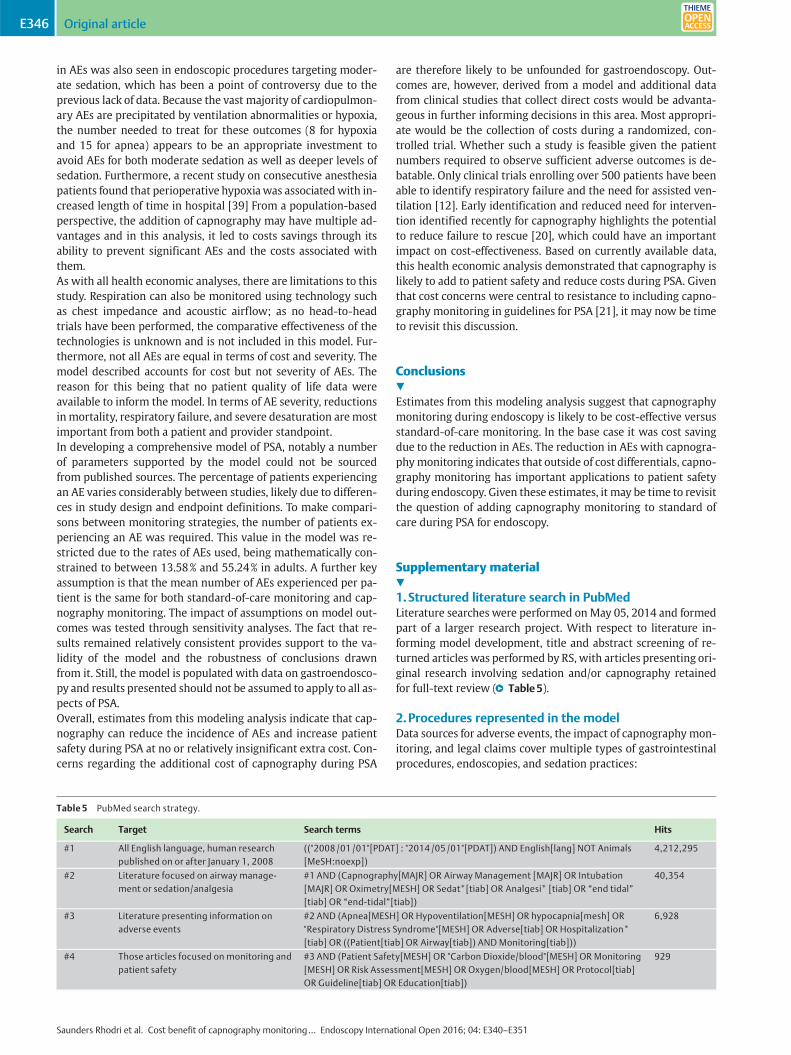
1.Structured literature search in PubMedLiterature searches were performed onMay 05, 2014 and formedpart of a larger research project. With respect to literature in-forming model development, title and abstract screening of re-turned articles was performed by RS, with articles presenting ori-ginal research involving sedation and/or capnography retainedfor full-text review (●" Table5).
2.Procedures represented in the modelData sources for adverse events, the impact of capnography mon-itoring, and legal claims cover multiple types of gastrointestinalprocedures, endoscopies, and sedation practices:
Table 5 PubMed search strategy.
Search Target Search terms Hits
#1 All English language, human researchpublished on or after January 1, 2008
(("2008 /01 /01"[PDAT] : "2014 /05 /01"[PDAT]) AND English[lang] NOT Animals[MeSH:noexp])
4,212,295
#2 Literature focused on airway manage-ment or sedation/analgesia
#1 AND (Capnography[MAJR] OR Airway Management [MAJR] OR Intubation[MAJR] OR Oximetry[MESH] OR Sedat*[tiab] OR Analgesi* [tiab] OR “end tidal”[tiab] OR “end-tidal”[tiab])
40,354
#3 Literature presenting information onadverse events
#2 AND (Apnea[MESH] OR Hypoventilation[MESH] OR hypocapnia[mesh] OR"Respiratory Distress Syndrome"[MESH] OR Adverse[tiab] OR Hospitalization*[tiab] OR ((Patient[tiab] OR Airway[tiab]) AND Monitoring[tiab]))
6,928
#4 Those articles focused on monitoring andpatient safety
#3 AND (Patient Safety[MESH] OR "Carbon Dioxide/blood"[MESH] OR Monitoring[MESH] OR Risk Assessment[MESH] OR Oxygen/blood[MESH] OR Protocol[tiab]OR Guideline[tiab] OR Education[tiab])
929
Saunders Rhodri et al. Cost benefit of capnography monitoring… Endoscopy International Open 2016; 04: E340–E351
Original articleE346THIEME
▶ Anesthesia [47]▶ Colonoscopy [48–50]▶ Endoscopic retrograde cholangio-pancreatography [51,52]▶ Endoscopic ultrasonography [51,52]▶ Endoscopy [50,53,54]▶ Esophagogastroduodenoscopy [49]▶ Procedural sedation in general [55–58]▶ Upper gastrointestinal endoscopy [50,51]
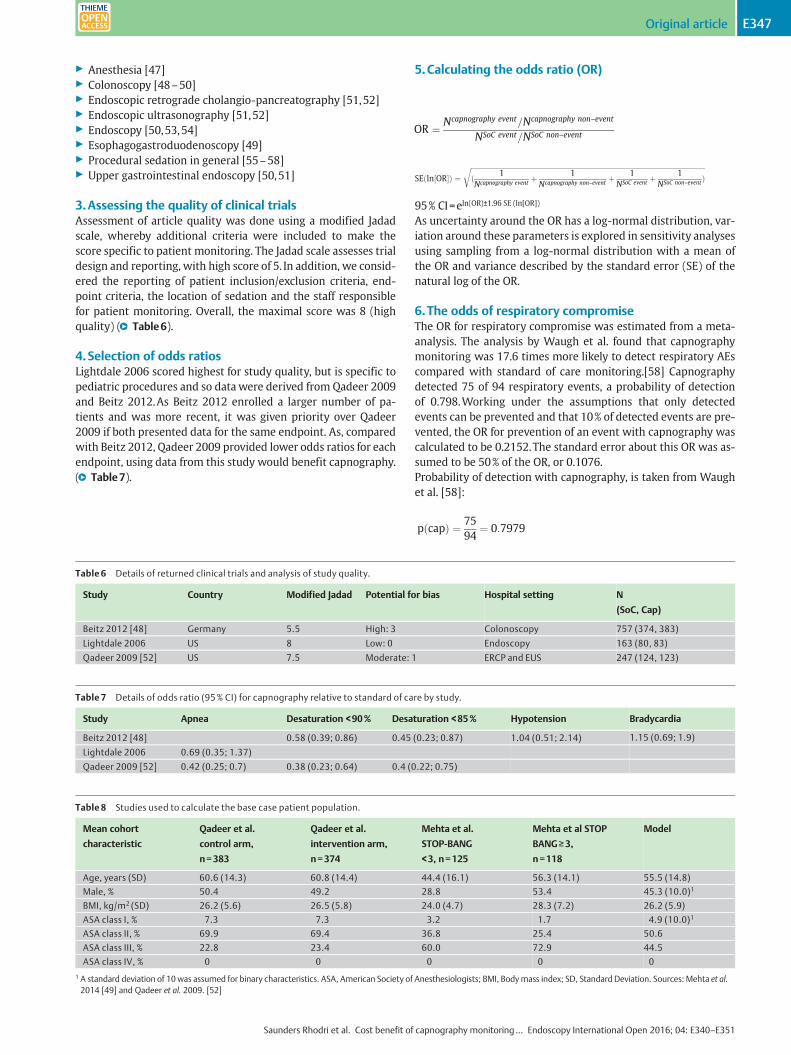
3.Assessing the quality of clinical trialsAssessment of article quality was done using a modified Jadadscale, whereby additional criteria were included to make thescore specific to patient monitoring. The Jadad scale assesses trialdesign and reporting, with high score of 5. In addition, we consid-ered the reporting of patient inclusion/exclusion criteria, end-point criteria, the location of sedation and the staff responsiblefor patient monitoring. Overall, the maximal score was 8 (highquality) (●" Table6).
4.Selection of odds ratiosLightdale 2006 scored highest for study quality, but is specific topediatric procedures and so data were derived from Qadeer 2009and Beitz 2012.As Beitz 2012 enrolled a larger number of pa-tients and was more recent, it was given priority over Qadeer2009 if both presented data for the same endpoint. As, comparedwith Beitz 2012, Qadeer 2009 provided lower odds ratios for eachendpoint, using data from this study would benefit capnography.(●" Table7).
5.Calculating the odds ratio (OR)
95% CI=eln(OR)±1.96 SE (ln[OR])
As uncertainty around the OR has a log‑normal distribution, var-iation around these parameters is explored in sensitivity analysesusing sampling from a log‑normal distribution with a mean ofthe OR and variance described by the standard error (SE) of thenatural log of the OR.
6.The odds of respiratory compromiseThe OR for respiratory compromise was estimated from a meta-analysis. The analysis by Waugh et al. found that capnographymonitoring was 17.6 times more likely to detect respiratory AEscompared with standard of care monitoring.[58] Capnographydetected 75 of 94 respiratory events, a probability of detectionof 0.798.Working under the assumptions that only detectedevents can be prevented and that 10% of detected events are pre-vented, the OR for prevention of an event with capnography wascalculated to be 0.2152.The standard error about this OR was as-sumed to be 50% of the OR, or 0.1076.Probability of detection with capnography, is taken from Waughet al. [58]:
Table 6 Details of returned clinical trials and analysis of study quality.
Study Country Modified Jadad Potential for bias Hospital setting N
(SoC, Cap)
Beitz 2012 [48] Germany 5.5 High: 3 Colonoscopy 757 (374, 383)
Lightdale 2006 US 8 Low: 0 Endoscopy 163 (80, 83)
Qadeer 2009 [52] US 7.5 Moderate: 1 ERCP and EUS 247 (124, 123)
Table 7 Details of odds ratio (95% CI) for capnography relative to standard of care by study.
Study Apnea Desaturation <90% Desaturation <85% Hypotension Bradycardia
Beitz 2012 [48] 0.58 (0.39; 0.86) 0.45 (0.23; 0.87) 1.04 (0.51; 2.14) 1.15 (0.69; 1.9)
Lightdale 2006 0.69 (0.35; 1.37)
Qadeer 2009 [52] 0.42 (0.25; 0.7) 0.38 (0.23; 0.64) 0.4 (0.22; 0.75)
Table 8 Studies used to calculate the base case patient population.
Mean cohort
characteristic
Qadeer et al.
control arm,
n=383
Qadeer et al.
intervention arm,
n=374
Mehta et al.
STOP‑BANG
<3, n=125
Mehta et al STOP
BANG≥3,
n=118
Model
Age, years (SD) 60.6 (14.3) 60.8 (14.4) 44.4 (16.1) 56.3 (14.1) 55.5 (14.8)
Male, % 50.4 49.2 28.8 53.4 45.3 (10.0)1
BMI, kg/m2 (SD) 26.2 (5.6) 26.5 (5.8) 24.0 (4.7) 28.3 (7.2) 26.2 (5.9)
ASA class I, % 7.3 7.3 3.2 1.7 4.9 (10.0)1
ASA class II, % 69.9 69.4 36.8 25.4 50.6
ASA class III, % 22.8 23.4 60.0 72.9 44.5
ASA class IV, % 0 0 0 0 0
1 A standard deviation of 10 was assumed for binary characteristics. ASA, American Society of Anesthesiologists; BMI, Bodymass index; SD, Standard Deviation. Sources: Mehta et al.2014 [49] and Qadeer et al. 2009. [52]
OR ¼ Ncapnography event=Ncapnography non–event
NSoC event=NSoC non–event
SEðln½OR�Þ ¼ffiffiffiffiffiffiffiffiffiffiffiffiffiffiffiffiffiffiffiffiffiffiffiffiffiffiffiffiffiffiffiffiffiffiffiffiffiffiffiffiffiffiffiffiffiffiffiffiffiffiffiffiffiffiffiffiffiffiffiffiffiffiffiffiffiffiffiffiffiffiffiffiffiffiffiffiffiffiffiffiffiffiffiffiffiffiffiffiffiffiffiffiffiffiffiffiffiffiffiffiffiffiffiffiffiffiffiffiffiffiffiffiffiffiffiffiffiffiffiffiffiffiffiffiffiffiffiffiffiffiffiffiffiffiffiffiffiffiffið 1Ncapnography event
þ 1Ncapnography non–event
þ 1NSoC event þ
1NSoC non–eventÞ
r
pðcapÞ ¼ 7594
¼ 0:7979
Saunders Rhodri et al. Cost benefit of capnography monitoring… Endoscopy International Open 2016; 04: E340–E351
Original article E347THIEME
OR for detection with capnography, OR(cap)=17.6, uses the ORpresented by from Waugh et al.[58] and uses the random effectsmodel.
OR for detection with SoC, OR(SoC)=e-ln OR(cap)=0.0568, conver-sion of the OR to standard of care (pulse oximetry only)
Probability of detection with SoC; pðSoCÞ ¼ ORðSoCÞð1=pðcapÞÞ � 1þ ORðSoCÞ ¼ 0:1832
Assume that 10% of detected events can be prevented:
Events prevented with capnography;pðPreventioncapÞ ¼ pðcapÞ100
� 10 ¼ 0:08
Events prevented with SoC;pðPreventionSoCÞ ¼ pðSoCÞ100
� 10 ¼ 0:02
Calculation of the OR for pulse oximetry plus capnography relative to standard of care:
OR of an event with capnography; OR ðEcapÞ ¼ e�ln ORðpreventioncapÞ ¼ 0:2152
The OR for an event with capnography did not vary considerablyif the assumption regarding the percentage of detected events a-voided was adjusted between 2% and 50%. Using 2% the OR was0.2268, whereas with an assumption of 50% the OR was 0.1519.
7.False positivesThe model accounts for interventions and time associated withfalse positive events. As these events are false positives, potentialinterventions were restricted to supplemental oxygen and air-way repositioning. In the clinical trial by Qadeer et al., 35 of the263 patients assessed with capnography erroneously presentedwith apnea.[52] The probability of pseudo apnea was thus0.1331. In the meta-analysis by Waugh et al., 71 false positiveand 157 true negative events were reported, giving a false posi-tive probability of 0.3114 with capnographymonitoring.[58] Thisstudy analyzed multiple definitions of respiratory compromise,the probability (0.3114) is thus assumed to include the probabil-ity of pseudo apnea (0.1331) and was adjusted to 0.1783 (0.3114−0.1331). Given the multiple AEs definitions included in thisstudy, the probability was assigned to airway obstruction.
8.Patient cohortThe mean cohort characteristics of the model population are de-rived from two US based studies [49,52] (●" Table8).
9.Combination of odds ratiosORs cannot be simply combined, and their combination assumestheir independence. In the model, ORs are combined via logtransformation. A worked example for calculating the OR for ad-verse events within the cohort follows:
where ORx is the OR associated with risk factor X (rfX), Cx is thecohort value for rfX, Rx is the reference value for rfX from the ori-ginating study, and Dx is the denominator for rfX, e.g. 2 if the ORis per increase of 2 in rfX. These factors combine to provide an es-timate of ORAE, the OR of having an adverse event. To convert thisvalue to an OR per adverse event, the log transformation of ORAE
is divided through by themean number of adverse events per pa-
tient. Taking the exponential of the results provides the OR foradverse events per adverse event in this cohort.
10.Dependency of dataData on risk factors linked to the likelihood of adverse eventswereoften taken from independent studies. It is assumed that thesedata can be combined as independent entities, i. e. that their con-stituent analyses do not overlap.For example, the risk of adverseevents associated with BMI is taken from the study by Wani et al.and the risk of adverse events associated with ASA class is takenfromEnestvedt et al.; the assumption is that there is noassociationbetween BMI and ASA class [59,60]. In the context of the proce-dure setting, risk is modulated by the monitoring operator andthe location of the procedure. Rather than assume independenceof these risk factors, the model allows for selection of a primaryrisk factor (which defaults to the operator) and provision of aweighting factor todescribe theproportionof risk fromparameterA that is covered by parameter B. The default weight is set to 0.6.
11.Moderate sedationFor moderate sedation, the model was informed by publicationsspecific to moderate sedation, where data were available. For allother items, data from the original model was retained. To modelmoderate sedation the following model parameters were upda-ted in line with the provided reference for moderate sedation:●" Table9
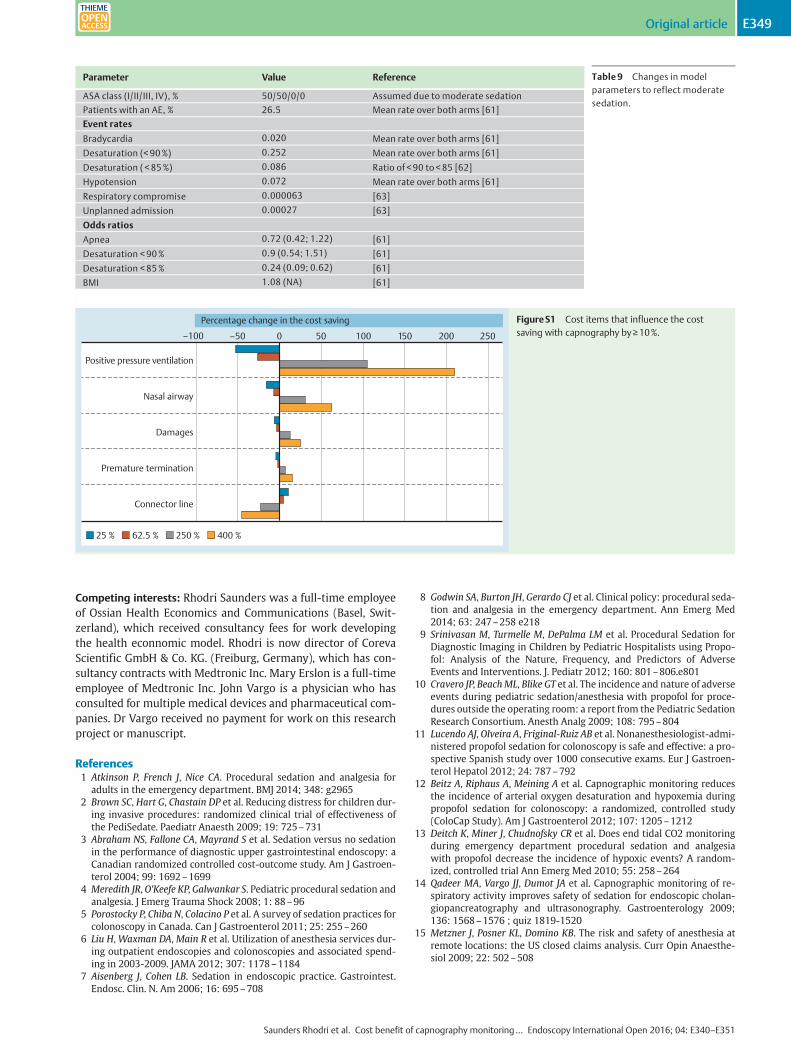
12.One-way sensitivity analysesOne-way sensitivity analyses were used to assess the impact ofchanges in unit costs on model outcomes. The majority of costitems have only a small influence on the cost differential betweenstandard of care monitoring and capnography monitoring. Itemsthat reduce the cost saving associatedwith capnography by>10%are increasing the cost of connector lines by a factor of 2.5 and re-ducing the cost of either positive pressure ventilation or nasalairway by a factor of 2.5 and 4, respectively (●" Fig.S1). The costdifferential would be increased by>10% through a reduction inthe cost of connector lines, and increase in the cost of positivepressure ventilation, nasal airway, premature termination, anddamages.
ORAE ¼ ePN
x¼1ln ORx�Cx�Rx
Dx
OR prevention with capnography;ORðPreventioncapÞ ¼ pðPreventioncapÞ=ð1� pðPreventioncapÞÞpðPreventionSoCÞ=ð1� pðPreventionSoCÞÞ
Saunders Rhodri et al. Cost benefit of capnography monitoring… Endoscopy International Open 2016; 04: E340–E351
Original articleE348THIEME
Competing interests: Rhodri Saunders was a full-time employeeof Ossian Health Economics and Communications (Basel, Swit-zerland), which received consultancy fees for work developingthe health econnomic model. Rhodri is now director of CorevaScientific GmbH & Co. KG. (Freiburg, Germany), which has con-sultancy contracts with Medtronic Inc. Mary Erslon is a full-timeemployee of Medtronic Inc. John Vargo is a physician who hasconsulted for multiple medical devices and pharmaceutical com-panies. Dr Vargo received no payment for work on this researchproject or manuscript.
References1 Atkinson P, French J, Nice CA. Procedural sedation and analgesia for
adults in the emergency department. BMJ 2014; 348: g29652 Brown SC, Hart G, Chastain DP et al. Reducing distress for children dur-
ing invasive procedures: randomized clinical trial of effectiveness ofthe PediSedate. Paediatr Anaesth 2009; 19: 725–731
3 Abraham NS, Fallone CA, Mayrand S et al. Sedation versus no sedationin the performance of diagnostic upper gastrointestinal endoscopy: aCanadian randomized controlled cost-outcome study. Am J Gastroen-terol 2004; 99: 1692–1699
4 Meredith JR,O'Keefe KP, Galwankar S. Pediatric procedural sedation andanalgesia. J Emerg Trauma Shock 2008; 1: 88–96
5 Porostocky P, Chiba N, Colacino P et al. A survey of sedation practices forcolonoscopy in Canada. Can J Gastroenterol 2011; 25: 255–260
6 Liu H,Waxman DA,Main R et al. Utilization of anesthesia services dur-ing outpatient endoscopies and colonoscopies and associated spend-ing in 2003-2009. JAMA 2012; 307: 1178–1184
7 Aisenberg J, Cohen LB. Sedation in endoscopic practice. Gastrointest.Endosc. Clin. N. Am 2006; 16: 695–708
8 Godwin SA, Burton JH, Gerardo CJ et al. Clinical policy: procedural seda-tion and analgesia in the emergency department. Ann Emerg Med2014; 63: 247–258 e218
9 Srinivasan M, Turmelle M, DePalma LM et al. Procedural Sedation forDiagnostic Imaging in Children by Pediatric Hospitalists using Propo-fol: Analysis of the Nature, Frequency, and Predictors of AdverseEvents and Interventions. J. Pediatr 2012; 160: 801–806.e801
10 Cravero JP, BeachML, Blike GT et al. The incidence and nature of adverseevents during pediatric sedation/anesthesia with propofol for proce-dures outside the operating room: a report from the Pediatric SedationResearch Consortium. Anesth Analg 2009; 108: 795–804
11 Lucendo AJ, Olveira A, Friginal-Ruiz AB et al. Nonanesthesiologist-admi-nistered propofol sedation for colonoscopy is safe and effective: a pro-spective Spanish study over 1000 consecutive exams. Eur J Gastroen-terol Hepatol 2012; 24: 787–792
12 Beitz A, Riphaus A, Meining A et al. Capnographic monitoring reducesthe incidence of arterial oxygen desaturation and hypoxemia duringpropofol sedation for colonoscopy: a randomized, controlled study(ColoCap Study). Am J Gastroenterol 2012; 107: 1205–1212
13 Deitch K, Miner J, Chudnofsky CR et al. Does end tidal CO2 monitoringduring emergency department procedural sedation and analgesiawith propofol decrease the incidence of hypoxic events? A random-ized, controlled trial Ann Emerg Med 2010; 55: 258–264
14 Qadeer MA, Vargo JJ, Dumot JA et al. Capnographic monitoring of re-spiratory activity improves safety of sedation for endoscopic cholan-giopancreatography and ultrasonography. Gastroenterology 2009;136: 1568–1576 ; quiz 1819-1520
15 Metzner J, Posner KL, Domino KB. The risk and safety of anesthesia atremote locations: the US closed claims analysis. Curr Opin Anaesthe-siol 2009; 22: 502–508
Table 9 Changes in modelparameters to reflect moderatesedation.
Parameter Value Reference
ASA class (I/II/III, IV), % 50/50/0/0 Assumed due to moderate sedation
Patients with an AE, % 26.5 Mean rate over both arms [61]
Event rates
Bradycardia 0.020 Mean rate over both arms [61]
Desaturation (< 90%) 0.252 Mean rate over both arms [61]
Desaturation ( < 85%) 0.086 Ratio of < 90 to < 85 [62]
Hypotension 0.072 Mean rate over both arms [61]
Respiratory compromise 0.000063 [63]
Unplanned admission 0.00027 [63]
Odds ratios
Apnea 0.72 (0.42; 1.22) [61]
Desaturation < 90% 0.9 (0.54; 1.51) [61]
Desaturation < 85% 0.24 (0.09; 0.62) [61]
BMI 1.08 (NA) [61]
Positive pressure ventilation
Nasal airway
Damages
Premature termination
Connector line
25 %
–100 –50 0
Percentage change in the cost saving
50 100 150 200 250
62.5 % 250 % 400 %
FigureS1 Cost items that influence the costsaving with capnography by≥10%.
Saunders Rhodri et al. Cost benefit of capnography monitoring… Endoscopy International Open 2016; 04: E340–E351
Original article E349THIEME
16 Robbertze R, Posner KL, Domino KB. Closed claims review of anesthesiafor procedures outside the operating room. Curr Opin Anaesthesiol2006; 19: 436–442
17 Bhananker SM, Posner KL, Cheney FW et al. Injury and liability associat-ed with monitored anesthesia care: a closed claims analysis. Anesthe-siology 2006; 104: 228–234
18 Lightdale JR, Goldmann DA, Feldman HA et al. Microstream capnogra-phy improves patient monitoring during moderate sedation: a ran-domized, controlled trial. Pediatrics 2006; 117: e1170–e1178
19 Adams L, Butas S, Spurlock DJr. Capnography (ETCO2), respiratory de-pression, and nursing interventions in moderately sedated adults un-dergoing transesophageal echocardiography (TEE). J Perianesth Nurs2015; 30: 14–22
20 Langhan ML, Shabanova V, Li FY et al. A randomized controlled trial ofcapnography during sedation in a pediatric emergency setting. Am JEmerg Med 2015; 33: 25–30
21 American Society for Gastrointestinal Endoscopy. American College ofGastroenterology. Association TAG. Universal adoption of capnographyfor moderate sedation in adults undergoing upper endoscopy and co-lonoscopy has not been shown to improve patient safety or clinicaloutcomes and significantly increases costs for moderate sedation.2012
22 Weaver J. The latest ASA mandate: CO(2) monitoring for moderate anddeep sedation. Anesth Prog 2011; 58: 111–112
23 Friedrich-Rust M, Welte M, Welte C et al. Capnographic monitoring ofpropofol-based sedation during colonoscopy. Endoscopy 2014; 46:236–244
24 Walsh BK, Crotwell DN, Restrepo RD. Capnography/Capnometry duringmechanical ventilation: 2011. Respir Care 2011; 56: 503–509
25 Caro JJ, Briggs AH, Siebert U et al. Modeling good research practices–overview: a report of the ISPOR-SMDMModeling Good Research Prac-tices Task Force–1. Value Health 2012; 15: 796–803
26 Scheuermeyer FX, Andolfatto G, Qian H et al. Does the sedation regimenaffect adverse events during procedural sedation and analgesia in in-jection drug users? CJEM 2013; 15: 279–288
27 Mehta PP, Kochhar G, Kalra S et al. Can a validated sleep apnea scoringsystem predict cardiopulmonary events using propofol sedation forroutine EGD or colonoscopy? A prospective cohort study GastrointestEndosc 2014; 79: 436–444
28 Wani S, Azar R, Hovis CE et al. Obesity as a risk factor for sedation-relat-ed complications during propofol-mediated sedation for advancedendoscopic procedures. Gastrointest Endosc 2011; 74: 1238–1247
29 Enestvedt BK, Eisen GM, Holub J et al. Is the American Society of Anes-thesiologists classification useful in risk stratification for endoscopicprocedures? Gastrointest Endosc 2013; 77: 464–471
30 Waugh JB, Epps CA, Khodneva YA. Capnography enhances surveillanceof respiratory events during procedural sedation: a meta-analysis. JClin Anesth 2011; 23: 189–196
31 Statistics USBoL. Consumer price index – all urban consumers. In. se-ries ID: CUUR0000SA0 ed. Postal Square Building, 2 MassachusettsAvenue, NE Washington, DC 20212-0001. U.S. Bureau of Labor Statis-tics; 2015
32 Couloures KG, Beach M, Cravero JP et al. Impact of provider specialty onpediatric procedural sedation complication rates. Pediatrics 2011;127: e1154–e1160
33 Ferguson K, Young J, Panagopoulos P et al. Anesthesia Related ClosedClaims and Litigations at the Detroit Medical Center: Analysis, LessonsLearned, and Conclusions. Open J Anesthesiol 2014; 4: 88–98
34 Maglinte DD, Applegate KE, Rajesh A et al. Conscious sedation for pa-tients undergoing enteroclysis: comparing the safety and patient-re-ported effectiveness of two protocols. Eur J Radiol 2009; 70: 512–516
35 Mehta P, Kochhar G, Albeldawi M et al. Capnographic Monitoring DoesNot Improve Detection of Hypoxemia in Colonoscopy With ModerateSedation: A Randomized, Controlled Trial. Am J Gastroenterol 2014;109: S588
36 Sharma VK, Nguyen CC, Crowell MD et al. A national study of cardiopul-monary unplanned events after GI endoscopy. Gastrointest Endosc2007; 66: 27–34
37 Finn JP. Sedation in MR Imaging: What Price Safety? Radiology 2000;216: 633–634
38 Garcia RT, Cello JP, Nguyen MH et al. Unsedated ultrathin EGD is wellaccepted when compared with conventional sedated EGD: a multicen-ter randomized trial. Gastroenterology 2003; 125: 1606–1612
39 Dunham CM, Hileman BM, Hutchinson AE et al. Perioperative hypoxe-mia is common with horizontal positioning during general anesthesiaand is associated with major adverse outcomes: a retrospective studyof consecutive patients. BMC Anesthesiol 2014; 14: 43
40 Green SM, Krauss B. Pulmonary aspiration risk during emergency de-partment procedural sedation–an examination of the role of fastingand sedation depth. Acad Emerg Med 2002; 9: 35–42
41 Wehrmann T, Riphaus A. Sedation with propofol for interventionalendoscopic procedures: a risk factor analysis. Scand. J. Gastroenterol2008; 43: 368–374
42 Rex DK, Heuss LT, Walker JA et al. Trained registered nurses/endoscopyteams can administer propofol safely for endoscopy. Gastroenterology2005; 129: 1384–1391
43 Jensen JT, Vilmann P,Horsted T et al. Nurse-administered propofol seda-tion for endoscopy: a risk analysis during an implementation phase.Endoscopy 2011; 43: 716–722
44 Vargo JJ. Procedural sedation. Curr Opin Gastroenterol 2010; 26: 421–424
45 Bhatt M, Kennedy RM, Osmond MH et al. Consensus-based recommen-dations for standardizing terminology and reporting adverse eventsfor emergency department procedural sedation and analgesia in chil-dren. Ann Emerg Med 2009; 53: 426–435 e424
46 Melendez E, Bachur R. Serious adverse events during procedural seda-tion with ketamine. Pediatr Emerg Care 2009; 25: 325–328
Supplementary References
47 Ferguson K, Young J, Panagopoulos P et al. Anesthesia Related ClosedClaims and Litigations at the Detroit Medical Center: Analysis, LessonsLearned, and Conclusions. Open J Anesthesiol 2014; 4: 88–98
48 Beitz A, Riphaus A, Meining A et al. Capnographic monitoring reducesthe incidence of arterial oxygen desaturation and hypoxemia duringpropofol sedation for colonoscopy: a randomized, controlled study(ColoCap Study). Am J Gastroenterol 2012; 107: 1205–1212
49 Mehta PP, Kochhar G, Kalra S et al. Can a validated sleep apnea scoringsystem predict cardiopulmonary events using propofol sedation forroutine EGD or colonoscopy? A prospective cohort study GastrointestEndosc 2014; 79: 436–444
50 Vargo JJ. Procedural sedation. Curr Opin Gastroenterol 2010; 26: 421–424
51 Wehrmann T, Riphaus A. Sedation with propofol for interventionalendoscopic procedures: a risk factor analysis. Scand. J. Gastroenterol2008; 43: 368–374
52 Qadeer MA, Vargo JJ, Dumot JA et al. Capnographic monitoring of re-spiratory activity improves safety of sedation for endoscopic cholan-giopancreatography and ultrasonography. Gastroenterology 2009;136: 1568–1576 ; quiz 1819-1520
53 Rex DK, Heuss LT, Walker JA et al. Trained registered nurses/endoscopyteams can administer propofol safely for endoscopy. Gastroenterology2005; 129: 1384–1391
54 Jensen JT, Vilmann P,Horsted T et al. Nurse-administered propofol seda-tion for endoscopy: a risk analysis during an implementation phase.Endoscopy 2011; 43: 716–722
55 Green SM, Krauss B. Pulmonary aspiration risk during emergency de-partment procedural sedation–an examination of the role of fastingand sedation depth. Acad Emerg Med 2002; 9: 35–42
56 Srinivasan M, Turmelle M, DePalma LM et al. Procedural Sedation forDiagnostic Imaging in Children by Pediatric Hospitalists using Propo-fol: Analysis of the Nature, Frequency, and Predictors of AdverseEvents and Interventions. J Pediatr 2012; 160: 801–806.e801
57 Couloures KG, Beach M, Cravero JP et al. Impact of provider specialty onpediatric procedural sedation complication rates. Pediatrics 2011;127: e1154–e1160
58 Waugh JB, Epps CA, Khodneva YA. Capnography enhances surveillanceof respiratory events during procedural sedation: a meta-analysis. JClin Anesth 2011; 23: 189–196
59 Wani S, Azar R, Hovis CE et al. Obesity as a risk factor for sedation-relat-ed complications during propofol-mediated sedation for advancedendoscopic procedures. Gastrointest Endosc 2011; 74: 1238–1247
60 Enestvedt BK, Eisen GM, Holub J et al. Is the American Society of Anes-thesiologists classification useful in risk stratification for endoscopicprocedures? Gastrointest Endosc 2013; 77: 464–471
Saunders Rhodri et al. Cost benefit of capnography monitoring… Endoscopy International Open 2016; 04: E340–E351
Original articleE350THIEME

61 Maglinte DD, Applegate KE, Rajesh A et al. Conscious sedation for pa-tients undergoing enteroclysis: comparing the safety and patient-re-ported effectiveness of two protocols. Eur J Radiol 2009; 70: 512–516
62 Mehta P, Kochhar G, Albeldawi M et al. Capnographic Monitoring DoesNot Improve Detection Of Hypoxemia In Colonoscopy With ModerateSedation. A Randomized, Controlled Trial American College of Gastro-
enterology 2014 Annual Scientific Meeting Philadelphia, PA, USA:2014
63 Sharma VK, Nguyen CC, Crowell MD et al. A national study of cardiopul-monary unplanned events after GI endoscopy. Gastrointest Endosc2007; 66: 27–34
Saunders Rhodri et al. Cost benefit of capnography monitoring… Endoscopy International Open 2016; 04: E340–E351
Original article E351THIEME