modeling the covid-19 effects on the austrian economy and
TRANSCRIPT

FINANCIAL STABILITY REPORT 40 – NOVEMBER 2020 63
Modeling the COVID-19 effects on the Austrian economy and banking system
Martin Guth, Christian Lipp, Claus Puhr, Martin Schneider1
Refereed by: Leopold Sögner, Institute for Advanced Studies (IHS)
In response to the COVID-19 pandemic, many governments around the globe have imposed strict containment measures to prevent the further spreading of the virus. While saving lives, such lockdowns have also led to the largest peacetime economic shock since the Great Depression of the 1930s. To lessen the blow, governments have been complementing containment measures with mitigating measures. The latter serve to cushion both companies’ and households’ loss of revenue and income suffered during lockdowns, when nonessential economic activity has been suspended or cut to a minimum. In this paper, we only consider mitigating measures addressed to incorporated firms and banks.
To assess the vulnerabilities of the Austrian economy and banking system, we follow a two-step approach. First, we have developed a novel model to assess the impact of both containment and mitigating measures on the real economy. This approach combines firm-level micro data from two different databases. To close remaining data gaps, we employ a Monte Carlo simulation to assess the effects of two scenarios based on the current OeNB economic forecast for Austria. We combine these scenarios capturing various policy reactions, i.e. mitigating measures, with firms’ solvency and liquidity positions and ultimately derive sectoral insolvency rates.
Second, we use the OeNB’s top-down stress testing framework ARNIE to assess the COVID-19 impact on the banking system. Rather than employing large-scale regression models to derive risk parameters for credit risk, we infer default probabilities of banks’ credit exposure from the Austrian insolvency rates described above. Then, we extrapolate insolvency rates for domestic retail exposures and nondomestic exposures of the Austrian banking system. Here, we assume that individual industry sectors face similar challenges across countries and that country-specific GDP forecasts reflect the overall severity with which individual countries are affected by the pandemic. To this end, we draw on GDP forecasts by the ECB for countries other than Austria as well as country aggregates to calculate scaling factors based on the relative GDP-level deviation.
We find that the mitigating measures up to end-August 2020, while effective, only partly offset the COVID-19-induced shock to Austrian firms and banks. They do, however, play an important role in lowering insolvency rates both on aggregate and in the hardest-hit sectors. As a side effect, the mitigating measures taken by the Austrian government and other institutions help improve the outlook for the Austrian banking system, which may benefit indirectly. Moreover, the top-down solvency stress test results show that the Austrian banking system – not only on an aggregate, but also on a disaggregate level – remains well capitalized despite the expected increase in insolvencies. At the time of publication, both COVID-19 containment and mitigating measures will have been extended, which calls into question some of the results of the paper. However, the main conclusion will nevertheless hold: only a substantial further deterioration of the COVID-19 pandemic could put the banking system in a difficult position.
JEL classification: C54, G21, G33Keywords: COVID-19, corporate insolvency, bank stress testing, quantitative policy modeling
1 Oesterreichische Nationalbank, Supervision Policy, Regulation and Strategy Division, [email protected], [email protected], [email protected]; Economic Analysis Division, [email protected]. Opinions expressed by the authors of studies do not necessarily reflect the official viewpoint of the OeNB or the Eurosystem. The authors would like to thank Gerhard Fenz, Dieter Huber, Michael Kaden, Doris Oswald, Doris Prammer, Christoph Prenner, Christian Ragacs, Ralph Spitzer, Alfred Stiglbauer, Klaus Vondra and Elisabeth Woschnagg (all OeNB) for helpful comments and valuable support.

Modeling the COVID-19 effects on the Austrian economy and banking system
64 OESTERREICHISCHE NATIONALBANK
2020 has shown us that it takes new approaches to gauge the impact of COVID-19 on both the real economy and the banking sector as well as to evaluate the effectiveness of measures taken by governments to cushion the blow of this unique situation. With the OeNB’s Economic Analysis and Research Department joining forces with the Supervision Policy, Regulation and Strategy Division, we have developed a new corporate insolvency model based on simulated firm-level balance sheet, profit and loss as well as cash flow data to determine sectoral insolvency rates for Austrian firms (Puhr and Schneider, 2021). Judging from the comparable literature, we are among the first to develop such a model. Based on firm-level data, some recent studies look at firms’ liquidity position amid the COVID-19 pandemic (see Blanco et al., 2020; Guerini et al., 2020; OECD, 2020; De Vito and Gomez, 2020). Compared with these studies, our approach to firm-level data is significantly more parsimonious, but we still model mitigating measures at a very granular level.
The output of our insolvency model, which we calibrated based on current eco-nomic forecasts, feeds into ARNIE, the OeNB’s top-down stress testing model (Feldkircher et al., 2013). We investigate the effect of both the containment and the mitigating measures on banks’ balance sheets and ultimately on their capitalization as a measure of their risk-bearing capacity. With the ultimate COVID-19 outcome still fraught with uncertainty, we do not rely on a single scenario to investigate the impact. Instead, we implement escalating scenarios, based on differing assumptions about the duration of the containment measures and on whether mitigating measures are in place. This way, we arrive at four scenarios that help us identify possible tipping points in both the Austrian economy and banking system.
While many other central banks2 have conducted exercises with a similar aim, to our knowledge, the OeNB is the first central bank to link its stress testing
2 A case in point is the ECB’s vulnerability assessment, which replaced the postponed EU-wide 2020 stress testing exercise (ECB, 2020b).
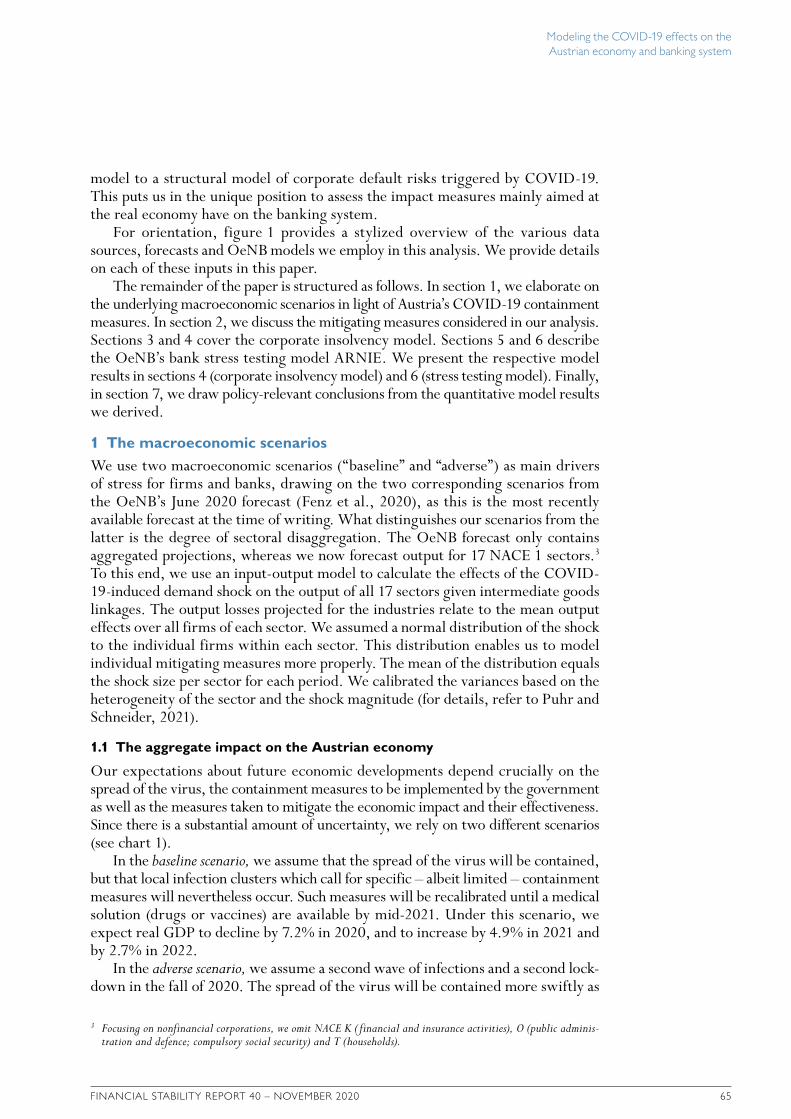
Stylized overview of model interaction
Figure 1
Source: Authors’ compilation.
Note: IR stands for insolvency rate, and PD for probability of default.
AQM(Austrian Quarterly Model)
input / output model
macro scenarios
sectoraldemandshocks
Monte Carlo simulation
corporate insolvency model
firm-leveldata
sectoralinsolvency
rates
linking equations(∆ AT IRs ∆ global PDs)
ARNIE(stress testing model)
(micro)risk factorscenarios
bank-specificcapitalimpact
externalforecast(ECB)
firmreporting
data
bankreporting
data
mitigatingmeasures
Modeling the COVID-19 effects on the Austrian economy and banking system
FINANCIAL STABILITY REPORT 40 – NOVEMBER 2020 65
model to a structural model of corporate default risks triggered by COVID-19. This puts us in the unique position to assess the impact measures mainly aimed at the real economy have on the banking system.
For orientation, figure 1 provides a stylized overview of the various data sources, forecasts and OeNB models we employ in this analysis. We provide details on each of these inputs in this paper.
The remainder of the paper is structured as follows. In section 1, we elaborate on the underlying macroeconomic scenarios in light of Austria’s COVID-19 containment measures. In section 2, we discuss the mitigating measures considered in our analysis. Sections 3 and 4 cover the corporate insolvency model. Sections 5 and 6 describe the OeNB’s bank stress testing model ARNIE. We present the respective model results in sections 4 (corporate insolvency model) and 6 (stress testing model). Finally, in section 7, we draw policy-relevant conclusions from the quantitative model results we derived.
1 The macroeconomic scenariosWe use two macroeconomic scenarios (“baseline” and “adverse”) as main drivers of stress for firms and banks, drawing on the two corresponding scenarios from the OeNB’s June 2020 forecast (Fenz et al., 2020), as this is the most recently available forecast at the time of writing. What distinguishes our scenarios from the latter is the degree of sectoral disaggregation. The OeNB forecast only contains aggregated projections, whereas we now forecast output for 17 NACE 1 sectors.3 To this end, we use an input-output model to calculate the effects of the COVID-19-induced demand shock on the output of all 17 sectors given intermediate goods linkages. The output losses projected for the industries relate to the mean output effects over all firms of each sector. We assumed a normal distribution of the shock to the individual firms within each sector. This distribution enables us to model individual mitigating measures more properly. The mean of the distribution equals the shock size per sector for each period. We calibrated the variances based on the heterogeneity of the sector and the shock magnitude (for details, refer to Puhr and Schneider, 2021).
1.1 The aggregate impact on the Austrian economy
Our expectations about future economic developments depend crucially on the spread of the virus, the containment measures to be implemented by the government as well as the measures taken to mitigate the economic impact and their effectiveness. Since there is a substantial amount of uncertainty, we rely on two different scenarios (see chart 1).
In the baseline scenario, we assume that the spread of the virus will be contained, but that local infection clusters which call for specific – albeit limited – containment measures will nevertheless occur. Such measures will be recalibrated until a medical solution (drugs or vaccines) are available by mid-2021. Under this scenario, we expect real GDP to decline by 7.2% in 2020, and to increase by 4.9% in 2021 and by 2.7% in 2022.
In the adverse scenario, we assume a second wave of infections and a second lock-down in the fall of 2020. The spread of the virus will be contained more swiftly as
3 Focusing on nonfinancial corporations, we omit NACE K ( financial and insurance activities), O (public adminis-tration and defence; compulsory social security) and T (households).

Modeling the COVID-19 effects on the Austrian economy and banking system
66 OESTERREICHISCHE NATIONALBANK
a result of the lessons learned during the first peak of infections. Hence, the second lockdown is expected to last for only three weeks before being gradually lifted over another three weeks. No additional mitigating measures compared to the baseline are included in this scenario, which contributes substantially to the scenario’s impact. As to a medical solution, we stick to the same assumption as in the baseline scenario. GDP is projected to contract by 9.2% in 2020, which exceeds the drop in the baseline scenario by 2 percentage points. This difference is mainly attributable to a decrease in the fourth quarter of 2020. Given a greater negative carryover, GDP growth in 2021 (+3.5%) will likewise trail that in the baseline scenario. In 2022, GDP growth under the adverse scenario (+3.4%) will, however, exceed growth in the baseline scenario due to higher backlog demand.
Chart 1 shows the absolute decline in corporate turnover under both scenarios (left panel) and the relative size of the second wave lockdown impact on turnover compared with the initial lockdown during the first wave (right panel).
1.2 The sectoral impact on the Austrian economy
The disaggregated results for the NACE-1-digit sectors can be found in table 1. We transformed the impact from growth rates to deviations from pre-pandemic trends4 to calculate the impact of COVID-19 relative to a scenario without COVID-19. In both scenarios, the same two sectors clearly stand out. Relative to the pre-pandemic trend in 2020, arts, entertainment and recreation (NACE R) is expected to suffer output losses of 46% (baseline) and 53% (adverse), respectively. For accommodation
4 The prepandemic trend was calculated as the average growth rate for the years 2017–2019.
EUR billion
Corporate turnover, 2020–2022
100
98
96
94
92
90
88
86
84
82
80
Maximum turnover loss during lockdowns in %
Turnover loss, Q1 2020–Q4 2021
110
100
90
80
70
60
50
40
30
20
10
0
Aggregate corporate turnover under the baseline and adverse scenarios
Chart 1
Source: Authors’ calculations.
For reference: OeNB forecast (Dec. 2019)Baseline scenario: OeNB forecast ( June 2020)Adverse scenario: OeNB forecast ( June 2020, adverse sensitivity)
2019 2020 2021 2022 Mar. 20 June 20 Sep. 20 Dec. 20 Mar. 21 June 21 Sep. 21

Modeling the COVID-19 effects on the Austrian economy and banking system
FINANCIAL STABILITY REPORT 40 – NOVEMBER 2020 67
and food service activities (NACE I), these figures are expected to amount to 43% (baseline) and 50% (adverse), respectively.
1.3 Assumptions for economies other than Austria
To calculate credit risk for the banking system assessment (see subsection 5.3), we require not only baseline and adverse macroeconomic scenarios for Austria, but also scenarios for all countries (or groups of countries) where Austrian banks provide credit to customers. To this end, we use the Eurosystem staff macroeconomic projections (ECB, 2020a), which are consistent with both the OeNB’s forecast for Austria and the scenarios of the ECB’s vulnerability analysis (ECB, 2020b).
2 Mitigating measuresMitigating measures serve to cushion the loss of revenue and income suffered by companies and households in the wake of COVID-19 containment measures. They are meant to minimize the damage resulting from the temporary reduction in economic activity. In our analysis, we only investigate measures targeting companies and banks. Such mitigating measures include fiscal measures adopted by the Austrian government and other legislative measures as well as nonlegislative initiatives, such as private bank moratoria. In addition, we account for mitigating measures implemented for banks by euro area supervisors and EU regulators. We use August 31, 2020, as the cutoff date for all mitigating measures. In this section, we cluster the measures by their mechanics and briefly describe each measure.5
5 For a more detailed description of individual measures and how they feed into the corporate insolvency model, see Puhr and Schneider (2021).
Table 1
Sectoral output losses in the baseline and adverse scenarios
Baseline scenario Adverse scenario
2020 2021 2022 2020 2021 2022
Deviation from pre-crisis trend in %
Total –9.7 –7.2 –5.6 –11.7 –10.2 –7.3 Agriculture, forestry and fishing (A) –3.3 –4.5 –2.9 –4.0 –6.3 –3.8 Mining and quarrying (B) –7.0 –7.3 –6.6 –8.8 –10.1 –8.6 Manufacturing (C) –12.0 –10.5 –8.9 –14.6 –14.6 –11.6 Electricity, gas, steam and air conditioning supply (D) –9.2 –8.3 –7.0 –11.4 –11.7 –9.1 Water supply and sewerage (E) –6.7 –6.2 –5.3 –8.3 –8.7 –6.9 Construction (F) –7.4 –8.3 –7.2 –9.6 –11.5 –9.3 Trade (G) –11.7 –8.2 –6.3 –14.0 –11.6 –8.2 Transportation and storage (H) –8.8 –6.2 –5.3 –10.5 –8.7 –6.9 Accommodation and food services (I) –43.1 –14.9 –7.1 –49.9 –21.5 –9.2 Information and communication (J) –7.5 –4.8 –3.7 –9.0 –6.8 –4.8 Real estate (L) –4.9 –6.3 –5.4 –6.4 –8.8 –7.0 Professional, scientific and technical services (M) –9.2 –7.1 –6.0 –11.2 –10.0 –7.8 Administrative and support services (N) –7.5 –5.5 –4.1 –9.2 –7.7 –5.4 Education (P) –0.2 –2.6 –2.4 –0.7 –3.7 –3.1 Human health and social work activities (Q) –1.6 –3.6 –3.0 –2.4 –5.1 –3.9 Arts, entertainment and recreation (R) –45.6 –16.8 –8.3 –53.0 –24.2 –10.9 Other service activities (S) –10.6 –10.2 –7.0 –13.7 –14.3 –9.1
Source: Authors’ calculations.

Modeling the COVID-19 effects on the Austrian economy and banking system
68 OESTERREICHISCHE NATIONALBANK
2.1 Capital injections via grants and subsidiesFinancing of fixed costs for particularly hard-hit industries6
With the initial funding guidelines for grants for fixed costs (Fixkostenzuschuss- Richtlinie – FKZ) and their extension (FKZ II), the Austrian government introduced a grant to cover operating costs. Such grants are awarded to companies having suffered a loss in sales of at least 40% (FKZ) or 30% (FKZ II). The overall volume of this measure amounts to EUR 12 billion. In our insolvency model, all eligible firms apply for this grant, which yields a total payout of EUR 11 billion.
COVID-19 short-time work7
The COVID-19 short-time work allowance is a modification of an instrument that was already used during the financial crisis. It was initially designed for a duration of three months and an option to extend it by another three months. In July, the Austrian government extended the short-time work scheme by six months until the end of March 2021. Under this scheme, employees receive income support amounting to between 80% and 90% of their previous net wage or salary. The amount depends on their original net wage or salary and is capped at the maximum contribution basis for social security. In our insolvency model, the number of firms applying for short-time work is calibrated in line with publicly available reporting data, which again yields a total payout of EUR 11 billion.
Sector-specific measures8
The support package for hospitality venues such as restaurants (“Wirtshauspaket”), which amounts to EUR 500 million, combines tax relief with measures aimed at stimulating demand. The emergency aid for the tourism sector includes bridge financing of up to EUR 100 million for domestic tourism. The overall volume of support measures comes to EUR 600 million. In our insolvency model, support is distributed equally across all firms of the sector (NACE I).
2.2 Long-term payment deferralCredit guarantees9
The Austrian government introduced several measures to provide support by guaranteeing new loans. Note that the new framework was put on top of existing structures and their guarantee products. The overall volume of earmarked guarantees
6 Fixed cost support is based on Article 3b para 3 of the Act establishing a government-owned holding company for wind-down purposes (Bundesgesetz über die Einrichtung einer Abbaubeteiligungsaktiengesellschaft des Bundes – ABBAG; Federal Law Gazette I No. 12/2020), and two guidelines, namely guidelines for grants for fixed costs (phase 1) (Fixkostenzuschuss-Richtlinie, Federal Law Gazette II No. 225/2020) and guidelines for grants for fixed costs (phase 2) (pending approval by the European Commission).
7 Short-time work is based on Article 37b Public Employment Service Act (Arbeitsmarktservicegesetzt – AMSG; Federal Law Gazette I No. 71/2020).
8 The measures supporting restaurants are mainly based on a temporary tax relief granted pursuant to Article 28 para 52 VAT Act 1994 (Federal Law Gazette I No. 60/2020).
9 Credit guarantees are based on three different laws and extended by COFAG, the Austrian COVID-19 financing agency, pursuant to Article 6a para 2 of the Act establishing a government-owned holding company for wind-down purposes (Bundesgesetz über die Einrichtung einer Abbaubeteiligungsaktiengesellschaft des Bundes – ABBAG; Federal Law Gazette I No. 12/2020); austria wirtschaftsservice (aws), a state-owned bank providing funding for Austrian companies, pursuant to Article 1 para 2a Guarantee Act 1977 (Federal Law Gazette I No. 23/2020); the Austrian Hotel and Tourism Bank ÖHT and aws, pursuant to Article 7 para 2a SME Promotion Act (Federal Law Gazette I No. 16/2020).

Modeling the COVID-19 effects on the Austrian economy and banking system
FINANCIAL STABILITY REPORT 40 – NOVEMBER 2020 69
amounts to EUR 15 billion. By end-August 2020, Austrian companies had drawn roughly EUR 6 billion of this amount according to data reported to the OeNB (EBA, 2020b).
Debt moratoria10
While the Austrian government also introduced a public, i.e. legislative, moratorium on bank debt, eligibility restrictions mostly exclude incorporated firms. However, a private, i.e. nonlegislative, sector-wide debt moratorium (EBA, 2020a) peaked at EUR 14 billion (of affected credit volume) in June 2020, according to data reported to the OeNB (EBA, 2020b).
2.3 Short-term payment deferral
The Austrian government agreed on a tax relief package that contains various measures, including a reduction of 2020 corporate tax advance payments to zero, and a deferral of social security contributions. Since we focus on firms that suffer losses and hence face bankruptcy risk, we do not consider the former measure in our model. The deferral of social security contributions, by contrast, has a significant short-term impact, as all eligible firms apply for the maximum deferral period, i.e. until the third quarter of 2021. In conjuncture with subsection 2.4, this measure enters the model as “filing moratorium.”11
2.4 Changes to the insolvency regime
The Austrian government also introduced a temporary change to the Austrian insolvency law. From April to October 2020, overindebtedness was suspended as a basis to open insolvency procedures.12 In addition, tax authorities and public health providers agreed to suspend bankruptcy filings from March to May 2020.
2.5 Changes to banks’ accounting and supervisory rules
The EU put in place amendments to the Capital Requirements Regulation (CRR) and the revised Capital Requirements Regulation (CRR2) or CRR “quick fix.”13 Its intention to mitigate the impact of the COVID-19 pandemic is rooted in the argument that this helps provide incentives for banks to continue lending to both businesses and consumers. The amendments became effective ahead of banks’ mid-2020 reporting date (end-June).
3 The corporate insolvency modelFigure 2 shows a stylized version of the corporate insolvency model. For each firm, the model considers that firm’s profit and loss statement, its cash flow statement, and its balance sheet. We evaluate on a monthly basis whether firms meet a specific threshold for both solvency and liquidity. A firm becomes insolvent if it falls below either one of these thresholds. This section explains the model in more detail.14
10 The legislative debt moratorium is based on Article 2 2nd COVID-19 Act (Federal Law Gazette I No. 58/2020), the nonlegislative sector-wide debt moratorium is based on EBA (2020a).
11 Refer to Puhr and Schneider (2021) for the detailed mechanics of the implementation.12 The insolvency moratorium is based on Article 9 2nd COVID-19 Act (Federal Law Gazette I No. 58/2020).13 The CRR “quick fix” is based on EU Regulation 2020/873 (OJ L 204/4).14 For an in-depth description of the model, see Puhr and Schneider (2021).

Modeling the COVID-19 effects on the Austrian economy and banking system
70 OESTERREICHISCHE NATIONALBANK
3.1 StructureProfit and loss statementA turnover shock in period t derived from a macroeconomic scenario stresses firms’ income, which can only be partly offset by the firms’ reducing their expenses. Income and expense positions at time t are calculated as changes versus the starting value t0. This yields a new pre-tax profit, which is booked against equity (from t–1).
Cash flow statement
We derive the operating cash flow of each firm based on the indirect method, which uses pre-tax profit as a starting point, and adjust it for all noncash transactions. We exclude any structural changes of the balance sheet. These simple accounting identities yield the net cash flow from operating activities. For the cash flow impact of financing activities, we solely focus on refinancing bank debt. Any given firm with an equity ratio above zero will be able to refinance its current bank debt, i.e. maturing bank debt and installments. Firms with an equity ratio of zero or less, however, will not be able to do so. Finally, we assume that the debt profile of firms is stable over time, i.e. current bank debt as reported for the first year is the same in the second and third year. For the cash flow impact of investment activities, we take an even more restrictive approach. In line with the static balance sheet assumption, we assume that firms do not invest. There is one important exception: firms with a negative cash flow can divest. Additional cash flows from divestment leave us with the cash flow after investments, which is used to update the cash and bank position in each firm’s balance sheet.
Balance sheet
Broadly speaking, we model three categories of assets and liabilities: first, the buffers against insolvency, i.e. an aggregate liquidity position (cash and bank) on the asset side and an equity position on the liability side (equity). Second, we include current assets and liabilities, broken down into three subcategories to model firms’ cash
Stylized overview of the insolvency model without mitigating measures
Figure 2
Source: Authors’ compilation.
Note: CF stands for cash flow, and o.w. for of which.
Income(t0)
Cash & bank(t–1)+CF(t)
Profit and loss statement (t)
Current assets(t–1) – X Current liabilities(t–1)+α Y
Other assets(t0)
Balance sheet (t)
Shock toturnover
Check forinsolvency
.
indirect method:profit / loss after tax– capitalized production + depreciation + tax
– ∆ Income(t)
Expenses(t0)
– ∆ Expenses(t)
Other liabilities(t0)+(1–α) Y
if cash & bank(t) < –10%
ORif equity(t) < –30%
o.w. bank debt(t–1)+α Yo.w. financial assets(t–1)– X
Equity(t–1) + profit(t)
cash flowinvestment
(t)
firesales(X)
debtfinance
(Y)
cash flowoperations
(t)
CF viaindirectmethod
after-taxprofit/ loss
(t)
profittax(t)
pre-taxprofit/ loss
(t)
cash flowfinancing
(t)

Modeling the COVID-19 effects on the Austrian economy and banking system
FINANCIAL STABILITY REPORT 40 – NOVEMBER 2020 71
flows. However, at this juncture, only current other financial assets (available for divestment) and current bank debt (that needs to be refinanced) are considered in our model. Third, we combine all other assets and liabilities, respectively, as they do not yet play a role in our model.
Insolvency thresholds
Both in general and according to Austrian insolvency law, corporate insolvencies can be triggered either by overindebtedness or illiquidity. To reflect these two dimensions in our model, we consider the equity and the aggregate cash and bank positions relative to total assets as best measure. We introduce two separate thresholds to flag insolvency, namely –30% for the equity ratio and –10% for the liquidity ratio. A firm becomes insolvent if it falls below one of these thresholds. While the threshold for overindebtedness is well justified by empirical evidence15, the foun-dation for the illiquidity threshold is weaker. We use a negative liquidity threshold (instead of zero) since the firms can rely on undrawn credit lines from banks.
3.2 Data
The model builds on a firm-level dataset for nonfinancial Austrian corporations with 18 firm-specific variables for 17 NACE-1 sectors. We use data from the BACH16 and SABINA17 databases to construct this dataset. Since only two variables at the firm level (the equity ratio and the cash and bank positions) are available to a sufficient extent in the SABINA database, we generate a hypothetical firm-level dataset. To this effect, we proceed in two steps. First, we simulate a firm-level dataset for six core variables (equity ratio, cash and bank, current assets, current liabilities, total income, total expenses) by means of a Monte Carlo simulation.18 Second, we calculate all other variables as shares of the simulated variables on a sectoral basis.19
3.3 Simulation
For our Monte Carlo simulation, we need the distribution of each variable in each sector and a covariance matrix per sector that describes the joint distribution of all variables. We use a copula approach20, since it provides a flexible way to separately model the dependence structure between the variables and the marginal distributions.
15 We set the overindebtedness threshold at –30% for two reasons: (1) based on this threshold, we replicated recent insolvency rates per sector at the starting point, and (2) cross-country empirical studies show that the equity ratio commonly associated with insolvency ranges from –30% to –35% (see Davydenko, 2007).
16 BACH is a database of aggregated accounting data of nonfinancial corporations based in 13 European countries. It contains over 100 variables for 17 NACE sectors (www.bach.banque-france.fr/?lang=en). Besides the weighted mean, data for the quartiles of the distribution for each variable are available (ECCBSO, 2020).
17 The SABINA database contains firm-level accounting data compiled by Bureau van Dijk for more than 130,000 Austrian firms.
18 Monte Carlo simulation is a mathematical technique that generates random variables for modeling risk or uncertainty of a certain system. The random variables or inputs are modeled based on probability distributions such as normal or gamma distributions.
19 The following 18 variables are included in the model: cash and bank ratio, equity ratio, current assets, current liabilities, current financial assets, current bank debt, turnover, financial income, total income, cost of goods sold, materials and consumables, external supplies and services, staff costs, operating taxes and other operating charges, financial expenses, depreciation, interest expenses, total expenses.
20 A copula is a multivariate cumulative density distribution for which the marginal distribution for each variable is uniform (see McNeil et al., 2015).

Modeling the COVID-19 effects on the Austrian economy and banking system
72 OESTERREICHISCHE NATIONALBANK
For the marginal distributions of the equity ratio and cash and bank, we draw on firm-level data that are available in the SABINA database for more than 110,000 firms. The marginal distributions of the other four core variables (current assets, current liabilities, total income, total expenses) are taken from the BACH database, which contains aggregated data for the weighted mean and for the quartiles. We use the weighted mean and the first quartile to estimate the distribution for these variables. We assume a normal distribution for total income and total expenses and a gamma distribution for current assets and current liabilities. Unfortunately, we have no micro data to estimate the correlation matrix that describes the dependencies between the variables of each sector. We therefore use correlations over time between the means of pairs of variables as a proxy.
For each sector, we generate 100,000 draws from the multivariate normal distribution. Four points are worth mentioning. First, our simulation approach effectively reproduces the empirical marginal distributions. Second, the distribu-tion for the equity ratio is far from normal, which highlights the importance of the availability of firm-level data for this variable21. Third, a considerable share of firms has negative equity in 2018 (17% across all sectors).22 Fourth, we removed firms with equity of less than –30% from our dataset since such firms are insolvent according to our definition.
3.4 Mitigating measures
Figure 3, which adds mitigating measures to figure 2, shows how the above-mentioned measures are implemented in the model. Note that the current calibration is based on the actual use of individual measures where available and assumes maximum
21 It would be possible to construct the firm-level dataset with variables from the BACH database only. However, for most sectors, the distribution of the equity ratio deviates considerably from a normal distribution.
22 The negative equity ratio is at least partially driven by hidden reserves due to the lower of cost or market principle of the Austrian accounting regime (nGAAP).
Stylized overview of the insolvency model with mitigating measures
Figure 3
Source: Authors’ compilation.
Note: CF stands for cash flow, and o.w. for of which.
Income(t0)
Cash & bank(t–1)+CF(t)
Profit and loss statement (t)
Current assets(t–1) – X Current liabilities(t–1)+α Y
Other assets(t0)
Balance sheet (t)
Shock toturnover
Check forinsolvency
.
– ∆ Income(t)
Expenses(t0)
– ∆ Expenses(t)
Other liabilities(t0)+(1–α) Y
if cash & bank(t) < –10%
ORif equity(t) < –30%
o.w. bank debt(t–1)+α Yo.w. financial assets(t–1)– X
Equity(t–1) + profit(t)
cash flowinvestment
(t)
firesales(X)
debtfinance
(Y)
cash flowoperations
(t)
CF viaindirectmethod
profittax(t)
pre-taxprofit/ loss
(t)
cash flowfinancing
(t)
[email protected]@oenb.at
after-taxprofit/ loss
(t)
Relaxed insolvency definitiontemporarily suspends equity trigger
Filing moratoriumtemporarily suspends liquidity trigger
Short-time workreduces staff costs
Debt moratorium (1/2)reduces interest expenses
Sector-specific measuresall lead to increased equity
Credit guaranteesincrease CF via new loans
Debt moratorium (2/2)reduces debt repayments
Fixed cost grantsincrease equity and CF
Deferment of social security contributions
improves cash flow
Deferment of taxesreduces profit tax

Modeling the COVID-19 effects on the Austrian economy and banking system
FINANCIAL STABILITY REPORT 40 – NOVEMBER 2020 73
efficiency by all stakeholders: firms know when they are eligible for a measure and apply right away and the institutions charged with executing the measures pay out immediately.
4 Results of the corporate insolvency modelIn this section, we present the insolvency rates as projected by our insolvency model based on our two macroeconomic scenarios – for each scenario with and without mitigating measures.
4.1 The aggregate impact on the Austrian corporate sector
In the baseline scenario without mitigating measures, the insolvency rate would rise to 5.8% at the end of 2020, more than quintupling its recently observed level (from 2014 to 2019, the insolvency rate averaged 1.1% according to KSV1870 data and 1.0% for the last three years). In 2021 and 2022, annual insolvency rates would decline to 2.4% and 1.7%, respectively. When we consider mitigating measures, the 2020 insolvency rate is significantly lower at 2.1%. However, this decrease is to a large extent due to measures that relate to a short-term payment deferral, namely a deferral of social security contributions and insolvency filing moratorium. Consequently, 2021 insolvency rates will increase to 3.1%. In 2022, mitigating measures have no effect on insolvencies. Over all three years, mitigating measures help lower annual insolvency rates by 1.3 percentage points in the baseline scenario. In the adverse scenario, a second wave of infections in the fourth quarter of 2020 would have
Table 2
Cumulated annual insolvency rates in the baseline and adverse scenarios
KSV Baseline scenario Adverse scenario
Aver-age
Without mitigating measures
With mitigating measures
Without mitigating measures
With mitigating measures
2017–2019
2020 2021 2022 2020 2021 2022 2020 2021 2022 2020 2021 2022
Insolvency rates in %
Total 1.0 5.8 8.2 9.9 2.1 5.2 6.9 7.6 12.2 14.4 2.9 7.3 9.7 Agriculture, forestry and fishing (A) 0.2 0.9 2.5 3.7 0.0 1.9 3.0 1.1 4.2 6.1 0.0 3.1 5.0 Mining and quarrying (B) 0.5 0.5 1.1 1.7 0.5 1.1 1.7 0.6 1.6 2.5 0.6 1.5 2.3 Manufacturing (C) 0.7 4.0 7.2 9.0 1.6 5.4 7.2 6.2 13.4 16.0 2.2 7.7 10.8 Electricity, gas, steam and air conditioning supply (D) 0.3 0.7 1.3 2.1 0.7 1.3 2.0 0.7 1.4 2.2 0.7 1.3 2.1 Water supply and sewerage (E) 0.7 1.5 3.7 6.6 1.4 3.5 6.3 1.7 5.0 9.2 1.6 4.6 8.5 Construction (F) 2.0 2.4 7.3 12.9 2.3 6.5 11.8 2.5 11.2 18.6 2.4 7.8 15.3 Trade (G) 1.0 6.8 9.6 11.0 2.1 7.5 9.2 10.2 16.5 18.3 3.0 10.8 13.3 Transportation and storage (H) 2.6 2.7 5.4 8.1 2.6 5.2 7.9 2.9 6.3 9.7 2.8 5.7 8.8 Accommodation and food services (I) 2.0 35.5 38.3 39.5 12.3 17.4 19.6 44.4 50.9 51.8 17.0 27.0 29.2 Information and communication (J) 0.6 1.4 2.4 3.2 1.3 2.3 3.1 1.6 3.1 4.0 1.4 2.6 3.6 Real estate (L) 0.3 0.7 1.5 2.3 0.0 1.5 2.3 0.8 1.9 2.9 0.0 1.8 2.7 Professional, scientific and technical services (M) 0.5 0.6 1.3 2.1 0.4 1.0 1.7 0.6 1.4 2.4 0.4 1.0 1.8 Administrative and support services (N) 1.6 2.8 5.2 7.2 1.6 4.8 6.9 3.1 6.1 8.5 1.8 5.3 7.7 Education (P) 0.4 0.4 1.0 1.6 0.3 0.8 1.2 0.5 1.1 1.7 0.3 0.6 1.0 Human health and social work activities (Q) 0.4 0.5 1.9 3.1 0.0 0.0 0.3 0.6 2.5 3.9 0.0 0.1 1.0 Arts, entertainment and recreation (R) 0.6 36.7 42.1 42.5 12.4 16.7 18.0 50.9 60.5 60.7 18.5 30.0 31.3 Other service activities (S) 0.7 2.5 5.8 7.6 1.2 4.7 6.5 3.8 10.8 13.6 1.7 6.4 9.3
Source: KSV1870, authors’ calculations.

Modeling the COVID-19 effects on the Austrian economy and banking system
74 OESTERREICHISCHE NATIONALBANK
insolvencies peak in our model in October 2020, driving up the 2020 insolvency rate by 1.8 percentage points (without mitigating measures) and 0.8 percentage points (with mitigating measures) relative to the baseline scenario. In 2021, the increase is even more pronounced (4.0 percentage points and 2.1 percentage points, respectively).
4.2 The impact on the Austrian corporate sector by sectors
Table 2 shows the results of the COVID-19 shock on both the 17 NACE sectors included in our analysis and the total economy – with and without mitigating measures.
%
Baseline scenario (monthly rates)
1.50
1.25
1.00
0.75
0.50
0.25
0.00
–0.25
–0.50
–0.75
–1.00
%
Baseline scenario (cumulated)
15.0
12.5
10.0
7.5
5.0
2.5
0.0
–2.5
–5.0
–7.5
–10.0
Monthly insolvency rates in the baseline and adverse scenarios
Chart 2
Source: Authors’ calculations.
With mitigating measures Without mitigating measures Impact of all mitigating measures
%
Adverse scenario (monthly rates)
1.50
1.25
1.00
0.75
0.50
0.25
0.00
–0.25
–0.50
–0.75
–1.00
%
Adverse scenario (cumulated)
15.0
12.5
10.0
7.5
5.0
2.5
0.0
–2.5
–5.0
–7.5
–10.0
With mitigating measures Without mitigating measures Impact of all mitigating measures
Jan. 20 July 20 Jan. 21 July 21 Jan. 22 July 22 Jan. 20 July 20 Jan. 21 July 21 Jan. 22 July 22
Jan. 20 July 20 Jan. 21 July 21 Jan. 22 July 22 Jan. 20 July 20 Jan. 21 July 21 Jan. 22 July 22

Modeling the COVID-19 effects on the Austrian economy and banking system
FINANCIAL STABILITY REPORT 40 – NOVEMBER 2020 75
4.3 The main drivers of corporate insolvency rates
Looking at monthly insolvency rates (chart 2), we see that many insolvencies warded off in 2020 by means of mitigating measures are postponed to the beginning of 2021.
In either scenario, more than 90% of the insolvency rates across sectors are driven by liquidity constraints.23 However, the two equity and cash and bank positions are linked in our model, as a company’s ability of refinancing critically depends on its equity position. Measures can only partially mitigate the COVID-19-induced shock, with credit guarantees, fixed cost support and short-time work appearing to be the most effective government measures across sectors.
5 Bank stress testing modelFigure 4 shows a stylized version of the stress testing model ARNIE24 (Feldkircher et al., 2013), a MATLAB-based stress testing model which the OeNB implemented and which built on earlier tools such as the Systemic Risk Monitor (Boss et al., 2006). The model consists of a network model with detailed balance sheet and profit and loss statements of individual banks as nodes and interbank stakes and exposures as links. We calculate banks’ operating results and risk provisions on a quarterly basis. ARNIE does not have an insolvency threshold as is implemented in the corporate insolvency model. We do, however, assess the impact of stress scenarios
23 Tracking each simulated firm’s equity and cash and bank positions facilitates disentangling insolvency due to capital or liquidity constraints.
24 ARNIE stands for Applied Risk, Network and Impact assessment Engine, the OeNB’s software tool for micro- and macroprudential bank stress testing and other quantitative banking system analyses.
Stylized overview of the ARNIE stress testing model
Figure 4
Source: Authors’ compilation.
macroscenarios
interbank network
Individual results
sectoralinsolvency
rates
mitigatingmeasures
otherrisk factors
Bank Y
Bank Z
Bank Xcapital impact
net interest income model
credit risk model
participation income model
other income / expense models and assumptions

Modeling the COVID-19 effects on the Austrian economy and banking system
76 OESTERREICHISCHE NATIONALBANK
on both individual banks and the banking system as a whole based on their ensuing capitalization. We may therefore use this model to address macro- and micropru-dential questions regarding the Austrian banking system’s solvency.
5.1 Structure
On the one hand, the structure of ARNIE reflects the stress test methodology developed for the EU-wide stress test by the European Banking Authority (EBA, 2018). On the other hand, it considers the specificities of the Austrian banking sector, such as the inverse consolidation of the cooperative banking sector allowed under the adverse scenario, albeit to a lesser extent than under the baseline scenario. In addition, we quantify credit risk losses arising from foreign currency loans and repayment vehicles attached to bullet loans.
The shock to the risk exposure amount focuses on credit risk-weighted assets. Internal ratings-based (IRB) portfolios are subject to the stressed credit risk parameters following the Basel formulas (BCBS, 2005), while portfolios under the standardized approach are subject to the floor from the EBA methodology, which corresponds to their initial value. Regarding securitization positions, the calculations in ARNIE stress risk weights in line with the EBA methodology. All other positions of the total risk exposure amount remain constant in the OeNB stress test.
ARNIE’s net interest income projections draw on data of banks’ individual balance sheet structures. Interest-bearing assets and liabilities are broken down into different categories. Again, in line with the EBA methodology, albeit at different granularity, an average effective interest rate is calculated for each category to capture the main drivers of interest income and expenses. Maturing instruments are replaced by instruments with identical characteristics but at current rates. An important driver of interest expenses included is the development of banks’ credit spreads along with the pass-through of credit spread increases to the margins of assets and liabilities. This is calibrated more harshly under the adverse than under the baseline scenario.
ARNIE’s participation risk module was designed to reflect gains and losses from participations, mainly in other banks, but also nonbank firms. Profits and losses made by a bank in the sample are proportionally passed on to the respective share-holders if they are also modeled in ARNIE, namely in line with their participation share. In case of a loss, this approach assumes that participations are revalued, with losses capped at book values.
Other income and expense positions are also broadly based on the EBA 2018 method-ology. Net trading income (NTI) and net fee and commission income (NFCI) are shocked by using half of EBA’s adverse haircut approach under both scenarios, i.e. via instant shocks of 12.5% and 10%, respectively. In addition, both NTI and NFCI are adjusted proportionally for the change in the performing exposure to reflect the reduced income generation capacity. Expenses, such as staff or other adminis-trative expenses, are assumed to remain flat over the stress horizon even under the adverse scenario.
Finally, taxes and dividends are treated by following EBA constraints (30% each, in case banks are profitable). Minority interests are considered in accordance with the actual ownership structure.

Modeling the COVID-19 effects on the Austrian economy and banking system
FINANCIAL STABILITY REPORT 40 – NOVEMBER 2020 77
5.2 Data
ARNIE includes all Austrian CRR credit institutions on a consolidated and an unconsolidated level. As from end-2019, 395 banks are included at the consolidated level, which are also reflected in our paper: 6 Austrian significant institutions (SIs), 1 material foreign SI subsidiary and 388 less significant institutions (LSIs). For their analysis, ARNIE draws on multiple proprietary, nonpublic data sources available at the OeNB. Capital-related, balance sheet as well as profit and loss positions are based on EBA’s EU-wide supervisory reporting standards (for IFRS-reporting banks)25 or national reports (for nGAAP banks).26 Additional data for NII modeling are based on the OeNB’s micro data reporting regime. Credit risk exposures are based on the ECB’s AnaCredit27 and national (for sub-AnaCredit exposures) and international banking supervision statistics (for foreign subsidiaries), with addi-tional data derived from nonstandard reporting for financial stability purposes. Data related to consolidation and participation risk are based on dedicated OeNB master data reports, with nonbank participations also informed by data from supervisory questionnaires.
5.3 Calibration
The calibration of ARNIE broadly follows the standards set used in the annual OeNB top-down stress testing exercises, which in turn are based on the current methodology of the EU-wide stress testing exercises (see EBA, 2018, for the most recent method). However, there is one major exception: contrary to generating credit risk factors from large-scale regression models, we link ARNIE’s credit risk modules to the output of the corporate insolvency model (see section 4). To this end, we take the relative shift of the insolvency rate per sector and form a simple average across two quarters (to account for a minor delay in default recognition). This relative shift marks the increase in reported (and estimated) default probabilities of banks’ portfolios. We apply similar shifts as those based on incorporated firms also to the retail exposure of banks, yet with greater delay (to account for automatic stabilizers and mitigating measures aimed at unincorporated firms and households).
In light of larger Austrian banks’ significant cross-border exposure, we need to integrate further assumptions, however. For lack of similar micro data for non-Austrian economies (and also due to resource constraints), we cannot simulate insolvency rates for foreign firms. Consequently, we lack relative increases of the default probabilities for foreign customers of Austrian banks that are affected either directly due to cross-border loans or indirectly due to local exposure to customers of foreign subsidiaries. To close this gap, we extrapolate the PD shifts for Austrian corporations based on two scaling factors: first, we consider the strength of each country’s mitigating measures by its share of local GDP.28 Second, we scale the PD shifts based on the GDP forecasts discussed in subsection 1.3. The following chart explains the specificities of the approach.
Chart 3 provides an example of our approach based on the baseline scenario and the aggregate Italian corporate sector. The starting point for the extrapolation
25 For details on EU-wide supervisory reporting, see EBA (2020c).26 For details on national supervisory reporting, see OeNB (2020a).27 For details on euro area credit data reporting, see ECB (2020c).28 For this analysis, we use the IMF’s “Policy Response Tracker,” which is available for 182 countries.

Modeling the COVID-19 effects on the Austrian economy and banking system
78 OESTERREICHISCHE NATIONALBANK
of each country and sector are the Austrian PD shifts with and without mitigating measures, as provided in panel (a). At 13% of GDP, Austria’s mitigating measures are at the more generous end. Yet, some countries spent even more in relative terms.
Hence, in panel (b), we set the lower bound of the possible PD shifts based on the country with the highest relative expenses, which in our case is Japan with 21.1% of GDP. Thus, the area between the blue and the dashed gray line represent the possible space a country can be placed in based on the respective fiscal spending. We can now calculate the percentile distribution of the PD shifts (“PD space”) between the upper and the lower bound (i.e. Austria without and Japan with measures) for all sectors and all quarters.
To link each country to a point between the bounds, we calculate the percentile distribution of fiscal spending as a share of GDP (“Fiscal space”) between the least (Oman) and the most generous country (Japan). The boundaries in both distributions make sure that the scaling yields no implausible outliers. Italy spends 5.86% of GDP on mitigating measures and would thus be fitted to the 59th percentile in the “Fiscal space” distribution. The same percentile is now used to determine Italy’s location in the “PD space” – plotted as the dashed dark red line in panel (c).
The distance between the dashed dark red (Italy) and blue line (Austria) yields the first scaling factor. Now we can employ the second scaling factor and alter the PD shifts solely based on the relative economic impact between the respective
%
(a) Corporate PD shifts for Austria
500
400
300
200
100
0
%
(b) Adding the lower bound PD curve
500
400
300
200
100
0
Extrapolation of Austrian credit risk parameter shifts to the rest of the world
Chart 3
Source: Authors’ calculations.
%
(c) Scaling Italy based on fiscal measures
500
400
300
200
100
0
%
(d) Scaling Italy based on GDP
500
400
300
200
100
0
AT – without measuresIT – with measures and GDP
AT – with measures Lower bound IT – with measures
Q1 Q2 Q3 Q4 Q1 Q2 Q3 Q4 Q1 Q2 Q3 Q42020 2021 2022
Q1 Q2 Q3 Q4 Q1 Q2 Q3 Q4 Q1 Q2 Q3 Q42020 2021 2022
Q1 Q2 Q3 Q4 Q1 Q2 Q3 Q4 Q1 Q2 Q3 Q42020 2021 2022
Q1 Q2 Q3 Q4 Q1 Q2 Q3 Q4 Q1 Q2 Q3 Q42020 2021 2022

Modeling the COVID-19 effects on the Austrian economy and banking system
FINANCIAL STABILITY REPORT 40 – NOVEMBER 2020 79
countries and Austria. In our example, in the baseline scenario, Italy is hit slightly harder in 2020, but less so in 2021 and 2022. Thus, panel (d) shows a scaled-up dark red line for the first four quarters and a scaled-down line for the remaining periods.29
In order not to misjudge credit risk (or any other income or expense position for this matter), the OeNB stress testing exercise relies on an extensive process of vetting model-implied starting values as well as model-derived stress testing results with line supervisors of both large and small banks.
5.4 Mitigating measures
Of the EU-wide mitigating measures dedicated to the banking system (see subsec-tion 2.5), we quantified the impact of the CRR “quick fix” for the six Austrian SIs and the material foreign SI subsidiary; for the LSIs, no data were available. We also had to ignore other measures having an impact on banks: (a) the extension of credit following public guarantees due to the static balance sheet assumption of the EBA methodology and (b) the loss of income due to the bank moratorium as there is no bank-level link between the corporate insolvency model and ARNIE. However, the conservative assumptions of ARNIE’s NII module should more than cover the income loss of (b).
6 Results of the bank stress testing modelIn this section, we present the results of the OeNB’s 2020 top-down solvency stress test for the baseline and adverse scenarios. Chart 4 shows the results for the aggregate consolidated Austrian banking system, each scenario with and without mitigating measures.
29 In the baseline scenario, Austria starts with GDP growth of 1.55% in 2019 and follows a path of –7.18%, 4.91% and 2.74% in the subsequent three years. We measure economic impact as the level deviation (i.e. difference) between the scenario path and the starting value. This allows to jointly consider the level of economic growth both before and after the crisis. For Austria, the differences are as follows: –8.74 percentage points, 3.35 percentage points and 1.18 percentage points. The starting value in the baseline scenario for Italy is 0.17% in 2019, followed by –9.25%, 4.75% and 2.53%. Thus, the level deviation is –9.42 percentage points, 4.58 percentage points and 2.35 percentage points. As a final step, we calculate the relative share between the economic impact of each year and get 108%, 73% and 50%. Even though the path for Italy looks worse compared with Austria, the lower starting point leads to a better performance overall.
CET1 ratio in %
Baseline scenario
16
14
12
10
8
CET1 ratio in %
Adverse scenario
16
14
12
10
8
CET1 ratio of the Austrian banking system in the OeNB’s 2020 stress test
Chart 4
Source: Authors’ calculations.
Baseline scenario Adverse scenario Without measuresWithout measures
15.614.4
13.3
15.6
11.2
9.2Q4 16 Q4 17 Q4 18 Q4 19 Q4 20 Q4 21 Q4 22 Q4 16 Q4 17 Q4 18 Q4 19 Q4 20 Q4 21 Q4 22

Modeling the COVID-19 effects on the Austrian economy and banking system
80 OESTERREICHISCHE NATIONALBANK
6.1 The aggregate impact on the Austrian banking systemIn the baseline scenario with mitigating measures (left panel of chart 4, solid blue line), the aggregate CET1 ratio for the Austrian banking sector declines from 15.6% to 14.4% between end-2019 and end-2022, or by 120 basis points.30 Compared with our initial assessment in a similar exercise in the OeNB’s Financial Stability Report 39, the impact declined from 200 basis points by 40% (OeNB, 2020b). Despite other changes, we mainly attribute the improvement to the fact that the set of mitigating measures for the real economy has been substantially expanded and/or prolonged since our initial assessment. After all, a counterfactual analysis of the COVID-19 impact on the Austrian banking system without mitigating measures – ceteris paribus – would have almost doubled the decline of the aggregate CET1 ratio to 236 basis points (left panel, dashed blue line).
In the adverse scenario with mitigating measures (right panel of chart 4, solid orange line), the aggregate CET1 ratio for the Austrian banking sector declines from 15.6% to 11.2% from end-2019 to end-2022, or by 444 basis points. No such scenario was calculated earlier this year, but to provide some context, the figure almost exactly matches last year’s adverse scenario of the OeNB’s 2019 top-down solvency stress test conducted jointly with the IMF as part of the Financial Sector Assessment Program (OeNB, 2019). The counterfactual analysis for the adverse scenario without mitigating measures shows that the decline of the aggregate CET1 ratio would – ceteris paribus – increase by almost 200 basis points (right panel of chart 4, dashed orange line).
While the adverse scenario may already appear closer to realization than the original baseline scenario, we would caution against this interpretation. After all, the adverse scenario presented in this paper features (1) no reaction by banks given our static balance sheet assumption, (2) conservative calibrations of non-credit risk-related risk factors, and (3) does not yet include the most recent round of mitigating measures announced in early November 2020. In our view, the COVID-19 pandemic would have to escalate significantly before results like this would materialize. And even if it did, the aggregate Austrian banking system would still be in a fairly comfortable position, not least because of the impact of the mitigating measures.
6.2 The disaggregate impact on the Austrian banking system
Charts 5.1 and 5.2 illustrate the frequency distribution of the CET1 ratio of the 395 individual banks included in the exercise for the baseline and the adverse scenario, respectively. In both charts, we show the scenario with measures on the left and the counterfactual without measures on the right. The upper row reflects the unweighted frequency distribution, i.e. each bank counts one. The lower row presents the total asset weighted frequency distribution, i.e. a bank that is ten times the size of another contributes ten times more to the respective surface of the frequency distribution.
In chart 5.1, we see a steady expansion of the yellow surfaces for the baseline scenario, which indicates a deterioration of the capitalization of a significant number of banks. The upper row also indicates a turnaround in the third year of
30 The CET1 ratio cited in the “Recent developments” section in this issue differs from this CET1 ratio. This is due to the fact that the stress test sample only includes CRR credit institutions, while the other, larger sample covers credit institutions as defined in the Austrian Banking Act.

Modeling the COVID-19 effects on the Austrian economy and banking system
FINANCIAL STABILITY REPORT 40 – NOVEMBER 2020 81
%
With measures, unweighted
100
75
50
25
0
100
75
50
25
0
%
Without measures, unweighted
Baseline scenario: frequency distributions of Austrian banks’ CET1 ratio in the OeNB’s 2020 stress test
Chart 5.1
Source: Authors’ calculations.
≥ 20.0%≥ 7.5% < 10.0%
≥ 17.5% < 20.0% ≥ 15.0% < 17.5%< 5.0%
≥ 12.5% < 15.0%≥ 5.0% < 7.5%
≥ 10.0% < 12.5%
Dec. 19 Dec. 20 Dec. 21 Dec. 22 Dec. 19 Dec. 20 Dec. 21 Dec. 22
%
With measures, total assets weighted
100
75
50
25
0
100
75
50
25
0
%
Without measures, total assets weighted
Dec. 19 Dec. 20 Dec. 21 Dec. 22 Dec. 19 Dec. 20 Dec. 21 Dec. 22
Adverse scenario: frequency distributions of Austrian banks’ CET1 ratio in the OeNB’s 2020 stress test
Chart 5.2
Source: Authors’ calculations.
%
With measures, total assets weighted
%
Without measures, total assets weighted
≥ 20.0%≥ 7.5% < 10.0%
≥ 17.5% < 20.0% ≥ 15.0% < 17.5%< 5.0%
≥ 12.5% < 15.0%≥ 5.0% < 7.5%
≥ 10.0% < 12.5%
100
75
50
25
0
100
75
50
25
0
Dec. 19 Dec. 20 Dec. 21 Dec. 22 Dec. 19 Dec. 20 Dec. 21 Dec. 22
%
With measures, unweighted%
Without measures, unweighted
100
75
50
25
0
100
75
50
25
0
Dec. 19 Dec. 20 Dec. 21 Dec. 22 Dec. 19 Dec. 20 Dec. 21 Dec. 22

Modeling the COVID-19 effects on the Austrian economy and banking system
82 OESTERREICHISCHE NATIONALBANK
the counterfactual scenario without measures. Moreover, the lower row shows that the CET1 ratio of Austria’s large banks remains above 10% even under the counterfactual scenario. For the adverse scenario, chart 5.2 points to a further decline of individual banks’ capitalization as indicated by the appearance of reddish surfaces. When we compare the upper with the lower row, we see, however, that this development is mainly due to an increasing number of small banks, particularly in the counterfactual adverse scenario without measures. It is important to stress that only under this scenario do we observe large Austrian banks moving to critical capitalization levels below a CET1 ratio of 10%. While the panels reflecting the baseline scenario with measures more or less confirm our assessment of aggregate stability also on a disaggregate level, this point is underlined by the adverse scenario. The adverse scenario includes conservative risk parameter calibration for non-credit risk parameters (see subsection 5.1) and lacks additional mitigating measures (see subsection 1.2). A similar observation can be made about the significance of the mitigating measures: their indirect impact on banks becomes even more evident
Basis points; CET1 ratio in %; contributions of risk drivers to the change in CET1 ratio from end-2019–2022 in basis points
3,100
2,325
1,550
775
0
Baseline scenario: risk drivers for the Austrian banking system in the OeNB’s 2020 stress test
Chart 6.1
Source: Authors’ calculations.
Note: Green marks positive, orange negative contributions of the risk drivers to the change in the CET1 ratio from 2020 to 2022.
15.614.4
901
41411
84 −530
−342
−80
51
−446
118
−12
−68
−44
−64
0
−27
−19
−5
−72
−1
13
CET
1 ra
tio (2
019)
Net
inte
rest
inco
me
Net
fee
and
com
miss
ion
inco
me
Net
trad
ing
inco
me
Part
icip
atio
n in
com
e
Staff
exp
ense
s
Oth
er a
dmin
istra
tive
exp
ense
s
Dep
reci
atio
n
Oth
er in
com
e a
nd e
xpen
ses
Expe
cted
loss
Cur
es
Non
perf
orm
ing
exp
osur
e
Fore
ign
curr
ency
loan
impa
ct
Busin
ess
risk
Part
icip
atio
n lo
ss
Extr
aord
inar
y re
sult
Taxe
s
Div
iden
ds
Min
ority
inte
rest
Risk
exp
osur
e a
mou
nt im
pact
Base
l III
phas
e−in
Resid
ual
CET
1 ra
tio (2
022)
Basis points; CET1 ratio in %; contributions of risk drivers to the change in CET1 ratio from end-2019–2022 in basis points
3,100
2,325
1,550
775
0
Adverse scenario: risk drivers for the Austrian banking system in the OeNB’s 2020 stress test
Chart 6.2
Source: Authors’ calculations.
Note: Green marks positive, orange negative contributions of the risk drivers to the change in the CET1 ratio from 2020 to 2022.
15.6 11.2
856
41011
65−530
−342−80
51−648
140
−32
−68−44
−1450
−5−3
−3−112
−137
CET
1 ra
tio (2
019)
Net
inte
rest
inco
me
Net
fee
and
com
miss
ion
inco
me
Net
trad
ing
inco
me
Part
icip
atio
n in
com
e
Staff
exp
ense
s
Oth
er a
dmin
istra
tive
exp
ense
s
Dep
reci
atio
n
Oth
er in
com
e a
nd e
xpen
ses
Expe
cted
loss
Cur
es
Non
perf
orm
ing
exp
osur
e
Fore
ign
curr
ency
loan
impa
ct
Busin
ess
risk
Part
icip
atio
n lo
ss
Extr
aord
inar
y re
sult
Taxe
s
Div
iden
ds
Min
ority
inte
rest
Risk
exp
osur
e a
mou
nt im
pact
Base
l III
phas
e−in
Resid
ual
CET
1 ra
tio (2
022)

Modeling the COVID-19 effects on the Austrian economy and banking system
FINANCIAL STABILITY REPORT 40 – NOVEMBER 2020 83
at a disaggregate than at an aggregate level in both scenarios. Just as for the corporate sector, the hardest-hit banks appear to benefit disproportionately.
6.3 The main drivers of the stress testing results
Charts 6.1 and 6.2 provide a breakdown of the main contributions to the change in the CET1 ratio across the two scenarios. Credit risk clearly remains the largest driver of risk in either scenario. Under the baseline scenario, the consolidated aggregate Austrian banking system remains profitable in its core operations (operating result after risk). In contrast, the revaluation of participations and the increase in credit risk exposure amounts (REAs) cause the CET1 ratio to drop. Under the adverse scenario, the former is no longer the case: the marginal impact of further insolvencies is by far the biggest difference (CET1 ratio –278 basis points vis-à-vis the baseline scenario). But the difference is not only related to credit risk, with participation losses (–99 basis points) the second most important marginal contributor. We interpret this as an acute risk of balance sheet contagion due to the inverse consolidation of the cooperative banking sector (by far the most important driver of this item), a defining feature of the Austrian banking system and unfortunately one that amplifies crises. Finally, a drop in NII (–49 basis points; not least due to the aforementioned credit spread increases under the adverse scenario) and a further increase of the credit quality-related REA (–45 basis points) also have a nonnegligible impact.
Looking at the risk drivers in general and the credit risk resulting from COVID-19- related insolvencies in particular at a disaggregate level, we find, however, that a bank’s disproportionate exposure to the hardest-hit economic sectors (arts, enter-tainment and recreation or NACE R and accommodation and food services or NACE I) does not automatically lead to higher CET1 ratio drawdowns in either of the scenarios. We also have to look at the initial credit quality of the portfolios in question and the overall profitability of the bank. While not related to the drawdown, initial capitalization obviously makes a difference.
7 Summary and conclusionsIn the final section of our paper, we try to do justice to the complex modeling setup of our analysis. On the one hand, we introduce a novel approach for modeling corporate insolvencies in Austria, which we use as an alternative input to assess COVID-19-related credit risk in our stress testing model ARNIE. After describing the two models, we present the results and draw policy conclusions. To interpret our findings, note the following important disclaimers regarding the assumptions underlying our conclusions.
7.1 Important disclaimers
Given the numerous models involved and the complex modeling setup, there are obviously many drawbacks to our assessment. The macroeconomic forecast is subject to a high degree of uncertainty. There are substantial downside risks and, as of writing, COVID-19 infections are on the increase again.
The corporate insolvency model is highly stylized and relies on several heroic assumptions. We nevertheless believe that the calibration of the model is likely to err on the conservative side. As for modeling the mitigating measures, their effects are also subject to considerable uncertainty. On the one hand, they could be over-estimated, since we assume a quick payout of funds based on the eligibility criteria. On the other hand, the measures could reduce insolvencies to a greater extent than

Modeling the COVID-19 effects on the Austrian economy and banking system
84 OESTERREICHISCHE NATIONALBANK
assumed due to possible secondary effects on GDP growth and a subsequent lesser decline in corporate turnover.
The OeNB’s stress testing framework ARNIE is built around the EBA stress testing methodology, focusing on the comparability of results across banks rather than on accurate forecasting. Most importantly, the static balance sheet assumption disallows banks’ individual reaction to the COVID-19 pandemic. The second important set of assumptions concerns the translation of elevated corporate insolvency rates resulting from our corporate insolvency model into the materialization of credit risk in banks’ individual exposures. While we are confident about our assessment of the credit risk of Austrian corporate exposures, we rely on heroic assumptions for Austrian retail exposures, and a rather mechanistic extrapolation of Austrian dynamics to cross-border exposures.
7.2 Main takeaways
In light of these important qualifiers, it is prudent to take the absolute results with a grain of salt. This mainly concerns the projected insolvency rates for Austrian corporations and the impact on the CET1 ratio of Austrian banks. But this should by no means lessen the value of the structural insights we are able to provide with our modeling setup.
While mitigating measures can only partly offset the COVID-19-induced shock to Austrian firms, they play an important role in lowering insolvency rates both on aggregate and in the hardest-hit sectors. It is important to note, however, that their impact is more pronounced in 2020, with some measures temporarily delaying payment obligations. Consequently, insolvency rates will be higher in 2021 than without mitigating measures, even though they will never reach their cumulated level.
A rather similar picture emerges for Austrian banks. With mitigating measures reducing corporate insolvency rates, banks face significantly lower COVID-19-related credit losses, which clearly has a positive impact on their capitalization ratios. Hence, Austrian banks benefit indirectly from the mitigating measures taken by the Austrian government and other institutions.
COVID-19 will nevertheless take its toll on Austrian banks, but today they appear to be in a much stronger position than at the onset of the great financial crisis of 2008/09. Capitalization levels are up across the board, providing ample cushion for the expected increase in corporate insolvencies, also on a disaggregate level. Our results suggest that only a substantial further deterioration of the COVID-19 pandemic could put the Austrian banking system in a critical position.
7.3 Next steps
Within the current framework, i.e. without addressing the above weaknesses, the most important refinement relates to the recalibration of the mitigating measures included in the model as more empirical data become available. Thanks to the way our framework is integrated at present, it allows for a quick impact assessment also if (a) existing measures are extended, (b) endowments change or (c) further measures are put into effect. Similarly, the model allows for a simple assessment of counter-factuals. Examples are the integration of frictions with regard to the payout of existing mitigating measures, the recalibration of existing measures, and the intro-duction of additional measures that are not (yet) on the table. Since its first iteration in June 2020, the model has been re-run multiple times to inform internal policy

Modeling the COVID-19 effects on the Austrian economy and banking system
FINANCIAL STABILITY REPORT 40 – NOVEMBER 2020 85
debates and will certainly be re-run in light of the most recent developments mentioned in the paper.
Beyond the current framework, i.e. when we address the above weaknesses, we see multiple avenues to improve the underlying models. Most importantly, the static balance sheet assumption currently limits the conclusions that can be drawn from our work, both for the corporate and banking sector. Extending the model in this regard is not a straightforward procedure, however. We would need to change firm and bank behavior: while we currently assume passive reactions to outside circumstances, firms and banks would have to be transformed into active agents with objective functions.
In the meantime, we can turn to low-hanging fruit to improve both the insolvency and stress testing models. Many of the empirical calibrations mentioned throughout the paper merit revisiting. Whenever we chose to rely on economy-wide parameters for corporates, we can move to sectoral calibrations. Whenever we calibrate ARNIE based on banking system aggregates, we can endogenize bank-level calibration. Any improvements in these areas will certainly help make our modeling output more realistic and therefore more valuable for the policy discussions it was initially designed to enlighten.
ReferencesBCBS. 2005. An Explanatory Note on the Basel II IRB Risk Weight Functions.Blanco, R., S. Mayordomo, A. Menéndez and M. Mulino. 2020. Spanish non-financial
corporations’ liquidity needs and solvency after the COVID-19 shock. Banco de España Documentos Ocasionales (Occasional Paper Series) 2020. https://www.bde.es/f/webbde/SES/Secciones/Publicaciones/PublicacionesSeriadas/DocumentosOcasionales/20/Files/do2020e.pdf
Boss, M., G. Krenn, C. Puhr and M. Summer. 2006. Systemic Risk Monitor: A Model for Systemic Risk Analysis and Stress Testing for Austria. In: Financial Stability Report 11. OeNB. 83–95.
Davydenko, S. A. 2007. When do firms default? A study of the default boundary. Mimeo.De Vito, A. and J.P. Gomez. 2020. Estimating the COVID-19 cash crunch: global evidence and
policy. In: Journal of Accounting and Public Policy. Forthcoming.EBA. 2018. 2018 EU-Wide Stress Test – Methodological Note.EBA. 2020a. Guidelines on legislative and non-legislative moratoria on loan repayments applied in
the light of the COVID-19 crisis. GL 02/2020.EBA. 2020b. Guidelines on reporting and disclosure of exposures subject to measures applied in
response to the COVID-19 crisis. GL 07/2020.EBA. 2020c. Supervisory reporting. eba.europa.eu/regulation-and-policy/supervisory-reportingECB. 2020a. Eurosystem staff macroeconomic projections for the euro area. June. https://www.
ecb.europa.eu/pub/projections/html/ecb.projections202006_eurosystemstaff~7628a8cf43.en.htmlECB. 2020b. COVID-19 Vulnerability Analysis – Results overview. https://www.bankingsupervision.
europa.eu/press/pr/date/2020/html/ssm.pr200728_annex~d36d893ca2.en.pdfECB. 2020c. AnaCredit. www.ecb.europa.eu/stats/money_credit_banking/anacredit/html/index.en.htmlECCBSO. 2020. BACH User Guide. www.bach.banque-france.fr/index.php?page=telechargementa-
File&file=Summary_Userguide.pdfFeldkircher, M., G. Fenz, R. Ferstl, G. Krenn, B. Neudorfer, C. Puhr, T. Reininger, S.W.
Schmitz, M. Schneider, C. Siebenbrunner, M. Sigmund and R. Spitzer. 2013. ARNIE in Action: The 2013 FSAP Stress Tests for the Austrian Banking System. In: Financial Stability Report 26. OeNB. 100–118.

Modeling the COVID-19 effects on the Austrian economy and banking system
86 OESTERREICHISCHE NATIONALBANK
Fenz, G., C. Ragacs, M. Schneider and K. Vondra. 2020. COVID-19-induced recession: biggest economic policy challenge for Austria in the “Second Republic.” Economic outlook for Austria from 2020 to 2022 (June 2020). In: Monetary Policy & the Economy Q1–Q2/20. OeNB. 213–250.
Guerini, M., L. Nesta, X. Ragot and S. Schiavo. 2020. Dynamique des défaillances d’entreprises en France et crise de la Covid-19. OFCE Policy Brief 73. June 19.
McNeil, A. J., R. Frey and P. Embrechts. 2015. Quantitative Risk Management: Concepts, Techniques and Tools. Princeton Series in Finance. Princeton: Princeton University Press.
OECD. 2020. Corporate sector vulnerabilities during the Covd-19 outbreak. Assessment and policy responses. Tackling Coronavirus Series. May 5.
OeNB. 2019. ARNIE Still in Action – Results of the 2019 OeNB system stress tests. In: Financial Stability Report 38. OeNB. 14–22.
OeNB. 2020a. Reporting to the OeNB. www.oenb.at/en/reporting.htmlOeNB. 2020b. A scenario analysis to assess the impact of COVID-19 on the Austrian banking
system. In: Financial Stability Report 39. OeNB. 55–58.Puhr, C. and M. Schneider. 2021. Have government measures helped prevent COVID-19-induced
insolvencies? In: Monetary Policy & the Economy Q4/20–Q1/21. OeNB. Forthcoming.