modeling the large and small orbital debris populations ... · modeling the large and small orbital...
TRANSCRIPT
National Aeronautics and Space Administration
Modeling the Large and Small Orbital Debris Populations for Environment Remediation
J.-C. Liou, PhDNASA Orbital Debris Program Office
Johnson Space Center, Houston, Texas
3rd European Workshop on Space Debris Modeling and Environment RemediationCNES HQ, Paris, France, 16-18 June 2014
https://ntrs.nasa.gov/search.jsp?R=20140006500 2018-10-19T15:04:57+00:00Z

2/25
National Aeronautics and Space Administration
JCL
Outline
• Options for Environment Remediation in LEO
• Knowledge of the Environment
• Modeling the Future Large and Small Orbital Debris Population Growth
3/25
National Aeronautics and Space Administration
JCL
Options for Environment Remediation in LEO

4/25
National Aeronautics and Space Administration
JCL
Stability of the LEO Debris Environment
• The Inter-Agency Space Debris Coordination Committee (IADC) investigated the stability of the orbital debris population in LEO several years ago– Six Agencies (ASI, ESA, ISRO, JAXA, NASA, UKSA) used six
different models for the study– A final study report was prepared and placed at the IADC
website (http://www.iadc-online.org) in January 2013– A study summary was presented to the UN Committee on the
Peaceful Uses of Outer Space (COPUOS) Scientific and Technical Subcommittee (STSC) in February 2013

5/25
National Aeronautics and Space Administration
JCL
Conclusions of the IADC Study
• Even with a 90% compliance of the 25-year rule and no future explosions, the LEO debris population is expected to increase in the next 200 years– Monte Carlo (MC) statistics: 644/725 MC runs, 89% probability– Population growth is primarily driven by collisions between 700
and 1000 km altitudes– Catastrophic collisions are likely to occur every 5 to 9 years
• To better limit the growth of the future debris population and to reduce collision activities in LEO, new mitigation measures, such as active debris removal, should be considered

6/25
National Aeronautics and Space Administration
JCL
Options for Environment Remediation
• Removal of massive intact objects, with high collision probabilities, to address the root cause of the future debris population growth problem
• Removal of ~5-mm to 1-cm debris to mitigate the main threat for operational spacecraft
• Prevention of major debris-generating collisions involving massive intact objects as a potential short-term solution

7/25
National Aeronautics and Space Administration
JCL
0
2000
4000
6000
8000
10000
12000
14000
16000
18000
20000
22000
24000
1950 1970 1990 2010 2030 2050 2070 2090 2110 2130 2150 2170 2190 2210
Effective Num
ber of O
bjects (>10
cm)
Year
LEO Environment Projection (averages of 100 LEGEND MC runs)
Reg Launches + 90% PMD
Reg Launches + 90% PMD + ADR2020/02
Reg Launches + 90% PMD + ADR2020/05
(Liou, Adv. Space Res, 2011)
A good implementation of the commonly-adopted mitigation measures and an ADR of about five objects per year can “stabilize the future environment”
Controlling Debris Growth with ADR

8/25
National Aeronautics and Space Administration
JCL
Targets for Removal
1,000
10,000
100,000
1,000,000
10,000,000
0.1 1 10 100
Cumulative N
umbe
r
Size (cm)
Notional Size Distribution of LEO‐Crossing Objects
Main driver for population growth
1 cm
5 cm
10 cm
50 cm1 m
5 mm
Main threat to operational S/C
Degradation threat to operational S/C
~80% of all >5 mm debris are in the 5-mm to 1-cm regime
9/25
National Aeronautics and Space Administration
JCL
Knowledge of the Orbital Debris Environment

10/25
National Aeronautics and Space Administration
JCL
0
1000
2000
3000
4000
5000
6000
7000
8000
9000
10000
11000
12000
13000
14000
15000
16000
17000
1957
1959
1961
1963
1965
1967
1969
1971
1973
1975
1977
1979
1981
1983
1985
1987
1989
1991
1993
1995
1997
1999
2001
2003
2005
2007
2009
2011
2013
Num
ber o
f Obj
ects
Year
Monthly Effective Number of Objects in Earth Orbit by Object Type
Total Objects
Fragmentation Debris
Spacecraft
Mission-related Debris
Rocket Bodies
Growth of the Cataloged Populations
11/25
National Aeronautics and Space Administration
JCL
0
1
2
3
4
5
6
7
1957
1959
1961
1963
1965
1967
1969
1971
1973
1975
1977
1979
1981
1983
1985
1987
1989
1991
1993
1995
1997
1999
2001
2003
2005
2007
2009
2011
2013
Mas
s in
Orb
it (m
illio
ns o
f kg)
Year
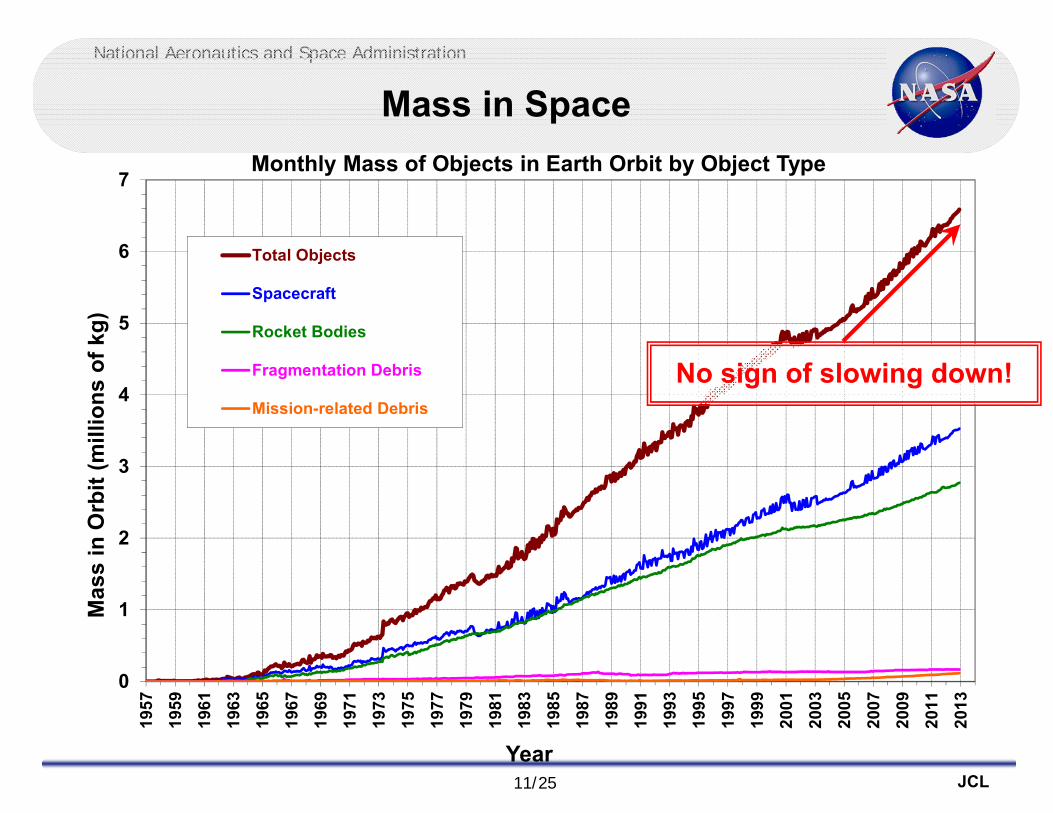
Monthly Mass of Objects in Earth Orbit by Object Type
Total Objects
Spacecraft
Rocket Bodies
Fragmentation Debris
Mission-related Debris
Mass in Space
No sign of slowing down!

12/25
National Aeronautics and Space Administration
JCL
• Both number and mass distributions are important parameters for environment assessments– Health of the environment– Effectiveness of mitigation and remediation measures
• Other factors, such as threat to critical space assets need to be considered as well
Key Messages
13/25
National Aeronautics and Space Administration
JCL
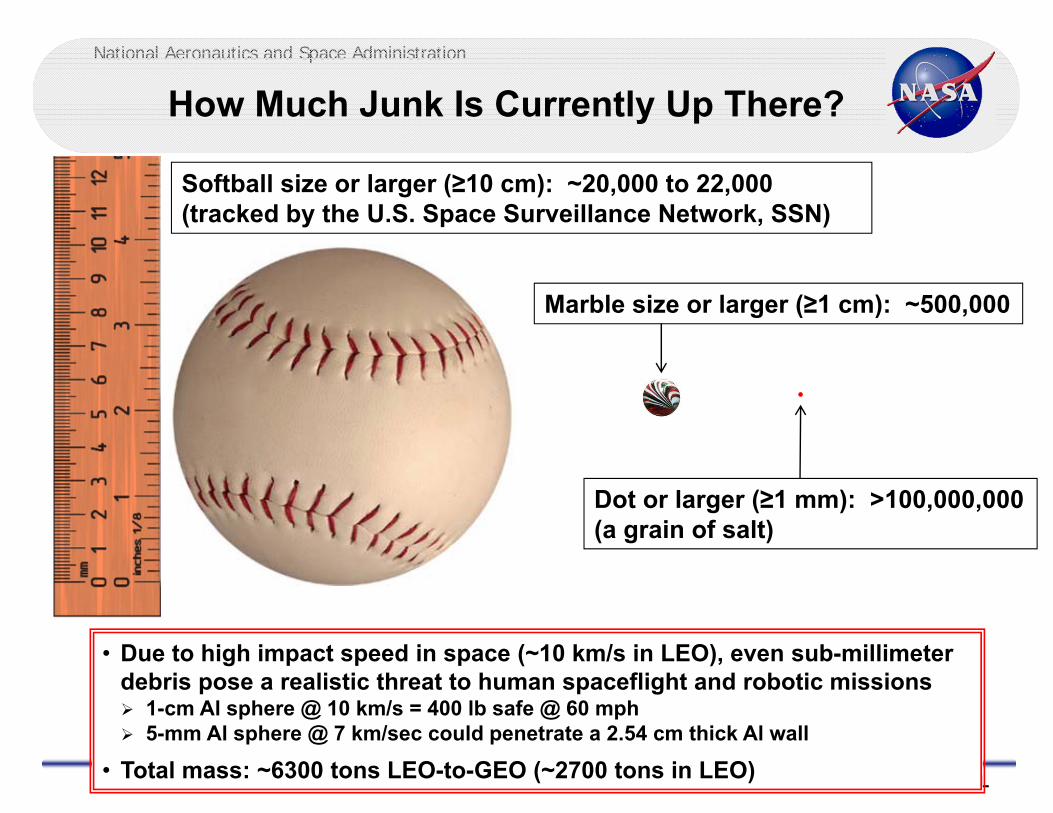
How Much Junk Is Currently Up There?
• Due to high impact speed in space (~10 km/s in LEO), even sub-millimeter debris pose a realistic threat to human spaceflight and robotic missions 1-cm Al sphere @ 10 km/s = 400 lb safe @ 60 mph 5-mm Al sphere @ 7 km/sec could penetrate a 2.54 cm thick Al wall
• Total mass: ~6300 tons LEO-to-GEO (~2700 tons in LEO)
Softball size or larger (≥10 cm): ~20,000 to 22,000(tracked by the U.S. Space Surveillance Network, SSN)
Marble size or larger (≥1 cm): ~500,000
Dot or larger (≥1 mm): >100,000,000(a grain of salt)
14/25
National Aeronautics and Space Administration
JCL
Knowledge of the Historical and Current Environment
• For the ≥10 cm population– The sources and components (including the large and massive
rocket bodies and spacecraft) are well understood• Good historical launch records• The U.S. Space Surveillance Network tracks and maintains the orbits
of the objects in the U.S. satellite catalogs
• For the ~5-mm to 1-cm population– The sources and components are NOT well characterized
• Only limited data are available based on statistical sampling of a small fraction of the environment

15/25
National Aeronautics and Space Administration
JCL
The Orbital Debris Family
10 m 100 m 10 cm 1 m 10 m1 mm 1 cm
Size (diameter)
R/Bs, S/C
Breakup Fragments
Al2O3 (slag)Al2O3
NaK
Paint Flakes MLI Pieces
Objects in the Near-Earth Environment
(Boundaries are notional)
Mission-related Debris

16/25
National Aeronautics and Space Administration
JCL
Current NASA Orbital Debris Database
10 m 100 m 10 cm 1 m1 mm 1 cm
Particle Diameter
100
1000
10,000
36,000
10 m
2000
Goldstone radars(>32.2º)
Haystack radar(>30º)
Haystack Auxiliary (HAX) radar (>42.6º)
U.S. Space Surveillance Network
HST-WFPC2 (580x610 km, 93-09)
STS (300x400 km, 95-11)
(Boundaries are notional)
MODEST telescope

17/25
National Aeronautics and Space Administration
JCL
Modeling the Future Orbital DebrisPopulation Growth

18/25
National Aeronautics and Space Administration
JCL
Predicting the Future
• Key uncertainties in environment projection– Initial population– Future sources
• Rocket bodies and spacecraft (launch frequency, orbits, masses, dimensions, materials, mission lifetimes, etc)
• Fragmentation debris (breakup frequency and outcome)• Non-fragmentation debris
– Solar activity– Post-mission disposal compliance– Monte Carlo approach
Two general approaches for future projection:– Examine extreme cases to bound the problem– Analyze nominal cases based on reasonable assumptions

19/25
National Aeronautics and Space Administration
JCL
0
2000
4000
6000
8000
10000
12000
14000
16000
18000
20000
22000
24000
1950 1970 1990 2010 2030 2050 2070 2090 2110 2130 2150 2170 2190 2210
Effective Num
ber of O
bjects (>10
cm)
Year
LEO Environment Projection (averages of 100 LEGEND MC runs)
Reg Launches + 90% PMD
Reg Launches + 90% PMD + ADR2020/02
Reg Launches + 90% PMD + ADR2020/05
(Liou, Adv. Space Res, 2011)
A good implementation of the commonly-adopted mitigation measures and an ADR of about five objects per year can “stabilize the future environment”
Controlling Debris Growth with ADR

20/25
National Aeronautics and Space Administration
JCL
About the “Five Objects Per Year”
• The “removing five objects per year can stabilize the LEO environment” conclusion is somewhat notional. It is intended to serve as a benchmark for ADR planning.
• Assumptions in the LEGEND ADR simulations– Nominal launches during the projection period– A 90% compliance of the 25-year rule and no future
explosions– ADR operations start in 2020– Target selection is based on each object’s mass and Pcoll
– No operational constraints on target selection– Immediate removal of objects from the environment– Average solar activity cycle

21/25
National Aeronautics and Space Administration
JCL
Approach Adopted for the IADC Studies
• Reasonable assumptions– Future launches can be represented by a recent eight-year
traffic cycle, average spacecraft mission lifetime is 8 years, explosions can be minimized, good compliance of the 25-year rule, etc.
• Best available tools from each participating agency– Each participating member agency uses its official/best models
for the solar flux prediction, orbit propagation, collision probability calculation, and satellite breakups
• Nominal cases– Monte Carlo results are analyzed– Study conclusions are drawn from the nominal/average results

22/25
National Aeronautics and Space Administration
JCL
Analyzing the Monte Carlo Results
• Options to present Monte Carlo simulation results– Averages– Averages with ’s– Tabular format– Scatter plots– Distributions– Averages and extremes– Individual projections– Others

23/25
National Aeronautics and Space Administration
JCL
Examples

24/25
National Aeronautics and Space Administration
JCL
Additional Difficulty for Modeling Small Debris Population
0
5,000
10,000
15,000
20,000
25,000
30,000
35,000
40,000
45,000
50,000
400 500 600 700 800 900 1000 1100 1200
Num
ber o
f Objects per 50 km
Bin
Altitude (km)
Evolution of Cosmos 2251 Fragments (5 mm to 1 cm)
2009 (~163,000)
2011 (~100,000)
2013 (~87,000)
2015 (~67,000)
2017 (~59,000)
2019 (~43,000)
− At any given altitude below ~900 km, small debris continue to “rapidly” spiral toward lower altitude, and the same region continues to be replenished by debris spiraling down from higher altitude
− The small debris environment is highly dynamic and could have strong short-term (i.e., monthly to yearly) episodic variations

25/25
National Aeronautics and Space Administration
JCL
Concluding Remarks
• Future environment projection is a difficulty task
• There exist different approaches to provide insights into the future to guide the development of mitigation and remediation measures
• Any study results must be clearly presented with the assumptions and the Monte Carlo nature of the outcome
• In reality, the assessments of the environment and the need for remediation efforts must be evaluated on a regular basis