modeling the recovery process: a key dimension of resilience
TRANSCRIPT
9 March 2021
Future Resilient SystemsSingapore-ETH Centre
Beatrice Cassottana
Modeling the Recovery Process: A Key Dimension of Resilience
29 March, 2021
Background
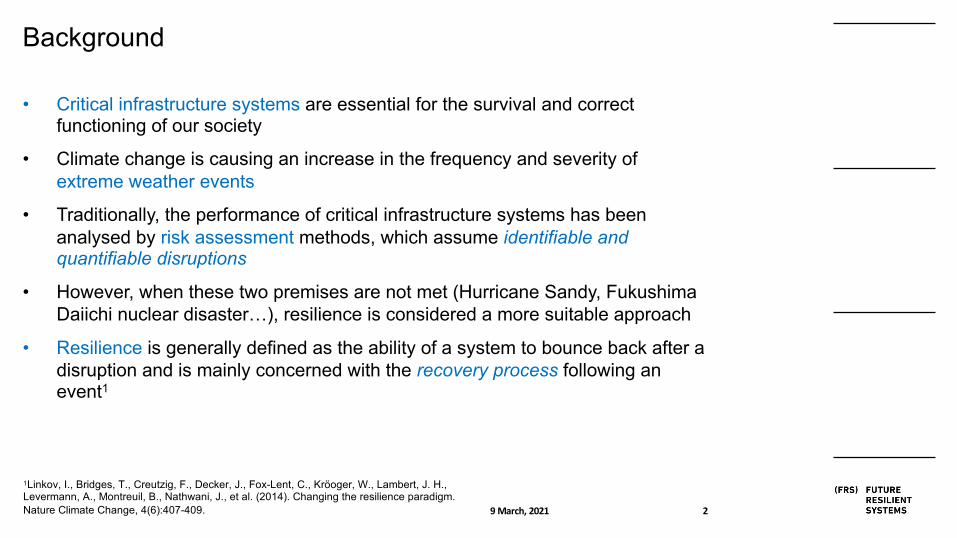
• Critical infrastructure systems are essential for the survival and correct functioning of our society
• Climate change is causing an increase in the frequency and severity of extreme weather events
• Traditionally, the performance of critical infrastructure systems has been analysed by risk assessment methods, which assume identifiable and quantifiable disruptions
• However, when these two premises are not met (Hurricane Sandy, Fukushima Daiichi nuclear disaster…), resilience is considered a more suitable approach
• Resilience is generally defined as the ability of a system to bounce back after a disruption and is mainly concerned with the recovery process following an event1
1Linkov, I., Bridges, T., Creutzig, F., Decker, J., Fox-Lent, C., Kröoger, W., Lambert, J. H., Levermann, A., Montreuil, B., Nathwani, J., et al. (2014). Changing the resilience paradigm. Nature Climate Change, 4(6):407-409.
39 March, 2021
Literature Review
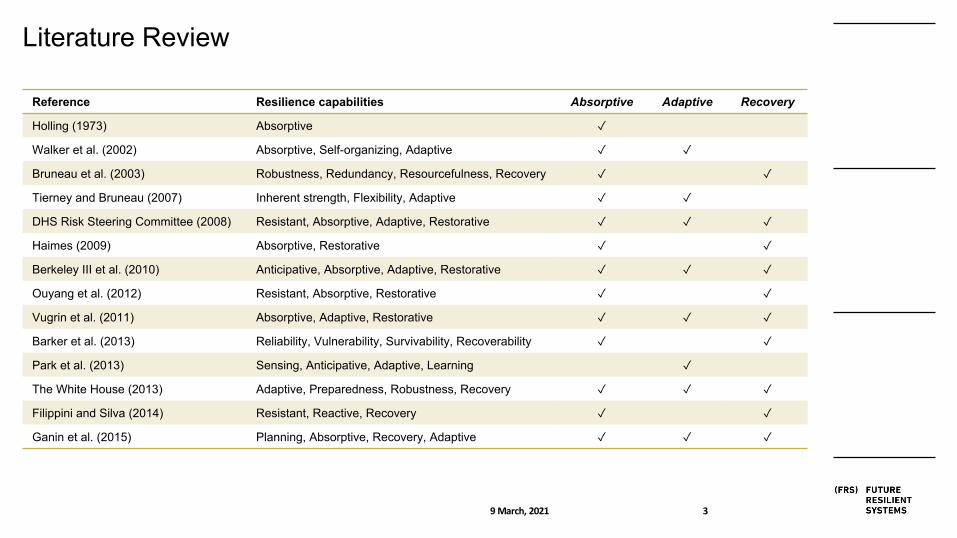
Reference Resilience capabilities Absorptive Adaptive Recovery
Holling (1973) Absorptive ✓Walker et al. (2002) Absorptive, Self-organizing, Adaptive ✓ ✓Bruneau et al. (2003) Robustness, Redundancy, Resourcefulness, Recovery ✓ ✓Tierney and Bruneau (2007) Inherent strength, Flexibility, Adaptive ✓ ✓DHS Risk Steering Committee (2008) Resistant, Absorptive, Adaptive, Restorative ✓ ✓ ✓Haimes (2009) Absorptive, Restorative ✓ ✓Berkeley III et al. (2010) Anticipative, Absorptive, Adaptive, Restorative ✓ ✓ ✓Ouyang et al. (2012) Resistant, Absorptive, Restorative ✓ ✓Vugrin et al. (2011) Absorptive, Adaptive, Restorative ✓ ✓ ✓Barker et al. (2013) Reliability, Vulnerability, Survivability, Recoverability ✓ ✓Park et al. (2013) Sensing, Anticipative, Adaptive, Learning ✓The White House (2013) Adaptive, Preparedness, Robustness, Recovery ✓ ✓ ✓Filippini and Silva (2014) Resistant, Reactive, Recovery ✓ ✓Ganin et al. (2015) Planning, Absorptive, Recovery, Adaptive ✓ ✓ ✓
49 March, 2021
The Recovery Process
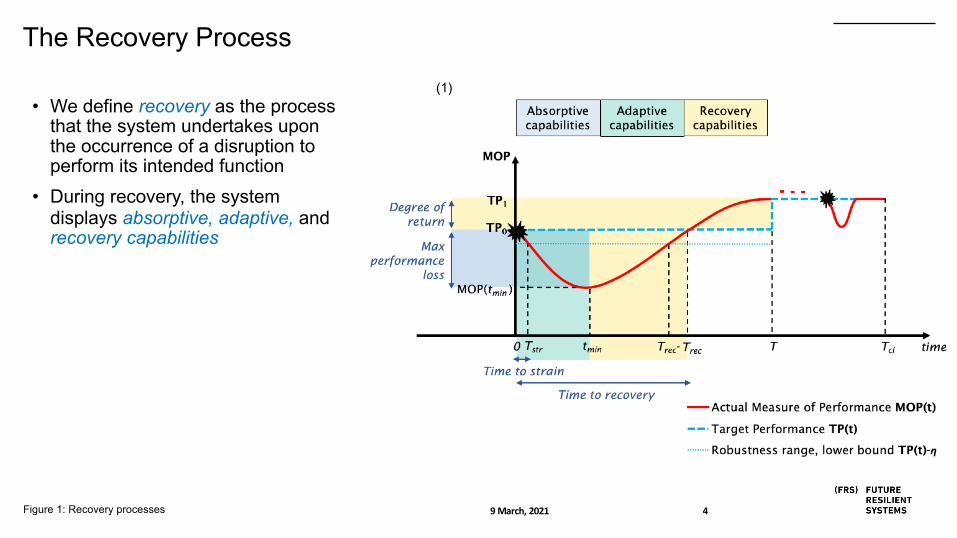
• We define recovery as the process that the system undertakes upon the occurrence of a disruption to perform its intended function
• During recovery, the system displays absorptive, adaptive, andrecovery capabilities
(1)
Figure 1: Recovery processes
59 March, 2021
Research objectives
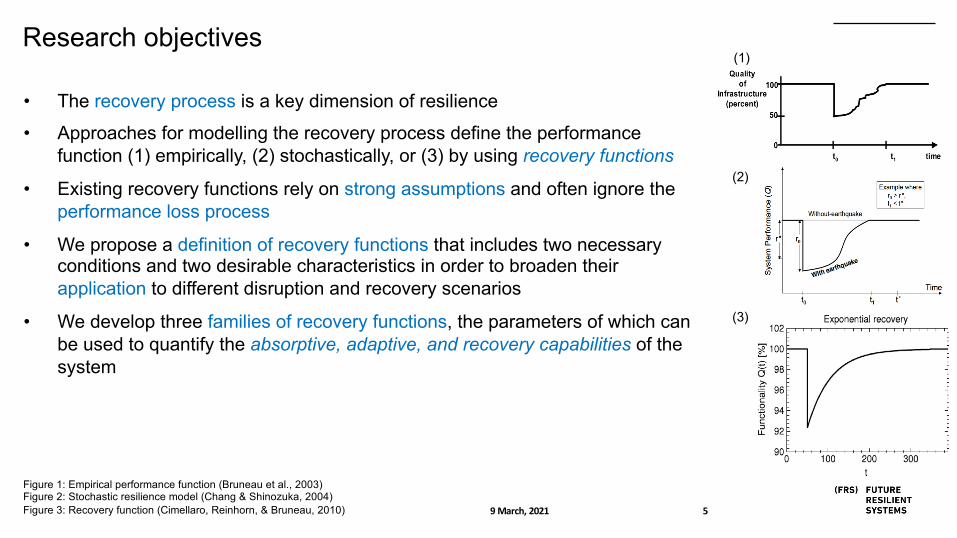
• The recovery process is a key dimension of resilience
• Approaches for modelling the recovery process define the performance function (1) empirically, (2) stochastically, or (3) by using recovery functions
• Existing recovery functions rely on strong assumptions and often ignore the performance loss process
• We propose a definition of recovery functions that includes two necessary conditions and two desirable characteristics in order to broaden their application to different disruption and recovery scenarios
• We develop three families of recovery functions, the parameters of which can be used to quantify the absorptive, adaptive, and recovery capabilities of the system
(1)
(2)
(3)
Figure 1: Empirical performance function (Bruneau et al., 2003)Figure 2: Stochastic resilience model (Chang & Shinozuka, 2004)Figure 3: Recovery function (Cimellaro, Reinhorn, & Bruneau, 2010)
69 March, 2021
Mathematical properties of recovery functions
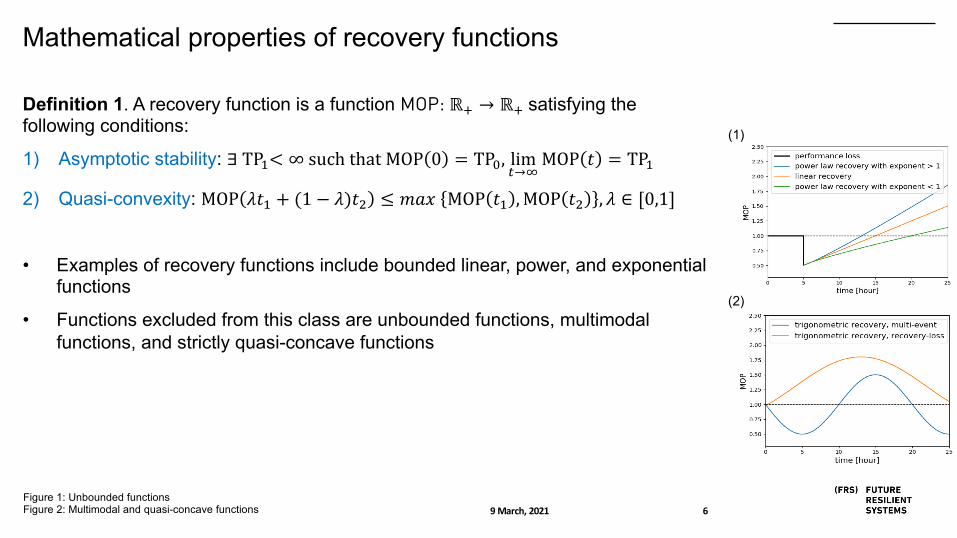
Definition 1. A recovery function is a function MOP: ℝ" → ℝ" satisfying the following conditions:
1) Asymptotic stability: ∃ TP'< ∞ such that MOP 0 = TP4, lim9→:MOP ; = TP'
2) Quasi-convexity: MOP <;' + (1 − <);B ≤ DEF MOP ;' ,MOP ;B , < ∈ [0,1]
• Examples of recovery functions include bounded linear, power, and exponential functions
• Functions excluded from this class are unbounded functions, multimodal functions, and strictly quasi-concave functions
(1)
(2)
Figure 1: Unbounded functionsFigure 2: Multimodal and quasi-concave functions

79 March, 2021
Desirable Characteristics of Recovery Functions
1) Versatility: recovery functions should be able to fit empirical datasets in order to bring insight to various recovery scenarios under different applications
2) Physical interpretation: model parameters should have a physical interpretation, such that the regions of the parameter space can be associated with different types of system responses
• The exponential recovery function satisfies physical interpretation but is not versatile (2)
Figure 1: Exponential recovery function MOP = %&' − ) exp[−./]
(1)
89 March, 2021
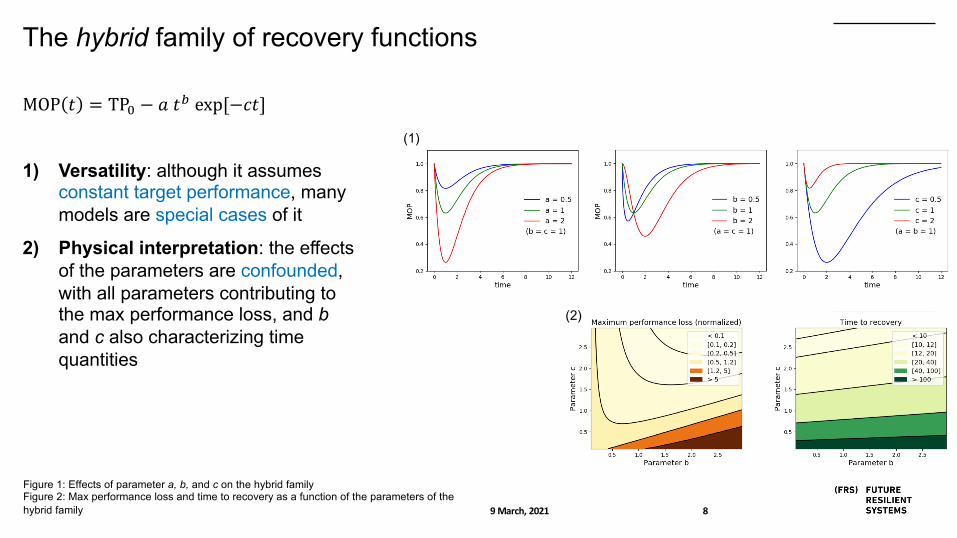
MOP $ = TP' − ) $* exp[−/$]
1) Versatility: although it assumes constant target performance, many models are special cases of it
2) Physical interpretation: the effects of the parameters are confounded, with all parameters contributing to the max performance loss, and band c also characterizing time quantities
The hybrid family of recovery functions
Figure 1: Effects of parameter a, b, and c on the hybrid familyFigure 2: Max performance loss and time to recovery as a function of the parameters of the hybrid family
(1)
(2)
99 March, 2021
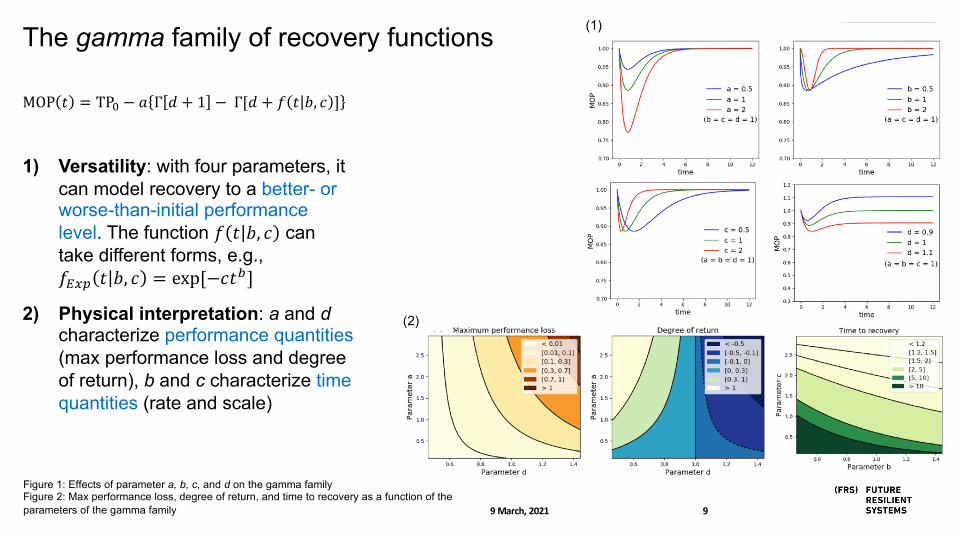
MOP $ = TP' − ) Γ + + 1 − Γ[+ + / $ 0, 2 ]
1) Versatility: with four parameters, it can model recovery to a better- or worse-than-initial performance level. The function / $ 0, 2 can take different forms, e.g., /456 $ 0, 2 = exp[−2$:]
2) Physical interpretation: a and dcharacterize performance quantities (max performance loss and degree of return), b and c characterize time quantities (rate and scale)
The gamma family of recovery functions
Figure 1: Effects of parameter a, b, c, and d on the gamma familyFigure 2: Max performance loss, degree of return, and time to recovery as a function of the parameters of the gamma family
(1)
(2)
109 March, 2021
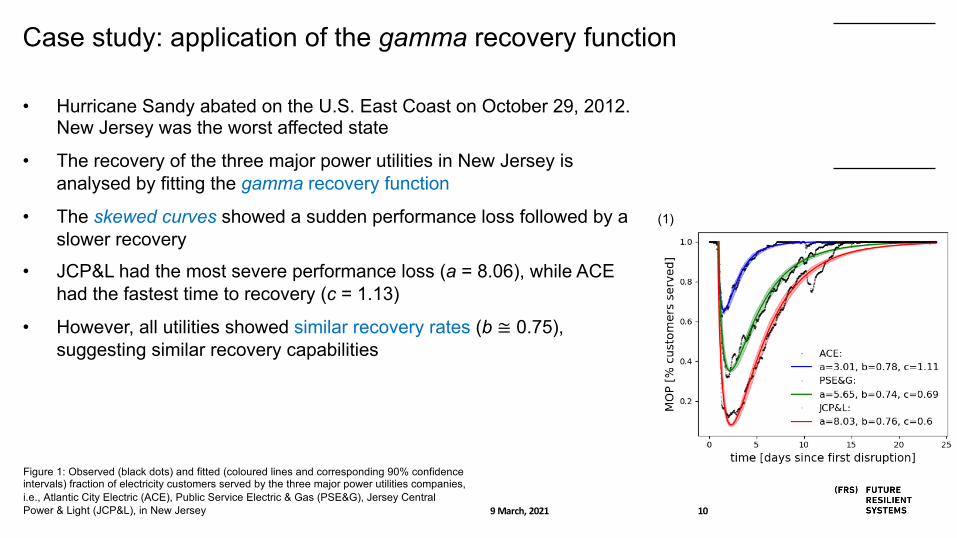
• Hurricane Sandy abated on the U.S. East Coast on October 29, 2012. New Jersey was the worst affected state
• The recovery of the three major power utilities in New Jersey is analysed by fitting the gamma recovery function
• The skewed curves showed a sudden performance loss followed by a slower recovery
• JCP&L had the most severe performance loss (a = 8.06), while ACE had the fastest time to recovery (c = 1.13)
• However, all utilities showed similar recovery rates (b ≅ 0.75), suggesting similar recovery capabilities
Case study: application of the gamma recovery function
Figure 1: Observed (black dots) and fitted (coloured lines and corresponding 90% confidence intervals) fraction of electricity customers served by the three major power utilities companies, i.e., Atlantic City Electric (ACE), Public Service Electric & Gas (PSE&G), Jersey Central Power & Light (JCP&L), in New Jersey
(1)
119 March, 2021
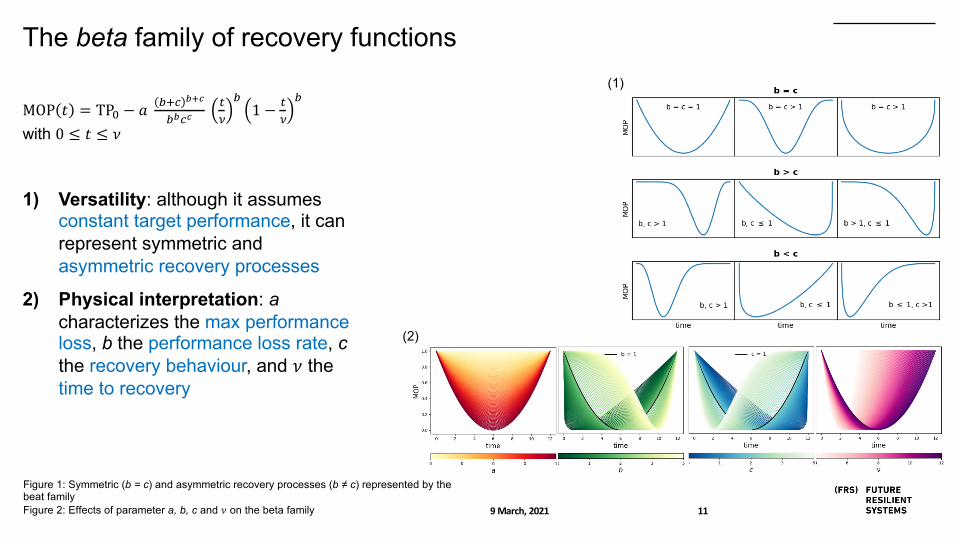
MOP $ = TP' − ) *+, -./
*-,/01*1 − 0
1*
with 0 ≤ $ ≤ 5
1) Versatility: although it assumes constant target performance, it can represent symmetric and asymmetric recovery processes
2) Physical interpretation: acharacterizes the max performance loss, b the performance loss rate, cthe recovery behaviour, and 5 the time to recovery
The beta family of recovery functions
Figure 1: Symmetric (b = c) and asymmetric recovery processes (b ≠ c) represented by the beat family Figure 2: Effects of parameter a, b, c and 5 on the beta family
(2)
(1)
129 March, 2021
MOP
time0 tmin
TP0
Trec
MOP
time0 tmin
TP0
Trec
(1)
(2)
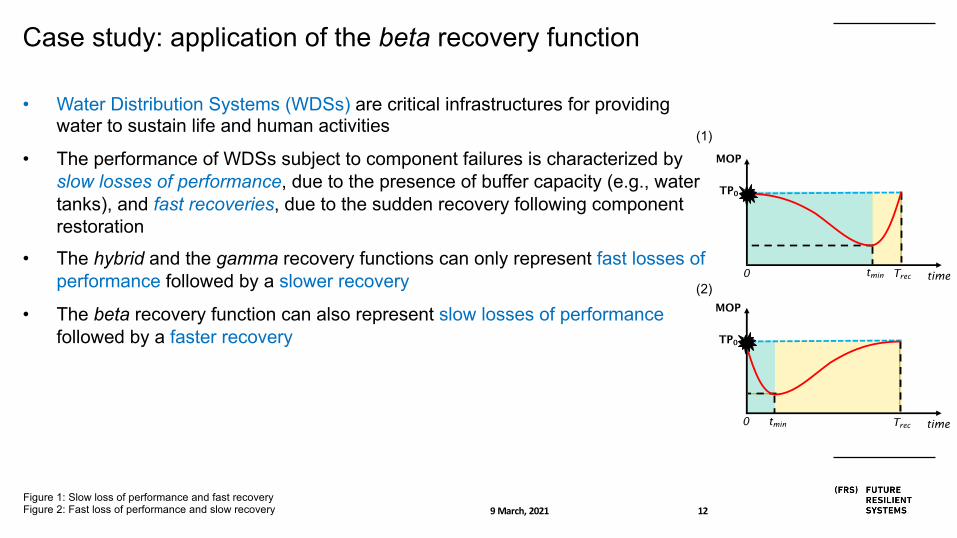
Figure 1: Slow loss of performance and fast recoveryFigure 2: Fast loss of performance and slow recovery
Case study: application of the beta recovery function
• Water Distribution Systems (WDSs) are critical infrastructures for providing water to sustain life and human activities
• The performance of WDSs subject to component failures is characterized by slow losses of performance, due to the presence of buffer capacity (e.g., water tanks), and fast recoveries, due to the sudden recovery following component restoration
• The hybrid and the gamma recovery functions can only represent fast losses of performance followed by a slower recovery
• The beta recovery function can also represent slow losses of performance followed by a faster recovery
139 March, 2021
Time to strain
time0 tmin
MOP(tmin )
Max performance
loss
TP0
TrecTstr
MOP
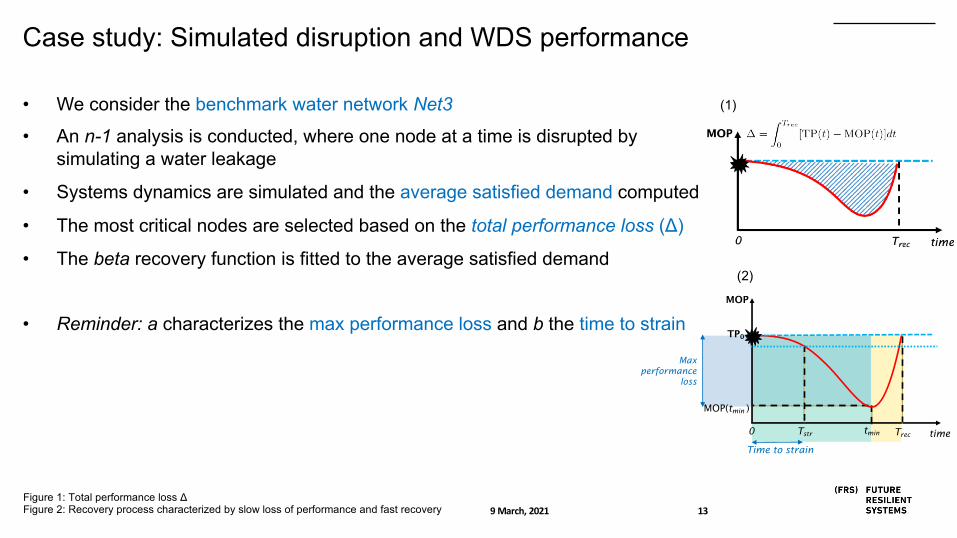
• We consider the benchmark water network Net3
• An n-1 analysis is conducted, where one node at a time is disrupted by simulating a water leakage
• Systems dynamics are simulated and the average satisfied demand computed
• The most critical nodes are selected based on the total performance loss (Δ)
• The beta recovery function is fitted to the average satisfied demand
• Reminder: a characterizes the max performance loss and b the time to strain
Case study: Simulated disruption and WDS performance
(1)
(2)
Figure 1: Total performance loss ΔFigure 2: Recovery process characterized by slow loss of performance and fast recovery
149 March, 2021
time0
TP0
MOP
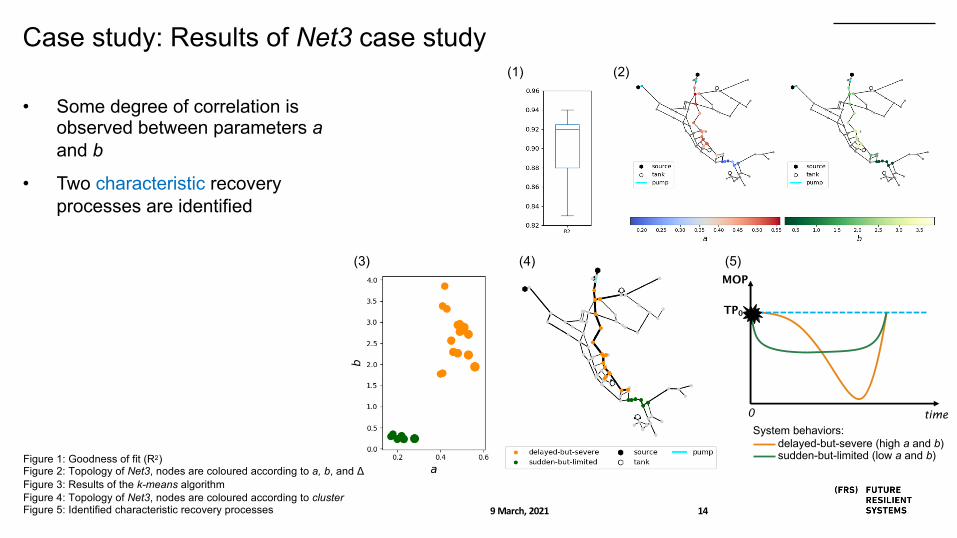
System behaviors:delayed-but-severe (high a and b)sudden-but-limited (low a and b)
• Some degree of correlation is observed between parameters aand b
• Two characteristic recovery processes are identified
Case study: Results of Net3 case study
Figure 1: Goodness of fit (R2)Figure 2: Topology of Net3, nodes are coloured according to a, b, and ΔFigure 3: Results of the k-means algorithmFigure 4: Topology of Net3, nodes are coloured according to clusterFigure 5: Identified characteristic recovery processes
(1) (2)
(5)(3) (4)

169 March, 2021
Conclusions
• The physical interpretation of the parameters helps to detect the extent to which the system can display its intrinsic capabilities, independent of the disruption severity
• The extent to which intrinsic capabilities are manifested during different recovery processes can vary according to the system configuration and operation settings
• Therefore, different system configurations and operation settings can be compared thorough the use of recovery functions
• In future research, the effects of disruption, system configuration and operation settings on recovery function parameters will be analysed and their relationship quantified in order to predict future (unobserved) recovery processes
9 March 2021
frs.ethz.ch
Beatrice Cassottana
Cassottana, B., Shen, L., and Tang, L. C. (2019). Modeling the recovery process: A key dimension of resilience. Reliability Engineering & System Safety 190, page 106528.
Cassottana, B., Aydin, N. Y., and Tang, L. C. (2020). Quantitative assessment of system response during disruptions: An application to water distribution systems. Journal of Water Resources Planning and Management, 147(3), page 04021002.