modelling global macroeconomic impacts of a carbon constrained energy system using etsap-tiam-msa
TRANSCRIPT

Modelling the global macroeconomic impacts of a carbon constrained energy system using ETSAP-TIAM-MSA
James Glynn, Maurizio Gargiulo, Socrates Kypreos, Brian Ó Gallachóir
UN City, Copenhagen | 66th ETSAP Meeting | TIMES-CGE WS
19th November 2014

Acknowledgements
• ETSAP TIAM Project Group
• MSA Developers Socrates Kypreos (PSI) & Antti Lehtila (VTT)
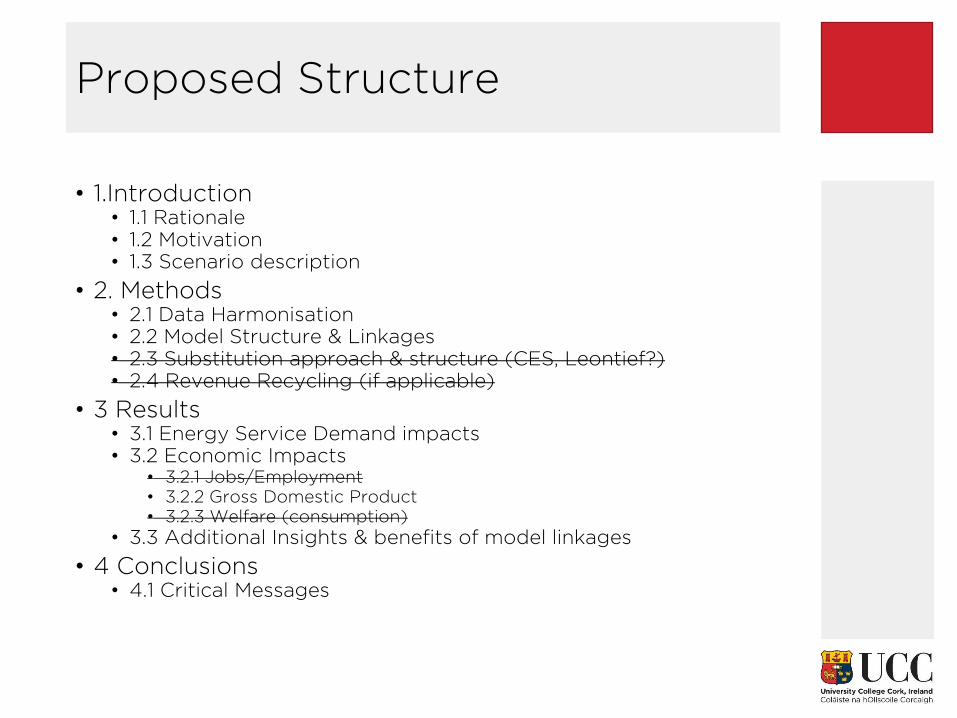
Proposed Structure
• 1.Introduction • 1.1 Rationale • 1.2 Motivation • 1.3 Scenario description
• 2. Methods • 2.1 Data Harmonisation • 2.2 Model Structure & Linkages • 2.3 Substitution approach & structure (CES, Leontief?) • 2.4 Revenue Recycling (if applicable)
• 3 Results • 3.1 Energy Service Demand impacts • 3.2 Economic Impacts
• 3.2.1 Jobs/Employment
• 3.2.2 Gross Domestic Product
• 3.2.3 Welfare (consumption)
• 3.3 Additional Insights & benefits of model linkages
• 4 Conclusions • 4.1 Critical Messages

Outline
• Rationale
• New User learning experiences with ETSAP TIAM & Macro Stand Alone
• MACRO is not “a Pig” anymore
• Macroeconomic impact of decarbonising of the Energy System
• ETSAP-TIAM MSA Global Energy System Modelling
• Developing on setup experience with Irish-TIMES-MSA
• Initial scenario analysis results
• Work in Progress
• Focus on results to 2050
• Next Steps

Why Model Energy System Macro-economy Feedback?
-10.00%
-5.00%
0.00%
5.00%
10.00%
15.00%
1980 1990 2000 2010
Pe
rce
nta
ge
Ch
an
ge
Global % Changes World - TPER
World - GDP
• Energy Consumption ~ Economic Growth Relation
• Growth drives our models, but what are the scale of feedbacks?
• Decarbonising Energy System
• Increased capital investment in new energy system
• What is the feedback effect on GDP and consumption?
• Welfare? Jobs?
-10.00%
-5.00%
0.00%
5.00%
10.00%
15.00%
1980 1990 2000 2010
Pe
rce
nta
ge
Ch
an
ge
Ireland Ireland - TPER
Ireland - GDP

ETSAP-TIAM model description
Built with the TIMES model generator
• The Integrated MARKAL-EFOM System of IEA-ETSAP
• Linear programming bottom-up energy system model
• Integrated model of the entire energy system
• Prospective analysis on medium to long term horizon (2100 – results to 2050)
• Demand driven (exogenous) in physical units
• Partial and dynamic equilibrium (perfect market)
• Optimal technology selection
• Minimize the total system cost
• Environmental constraints
• 15 Region Model
• Price-elastic demands in the TIMES-ED version
• Not included in MSA runs

ETSAP-TIAM Reference Energy System
Source: Loulou, R., Labriet, M., 2008. ETSAP-TIAM: the TIMES integrated assessment model Part I: Model structure. Comput. Manag. Sci. 5, 7–40. doi:10.1007/s10287-007-0046-z

ETSAP-TIAM MSA (TMSA)
Macro Stand Alone
• Single-sector, multi-regional, inter-temporal general equilibrium model which maximises regional utility.
• The utility is a logarithmic function of the consumption of a single generic consumer.
• Production inputs are labour, capital and energy.
• Energy demand from ETSAP-TIAM model.
• MSA Re-estimates Energy Service Demands based on energy cost
Macro-Economy
MACRO Model
Energy Sector
-TIMES
Energy Costs
Energy Demand
Labour
Consumption
Investment
Capital

Data Harmonisation
• Base year GDP
• Projected GDP growth Rates
• Harmonise between demand drivers
• Regional Elasticity of Substitution?
• Regional Capital Shares
• Negishi Weights
Parameter Description TM_ESUB(r) Elasticity of substitution TM_GDP0(r) GDP in the first period TM_GR(r,y) Projected annual GDP growth in per cent TM_KGDP(r) Initial capital to GDP ratio TM_KPVS(r) Initial capital value share in all production factors

Scenario Outline IPCC AR5 CO2 Mitigation paths
Source: IPCC, 2014. Climate Change 2014: Mitigation of Climate Change, Fifth Assessment Report of the Intergovernmental Panel on Climate Change. Cambridge University Press, Washington, USA.
• Two thirds of emissions are from the energy system
• Radically Decarbonised Energy System

Scenario Outline
• BASE • Reference energy system, least cost optimal without policy
constraints
• Assumes rational optimising choices: not equal to business as usual
• IPCC • BASE with an upper bound set on CO2 emissions to achieve the
2degree target set in the IPCC AR5 WG3 mitigation report
• IPCC MSA • IPCC with MSA active to re-estimate energy service demands relative
to available capital & investment
• REG • BASE with an upper bound set on REGIONAL CO2 emissions in line
with recent UN climate summit pledges
• Developed Countries -80% CO2 by 2050, Developing range of limited constraints peak by 2040, Energy Exporters no constraints.
• Global CO2 Targets are not explicitly met
• REG MSA • REG with MSA active to re-estimate energy service demands relative
to available capital & investment
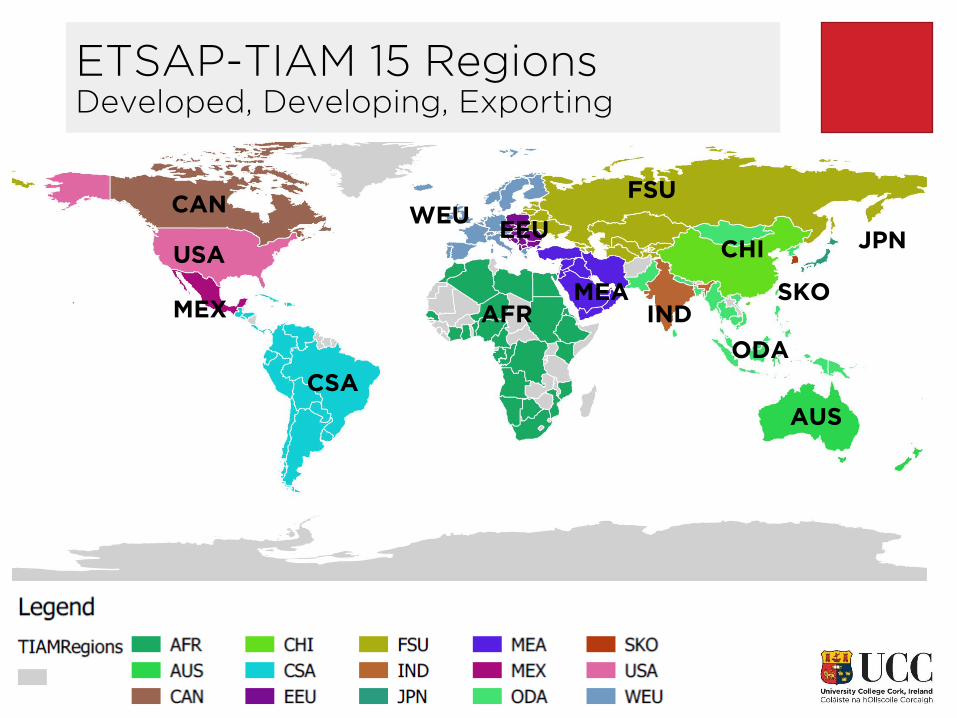
ETSAP-TIAM 15 Regions Developed, Developing, Exporting
AFR
CAN
USA
MEX
CSA
WEU EEU
MEA IND
FSU
CHI
SKO
JPN
AUS
ODA

Sectoral Energy Consumption
0
100
200
300
400
500
600
700
BASE IPCC IPCCMSA
REG REGMSA
BASE IPCC IPCCMSA
REG REGMSA
2020 . 2050
En
erg
y C
on
su
mp
tio
n
(EJ -
Exajo
ule
s)
Transport
Residential
Industry
Commercial
Agriculture

Demand Decoupling
0
200
400
600
800
1000
1200
BA
SE
IPC
C M
SA
RE
G M
SA
BA
SE
IPC
C M
SA
RE
G M
SA
BA
SE
IPC
C M
SA
RE
G M
SA
BA
SE
IPC
C M
SA
RE
G M
SA
CHI USA CHI USA
2020 2050
Mil
lio
n T
on
ne
s (
Mt)
DEM Non-ferrous metals [INF]
DEM Iron and Steel [IIS]
0
500
1000
1500
2000
2500
3000
3500
4000
BA
SE
IPC
C M
SA
RE
G M
SA
BA
SE
IPC
C M
SA
RE
G M
SA
BA
SE
IPC
C M
SA
RE
G M
SA
BA
SE
IPC
C M
SA
RE
G M
SA
CHI USA CHI USA
2020 2050
Billio
n V
eh
icle
km
/y
r
Road Medium Trucks Demand [TRM]
Road Light Vehicle Demand [TRL]
Road Heavy Trucks Demand [TRH]
Road Commercial Trucks Demand [TRC]
Road Bus Demand [TRB]
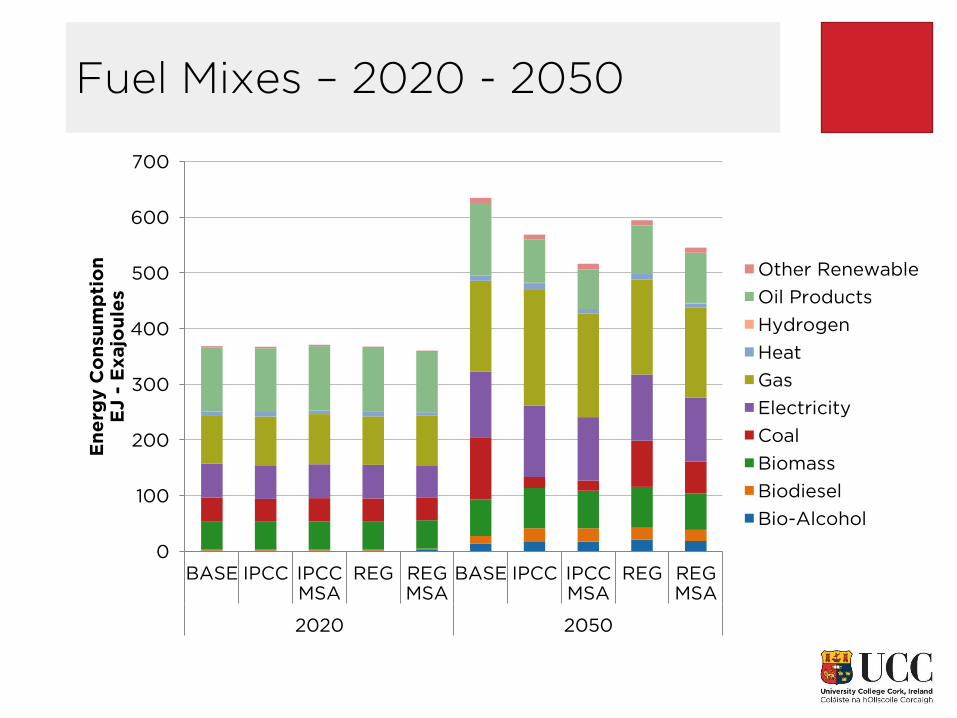
Fuel Mixes – 2020 - 2050
0
100
200
300
400
500
600
700
BASE IPCC IPCCMSA
REG REGMSA
BASE IPCC IPCCMSA
REG REGMSA
2020 2050
En
erg
y C
on
su
mp
tio
n
EJ -
Exajo
ule
s
Other Renewable
Oil Products
Hydrogen
Heat
Gas
Electricity
Coal
Biomass
Biodiesel
Bio-Alcohol
Regional Fuel Mixes
0
50
100
150
200
250B
AS
E
IPC
C
IPC
C M
SA
RE
G
RE
G M
SA
BA
SE
IPC
C
IPC
C M
SA
RE
G
RE
G M
SA
BA
SE
IPC
C
IPC
C M
SA
RE
G
RE
G M
SA
BA
SE
IPC
C
IPC
C M
SA
RE
G
RE
G M
SA
CHI USA CHI USA
2020 2050
En
erg
y C
on
su
mp
tio
n
(EJ -
Exajo
ule
s)
Other Renewable
Oil Products (includessynthetic oil)
Heat
Gas
Electricity
Coal
Biomass (excludes biofuels)
Biodiesel
Alcohol (ethanol, methanol,from biomass or not)

Carbon Emissions Regional Burden Sharing Scenario
0
10
20
30
40
50
60
BASE IPCC IPCCMSA
REG REGMSA
BASE IPCC IPCCMSA
REG REGMSA
2020 2020
CO
2 E
mis
sio
ns
(Gt)
WEU
USA
SKO
ODA
MEX
MEA
JPN
IND
FSU
EEU
CSA
CHI
CAN
AUS
AFR
Redistribution of Country Burden Shares – Developing Country shares change

GDP Change 2020, 2050 (*Initial Results – trends rather than specifics)
-5.0
-4.0
-3.0
-2.0
-1.0
0.0
1.0
2.0
3.0
4.0
% G
DP
Ch
an
ge
pe
r y
ear
2020 IPCC MSA
2020 REG MSA
2050 IPCC MSA
2050 REG MSA
Energy Exporters
Industrial Developing Developed West
Conclusions
• National CO2 emissions are typically lower in MSA Runs as a result of demand adjustments.
• between -5 and -13% by 2050
• Loss of GDP can be as high and potentially disruptive by 2050.
• National effects are dependent on burden sharing rules
• Short term economic gains are to be made in energy efficiency measures.
• MSA displays non-linear, sectorally non-uniform demand responses that cannot be captured with demand price elasticities.
• Critical Messages – Practical tips using MSA setup • Synch time periods to 11p
• Avoid volatile high marginal costs
• Remove all dummies
• Ensure ALL sensible constraints (I know this should go without saying…)
• Next Steps • Regional Calibration & Testing Ph2
• Regional Sensitivity to Negishi Weights
• Regional Sensitivity to Elasticity of Substitution

Thank You
www.ucc.ie/energypolicy