modelling how information and communication technologies ...607698/fulltext01.pdf · denna...
TRANSCRIPT

Master of Science Thesis KTH School of Industrial Engineering and Management
Energy Technology EGI-2012-126MSC Division of Applied Thermodynamics and Refrigeration
SE-100 44 STOCKHOLM
Modelling How Information and Communication Technologies Can
Change the Energy Use in Stockholm’s Södermalm District
Jonathan Linder Gottfriedz
Sven Wolf

-2-

-3-
Master of Science Thesis EGI: 2012-126MSC
Modelling How ICT Can Change the Energy Use in Stockholm’s Södermalm
District
Jonathan Linder Gottfriedz
Sven Wolf
Approved
2013-02-21
Examiner
Per Lundqvist
Supervisor
Jaime Arias
Commissioner
Contact person

-4-
Abstract This master’s thesis is a contribution to the cross-disciplinary research project SitCit that addresses the issue of urban sustainable development. It aims to investigate how Information and Communication Technology (ICT) can be used to reduce the energy use and increase the energy demand flexibility in Stockholm’s Södermalm district.
This study uses a bottom-up approach to model how ICT can change the energy use. The basis of the approach is the human activities that cause demand for services, delivered by different appliances, which in turn use energy to provide these services. The human activities are represented by Human Activity Systems (HAS) and the different appliances by Energy Usage Systems (EUS).
A method for defining an energy system with a bottom-up approach was developed and used to build a conceptual model. Relevant ICT solutions were thereafter identified and described both technically and how they interact with the HAS, the EUS and the surroundings to change the energy use by means of automation, information and persuasion. It was also assessed how and when planning and implementation of ICT can be achieved, and who are the involved actors.
The findings were compiled into an integrated qualitative model which was split into two parts, one that illustrates the interrelatedness of the different components expressed in terms of information flows, and one that shows who are the actors involved in the strategies to implement the various ICT solutions.
Weaknesses in the bottom-up approach were identified and changes were suggested. The HAS should be split into human activities and what can be denoted “human” since most information flows due to ICT are not with the actual activities. The human can communicate through and with ICT. He or she can decide the activities and how much of them should be carried out, and is also the most important actor when it comes to the implementation of ICT. Furthermore, it was found that the coupling of HAS and EUS is weak, and time-use data and actual measurements on the energy use is therefore needed as input to a quantitative model.
This study explains and illustrates how different ICT solutions work and how they can be implemented to change the energy use in an urban area. Together with the improvements in the bottom-up approach, and the methodological discussion, it can be used as groundwork for a quantitative model, or as a tool for decision makers to create and implement a strategy for urban sustainable development.

-5-
Sammanfattning Denna masteruppsats är ett bidrag till det tvärvetenskapliga forskningsprojekt SitCit som handlar om hållbar urban utveckling. Det syftar till att undersöka hur informations-och kommunikationsteknik (ICT) kan användas för att både minska energianvändningen på Södermalm i Stockholm, och göra den mer flexibel.
Hur ICT kan användas för att påverka energianvändningen modelleras nerifrån och upp. Utgångspunkten är att energianvändningen kan härledas från att mänskliga aktiviteter efterfrågar tjänster som i sin tur kräver energi för att produceras. I modellen representeras de mänskliga aktiviteterna av mänskliga aktivitetssystem (HAS) och de olika energikrävande apparaterna och transportmedel av energianvändningssystem (EUS).
En metod för att definiera ett energisystem som modelleras nerifrån och upp utvecklades och användes för att bygga en konceptuell modell. Relevant ICT kartlades och undersöktes tekniskt, det vill säga hur ICT kan påverka energianvändningen genom automatisering, informering och övertalning. Hur informations-och datautbytet sker mellan de olika delsystemen ICT, HAS och EUS, och med omgivningen, undersöktes och därefter utreddes hur de olika informations-och kommunikationsteknologierna kan implementeras.
Detta användes sedan för att utveckla en integrerad kvalitativ modell som delades upp i två delar. En del som sammanställer de upptäckta sambanden mellan de olika delsystemen och omgivningen uttryckt i informationsflöden, och en del som visar vilka aktörer som är involverade i de olika implementeringsstrategierna för de kartlagda informations-och kommunikations-teknologierna.
Svagheter i metoden att modellera energianvändningen nerifrån och upp med HAS och EUS upptäcktes och förbättringar föreslogs. HAS bör delas upp i mänskliga aktiviteter och själva människan, som utför aktiviteter, eftersom det mesta av informationsutbytet sker med en människa. En människa kan kommunicera genom och med ICT, och välja vilka aktiviteter som utförs och hur mycket av dem. Människan som utför aktiviteter som i förlängningen kräver energi är också den viktigaste aktören för att ICT ska kunna implementeras.
Dessutom visade det sig att kopplingen mellan HAS och EUS är svag, och att tidsanvändningsdata och mätningar av faktisk energianvändning behövs som input till en kvantitativ modell.
Detta arbete beskriver och illustrerar hur olika ICT-lösningar fungerar och hur de kan implementeras för att påverka energianvändningen i en stad. Tillsammans med en vidareutvecklad metod för att modellera ett energisystem nerifrån och upp, så kan det användas för att utveckla en kvantitativ modell eller för att beslutsfattare ska kunna utveckla och genomföra en strategi för hållbar urban utveckling.

-6-
Acknowledgements We would like to thank professor Per Lundqvist, associate professor Örjan Svane and Jaime Arias for sharing their experience and expertise and providing very valuable input to our work.
We would also like to thank Omar Shafqat and Aleh Kliatsko who have made available their support in a number of ways during the completion of this project. They have among other things suggested changes that have improved our work, provided relevant literature and organized meetings.
Jonathan Linder Gottfriedz and Sven Wolf
Stockholm, December 2012

-7-
Table of Contents Abstract .......................................................................................................................................................... 4
Sammanfattning ............................................................................................................................................ 5
Acknowledgements ...................................................................................................................................... 6
Table of Tables ............................................................................................................................................. 9
Table of Figures ............................................................................................................................................ 9
Abbreviations and Acronyms ................................................................................................................... 10
PART I ................................................................................................................................ 11
Introduction .................................................................................................................................... 12 1
1.1 The Energy and Climate Challenge .................................................................................... 12
1.2 Urban Energy and CO2 Projections ................................................................................... 13
1.3 SitCit ........................................................................................................................................ 13
1.4 Aims and Objectives ............................................................................................................. 16
1.5 The Södermalm Seed ............................................................................................................ 17
Methodology ................................................................................................................................... 22 2
2.1 What is a System? .................................................................................................................. 22
2.2 What is a Model? ................................................................................................................... 25
2.3 Modelling Approach ............................................................................................................. 27
2.4 System and Environment Inclusion Criteria ..................................................................... 28
2.5 Complexity and System Levels ............................................................................................ 29
Modelling Process .......................................................................................................................... 31 3
3.1 HAS and EUS ........................................................................................................................ 31
3.2 System Boundary for Human Activities ............................................................................. 31
3.3 Actors of the System ............................................................................................................. 33
3.4 Conceptual Model ................................................................................................................. 34
3.5 Changing the Approach ........................................................................................................ 42
PART II ............................................................................................................................... 45
New Approach ............................................................................................................................... 46 4
4.1 New Conceptual Model ........................................................................................................ 46
Qualitative Model........................................................................................................................... 49 5
5.1 ICT for Multi Dwellings and Get to Work ........................................................................ 49
5.2 ICT Solutions for Multi Dwellings ..................................................................................... 50

-8-
5.3 ICT Solutions for Get to Work ........................................................................................... 57
5.4 Social Media ............................................................................................................................ 64
5.5 Demand Flexibility ICT ........................................................................................................ 65
5.6 Integrated Qualitative Model ............................................................................................... 67
Discussion ....................................................................................................................................... 73 6
6.1 Practical Modelling Considerations .................................................................................... 73
6.2 Human Energy Behaviour.................................................................................................... 77
6.3 Ethical Consideration............................................................................................................ 78
6.4 Methodological Critique ....................................................................................................... 80
6.5 No Quantitative Model ......................................................................................................... 81
Conclusions..................................................................................................................................... 83 7
Future Studies ................................................................................................................................. 85 8
References ................................................................................................................................................... 86

-9-
Table of Tables Table 1: Time schedule of implementation. ........................................................................................... 72
Table of Figures Figure 1: Map of Stockholm’s Södermalm district. Source: (Stockholms stad, 2011) ..................... 17 Figure 2: A basic concept of a system. .................................................................................................... 23 Figure 3: Conceptual model of the energy system of Stockholm’s Södermalm district integrated with ICT. ...................................................................................................................................................... 35 Figure 4: Conceptual model, for the new approach, of the energy system of Stockholm’s Södermalm district integrated with ICT.................................................................................................. 47 Figure 5: Information flows between subsystems and surroundings for intelligent HVAC. .......... 51 Figure 6: Information flows between subsystems for smart lighting. ................................................ 52 Figure 7: Information flows between subsystems and surroundings for smart metering. .............. 53 Figure 8: Information flows between subsystems for a smart kitchen. .............................................. 55 Figure 9: Information flows between subsystems and surroundings for smart laundry. ................. 56 Figure 10: Information flows between subsystems for standby management. ................................. 57 Figure 11: Information flows between subsystems and surroundings for teleworking ................... 58 Figure 12: Information flows between subsystems and surroundings for a transport information system. .......................................................................................................................................................... 60 Figure 13: Information flows between subsystems and surroundings for ICT improved ride sharing. ......................................................................................................................................................... 62 Figure 14: Information flows between subsystems and surroundings for ICT improved congestion tax. ............................................................................................................................................ 63 Figure 15: Information flows between subsystems and surroundings for demand flexibility ICT. ....................................................................................................................................................................... 67 Figure 16: Integrated qualitative model of information flows. ............................................................ 70 Figure 17: Integrated qualitative model of the implementation strategies and the actors. .............. 71 Figure 18: Mean perceptions of energy used or saved for 15 devices and activities. Source: (Attari, DeKay, Davidson, & Bruine de Bruin, 2010, p. 16056) ....................................................................... 77

-10-
Abbreviations and Acronyms CSR Corporate social responsibility
ECS Energy Committee of Södermalm
EIC Energy information company
ESR Energy saving reward
EUS Energy usage system
GDP Gross domestic product
HAS Human activity system
HEM Home energy management
HVAC Heating, ventilation and air conditioning
ICT Information and communication technology
IPCC Intergovernmental Panel on Climate Change
LHA Light, heat automation
NFC Near field communication
NPV Net present value
PPP Public-private partnership
PR Public relations
SCC Södermalm car sharing company
SitCit Situations of opportunity in the growth and change of three Stockholm city districts
TIS Traffic information system
TMC Traffic message channel

-11-
PART I

-12-
Introduction 1
1.1 The Energy and Climate Challenge
There is a general consensus amongst scientists that the increase in global temperature has to be limited to 2 ºC over preindustrial levels in order to avoid dangerous climate change that would drastically increase the risk of extinction of many animals and plants, the appearance of extreme weather conditions, and the risk of abrupt or irreversible changes (IPCC, 2007b).
The Fourth Assessment Report by the Intergovernmental Panel on Climate Change (IPCC) concluded that the increase in global average temperature is very likely due to the observed increase in anthropogenic greenhouse gas concentrations (IPCC, 2007b). The source of about 65 % of global anthropogenic greenhouse gas emissions is energy production1 (IEA, 2011). A significant reduction of emissions from burning fossil fuels is hence crucial in order to stabilize the increase in global average temperature at 2 ºC. Economic development is still tied to emission growth and the reduction in intensity of emissions (the ratio of greenhouse gas emissions produced to the gross domestic product, GDP) has not yet been able to offset the effect of increasing global GDP (Blodgett & Parker, 2010) (Pizer, 2005). Emissions can be reduced either through economic downturn, as observed in Europe as a consequence of the financial crisis (EEA, 2010), or through decreasing intensity of emissions. For obvious reasons, the latter ways is what climate change mitigation efforts have focused on. The intensity of emissions can be reduced through energy efficiency improvements and the increased share of energy from renewable sources (IPCC, 2007a).
In 2009, the Swedish Government (2009) presented an integrated climate and energy policy with clearly defined targets for 2020 and a vision of a “(…) sustainable resource-efficient energy supply and no net emissions of greenhouse gases in the atmosphere”. The climate and energy targets by 2020 are:
• 402 % reduction in greenhouse gas emissions • At least 50 % renewable energy • 20 % more efficient energy use • At least 10 % renewable energy in the transport sector
The underlying concept of the policy was that Sweden with its ambitious climate and energy targets would show leadership to meet the climate change (Regerinskansliet, 2009).
In July 2010 the Government of Sweden gave the Swedish Environmental Protection Agency the task of providing supporting documents for a Swedish roadmap to achieve the vision of no net emissions of greenhouse gases by 2050 (Naturvårdsverket, 2012). The compilations of earlier findings in the progress report indicate that Sweden has a greenhouse gas emission reduction
1 The term: ”energy production” is frequently used in the literature. The 1st law of thermodynamics states however that energy can be neither created nor destroyed i.e. energy can’t be produced. 2 As compared to 1990 levels
-13-
potential of 70 – 90 % to 2050 (Naturvårdsverket, 2012). This cut in emissions is similar to the objective of an 80 % reduction that the European leaders and G8 announced in 2009 - a radical transition that was found feasible if the energy system is changed fundamentally (ECF, 2010).
The major cut in greenhouse gas emissions in order to limit the increase in global average temperature to 2 ºC over preindustrial levels will require a broad implementation of mitigation measures among all sectors that emit greenhouse gases since findings presented in the IPCC Fourth Assessment Report (2007a) show that: “No one sector or technology can address the entire mitigation challenge”. A comprehensive strategy is needed and the implementation of new clean technologies and improved energy infrastructure has to be combined with societal, institutional, governmental and policy transitions in order to avoid dangerous climate change.
1.2 Urban Energy and CO2 Projections
Urban areas are the major contributor to energy-related CO2 emissions and their share of the global energy-related CO2 emissions is expected to increase due to continuing urbanization over the next decades (IEA, 2008). Half of the world’s population lives in cities but cities account for 60 % of the world energy use (IEA, 2008). Cities generally use more coal, gas and electricity, but less oil than global average, which causes their share of energy-related CO2 emissions to be even higher than their share of energy (IEA, 2008). Even though the urban annual growth rate is expected to decline a little to 2050, as compared to record growth in the second half of the last century, the percentage of the world population that lives in urban areas is expected to be 59 % by 2030 and 69 % by 2050 (UNPD, 2008). According to scenarios developed by the IEA (2008), urban areas will account for 73 % of the energy use, but 76 % of the energy-related CO2 emissions by 2030, figures that most likely will be even higher in 2050 due to the urbanization. Both the energy use and the energy-related CO2 emissions will increase in the future according to IEA (2008) scenario. This is an unsustainable development and the decrease in final energy use and the implementation of technical solutions with lower emissions from urban areas will be crucial in order to limit the increase of the global average temperature to 2 ºC.
1.3 SitCit
SitCit is a cross-disciplinary research project that was initiated to address the issue of urban sustainable development. The project was formulated as a challenge: The energy use of three Stockholm City districts with contrasting properties is to be reduced to a sustainable level – in fifty years it should be 2 kW per person on average (Svane, Situations of Opportunity in the Growth and Change of three Stockholm City Districts - everyday life, built environment and transport explored as Energy Usage Systems and Actor's Networks, 2008). Energy is used in various forms and for many different activities in cities. Since the transition needed for urban sustainable development would involve influencing all those different aspects, the scientific approach to address the problem has to involve planners, political scientists, energy and environmental engineers, system analysts, sociologists and practitioners (Svane, Situations of Opportunity in the Growth and Change of three Stockholm City Districts - everyday life, built
-14-
environment and transport explored as Energy Usage Systems and Actor's Networks, 2008). SitCit advocates a socio-technical system perspective and the collaboration among planners, researchers with various backgrounds and practitioners in order to address the full complexity of the problem.
Furthermore, the SitCit project methodology is based on two main approaches - what to change and by whom, that each has its main research question (Svane, Situations of Opportunity in the Growth and Change of three Stockholm City Districts - everyday life, built environment and transport explored as Energy Usage Systems and Actor's Networks, 2008):
• What elements of the physical, institutional and socio-cultural city structure and of the life could be changed, how can change be assessed and which is the possible extent of change?
• Who are the agents of change, in what forms could they co-operate and how could change be accomplished? A change that is only favourable when these two aspects merge with the third one:
• When in the development of the city could a group of stakeholders, utilizing a reasonable input of resources, control its future development?
The visions of a sustainable city in policy documents and in research are often very generic and can therefore be difficult to apply in practice e.g. to transform the energy use of a specific city like Stockholm to a sustainable level. Another difficulty for city planners is that most visions don’t state explicitly what time frame they intend. A lot of information about existing urban structures and their future development can be found in comprehensive city plans, but they are generally based on trend exploration and thus rather address the inertia against change than how it can be reduced (Svane, et al., 2009). Development of a city based on trend extrapolation does often stand in conflict to the long-term vision of a city. The city plans may e.g. be insufficient in relation to the urgency and magnitude of the challenge of global warming leading to decisions that might be favourable in the short run, but that decrease the quality of life of future generations. In the SitCit project the transformation itself is the object of study - an approach trying to bridge the gap between the present situation and the long-term vision i.e. the start and end points of a process of change (Svane, et al., 2009).
1.3.1 The SitCit Methodology The methodology of the SitCit project is based on the concept of Situations of Opportunity, which are shorter time periods when the inertia against change is low (Svane, et al., 2009). Through the concept it should be possible to identify periods within the time frame when change is feasible. Scenarios can be developed for such periods combining What to change and Who should take action. Thereafter the scenarios should be explored as a process of change to answer How planning and implementation are accomplished and be evaluated i.e. How much they contribute towards the vision (Svane, et al., 2009).

-15-
The SitCit project has a focus on the user-side of energy systems and the questions that it attempts to answer is what can change in building and transport systems and user habits, how great are the potentials and who are the actors (Svane, Situations of Opportunity in the Growth and Change of three Stockholm City Districts - everyday life, built environment and transport explored as Energy Usage Systems and Actor's Networks, 2008).
The subject of planning for urban sustainable development is approached through the use of a future studies perspective based on scenario building and backcasting. The research strategy is a multiple case study of three Stockholm districts for which scenarios of future situations of opportunities are elaborated. The three Stockholm district with contrasting properties that were chosen was Rinkeby-Kista, Bromma, and Södermalm. The Seeds of transition used in the SitCit project were (Lewakowski, Sølgaard Bang, & Svane, 2010):
Rinkeby-Kista: What if the planned renewal of the city district Rinkeby-Kista had the low carbon, low energy society as a guiding vision besides the need for changing roofs and appliances and addressing socioeconomic problems?
Bromma: What if the residents of Bromma were prepared to in part substitute their use of private cars for a car pool combines with improved public transport?
Södermalm: What if ICT was innovatively used in buildings and transport systems to automatically control energy use as well as to inform and persuade users to use less energy?
1.3.2 The Energy Objective and the Climate Goal The future Situations’ explored in the SitCit project could support planners with research-based knowledge in order to achieve the goal of limit global warming to 2 ºC. Energy and climate change are closely tied to each other and energy efficiency improvements has hence for a long time been identified as one of the most important means to mitigate climate change. The SitCit project is highlighting the demand side of energy systems as compared to the traditional approach of energy system analysis that is largely supply-oriented i.e. focuses on management of energy conversion, production and distribution and final use of energy in the form of energy carriers, as described by Jonsson, et al (2011). The specific overall objective of SitCit is that the average energy use is reduced to 2 kW per person for the three Stockholm City districts with contrasting properties, which is considered sustainable. The overall objective has its roots in the vision of a 2 kW Society introduced by ETH Zürich in 1998.
The objective has to be stated in terms of a low average energy use rather than in terms of emissions since the project focuses on the demand side of the energy system and the research for how emissions related to the production of the energy can be reduced is hence not within the scope of SitCit. Nevertheless the 2 kW objective implies an emission target of not more than 1 ton CO2 per person and year (Lewakowski, Sølgaard Bang, & Svane, 2010). A reduction of the final energy use to 2 kW per person on average on the demand side will not automatically mean that the average emissions are 1 ton CO2 per person and year. A huge technical transition on the production side and of the energy infrastructure towards higher energy efficiency and increased

-16-
use of renewables is crucial in order to achieve the overall goal of drastically reduced emissions to limit global warming.
1.3.3 Participants of SitCit The SitCit project started in the autumn of 2007 and will likely end in the autumn of 2012. The core team of SitCit has members from the KTH departments of Urban Planning and Environment and Energy Technology respectively and Associate Professor Örjan Svane is the project leader (Svane, Situations of Opportunity in the Growth and Change of three Stockholm City Districts - everyday life, built environment and transport explored as Energy Usage Systems and Actor's Networks, 2008). Colleagues from other KTH departments and ETH Zürich, the University of West of England and Aalborg University have also been involved (Løbner & Sølgaard Bang, 2011) (Svane, et al., 2009). The funding of € 1.5 million comes from three governmental sources: The Swedish Energy Agency, The Swedish Research Council for Environment, Agricultural Sciences and Spatial Planning (FORMAS) and the Swedish Governmental Agency for Innovation Systems (Vinnova) (Svane, et al., 2009).
1.3.4 Current Status of the Project The research is in its final stage where the qualitative studies of explored scenarios have answered What to change, Who should take action and How planning and implementation are accomplished. The last question in the methodology based on the concept of Situations of Opportunity is How much the scenarios can contribute to the vision i.e. the qualitative result from earlier findings needs to be quantified, a question that this report aims to answer for the Södermalm district.
1.4 Aims and Objectives
The main objective of this work is to answer the question:
With how much can ICT reduce the energy use in the Stockholm’s Södermalm district to 2060?
The aim of this study is to:
Unite the established scenarios and qualitative studies of previous works within the frame of the SitCit project and develop a tool for quantifying the outcome of the different scenarios.
The SitCit project will be expanded by a model able to test the scenarios in order to get numerical figures on how information and communication technology (ICT) can change the energy use in Södermalm in terms of reduced average energy use and increased demand flexibility3. The model should be based on earlier qualitative research done by Løbner, et al., (2011) and Lewakowski, et al., (2010). Furthermore understanding the model should be straightforward, it should also be possible to run different scenarios in the model and to add new features or input with ease.
As a part of the SitCit project, this report aims to contribute to strengthen incentives of city planners and other decision makers to adapt the findings from the project, in order to create and 3 Demand flexibility: possibility to shift consumption to reduce peak load, to balance renewable energy, increase base load, and for consumers to benefit from times when energy prices are low.

-17-
implement a strategy for urban sustainable development. As described in the report by IPCC (2007a), all sectors that emit greenhouse gases directly or indirectly must undergo a radical transition to limit the increase in global average temperature to 2 ºC.
1.5 The Södermalm Seed
In order to understand the Södermalm Seed, basic demographic, behavioural and geographical information of the Södermalm district, as well as a short introduction to what ICT is all about, is provided below.
1.5.1 Södermalm Location and Population With its 118 5624 inhabitants, Södermalm is Stockholm’s largest city district in terms of population (Stockholms stad, 2012b). The district of Södermalm consists of the areas Södra Hammarbyhamnen, Södermalm, Långholmen and Reimersholme. It extends over an area of 955 ha of which 750 ha is land and 205 ha is water. Södermalm has a very high population density of 158 inhabitants per ha, and the population density is also expected to increase (Stockholms stad, 2012b). The geographical location of the different areas is shown in Figure 1.
Figure 1: Map of Stockholm’s Södermalm district. Source: (Stockholms stad, 2011)
1.5.2 Buildings The building stock of Södermalm is characterized by multi-dwelling buildings of about 6-7 storeys that stand for about 62 % of all buildings (Stockholms stad, 2012b). A considerable amount of the multi-dwellings contain commercial facilities on the street level. The main building types in the rest of the stock are single-family houses, office and commercial buildings, and institutional buildings (Stockholms stad, 2012b). The existing building stock of Södermalm is not expected to increase significantly over the next 50 years, since current buildings have a lifetime that exceeds the time period of interest (Svane, et al., 2009). There have been few new
4 As of 2010-12-31

-18-
constructions over the last years, except for the Hammarby Sjöstad district which is now in the end phase of the development process, but less is anticipated to 2060. Existing plans prohibit the redevelopment of green space and the public opinion is also against such a change. The stated characteristics of the Södermalm building structure imply that there is a great inertia against change. Although some energy efficiency improvements can be made in situations of reconstructions or refurbishments, where the inertia against change is low, the major part of energy reduction has to come from non-structural changes, which makes the increased use of information and communication technology (ICT) especially interesting for the district of Södermalm.
1.5.3 Transportation Södermalm district has an extensive public transport system. Södermalm has two metro lines that together connect six stations on Södermalm. There are also four commuter rail lines going through one commuter rail station, and several bus lines as well as a light rail line and a suburban rail line, serving the inhabitants of Södermalm, and connecting different inner city districts to the city suburbs. There are several initiatives on how the Södermalm public transport system can be improved further, of which the reconstruction of Slussen, one of the main hubs for public transport in Stockholm, and the extension of the blue line from Kungsträgården through Södermalm to Nacka, has received the greatest attention in media recently. The other initiatives can be found in the comprehensive plan for the city of Stockholm (Stockholms stad, 2010). There are a number of bike routes on Södermalm, and a community bicycle program has been implemented successfully. Walking as a mean of transport is facilitated by the generally short distances resulting from the dense urban structure, the wide street pavements and pedestrian zones. Motorized private transport is however facing problems. Although the people of Södermalm demonstrate a low car ownership with an average of 172 registered cars per 1000 inhabitants, as compared to Stockholm as a whole with 227 cars per 1000 inhabitants (192/1000 in the inner city), the capacity of the road traffic infrastructure is insufficient (Carlsson-Kanayama, Eriksson, & Henriksson, 2001, p. 11). A lot of traffic passes through Södermalm, and traffic congestion during rush hours is a recurring problem. The noise and air pollution due to the serious traffic is at some times, on roads with a lot of traffic like Hornsgatan, so severe that the EU directive on air quality requirements could not be met. To cope with the problem of capacity deficit, the traffic load in the city has been reduced through the introduction of a congestion tax and the building of the northern and southern link as a part of the Stockholm ring road. The traffic problems do however remain and may become more severe in the future since the transport demand is expected to increase. The district of Södermalm is made up mainly of islands, and 18 bridges are used to connect Södermalm to other parts of the city (Carlsson-Kanayama, Eriksson, & Henriksson, 2001, p. 11). A big challenge for the Stockholm transportation system is the lack of available space. There are however several initiatives and long gone plans, like the Stockholm bypass, on how to improve the infrastructure for traffic in the city of Stockholm (Stockholms stad, 2010). Information and communication technology together

-19-
with smart technical solutions may be used to reduce the traffic load and the pollution associated with it.
1.5.4 The People of Södermalm The Södermalm district is home to people with many different backgrounds and there is a wide age distribution. Even though a lot of young people live in Södermalm, the mean age is 405 years, which is the second highest mean age among the Stockholm districts. The people of Södermalm have a high level of education on average and the unemployment rate is low. There are also mainly middle and high income demographic groups in Södermalm (Stockholms stad, 2010).
The inhabitants of Södermalm have a high level of environmental concern. A study of the environmental attitudes of the inhabitants of Södermalm showed that the majority of people (65,6 %) gave a score of 4 or 5 when asked how they rated the seriousness of environmental problems, where the scores ranged from 1, not serious at all, to 5, very serious (Carlsson-Kanayama, Eriksson, & Henriksson, 2001, p. 27). The study did also reveal that the inhabitants of Södermalm identified that energy conversion, recycling and reducing the use of private cars as the most important activities to protect the environment. The study by Carlsson-Kanayama, et al., (2001) is a few years old. It is likely that the environmental awareness has changed since then, but if it has followed the general development, it would rather be higher than lower today compared to 2001.
In the 2010 communal council elections, the Swedish green party (Miljöpartiet), was the third most popular party among the people of Södermalm. The Swedish green party got 196 % of the votes in Södermalm, which is the second highest percentage of all Stockholm districts (Stockholms stad, 2012b).
The people of Södermalm are clearly environmentally engaged, but although they place a big importance on environmental issues, the average energy consumption is still high, so there may be a mismatch between attitude and behaviour. A reason could be the lack of knowledge about how much energy different activities actually represent and ICT could be used to improve the knowledge and awareness and thus contribute to a reduction in energy consumption. The implementation of ICT on a big scale in Södermalm would also be facilitated by the fact that the people of Södermalm are quite wealthy on average. Although some ICT solutions would have a negative net present value (NPV) in an early state of the product life cycle, they might still be implemented in Södermalm, since the economic incentives could be less important than environmental incentives.
5 The area Gamla Stan is included in the statistics. The population of Gamla stan is however only 3093 as compared to Södermalm with a population of 118 562, and the effect on the mean age of including Gamla Stan is therefore assumed to be negligible. 6 Statistics also include Gamla Stan, as for Footnote nr 3.

-20-
1.5.5 Information and Communication Technology ICT applications can contribute to a more energy efficient society by means of automation, information and persuasion, and do hence not require a drastic change in the physical structure of existing buildings – the following section will exemplify how (Kramers & Svane, 2011).
An important step towards an average energy use of 2 kW is to use the energy more efficiently. A lot of energy is wasted to no avail as a result of unintentional energy use. Today people might not actually ask for services, but they are still delivered (unintentional use), e.g. lights on when no one is home. Automation could be used to prevent this waste of energy and help consumers to effortlessly manage their energy use without reducing the perceived level of personal comfort or quality of life. A practical way to decrease the energy use would be to lower the indoor temperature and turn off lights and other electronic equipment in a household during night time or when no one is at home. This can of course be done manually, but it might be very time consuming and inconvenient.
ICT applications can collect and process information on occupancy, light, air quality and user behaviour to deliver the right services only when they are needed or demanded. Such applications have the ability to increase in the perceived level of comfort while at the same time reduce the overall energy use (Nest Labs, 2012) (Kramers & Svane, 2011).
Internet is very useful for accessing and exchanging information. With the rapid global increase in the use of smartphones, millions of people are always connected. ICT applications can allow users to remotely control and monitor the energy use of their homes in real time via smartphones over internet.
Information communicated through social media can increase the energy awareness and thereby reduce energy use. Social media does also enable people to share their experiences and help others to reduce their own energy use.
ICT can facilitate the working from home. If people are able to access information anywhere they become more flexible when it comes to where they work. They can e.g. work from home to a larger extent which will reduce the travel to work (Erdmann & Hilty, 2010). Some of the energy savings from less travel may however be offset by the increased use of heating and other appliances at home.
With variable pricing of energy, ICT can control washing machines and other household appliance to run at hours when prices are low, generally when demand is low. It can drastically decrease the average cost of energy for the users and also reduce peak load. Reducing peak load may have environmental benefits if peaking power plants emit more greenhouse gases per kWh than base load power plants. A flattened out demand curve may also reduce the need for excess capacity in the energy distribution systems.
Smart meters can monitor current energy use and price in real time, giving the consumer faster feedback of the actual price paid for an energy using service (GeSI, 2008). Increasing awareness of how much energy is currently used and the associated cost might reduce the average energy

-21-
use and peak load. Consumers might want to reduce e.g. thermal comfort (reduce the indoor temperature for example) to save money. This will increase the personal utility, since the allocation is more efficient if personal preferences are regarded. Some people may value money over thermal comfort, and those people are better off if they can decide their energy usage level and hence the associated costs themselves. The same argument holds for a trade-off between indirect environmental impact associated with energy production and thermal comfort. There might be people that would reduce their energy use because they value knowing that they reduce their environmental footprint more. ICT can help to bridging the gap between attitude and behaviour of the environmentally concerned people of Södermalm.
ICT applications can also enable higher energy efficiency on the energy distribution side. A so-called smart grid routes the energy in the grid in an intelligent way by two-way real-time information exchange between providers and consumers, which allows for less excess capacity (GeSI, 2008). In addition, consumers are able to sell back energy to the grid if their own power generation from solar cells, wind power etc., at some time exceeds their demand.

-22-
Methodology 2The aim with this study is to develop a tool for quantifying the outcome of the previously developed scenarios. In order to test the scenarios, a model that describes the demand side of the energy system of the Södermalm district is needed. Hereafter if the term energy system of the Södermalm district is not described explicitly, the demand side of the energy system of Södermalm is meant. This chapter will define the basic concepts in this study and what methodological approach that is used in order to answer the main objective i.e. with how much can ICT reduce the energy use in Stockholm’s Södermalm district to 2060? It will also define inclusion criteria for the Södermalm energy system, describe the complexity of the problem and answer other central methodological questions in the model development process. The methodology described here is based on the established SitCit methodology and its focus on the demand side of the energy system.
2.1 What is a System?
The term system, and more specifically energy system is used frequently in this report. It needs to be clearly specified since it is the base of the whole modelling process. So what is a system? There is no general consensus among the different system definitions found in the literature. This section will however highlight the general ideas behind the concept of a system and what is meant by a system in this report. According to Lundqvist (2012, p. 7) the world is a complex system with several subsystems that interrelate. One of these subsystems can be an energy system. Lundqvist (2012, p. 7) further argues that what generally characterizes a system is that it has a boundary and surroundings. Flows of energy, information, matter etc. that crosses the system boundary is called input or output depending on direction of the flow. Figure 2 shows a basic concept of a system.

-23-
Figure 2: A basic concept of a system.
But how is a system defined? According to Haraldsson (2004), all systems are defined by its boundaries. Then the obvious question arises: how are the boundaries defined? There may be more concrete ways to define a system. Churchman suggests that systems can be defined through an overall objective. According to Churchman (1968, p. 29):
“(…) a system is a set of parts coordinated to accomplish a set of goals”.
Objective, purpose, goal is used synonymously in the literature will hence also be used synonymously in this study.
There are more general ways to describe a system. Grant, et al., (1997, p. 6) mean that:
“In the simplest sense, a system is any set of object that interact”
Kotas (1995, p. 1) defines a system in a similar general way:
“A system is an identifiable collection of matter whose behaviour is the subject of study”
And Gustavsson, et al., (1982, p. 16) simply mean that:
“A system is a variety of components which are united into a whole7”
System components, parts or subsystems are used synonymously in the literature. They will be therefore also be used interchangeably in this study. This is also the case for the system 7 Translated from Swedish: ”Med ett system menar vi en mängd komponenter som är förenade till en helhet.”
System
Input Output
Surroundings
Sub-systems and their interrelatedness
System boundary

-24-
surroundings, which is also called the environment both in this study and in the literature in general.
It is pretty obvious that the system definitions by Grant, et al., (1997), Kotas (1995) and Gustafsson, et al., (1982) are very vague, and cannot be used easily as a base to define the specific system needed to meet the central objective of this work.
One can think of two main types of systems: natural systems and designed systems. Designed systems do usually have a purpose, or objective (Lundqvist, 2012, p. 7). The system definitions of Kotas (1995), Gustafsson, et al., (1982) and Grant, et al., (1997) would probably fit better for a natural system, whereas one can argue that a designed system, with a clear purpose, like the energy system of Södermalm, is better understood with Churchman’s definition of a system. An example of a designed energy system, could according to Lundqvist (2012, p. 7) be:
“A designed socio-technical system which through the conversion of primary energy to heat creates the services that we need in the society”8
A system can be part of the reality that we want to study, but also a representation of a real system, which only contains the components and relationships that are relevant for the study. Gustafsson, et al., (1982, p. 26) mean that the representation of the real system often is called the model and he defines the model concept in the following way:
“A model is a system that we have chosen because it represents the essential characteristics of another system”9
Sterman (1991, p. 5) defines a model in a similar way:
“Every model is a representation of a system – a group of functionally interrelated elements forming a complex whole.”
Churchman (1968) does on the contrary not make a distinction between a system as a part of the reality and a system that is a representation of the relevant components of the real system (a model). Gustafsson’s, et al., (1982), and Sterman’s (1991) division of the system into a real system and a model facilitates the analysis of the complex problem that is the subject of study in this work because it becomes more apparent what is the real energy system of Södermalm, and what is a construct, a simplified representation of the real system also called a model. The term system is generally also used for a representation of the reality in the literature. Therefore, both system and model will be used interchangeably hereafter if what Gustafsson, et al., (1982), and Sterman (1991) define as a model is meant. The real system can be seen as a black box – a system that transforms the input energy into the output i.e. heat and services, but whose complex behaviour is not fully understood. Also, a model that only captures the essential characteristics of a real system’s behaviour can be a black box if it does not explain what happens and why.
The energy system of the district of Södermalm can be described as an “organized complexity” type of system, that, as described by Grant, et al., (1997, p. 7): “(…) in which system structure 8 Translated from Swedish: ”Ett designat socio-tekniskt system som genom att omvandla högvärdig primär energi till värme skapar de tjänster och funktioner vi behöver i samhället.” 9 Translated from Swedish: ”Definitionen av modell blir därför ett system som vi valt för att den avbildar väsentliga egenskaper hos ett annat system.”
-25-
both controls and is changed by system dynamics”. This is an accurate description of the intended system since there will be changes in the structure of the Södermalm energy system over time due to e.g. improvements in technology. The hourly energy use on the other hand will instead be partially controlled by the structure of the system e.g. by the technology currently employed. ICT might increase the effect that the system structure has on the dynamics and vice versa through faster feedback.
2.2 What is a Model?
The aim with this study is to develop a tool for quantifying the outcome of the previously developed scenarios. In order to test the scenarios, a model that describes the energy system of the Södermalm district is needed. To do so, the term model must be well defined. So what is a model i.e. what constitutes a model, how can models be classified and what is the purpose of a model? The answer is ambiguous and will surely differ depending on who is asked. This chapter aims to describe the meaning of a model in this thesis.
One way of thinking of a model is to treat it as schematic reasoning when humans want to analyse reality (Gårding, 1984). With logical reasoning, a theory will eventually come to existence that tries to describe the reality. Both reality and theory bring up questions and answers and the model interacts with them.
There will always be contradictions between reality and theory. Therefore, the theory needs to be tested experimentally against the reality (Gårding, 1984). It is important to be aware of the contradictions and not trust the model blindly. An example of a theory that not always matches the reality is the motion of a free falling object, where the motion is independent of the mass. In reality, there may well be significant differences between the motion of a feather and a stone due to air drag. The mass independent theory is still a good model for the motion of a stone but it has a certain validity range. The purpose of the model is to give a lucid and clear view of the reality. That will probably lead to some trade-offs in the complexity of the theory to make the model easier to understand.
2.2.1 Descriptive and Explanatory Models Models can be classified into descriptive or explanatory models. The purpose of a descriptive model is to as accurately as possible behave as the real system for the interesting range of input and output (Lundqvist, 2012, p. 10). The approach for a descriptive model could be to start with a black box, a real system and its input and output, and then to build a model that becomes useful through matching of the model’s input and output to that of the real system. The descriptive model does however not give an explanation on how the real system works and will therefore still be a black box. This may be a drawback depending on what the purpose of the model is.
For explanatory models, trying to explain how different parts of the system interact to form the behavior of the system is the most important. A high degree of explanation does however often lead to a lower degree of predictability (Per Lundqvist, personal communication, April 18, 2012).
-26-
This may be a drawback for the modelling of some systems, but an explanatory model does not necessarily need accurate figures on the input and output of the real system in order to predict its behavior (Lundqvist, 2012, p. 10). This may be an advantage over a descriptive model. A perfectly constructed explanatory model would render a precise prediction of the system behaviour since it really understands the system and hence how it would react to any input. Since the explanatory model fully understands, explains and reproduces the system behaviour, it is a white box (Wiener, 1961). It may however be very difficult to build an explanatory model that would behave exactly as the real system if no empirical data is used. If one by chance was successful and built a “perfect” explanatory model, how would one know for sure? Using empirical data on the real system’s input and output might be very useful when building an explanatory model. The empirical data does however not form the starting point of the modelling process in contrast to the descriptive model, and that can be a great advantage since the empirical data may be incomplete and inaccurate. It is e.g. not very likely that there are accurate statistics on the exact energy use of the Södermalm district. And there are definitely no statistics on what will be the energy use in the future if ICT is implemented broadly making a descriptive model an approach that can be rejected with ease. An explanatory model does also have another advantage over the descriptive model in the case of this study. As described in chapter 1.4 under Aims and Objectives, the understanding of the model should be straightforward, and it should be possible to run different scenarios in the model and add new features with ease. This makes the explanatory model the only real option for this study.
2.2.2 Simulating or Optimizing Models Models can be simulating or optimizing. The aim of this study is not to optimize but rather to provide a tool for decision makers so that they are able to test how different changes would affect the energy use, so that they can make effective decisions. Therefore the model in this study has to be a simulating model.
Sterman (1991, p. 10) describes a simulating model in the following way: “The purpose of simulations may be foresight (predicting how systems might behave in the future under assumed conditions) or policy design (designing new decision-making strategies or organizational structures and evaluating their effects on the behaviour of the system).” It is more important that the model can be used to increase understanding of the energy system of Södermalm, and simulate how different changes due to increased used of ICT will affect the energy use, rather than to find an “optimal” method, i.e. the best way to accomplish the goal of reduced energy use due to ICT.
Simulating models can have algorithms of optimization e.g. to simulate how some sub-systems behave. Consider e.g. an intelligent heating system that tries to minimize (optimize) the energy use by means of automation. To be able to simulate the effect of the intelligent heating system, it has to include the optimization algorithm.
Sterman (1991, pp. 11-13) points out the limitations of simulating models which he describes as the problem of the accuracy of the Decision Rules i.e. the models representation of how the actors of the system make their decisions, the existence of Soft Variables, which are variables that are

-27-
descriptive, qualitative and hard to quantify, and the Model Boundary i.e. what factors are exogenous or endogenous and what feedbacks will be incorporated into the model. With the socio-technical system perspective of the Södermalm energy system, the behaviour of the actors is of great importance. One has to be aware of that the human behaviour might be very difficult or impossible to model precisely. As stated earlier, the aim of this study is to quantify the possible change in future energy use due to ICT in Stockholm’s Södermalm district. A lot of information that is crucial for an explanatory, simulating model will be qualitative. Some modellers do however not use variables that are hard to quantify since they are hard to validate. Reasonable estimates of those soft variables are better than not to include them at all and they will therefore be included in this study. The modellers have to be aware of that there is a bigger risk that the soft variables are a source of error, as compared to hard variables, but not including them at all would be even less accurate. Sterman (1991, p. 13) means that many simulation models have very narrow boundaries that can exclude important feedbacks, and the reason is that factors that lie outside of the expertise of the modeller or the interest of the sponsor are ignored. Through the collaboration with other SitCit participants with various backgrounds, the full complexity of the problem can be addressed and the risk that important feedbacks are excluded is minimized.
2.2.3 Short Note on the Modellers This study is carried out by Sven Wolf and Jonathan Linder Gottfriedz as a master’s thesis in energy technology. They both have similar academic expertise with a B.Sc. in Mechanical engineering and the master’s program in Sustainable Energy Engineering with Sustainable Power Generation as the main field of study. Prior to the work on this thesis, both Jonathan and Sven had no experience when it comes to urban sustainable development, transportation systems, or the use of ICT for energy efficiency improvements, and limited experience in the field of energy system analysis. The background of the modellers is important, since all models, intentionally or unintentionally, will be affected by the specific expertise and the values of the modellers. This effect is inevitable but the negative impact it may have on the validity of the model is reduced through close collaboration with the experts from different fields currently enrolled in the cross-disciplinary research project SitCit.
2.3 Modelling Approach
There are two main concepts used when modelling an energy system. One is the traditional top-down approach which focuses on the energy supply and distribution, the other one is a bottom-up approach which is based on the end-users and their activities (Jonsson, Gustafsson, Wangel, Höjer, Lundqvist, & Svane, 2011). The top-down approach has been widely used historically where a few energy providers have been considered in the model, while the much larger number of end-users were put outside the system boundary or regarded as a black box which has a certain energy demand (Jonsson, Gustafsson, Wangel, Höjer, Lundqvist, & Svane, 2011) (Svane, Lundqvist, Wangel, & Kliatsko, 2012).
-28-
However, when modelling an energy system with a socio-technical point of view, as in SitCit, a bottom-up approach is necessary (Svane, Lundqvist, Wangel, & Kliatsko, 2012) (Svane, et al., 2009). In the bottom-up approach, end-users are actors of the energy system, and their actions have a potential to reduce the energy use. The approach will cover behavioural aspects e.g. how the energy is used and how the energy usage can change if institutional incentives such as variable hourly electricity pricing are introduced (Svane, Lundqvist, Wangel, & Kliatsko, 2012).
An example that clearly shows the fundamental difference between the traditional top-down approach and the bottom-up approach, suitable when modelling the demand side of a socio-technical energy system, is the role of the energy suppliers. In the top-down approach they are the point of departure whereas they belong to the system environment in the bottom-up approach.
2.4 System and Environment Inclusion Criteria
This study will be based mainly on Churchman’s (1968) approach since it has several advantages over other approaches. Churchman’s (1968) approach allows the modeller to use whatever tools necessary in order to answer the research question whereas other approaches often are very normative. He only gives a few basic considerations to keep in mind when thinking about systems (Churchman, 1968, p. 29). Churchman (1968, p. 36) suggests that one can define what to include in the system and what is its environment by just asking two simple questions:
“Does it matter relative to my objective?”
“Can I do anything about it?”
If the answer to the first question is “Yes” but the second question is “No”, it is in the environment. If the answer is “Yes” to both questions, it should be included in the system, but if the answer is “No” to the first question, it does not matter relative to the objective and should therefore be ignored. In case of the SitCit project, the questions are: ”Does it matter in relation to the low carbon, low energy objectives?” and “Can the actors of the system do anything about it?” (Svane, et al., 2009, p. 12). The questions developed within SitCit are too general. They should encompass the specific objective of the study and the determined spatial scale, the district of Södermalm, and the intended time period, to 2060. The following two questions that include the spatial and time boundaries will serve as a base for defining the system boundary and the environment.
Does it matter in relation to how much ICT can reduce the energy use in Stockholm’s Södermalm district to 2060?
Can the actors of the energy system of Stockholm’s Södermalm district do anything about it?
What is meant by the actors of the system will be described in section 3.3. The main objective is encompassed in the first question. To increase the demand flexibility, which is a sub-objective since it can contribute to the transition towards urban sustainable development, is not encompassed in the above questions. The demand flexibility is a special case, and to effect of

-29-
demand flexibility on the energy use will presented separately. ICT solutions that increase the demand flexibility should hence be included in the system, if the answer to the second question is “Yes”.
2.4.1 Shortcomings in the Churchman Approach Churchman has a very classic technical view on systems and subsystems. Churchman (1968, p. 7) means that each subsystem needs a measure of performance and a desired level of performance which we have to be able to measure. This is a very hard technical approach and is not suitable for a socio-technical energy system. Another reason to why the systems approach of this study cannot be entirely based on Churchman is that he talks about one actor and its objectives for the system, but since we already concluded that this is a socio-technical system that will include several different actors that may want different measures of performances of the system and its subsystems, Churchman’s systems approach is not very suitable.
Churchman refrains from discussing the importance of the interrelatedness of the different components, or subsystems. Grant, et al., (1997) go a bit further and talk about the relationship between different parts of the system, and the complexity that arise from it, but do still not explicitly state that it’s the interrelatedness, the connections between the different parts, components, or subsystems, that has to be the base for any systems approach. Gustafsson, et al., (1982, p. 9) clearly state that it is the structure of the system, i.e. the relationships between the different components, is crucial for the systems characteristics and behaviour. As we will see later, the focus on understanding the interrelatedness of the subsystems or components rather than the subsystems or components themselves, is essential for this study. If one subsystem is the human activities e.g. eating, reading, living, that demand a service from another subsystem based on the appliances that can convert energy into services e.g. stoves, lamps, radiators, an understanding of the activities or the appliances is by far not as important for the understanding of the energy system of Södermalm as how the two subsystems interact.
2.5 Complexity and System Levels
The idea behind the SitCit project and this study is to address the issue of urban sustainable development. By reducing energy use, the CO2 emissions associated with energy generation would also be reduced to a hopefully sustainable level. One could argue that the energy suppliers, who are the actual source of emissions, have to be part of the system as they are in the traditional approach, but widen the system boundaries to involve all energy suppliers would greatly increase the complexity of the system. A too detailed and complex system would weaken the understanding of the system behaviour on an aggregated level and hence reduce the overall performance (Haraldsson, 2004, p. 16). This study focuses on understanding the demand side of the energy system of Södermalm, and including the energy suppliers could take away from that.
Gustafsson, et al., (1982, p. 17) mean that besides defining the system boundary, the aggregation level, the level of detail, has to be chosen when one wants to study a system starting from its purpose. Answering the question based on Churchman’s (1968) approach: Does it matter in relation
-30-
to how much ICT can reduce the energy use in Stockholm’s Södermalm district to 2060?, can be used as a step for determining whether or not a potential subsystem would make the energy system of Södermalm too detailed or not. If it does not really “matter” to the overall objective, e.g. the behaviour of a single person on Södermalm, it should not be included in the system since it would unnecessarily increase the level of detail. The “single person” makes up a system with its own subsystems, but he does hardly affect the energy use of whole Södemalm, and the system he makes up cannot be a subsystem, but maybe a part of a subsystem.
The larger number of variables that are considered, the greater the complexity and the uncertainty around these variables (Haraldsson, 2004, p. 17). For large-scale systems like the energy system of Södermalm, containing a huge number of variables that integrates through several system levels, there is a need for simplifications. As Sterman (1991, p. 5) points out: “The usefulness of models lies in the fact that they simplify reality (…) a truly comprehensive model of a complete system would just be as complex as that system and just as inscrutable”.
One problem with the CO2 pollution is that it is transboundary. If the subject of this study, the district of Södermalm, is used as an example: Even if all the people on Södermalm would stop using energy, the increase in CO2 levels in the atmosphere over Södermalm would remain basically unchanged. The energy system of Södermalm means little for the global air pollution system, but it can be an important subsystem of the urban system of Stockholm.

-31-
Modelling Process 3In order to answer the research question “With how much can ICT reduce the energy use in the Stockholm’s Södermalm district to 2060?”, the energy system of Södermalm needs to be defined and represented by a model. The Content Scenarios developed by earlier research within the SitCit project, that have already answered What to change, Who should take action, and How planning and implementation are accomplished, serve as a base for the modelling process. The three steps of the modelling process are conceptual model, a generic map of important components of the regarded system, the qualitative model, where the different components and their interrelatedness are investigated further, and finally the quantitative model where the components and their relationships are expressed in mathematical terms.
3.1 HAS and EUS
As described earlier, this study has a bottom-up approach, which is based on the end-users and their activities. At the core of the entire model are the Human Activity Systems (HAS). People’s everyday lives consist of different activities that in the model take place in HAS. The purpose of the activities is to address human needs and to sustain the quality of life. Examples of common human activities include sleeping, cooking, doing dishes, washing, travelling to work, showering, watching TV etc. all of which cause demand for services. The services are in turn provided by the Energy Usage Systems (EUS). The EUS transform energy into services that are demanded by HAS.
Here is an example of how EUS provides service to HAS: A person is reading a book (activity in HAS), to see the text, light is needed (service). A lamp (part of EUS) transforms electricity into light so that the person can read.
3.2 System Boundary for Human Activities
There are basically two options that are practical when it comes to which human activities to include in the system and which to ignore. Option 1, is that the HAS should only include activities that are carried out by the inhabitants of Stockholm’s Södermalm district. Option 2, is that the HAS should include all activities that are carried out within the geographic boundaries of the Södermalm district. The pros and cons of each option are described below:
Option 1, the activities of the inhabitants of Södermalm:
Pros
• Transports may be modelled easily since all transports of the inhabitants of the Södermalm district is accounted for in the system regardless of where the transports take place.
• The linking to the 2 kW goal is straight forward. • It may be easier to ignore activities carried out by people working on Södermalm or
visitors.

-32-
Cons
• How can the reduction in energy use due to ICT on e.g. schools or businesses located on Södermalm be quantified? And who is accounted for it if also people from outside of Södermalm perform activities there?
• Many activities that are carried out by the inhabitants of Södermalm outside of Södermalm are not affected by the ICT implementation in Södermalm.
• The model should be used as a tool for decision makers so they can make effective decisions, but many decision makers such as city planners, the government, and landlords are more linked to the geographical area, than to where the inhabitants carry out their activities.
• A lot of transport on Södermalm is not carried out by the inhabitants, should it not be included in the system?
Option 2, the activities on Södermalm:
Pros
• A number of basic quantitative models for different buildings (based on the HAS and EUS approach) have already been developed in several student projects (Kliatsko, Lundqvist, & Arias, 2012, p. 6). Models of e.g. supermarkets, schools, hospitals etc. could easily be modified to resemble that of the buildings and activities of the Södermalm district and be incorporated in the model of the whole Södermalm energy system.
• More suitable to answer the main objective of this study. • It is a proven concept to use geographic boundaries when modelling energy systems e.g.
the energy system of Sweden or the energy system of a single-family house. • Easy to start with the activities that take place within buildings such as museums or sports
centres, and the total effects of different ICT measures in terms of total energy use can be obtained directly.
Cons
• The linking to the 2 kW goal is more complicated. • If an inhabitant of Södermalm travels to a place far away, should the model only account
for the benefits due to ICT that occur for the part of the trip that lies within the geographical system boundaries?
Option 2 has several important advantages over option 1, but no serious disadvantage, and is therefore chosen. The system boundary for the human activities is hence defined in the following way:
The system boundary for the human activities is the geographical boundary of Stockholm’s Södermalm district.

-33-
3.3 Actors of the System
This section is intended to give a short introduction to who the actors of the energy system of the Södermalm district are. It is based mainly on earlier qualitative research within the frame of the SitCit project. The Contents Scenarios described by Løbner, et al., (2011) and Lewakowski, et al., (2010) were defined by answering the questions: What are the objects of change in the city’s physical, institutional and socio-cultural structures? And Who are the agents of change? An example of the What question could be: What changes in the schools on Södermalm could reduce their energy use for lighting? A possible answer could be smart lighting, then the Who question: Who could implement smart lighting in schools? And the answer to the Who question is e.g. the school administration, the municipal real estate company SISAB, or the government through legislation. Løbner, et al., (2011, p. 14) explain what is meant by the agents of change with the following words: “The Agents of Change refer to the actors, who have the ability and capacity to influence and modify the Objects of Change in any phase of the planning process – preferably towards a sustainable future.” Løbner, et al., (2011, p. 15) point out that the agents of change also can be actors who are opposing transition. The agents of change that were found by Løbner, et al., (2011) and Lewakowski, et al., (2010) in response to the Södermalm Seed are summarized here:
• Citizens and interest groups • Municipality, government and state • Public and private companies that work with ICT, energy or manufacturing of appliances,
or systems needed for ICT solutions • Building owners, housing associations and landlords • Institutions e.g. schools and libraries etc. • City planners • Providers of transport • University research centres • Workplaces and Cafés • People visiting institutions e.g. pupils, students etc.
Neither Løbner, et al., (2011) nor Lewakowski, et al., (2010) define a system that they are considering and that is hence problematic. Since it is not clear what to include in the system, what objects of change and actors of change should then be regarded at all? When one goes through the Content Scenarios, it becomes evident that Løbner, et al., (2011) and Lewakowski, et al., (2010) use different mental models when they consider what to include in the system and what they regard as an agent of change, or an actor, is also sometimes ambiguous. Løbner, et al., (2011, p. 201) mean e.g. that car producers are agents of change of the object of change that is the commercialization of electric vehicles. Electric vehicles may use ICT, but the technology itself has little to do with the Södermalm Seed where it is clear that ICT has to be the core. The What-Who approach might have facilitated the development of the Content Scenarios because it is straightforward, but the concept is clearly not specific enough for the modelling of a concretely

-34-
specified system. The concept of agents of change is abandoned in this study and the actors of the system are instead defined in the following way:
Actors of the system have the ability to influence the human activities or the implementation of ICT in the Södermalm district.
An actor can be both a person and an organization. An actor is not a physical structure e.g. a school or a café but it can be the school administration or the café owner.
The definition of the system actors is simple but precise, and can be used directly to conclude whether or not an agent of change in the developed Content Scenarios is also an actor of the system. It can also be used to potentially find other actors of the system. Even though the What-Who approach is abandoned, the Content Scenarios by Løbner, et al., (2011) and Lewakowski, et al., (2010) still serve as a base for ideas to be used in the model. The definition of the actors of the system is also addressing that it is the activities that take place on Södermalm and not by the citizens of Södermalm in general that is the chosen approach in this study.
The actors of the system can be divided into categories to show how the change can occur. In the Content Scenarios, there are always several actors involved in each change. These cooperate and take different roles in the process of change. One can e.g. say that the actors can be either leading the cooperation, or be a mediator, that is needed for success, or divide the actors in to primary and supporting actors of the system Lewakowski, et al., (2010). Another possibility is to divide them into “receivers” and “senders” (Løbner & Sølgaard Bang, 2011). This study will however not categorize the different actors by the roles that they are taking, but explain them briefly. More detailed descriptions of the different actors and their roles can be found in qualitative research done previously within the SitCit project.
3.4 Conceptual Model
The modelling starts with a conceptual model where a generic description of the system is given. The conceptual model defines what belongs to the system and what belongs to the system environment. The basis for this part is the answers to the questions defined in section 2.4:
Does it matter in relation to how much ICT can reduce the energy use in Stockholm’s Södermalm district to 2060?
Can the actors of the energy system of Stockholm’s Södermalm district do anything about it?
Who is meant by the system actors was defined in section 3.3 in the following way:
Actors of the system have the ability to influence the human activities or the implementation of ICT in the Södermalm district.
And the system boundary for the human activities is (from section 3.2):
The system boundary for the human activities is the geographical boundary of Stockholm’s Södermalm district.
From the above mentioned criteria and definitions, a conceptual model of the energy system of Stockholm’s Södermalm district integrated with ICT was built (see Figure 3).

-35-
Figure 3: Conceptual model of the energy system of Stockholm’s Södermalm district integrated with ICT.
3.4.1 The HAS and EUS in the Conceptual Model This conceptual model is only a generic map of the system. The model was built so that each building type with its characteristic set of human activities and specific set of service providing appliances is represented by a human activity system (HAS) and an energy usage system (EUS). Since more similar activities are carried out through the different means of transportation, all human activities within the category transports are represented by only one HAS. Buses, trains, cars, etc. can be used to get to work, but e.g. a fridge cannot be used for cleaning. Because the approach is to match a HAS to an EUS, all modes of transport are also only represented by one EUS. The areas that were identified and should be investigated with a pair of HAS and EUS since they are relevant for this study are listed on the next page:
Electricity
Fuels
Hot/cold Water
HAS - Buildings
HAS - Transports
Schools - reading - sports - eating : : Multi dwellings - cleaning - relaxing - living : :
- get to work - buy food - travel : :
EUS - Buildings Schools - lamp - stove - fridge : : Multi dwellings - television - heating - washing machine : : EUS - Transports - private car - train - bus : :
Ene
rgy
loss
es
Services
Services
Services
ICT
Energy
Energy
Energy
Geographical system boundary: the Södermalm district
Information
Information
Information
Unused services
-36-
• Multi-dwellings • Schools (including kindergarten) • Churches • Sports and recreational facilities • Museums • Theatres • Industries • Commercial buildings • Institutional buildings • Shopping centres • Hospitals • Fire departments • Station buildings • Restaurants • Libraries • Stores • Supermarkets • Transports
Each area will be represented by one HAS and a corresponding EUS subsystem. For schools the set of activities in the HAS would include reading, sports, eating, living, teaching etc. and a corresponding EUS needed to provide the necessary services in order for the users to perform the activities, see Figure 3.
There are many more human activities and energy using appliances that provide services in each area than illustrated in the conceptual model. In-depth analysis of the different areas will be conducted in the qualitative modelling part of this study.
An important aspect of the conceptual model is that the same human activities and the same appliances that provide the service occur multiple times because they take place in a variety of physical areas.
3.4.2 Advantages Over Other Approaches The division of the HAS and EUS in sub areas within the main sectors transport and buildings have some advantages over other approaches. One might argue that a more convenient approach would be to just sum up the human activities that take place on Södermalm over a year, e.g. x hours of eating, y hours of traveling to work by bus, z hours of television, and so on. The activities require that a service is delivered from an EUS, which in turn, uses energy. The approach presented in the conceptual model has some advantages over the latter approach. It may be difficult to come up with relatively accurate figures on how much of a specific activity is carried out if one does not investigate where the activity takes place. Another aspect is that the

-37-
objective concerns reducing the energy use, and where the activity takes place is of great importance for the energy use. The heating needed per capita in a multi-family housing is much less than in a single family house even if people in both housings carry out the same amount of the activity i.e. living. Another aspect that this approach captures is that feasible ICT solutions may depend strongly on where the activity takes place. ICT solutions for a hockey hall will be totally different to that of a single family housing.
3.4.3 The Role of ICT in the Conceptual Model Information and communication technology ICT is used for automation, information and persuasion (Kramers & Svane, 2011, p. 5). It act as a link that processes and delivers information between the HAS, EUS and over the system boundary. Different ICT solutions will imply different information flow directions and not all arrows leading to the ICT box in the conceptual model are necessarily applicable for each ICT solution. However, all ICT solutions that are relevant for the energy system modelling in this study have information flows that can be described by the arrows in the model.
3.4.4 The Impacts of ICT There are several different impacts due to ICT that are of interest for this study. The main objective is to answer the question: With how much can ICT reduce the energy use in the Stockholm’s Södermalm district to 2060? There are basically two different categories of savings that are affected by the implementation of ICT:
ICT driven savings: Savings which can only be attributed to ICT. An example is smart lighting that reduces the energy use by only providing illumination when it is needed. It can be implemented regardless of the type of lamp itself i.e. it does not require a change in the EUS.
Savings not directly related to ICT: Solutions that save energy by changing parts of the EUS, but where ICT can facilitate the broad implementation of the energy saving solution and hence contribute to the energy savings in an indirect way. An example is the change to electric cars from fossil fuel driven (change in EUS). An ICT solution here, which could increase the attractiveness of electric cars, is a system that tells the driver of an electric car where the closest free parking lot equipped with a charging device is.
It may be difficult to quantify ICT driven savings but ICT can be accounted for all the savings of the solutions that fall under this category. For Savings not directly related to ICT, on the other hand only part of the savings can ICT be accounted for. To cope with that problem, this study will not try to estimate how much of the savings that is due to ICT, but savings from this category will instead be shown separately.
These are the two main categories of savings due to ICT. This seems straightforward but there are unfortunately difficulties that arise from the fact that ICT solutions integrate over system boundaries regardless of how the boundaries are chosen, if not the whole world would make up only one single system. ICT solutions can affect the different systems, that they are a part of, differently which implies that there are many more ways to categorize ICT savings.

-38-
The two main categories described above are still useful, but they have many different sub-categories. Consider an imaginary case where the energy system of Södermalm is seen as a subsystem to the energy system of Stockholm which in turn is a subsystem to the energy system of the world. There are ICT solutions that reduce the energy use of Södermalm, increase that of Stockholm and reduce that of the world as a whole, whereas other ICT solutions may increase the energy use of Södermalm and Stockholm, but decrease the total energy use of the world. Still other may reduce the energy use of Södermalm, increase the energy use of Stockholm but reduce the energy use of the world. And it is also likely that ICT solutions that are positive for a subsystem affects other subsystems negatively but still contribute to an improvement in the system as a whole.
So what should be the criterion that decides whether or not an ICT solution should be implemented? Since this study aims to answer the main objective: With how much can ICT reduce the energy use in the Stockholm’s Södermalm district to 2060?, it may seem obvious to only include ICT solutions that affect the energy use on Södermalm in a positive way i.e. reduce the energy use, regardless of how it affects everything else. It is however not that simple. Many actors of the system are also actors of other systems that will be affected by the ICT implemented on Södermalm. They will most certainly not facilitate the implementation of ICT on Södermalm or try to influence the human activities that are carried out there if it means that it goes against what they consider beneficial. As described in section 2.2.1 and 2.2.2, the model is an explanatory and simulating model where the purpose is trying to explain how different parts of the system interact to form the behaviour of the system and provide a tool for decision makers so that they are able to test how different changes would affect the energy use so that they can make effective decisions. One can argue that the main objective question itself would rather fit a descriptive and optimizing model that tries to as accurately as possible behave as the real system and to find the combination of ICT solutions that minimize the energy use on Södermalm. But it is also clearly stated in the objective of this study that the understanding of the model should be straightforward, that new features should be added with ease, and that it should be a tool for decision makers to test different scenarios in order to create and implement a strategy for urban sustainable development. The actors of the system will have different interests and this study will not take the stand of one sole actor or discuss the fairness of an ICT solution but rather provide a tool for all actors so that they themselves can test how different solutions can cater their own interests.
Some examples of how some ICT solutions may affect different systems positively and negatively is provided here: There are ICT solutions that can change e.g. traffic patterns and that could lead to that less energy is used on a global scale, but increase the energy use in the system. If a person that normally works far outside of Södermalm can work from home instead because of the ICT solution teleworking, this can result in significant energy savings on e.g. a national or a global scale, but increase the energy use in the local system if the person e.g. needs a lot of electric devices and heating, which prevents potential energy savings, to work from home. It is also possible, but not very likely, that an ICT solution increases the total energy use, but reduces the energy use in the
-39-
system. An example of an ICT solution that could have that undesirable effect is the installation of heat sensors at frequent points along the roadway, which would monitor the number of passengers in each vehicle and automatically assess tolls to each vehicles account (Lewakowski, Sølgaard Bang, & Svane, 2010, p. 22). This ICT solution could make the trip more expensive for people who drive to work alone, and they might try to find ways around Södermalm which could require more energy than if they would just pass through.
Furthermore there are ICT solutions that do not increase or decrease the energy use of the local system in any direct way e.g. the ICT solutions that increase demand flexibility. Some ICT solutions can shift the energy consumption. This can be used to reduce the peak load, to balance renewable energy, to increase base load, and for the consumers to benefit from times when energy prices are low.
The benefits from reduced peak load are many but mostly in terms of reduced cost for the consumers. Reducing peak load can lower the losses in the electric transmission system and require less installed transmission or power generation capacity. In Sweden peak demand is generally offset by hydropower, but elsewhere peaking power plants are often fossil fuel driven and have a lower efficiency and more emissions per generated energy than base load plants.
ICT solutions that increase the demand flexibility can help balance out renewable energy which can lead to that a larger capacity of e.g. wind power or solar power can be installed in the electric grid without threatening its stability.
The impacts in terms of primary energy use or emissions due to demand flexibility will not be investigated in this study since it is too closely tied to the supply side of the energy system. These solutions are however considered positive and they might affect the impacts of other ICT solutions. The ICT solutions that increase demand flexibility will also be built into the model since they are considered positive if the whole energy system, the demand and supply side, is considered. And since increased demand flexibility due to ICT is part of the objective of this study, such ICT solutions are hence included into the model.
The conclusion that can be drawn from the discussion above is that all ICT solutions that can influence the energy use on Södermalm i.e. reduce it and increase the demand flexibility but also ICT solutions that may increase the energy use on Södermalm, should be incorporated in the model. The actors of the Södermalm energy system can then run different scenarios and decide for themselves how to e.g. design a policy that fits their own interests which hopefully is aligned with the idea of urban sustainable development. Since only the local system of Södermalm is considered, one cannot make any reliable statements on how the ICT solutions affect what lies outside the system boundary and solutions that potentially could affect the energy use negatively on a global scale cannot be ignored. Hopefully ICT solutions that decrease the energy use on Södermalm but increase it on a global scale will not be implemented.

-40-
3.4.5 Modelling the Impacts of ICT There are basically two ways to model the impacts of ICT. One is to solely model the impacts of ICT in terms of energy use while the other one is to model the energy use with and without ICT and assess the difference which will be the impacts due to ICT. An advantage of the first method is that only the part that ICT affects directly has to be modelled. A disadvantage is that since only the change is modelled, it will not be possible to see the effect of ICT solutions that increases demand flexibility so that e.g. a load curve is flattened out. Furthermore, if only the different parts that are affected by the specific ICT solution are modelled, it will be difficult to find empirical data that can validate the results. The results from the second method could clearly be used to illustrate the effect of ICT that increases demand flexibility, since it will show the energy use with and without ICT as a function of time. The method does however need the energy use without ICT to be modelled which implies that also parts of the demand side of the energy system of Södermalm that are not affected by ICT, also need to be part of the model. If they are part of the model, the ICT part could be removed and one would have a basic model of the demand side of the Södermalm energy system. The model could e.g. be used to test how non-ICT solutions affect the demand side. The model of the base case, i.e. a model with only ICT that is currently part of the system today, can be validated though empirical data that is likely to exist. Since the second method offers more advantage over the first method, it will be used in this study. It is also the only method that does show the demand flexibility which is a stated objective of this study.
3.4.6 Linking the Energy Use to the 2 kW Goal The potential energy reduction on the primary energy side, that eventuate from the broad implementation of ICT solutions will be assessed through multiplying the change in final energy use with a primary energy factor that depends on the energy form. A reduction in the average electricity use by 1000 kWh/year has a greater impact on the primary energy demand than a reduction of the hot water use with 1000 kWh/year due to the generally bigger primary energy factor of electricity.
3.4.7 System Boundaries and Exceptions As mentioned earlier in section 3.4, what belongs to the system and what belongs to the environment is decided by the answers of two questions. There are however exceptions to that rule, or cases of doubt, for different reasons. The exceptions and their reasons, and the special cases are explained below:
The district heating and cooling plant Hammarbyverket is largest in the world of its kind. It provides district heating and cooling to thousands of households, industries and businesses throughout the Stockholm area. In Hammarbyverket seven heat pumps with a total output of 225 MW, two biomass fired boilers and two electric boilers for peak load produce a total of 1 235 GWh each year that is fed in to Stockholms district heating network (Fortum, 2012) (SWENTEC, 2012). Although it lies in the district of Södermalm, it will not be included in the

-41-
system because it is closely related to the energy supply side and has little to do with the base of this study, the demand side of the energy system.
The same argument for exclusion holds for locally harvested small scale renewable energy that traditionally has been accounted for as a reduction in the total energy use. Consider e.g. the energy system of a house if a solar panel is mounted on the roof. Another reason to why locally harvested energy not should be included is that it increases the complexity. At what point is e.g. the installed locally harvesting energy solution considered to be too closely tied to the supply side of the energy system so that it should be excluded in the system of this study?
The leading argument against the inclusion of any energy generating facility in the system is that this study starts from the human activities requiring services that need energy to be produced. Energy generating facilities has nothing to do with human activities that need energy, and they do hence not reduce the energy use in the system, they just reduce the inflow of energy to the system.
This study is not considering the ownership of a physical structure e.g. a house where activities take place that require energy, but the human activities that take place within the physical structure. If solar panels are mounted on the house, it does not change the energy use of the activities. The thoughts that have been presented above are summarized below:
• The district heating and cooling plant Hammarbyverket is not included in the system • Any locally harvested small scale renewable energy is not part of the system
3.4.8 Simplifications The following section will describe the major simplifications of this study.
Embodied Energy of a product or the sum of all energy that was used to produce a product will not be considered in this study. If food is used as an example: the human activity eating requires the service of e.g. a fridge and a stove, which are part of the EUS. But it also requires e.g. a frying pan and a steak which are products that required energy to get produced. The energy use that is considered in this study is only the energy embodied in the services through an EUS, and not the energy required to produce a product. Both a fridge and a pan are products, but a pan is not an EUS i.e. it does not transform energy into services. Even though a fridge is an EUS, the energy that is embodied in the fridge itself is not included in this study.
A potential reduction of the energy distribution losses, on Södermalm or outside, due to the implementation of ICT on Södermalm are assumed to be negligible and are therefore ignored. Since they are ignored due to their insignificance, no further investigation whether or not they should be part of the system is needed.

-42-
3.4.9 Limitations The following section will describe some important limitations of this study.
The SitCit project was initiated to address the issue of urban sustainable development by focusing on the demand side of energy systems. The reduction of final energy use implies lower emissions of greenhouse gases, which is the main reason for the transition to urban sustainable development. This study does however not investigate if and how much the emissions change due to the implementation of ICT.
This study does not address the issue of most cost efficient energy solutions on a global scale. More CO2 could e.g. be avoided per invested money if the money would be invested differently. The initiatives that reduce the energy use (the emissions indirectly) and still have a positive NPV are of course always beneficial. Some initiatives may however have a negative NPV and the cost to reduce the energy and hence the emissions could be less for initiatives that do not lie within the system boundaries. This would result in an inefficient allocation of capital for emission reductions on a global level.
This study is on the energy use in Södermalm, and the use is affected by the highly volatile energy price, which is determined on the fast changing energy market. The future energy use can therefore be very difficult to predict.
To come up with a numerical outcome from the different scenarios, a large number of variables in a rather complex system need to be quantified. There will not just be a trade-off between time to research the figures of these variables and accuracy of the predictions, but the identified figures will also contain errors and uncertainty due to how the figures have been derived.
3.5 Changing the Approach
The original intention and scope of this study was to build a model able to quantify the outcome in terms of reduced energy use and increased demand flexibility if ICT was implemented broadly on Södermalm to 2060. Quite early in the process of building the qualitative model, it became evident that the scope of this study would be too extensive. This study would have to map all activities that take place in an inner city district with 118 56210 inhabitants. Each of the areas listed in section 3.4.1 that were identified needed further investigation because there are ICT solutions that could have a significant impact on the energy use in all of those areas.
Compared to the other Seeds in the SitCit project, this Seed would not just look at e.g. a change in the physical structure of multi-family housing as in the Rinkeby-Kista district, or the change in transportation solutions as in another suburb called Bromma. Since ICT can be implemented almost everywhere, this Seed would have to explore many more areas such as in institutions, offices, businesses plus transportation systems and multi-dwellings, etc.
10 As of 2010-12-31

-43-
It would not just be how these areas could be affected separately, but how they affect each other, since the integration of ICT changes the human behaviour, this will also affect which activities that are carried out, how much of them, where and when.
In order to cope with the problem of having to investigate so many different areas, there was an urgent need for more simplifications. An idea was to neglect areas that accounted for less than x % of the total energy use. But that idea was discarded quickly for several reasons. To conclude whether or not an areas should be discarded because it accounted for less than x % of the total energy use, would still require a lot of data and time. The main objective question is also not in terms of total energy use, but how much the energy use can reduce. ICT may affect the various areas differently and some areas that account for a lot of the energy use, but where ICT only could have a marginal effect, would be included whereas areas that account for only a small portion of the energy but with a relatively big potential for energy savings due to ICT, would be discarded. To change the base of the simplification and discard areas that account for less than x % of the total energy reduction potential due to ICT, would not be an option since it would require all work anyways to come up with figures on potentially reduced energy use due to ICT.
There were other difficulties associated with the main objective. One was that the changes in energy use should be modelled to 2060 – almost 50 years in the future. The bottom-up modelling approach of this study is based on the end-users and their activities (HAS), that demand services. Services are provided by the energy usage systems (EUS), and ICT interacts with the HAS and the EUS. Even though the activities themselves are not likely to change a lot to 2060 because people still have to eat, to live, to relax etc., the services that the activities demand will most likely change radically to 2060. Just consider how recent the use of personal computers and the internet became widely spread and how now smartphones and cloud computing is changing everyday life. A personal computer e.g. is not just a part of an EUS, a device that transforms electricity into a service e.g. entertainment, it can also be an information and communication technology that can help to reduce the energy use. What can be concluded is that both the ICT solutions and the parts of the EUS will change completely to 2060. How meaningful is it to model something quantitatively that is associated with such a large uncertainty? It is clear that the time frame for the objective has to change.
The complexity that arises from the many different areas that need to be investigated was dealt with by only looking at some areas. The idea was that the conceptual model illustrated in Figure 3 could still be used for the whole system, but that qualitative and quantitative model of this study only would investigate how ICT can affect some areas. This study was therefore divided into two parts, PART I and PART II, where the background, the methodology and the conceptual model built to be able to answer the main objective constitutes PART I and a new approach with some changes in the objective, and a qualitative and quantitative model constitute PART II. All of what was described, discussed and specified in PART I is still valid for PART II. The difference is that the second part only looks at some areas of HAS and EUS, that were identified in the modelling process and that the time frame is changed to 2030 instead of 2060.

-44-
There are several reasons to why the present to year 2030 was chosen as the new time period this study should look at. First of all, both Content Scenarios that should be tested quantitatively do for some reason just extend to 2030, even though it is clearly stated in a conference paper on SitCit that the intended time frame is to 2060 (Svane, et al., 2009). Secondly, the uncertainty associated with the development of new information and communication technology for reducing energy use is a lot smaller for the time period to 2030 than to 2060.
This study aims to build a realistic model of a future scenario where ICT is implemented broadly to change the energy use of Södermalm, which will not be possible for a scenario that lies almost 50 years in the future. Another benefit from changing the time period to 2030 would be that refurbishment and new development will not have a big impact on the energy use of the building stock on Södermalm to 2030 (Örjan Svane, personal communication, April 18, 2012). It is also not likely that a new transportation system is implemented to 2030 (Örjan Svane, personal communication, April 18, 2012).
After discussions with several participants of SitCit, there was an agreement to only investigate activities that take place in the residential part of the multi-dwellings and the activity get to work. This would represent both the building and the transport sector and also illustrate some level of integration that implementing ICT solutions will imply. The energy use in the residential part of multi-dwellings and the transports to work comprise a big portion of the total energy use on Södermalm and to show how ICT can affect the energy use in these parts, with a quantitative model, is therefore very important.
This change in approach will have some practical implications that will be described in detail in PART II.

-45-
PART II

-46-
New Approach 4This section will describe the changes to the original approach and what the practical implications are. Based on what was discussed in section 3.5, the main objective question was reformulated:
With how much can ICT reduce the energy use of the residential part of multi dwellings and the travel to work in Stockholm’s Södermalm district to 2030?
All other objectives and the aim of this study remain the same. So increasing the demand flexibility is still an objective of this study, and the aim is to come up with a model to quantify the outcome of different scenarios where ICT is implemented broadly. The only thing that changes is the intended time frame, from 2060 to 2030, and that only a part of the demand-side of the energy system on Södermalm is investigated.
4.1 New Conceptual Model
The change in objective requires a modified conceptual model. The purpose of this study is still to come up with a quantitative model that can be used as a tool for decision making i.e. it should be possible to see how different decisions or scenarios influences the outcome in terms of reduced energy use and increased demand flexibility in Stockholm’s Södermalm district. The goal of the modelling process is a quantitative model but the modelling starts with a conceptual model that gives a generic description of the system.
The idea is that the new approach only looks at part of the original defined system, so the conceptual model defined here is a generic map of a subsystem to the original system. The quantitative model for this specific subsystem should be compatible with the quantitative models of other similar subsystems that together form the system in the comprehensive quantitative model of the original approach.
Similar to how the conceptual model of the original approach was defined in section 3.4, what belongs to the system and what belongs to the environment is determined by the answers of the following questions:
Does it matter in relation to how much ICT can reduce the energy use of the residential part of multi dwellings and the travel to work in Stockholm’s Södermalm district to 2030?
Can the actors of the energy system of Stockholm’s Södermalm district do anything about it?
If the answer to the first question is “Yes” but the second question is “No”, it is in the environment. If the answer is “Yes” to both questions, it should be included in the system, but if the answer is “No” to the first question, it does not matter relative to the objective and should therefore be ignored.
Who is meant by the system actors is defined in the following way:
Actors of the system have the ability to influence the human activities or the implementation of ICT in the residential part of multi dwellings and the travel to work, in the Södermalm district.
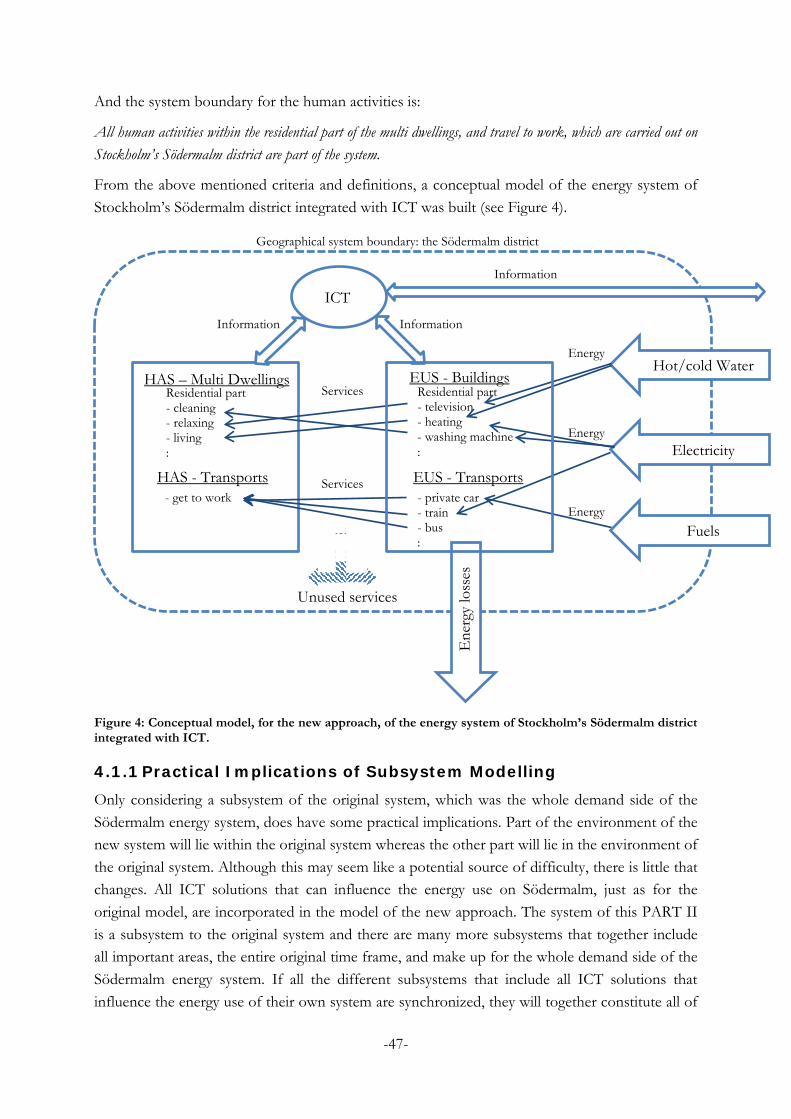
-47-
And the system boundary for the human activities is:
All human activities within the residential part of the multi dwellings, and travel to work, which are carried out on Stockholm’s Södermalm district are part of the system.
From the above mentioned criteria and definitions, a conceptual model of the energy system of Stockholm’s Södermalm district integrated with ICT was built (see Figure 4).
Figure 4: Conceptual model, for the new approach, of the energy system of Stockholm’s Södermalm district integrated with ICT.
4.1.1 Practical Implications of Subsystem Modelling Only considering a subsystem of the original system, which was the whole demand side of the Södermalm energy system, does have some practical implications. Part of the environment of the new system will lie within the original system whereas the other part will lie in the environment of the original system. Although this may seem like a potential source of difficulty, there is little that changes. All ICT solutions that can influence the energy use on Södermalm, just as for the original model, are incorporated in the model of the new approach. The system of this PART II is a subsystem to the original system and there are many more subsystems that together include all important areas, the entire original time frame, and make up for the whole demand side of the Södermalm energy system. If all the different subsystems that include all ICT solutions that influence the energy use of their own system are synchronized, they will together constitute all of
HAS – Multi Dwellings
HAS - Transports
Residential part - cleaning - relaxing - living :
- get to work
EUS - Buildings Residential part - television - heating - washing machine :
- private car - train - bus :
Unused services
Ene
rgy
loss
es
Services
Services
ICT
Geographical system boundary: the Södermalm district
Information
Information
Information
Hot/cold Water
Fuels
Electricity
EUS - Transports
Energy
Energy
Energy

-48-
what should be included in the original system that comprises the energy demand side of all of Södermalm. Modelling different subsystems separately, then synchronize the changes, and bringing them together so that they make up the entire energy system of Södermalm, has the advantage that it may be possible to find empirical data on e.g. the energy use of many of the subsystems and that this will increase the predictability of the entire system.
4.1.2 Simplifications In this model everything that is not an information and communication technology is static i.e. no change will be modelled for the time period to 2030. This means that all the energy usage systems are the same for today, 2012, to 2030. This model will not contain any advances in improved energy efficiency due to implementation of non-ICT e.g. the transition from incandescent light bulbs to light emitting diodes. All human activities that are carried out and the services they demand are also the same in this model, except changes due to ICT, throughout the time period. By seeing the non-ICT as static, a development prognosis of non-ICT is not necessary.
One could argue that the results of the quantitative model would only show how the energy use would be today if ICT was implemented broadly. This is partially true, but the model will also show when the ICT solutions are implemented – at times when the inertia against change is low, the so called Situations of Opportunity.
The following example will illustrate how this model will work and why all savings will be ICT driven. Consider a modern automatic washing machine that can decide for instance how long washing time, how much water and at what temperature, that is needed for the cloths to become clean (Siemens, 2012). This is an ICT driven solution, but the washing machine is also likely to be better insulated and has an electric motor with a higher efficiency than the washing machines that are common today, which implies energy savings that are not due to ICT. The whole washing machine could hence be seen as a solution that ICT is part of. Since everything that is not directly related to ICT is considered to be static, the savings due to better insulation and a more efficient electric motor is not included in the model. The washing machine in the model will be a washing machine with the ICT part but without the other improvements. The improvement in energy efficiency due to non-ICT solutions should nevertheless be easily implemented in the model for the energy system of Södermalm. If a model of how insulation and electric motors improve for washing machines is combined with the model of this study, it will show a scenario of how the energy use could actually change to 2030. It is likely that the improvements in non-ICT, e.g. increased insulation, will offset some of the potential reduction of ICT that is modelled considering everything else being static. If e.g. the insulation in an apartment is improved, this will lead to lower thermal losses. Lower thermal losses imply that automatically reducing the indoor temperature, though ICT, when no one is at home saves less energy.

-49-
Qualitative Model 5The following chapter will describe the main components of the conceptual model, the HAS, EUS and ICT, more in detail, and investigate further how they are interrelated. How the different components work and relate to each other is thereafter expressed in mathematical terms in the quantitative model. As described in chapter 2.2.1 the model will be an explanatory model, which tries to explain how different parts of the system interact to form the behaviour of the system. Also, different strategies, technologies and scenarios will be described, that can create sustainable development at an urban level. It will illustrate the different aspects and the possible ways to go, and the concrete effect can thereafter be simulated in a quantitative model. Who the actors of the system are, who have the ability to influence the human activities or the implementation of ICT, will also be addressed briefly.
5.1 ICT for Multi Dwellings and Get to Work
The different ICT solutions that are relevant to answer the objectives of PART II of this study are described here. They are divided into two main categories, the ICT solutions for the human activities that take place in the residential part of multi dwellings, and the ICT-solutions for the activity get to work. It is based on a literature review of existing and potential future information and communication technologies Most ICT solutions are however commercially available already today. The question is basically what ICT can do in multi-dwellings and in the travelling to work, to contribute towards the vision of a 2 kW society. This part is partially based on the Content Scenarios of a heavily ICT integrated future of Södermalm, that were developed within the frame of the SitCit project, but is more concise and specific, which is essential so that the qualitative model can serve as a base for the quantitative model. The Content Scenarios are described more in detail in the reports by Løbner, et al., (2011) and Lewakowski, et al., (2010). The relevant ICT solutions are often combined into a few categories mainly because the different solutions are interwoven. In this study however, the modellers try to separate the different solutions so they can be modelled easier. Bigger categories of solutions mean more involved actors and more necessary steps for implementation, per category. There are also many different terms for similar or even the same ICT solutions found in the literature, which implies that the solutions described here can have different names in other studies. Each ICT solution will first be described technically and how it interrelates with the HAS, the EUS and the surroundings. Thereafter, the information flows between the ICT, the HAS and the EUS, will be illustrated by a figure, and finally a section will explain how, when and by whom, the ICT solutions should be implemented.
-50-
5.2 ICT Solutions for Multi Dwellings
5.2.1 Intelligent HVAC
Technical Description 5.2.1.1Intelligent heating, ventilation and air conditioning (HVAC) automatically controls indoor climate to ensure personal comfort and at the same time minimizes the energy use. It measures different air quality parameters, and detects and maps user patterns.
Intelligent HVAC learns from the user’s behaviour. If the user lowers the temperature before going to sleep, the intelligent HVAC will remember the preferred night temperature and when the user usually goes to sleep, and eventually adjust the temperature automatically (Nest Labs, 2012). The intelligent HVAC can also detect occupancy and what activities are currently performed in the conditioned environment since that will affect the air quality and the temperature (REEB, 2009, p. 22). Together with real time information, provided by sensors, on current temperature and ambient air quality such as concentration of CO2 and dust particles etc., the heating, ventilation and air conditioning can be steered into providing excellent environmental comfort and at the same time minimizing the energy needed to provide heating, ventilation and air-conditioning. Another example of how intelligent HVAC can also turn off radiators and ventilation when windows are open so that energy is not wasted (Rohracher, 2002, p. 243).
The intelligent HVAC can also use external information such as weather forecasts to manage the heating, ventilation and air conditioning processes in an optimal way (Kramers & Svane, 2011, p. 17). The weather forecasts can deliver data on expected solar insulation, and outdoor temperature which the intelligent HVAC can use to predict e.g. the future external gains and transmission losses (REEB, 2009, p. 22).
Another positive feature of an intelligent HVAC system is that it can inform the user of how much money that can be saved if the standard of thermal comfort is reduced to some extent. Some users might e.g. prefer a slightly lower indoor temperature if they thereby can save money (and protect the environment). This will make users better off since they can choose their optimal level of thermal comfort themselves.
The users can also use smartphones to monitor and remotely control e.g. the indoor temperature and the intelligent HVAC can also notify the users via their smartphones of how energy can be saved by altering a certain energy setting (Lewakowski, Sølgaard Bang, & Svane, 2010, p. 21).
Information Flows 5.2.1.2The different information flows of intelligent HVAC are illustrated in Figure 5 below. The information and communication technology requests data on e.g. the power consumption from the EUS and requests external information on e.g. predicted weather conditions from the surroundings. The ICT also collects data on user preferences and user behaviour from the HAS,

-51-
processes the information and uses it to control the EUS. ICT informs the user of potential energy saving measures and current energy use (ICT information arrow to HAS).
Figure 5: Information flows between subsystems and surroundings for intelligent HVAC.
Implemented How, When and by Whom? 5.2.1.3In the Content Scenario developed by Løbner, et al., (2011), intelligent HVAC is part of a housing package that is installed between 2017 and 2025. It is implemented through a public private partnership (PPP) set up in 2015 after the strategy “ICT for Sustainable Södermalm” was adopted by the city council. The PPP was established between the City of Stockholm and Ericsson, a telecommunications company, and Fortum, Södermalm’s biggest energy company (Løbner & Sølgaard Bang, 2011, pp. 116-118). Ericsson developed a home energy management (HEM) system and the City of Stockholm and Fortum installed the system initially in public buildings on Södermalm. The HEM system could be leased by the households for five years and thereafter the leaser could keep the HEM system and households who report their experiences of the HEM system would receive it for a lower price.
In a Content Scenario described in a report by Lewakowski (2010, p. 19), a light and heat automation (LHA) system can be rented or purchased by the resident at a price subsidized through lower tax. Some information on energy use will however become public property and displayed on a public website. The early version of a LHA is developed by an academic institution (Lewakowski, Sølgaard Bang, & Svane, 2010, p. 45).
5.2.2 Smart Lighting
Technical Description 5.2.2.1ICT can reduce the energy used to provide illumination through the concept of smart lighting. The idea behind smart lighting is that lighting controlled through ICT can significantly reduce the energy use, especially in the residential sector, by avoiding unintentional use of lighting and excessive illumination.
The unintentional use of lighting can be described as that service illumination is provided even though e.g. no one is at home i.e. there is no human activity that requires or demands the service. ICT can through occupancy sensors detect whether or not people are present in the rooms and turn on and off the lights accordingly (Kramers & Svane, 2011, p. 17). A solution by Mallon, et al., (2007, p. 27), is that the occupancy sensors can identify the user by a smart phone or key tag and be programmed so that the light is only on when the user is closer than x meter to the room.
Surroundings
HAS
ICT
EUS

-52-
It is also possible to remotely control the lights over the internet via a smart phone. This can be useful if one wants to e.g. light up some rooms in order to reduce the risk of a break-in. Ambient light sensors and dimmers can be installed to prevent excessive illumination to be provided (REEB, 2009, p. 22).
Since only unused or excessive illumination is removed, smart lighting will not worsen the quality of life in any way. Controlling the light should be automated and not take time away from the daily routines.
Information Flows 5.2.2.2The purpose of the ICT solution smart lighting is not to change the human behaviour i.e. the activities that are carried out in the HAS, but to reduce the amount of the service illumination provided by the EUS through improved control and automation. The information flows of smart lighting are illustrated in Figure 6 below. Information about the human activity currently carried out e.g. showering, is provided by the occupancy sensors (part of ICT), which turn off the lights (part of EUS) in all other rooms but the bathroom.
Figure 6: Information flows between subsystems for smart lighting.
Implemented How, When and by Whom? 5.2.2.3The concept smart lighting is part of the light and heat automation (LHA) system of a Content Scenario described in the report by Lewakowski, et al., (2010). How the LHA is implemented and by whom is described in the paragraph on intelligent HVAC.
The Content Scenario developed by Løbner, et al., (2011), does not discuss smart lighting specifically, the control and automation of lightning is however included in the HEM system, which implies that it is part of the housing package that is installed between 2017 and 2025. More information on how, when and by whom the housing package is implemented, can be found in the corresponding paragraph for the intelligent HVAC.
5.2.3 Smart Metering
Technical Description 5.2.3.1Smart meters use data on the past, current and predicted energy use and associated energy costs of different appliances and inform the user about it so the user can be persuaded to change the behaviour to use less energy.
Smart meters increase the energy awareness and give the users the opportunity to decide how much money they want to spend on energy. Smart meters do not necessarily imply reduced total
HAS
ICT
EUS

-53-
energy use, maybe the user thought that e.g. showering required more energy and to a higher costs than it actually does, which might result in increased showering. It is likely that installing smart meters change the human activities that are carried out, both what activities are carried out and the amount of them, since priorities might change as a result of increased energy awareness.
The users can be informed about the energy use and costs in different ways. The raw data can be displayed just as it is, but there are other concepts that might increase the energy awareness and hopefully persuade the users to use less energy, more effectively. One possibility is to visualize the energy use through changing furnishings. An example is a lamp that is more beautiful when the energy use is low (REEB, 2009, p. 28). Another possibility is that all information on each household’s energy use and energy costs is displayed anonymously on a public website. Users can log in and compare their own energy use and associated costs compared to a selected average consumption e.g. the average consumption of similar apartments in the same neighbourhood (Lewakowski, Sølgaard Bang, & Svane, 2010, p. 21) (Rohracher, 2002, p. 244).
A Smart meter is a good example of an ICT solution that is highly interwoven with other ICT solutions. Consider one feature of intelligent HVAC, which is informing the user of a potential saving measure and the current energy use. This is exactly what a smart meter entails.
Information Flows 5.2.3.2The different information flows of smart metering are illustrated in Figure 7 below. The ICT solution smart meter measures the current energy use of the different energy usage systems. This information together with information on the current energy price is communicated to the user who may alter the activities that he or she carries out in the HAS. Users also get feedback of their energy use and energy costs from externally (from the surroundings) retrieved information displayed on e.g. a public website.
Figure 7: Information flows between subsystems and surroundings for smart metering.
Implemented How, When and by Whom? 5.2.3.3In the Content Scenario by Løbner, et al., (2011), the ICT-solution smart metering is part of the housing package that is installed between 2017 and 2025. For more detailed information on how, when and by whom smart metering is implemented, see corresponding paragraph for the intelligent HVAC.
There are two different Content Scenarios explaining how smart meters can be implemented to reduce energy use in the report by Lewakowski, et al., (2010, p. 21). In one scenario it is
Surroundings
HAS
ICT
EUS

-54-
implemented though a municipality owned energy information company (EIC), who leases smart meters at a discount. The EIC also retrieves data on the energy use of its customers and compiles it into energy use statistics that are displayed on a public website. In the other scenario, the independent demand-response company Optihouse retrieves energy information from the energy providers on the individual households energy use and notifies them of potential energy savings. The municipality subsidizes the energy monitoring devices (Lewakowski, Sølgaard Bang, & Svane, 2010, p. 44). This scenario does however not say who provides the smart meters, who pays for it, and who pays for the services of Optihouse. Neither the former, nor the latter scenario does also explain when the smart metering should be implemented i.e. when the inertia against change is low.
Energy saving rewards11 (ESR) can facilitate the broad implementation of smart metering further. The EIC could enter into a partnership between local merchants of consumer products who can offer different discounts for reward points that the energy savings would be translated into. The incentive for merchants to offer the discount would be that they can advertise their store on a public website, and that it would be good PR since they would improve their reputation though their support of an energy reduction initiative. The local merchants would facilitate the implementation of smart metering on Södermalm, and are hence actors of the system.
5.2.4 Smart Kitchen
Technical Description 5.2.4.1The concept smart kitchen comprises several different ICT solutions that contribute to a reduction of the kitchen’s energy use. The ICT solutions retrieve and process data from the different appliances in the kitchen through application specific sensors, which are used to effectively steer the appliances by means of automation.
Some of the most frequently found ICT solutions for the kitchen will be described here. Temperature sensors can e.g. be installed on a stove to keep pans and pots at a desired constant temperature (Siemens, 2011). Dishwashers on the other hand can be equipped with sensors that measure the amount and cleanliness of dishes and adjust the temperature, and the amount of water and detergent accordingly (Miele, 2012).
Smart kitchen ICT solutions can have other benefits. One example is that ICT can help reduce food waste by keeping a list on the inventory and their shelf life, and provide suitable recipe suggestions (Lewakowski, Sølgaard Bang, & Svane, 2010, p. 19). Less food waste means less food required, which further implies that less energy is needed to provide the food. This energy reduction is however not relevant here since the reduced energy use is embodied energy, which is not considered in this study (see chapter 3.4.8).
Information Flows 5.2.4.2The ICT solutions within the concept smart kitchen are mostly purely technical and do give no feedback to the user that could affect its behaviour. The user has still the role of demanding a 11 Energy saving rewards is part of an energy management software solution that C3 Energy, (2012), markets.

-55-
service e.g. a hot plate, but ICT does not change the interaction between EUS and HAS. The sensors (part of ICT) register data about the EUS that gets processed and used to control the EUS. Therefore, the only information flow is between the EUS and the ICT (see Figure 8 below).
Figure 8: Information flows between subsystems for a smart kitchen.
Implemented How, When and by Whom? 5.2.4.3There is no information in the Content Scenarios in the report by Lewakowski, et al., (2010) that answers any of these questions regarding smart kitchen solutions.
There is also no information on any ICT solution specifically to find in the Content Scenario by Løbner, et al., (2011). It is however likely that the smart kitchen would be part of the housing package, and installed between 2017 and 2025. The corresponding paragraph for intelligent HVAC answers the above questions for the housing package.
There are already several ICT-integrated kitchen appliances currently on the market. It is the state of the art technology today, and no speculation about the future. Miscellaneous manufacturers are advertising energy efficient kitchen systems. Potential customers will buy these systems to a bigger extent when the technology matures and becomes cheaper.
5.2.5 Smart Laundry
Technical Description 5.2.5.1The energy use of the residential part of multi dwellings can be reduced through several ICT solutions that are integrated with different laundry appliances. The smart laundry concept comprises the information and communication technology that can contribute to a reduction of energy required for laundry. The laundry processes are controlled by ICT that retrieves data from various sensors installed in the different appliances.
ICT-integrated washing machines will have sensors that detect the kind of fabric, the amount of laundry, the degree of soiling, and the water hardness, and automatically select the optimal washing program i.e. adjust the temperature, and the amount of water and detergent (Siemens, 2012).
There are similar solutions for tumble dryers and drying cabinets.
In multi dwellings with a common laundry room, each resident could use their smartphones to log into the different laundry devices through holding it in close proximity. The information on the energy use and associated costs required to clean and dry the laundry, will be displayed on the
ICT
EUS

-56-
phone and the costs will be added to the rent. This can be done by near field communication (NFC), which is a set of standards of connectivity technologies which can be integrated into smartphones (NFC Forum, 2012). This ICT is a typical smart meter solution. It shows that the different ICT solutions are tightly linked to each other.
Information Flows 5.2.5.2The different flows of information that the smart laundry concept implies are illustrated in Figure 9 below. ICT retrieves information on the cost of energy externally and combines it with data on the energy use, which is retrieved from the EUS. This information is thereafter displayed to the user, who may alter the human activities he or she carries out. ICT does also directly control the EUS so that energy is potentially saved.
Figure 9: Information flows between subsystems and surroundings for smart laundry.
Implemented How, When and by Whom? 5.2.5.3There is no information about smart laundry, or similar concepts, to find in any of the Content Scenarios for the Södermalm Seed. It would however fit the housing package that is installed between 2017-2025 in the Content Scenario by Løbner, et al., (2011). See corresponding section under intelligent HVAC for more detailed description on how and by whom. Developing a Content Scenario is not a part of this study. One can however speculate that smart laundry solutions will see a significant increase in the market share in the next few years. Similarly to smart kitchen, the smart laundry solutions are already available on the market. They are in the introduction phase and marketed hard. When the technology eventually becomes cheaper and more reliable, the interest for these solutions will rise.
5.2.6 Standby Management
Technical Description 5.2.6.1Standby management essentially means that appliances that are currently delivering a service that is not demanded are turned off. It can also mean that appliances that are delivering no service at all, but still consume energy, are turned off. Standby management comprises several different ICT solutions developed to reduce the unintentional energy use (energy that is used at no avail). The following section will describe the main ICT solutions that fall within the standby management category.
One solution is that the electronic devices are plugged into a special socket, which controls the standby power by a motion sensor or manually-remotely by the user. The motion sensor can e.g.
Surroundings
HAS
ICT
EUS

-57-
detect whether or not anyone is at home or sleeping, and turn on and off the power to the devices accordingly. Devices plugged into some special sockets can communicate with a remote device e.g. a smartphone and be turned off remotely through a radio signal. Another ICT solution is to turn off peripherals connected to e.g. a computer automatically when the computer is shut down (Bye Bye Standby, 2012).
Electronic devices with batteries that have finished charging, but are still connected to the socket, consume energy. There are ICT solutions that monitor the electric current through the charger and automatically turn off the electricity when the batteries are full.
Information Flows 5.2.6.2Standby management comprises both purely technical ICT solutions and ICT solutions, which communicate with the user. The motion sensor (part of ICT) that registers if someone is at home (a human activity) is used to automatically turn on and off the electric devices (the EUS). Information on whether or not different electric devices are on standby or have finished charging is processed by the ICT and used to directly control the electric devices or to show the user, who is part of the HAS, so that he can manually change the energy setting. The information flows of standby management are shown in Figure 10.
Figure 10: Information flows between subsystems for standby management.
Implemented How, When and by Whom? 5.2.6.3No ICT solutions for standby management are found explicitly in the Content Scenarios for the Södermalm Seed. The technologies are however already on the market today, which implies that they could be a part of the housing package installed between 2017-2025, as described by Løbner, et al., (2011).
The unintentional use of energy from devices on standby is the worst form of energy use since energy is wasted at no avail i.e. the delivered service is not demanded. The state or the municipality could subsidize ICT solutions developed to reduce the unintentional energy use.
5.3 ICT Solutions for Get to Work
5.3.1 Teleworking
Technical Description 5.3.1.1A flexible working arrangement, in which employees do not have to commute to a particular work place, is called teleworking. Teleworking requires several different information and
HAS
ICT
EUS

-58-
communication technologies and energy is potentially saved due to teleworking because it leads to less transports and need for office space. Teleworkers use ICT to work from home or in e.g. parks, restaurants and cafés. The following section will describe the ICT that can be used to improve the work arrangement teleworking and increase the number of people who telework. It will also briefly discuss the implications of increased teleworking.
Information and communication technologies are used to connect different devices in a network cloud. Hardware and software are accessible in the cloud and can be delivered as services. To ensure that a lot of information can be exchanged between the user and the cloud e.g. during a videoconference, a high speed internet connection is a prerequisite.
Even though increased teleworking would lead to fewer transports to and from work, and less need for office space, the energy use will most likely increase elsewhere e.g. in the homes due to the increased use of ICT and other energy using appliances.
Information Flows 5.3.1.2The information flows due to ICT, which are present while teleworking, are illustrated with arrows in Figure 11 below. The teleworker, who is part of the HAS, two-way communicates with the surroundings e.g. with work colleagues or with business partners, through the use of ICT. The communication is regarded to be in the surroundings because the actors that have a significant impact on the implementation of ICT cannot really do anything about what information is communicated and who the communication is with. That information is communicated with the help of ICT matters for the objective (see the inclusion criteria defined in chapter 4.1). ICT does not change the EUS (the mean of transportation) itself, nor does it retrieve information from it. Computers, smart phones etc. are used while teleworking. They are however seen as ICT and are therefore not represented by EUS in the figure. Increased teleworking does reduce the demand for transports and increases e.g. the demand of heating during the day (if otherwise the temperature is lowered through intelligent HVAC), i.e. the amount of the service delivered by the different EUS change. The interaction between HAS and EUS which involves demand for services that the EUS provide, has not been illustrated in any information flow figure so far, and is hence not illustrated here either.
Figure 11: Information flows between subsystems and surroundings for teleworking
Implemented How, When and by Whom? 5.3.1.3Teleworking can be increasingly implemented by employers. There is an economic incentive for employers to make their employees telework more because it would result in less office space
Surroundings
HAS
ICT

-59-
needed and a reduction in the energy use (Mallon, Johnston, Burton, & Cavanagh, 2007, p. 14). Another benefit for the employers is that empirical research indicates that teleworkers produce more work per hour than their work-based colleagues. Teleworking may however make monitoring and supervision of employees more difficult and mean security issues (Australian Telework Advisory, 2006, pp. 16-19). Technological improvement e.g. faster and easier access to the internet will also facilitate teleworking. Teleworking requires that information technology is increasingly available at other locations where work should be done. Therefore, café and restaurant owners, library directors and the employees etc. are also important actors whose support is needed.
The Content Scenario developed by Løbner, et al., (2011), discusses teleworking diligently. It is however not part of the first or second transport package implemented 2016-2019 and 2020-2023 nor the housing package. In a scenario for the year 2030, Løbner, et al., (2011, pp. 110-111), describe a future where employees telework some days per week, but still enjoy face-to-face contacts with the colleagues, and where a café has gradually been turned in to a work hub for teleworkers.
Teleworking is not discussed in the report by Lewakowski, et al., (2010).
5.3.2 Transport Information System
Technical Description 5.3.2.1The transport information system (TIS) consists of interlinked information channels, which deliver services to any user of the transportation infrastructure. The TIS improves the trip of the user, increases the efficiency of the transportation system in general, and reduces the environmental impact. There are several different ICT solutions that are included in the TIS concept and they have in common that they deliver information to the user e.g. a car driver, which facilitates and improves travelling.
Traffic message channel (TMC) is an ICT with the purpose to deliver real-time information about the traffic situation. Data from sensors and cameras installed along the road is processed and delivered to the driver together with information on present road works and road closure. Drivers will receive information about traffic disruptions, accidents, road works, traffic jams etc. (Trafikverket, 2012). The information is broadcasted via FM-radio, or sent to a navigation system, such as a GPS, which can use the information to suggest alternative directions. Avoiding congestions can help to reduce the fuel use of the trip.
ICT along the road supports the driver and controls the traffic through external sources of information. The external sources of information are generally electronic signs along roads, which provide information about accidents, the current speed limit on the road section, approaching wildlife, available parking space, vacant charging bays for electric vehicles etc. ICT along the road also involves automatic speed control and smart traffic signals i.e. traffic signals that are steered to minimize queues and prioritize specific means of transportation (Trafikverket, 2010).

-60-
Unified trip planning service uses real-time information on the current traffic situation for the different means of transportation to optimize the trip in terms of shortest time, least cost, lowest environmental impact etc. (Trafiken.nu, 2012). It uses information from the TMC and can be accessed via a computer or a smartphone anywhere. The primary purpose of the three ICT solutions that are presented here is rather increased accessibility then reduced energy use. Nevertheless, the above mentioned ICT solutions could have a significant positive impact on the energy use associated with the activity get to work, on Södermalm because they increase the help to avoid traffic disturbances e.g. traffic jams, and increase the awareness of the emissions associated with different means of transportation. Lower emissions generally imply less energy.
Information Flows 5.3.2.2Sensors along the road (ICT) sense the car which is part of the EUS. Information of e.g. planned road works is retrieved from the traffic control centre and processed. The TIS informs the user (part of the HAS) and other potential users that are not part of the system of this study of e.g. accidents, traffic jams and current speed limit. The user (part of the HAS) gives input to the unified trip planner to optimize travelling.
Figure 12: Information flows between subsystems and surroundings for a transport information system.
Implemented How, When and by Whom? 5.3.2.3In the Content Scenario developed by Løbner, et al., (2011), ICT solutions similar to the ones described above are presented. The Strategic Office of Stockholm appointed a steering group to implement the vision named “ICT for Sustainable Södermalm”. The project received political acceptance when it was placed in the Environmental Program and the city’s long term budget, by a vast majority in the City Council 2015. The steering group was made up by representatives from several different organizations including public transport companies, tenant associations, academia, politicians etc. The Swedish Centre for Energy savings did publicly display the plans and gave advice on a website. A journey planner and an intelligent transport system (ITS) were installed as part of the first transport package in the years 2016-2019. The ITS was implemented by the Stockholm Traffic and Waste Management Administration, the Swedish Traffic Administration and the public transport company SL. Ericsson developed a sophisticated multimodal journey planner which SL commuters had access to through online smart boards mounted by SL (Løbner & Sølgaard Bang, 2011, pp. 112-115).
The report by Lewakowski, et al., (2010, p. 47), describes a Content Scenario, where an advanced journey planner is developed in 2014. The other scenarios describe a similar integrated source of
HAS
ICT
EUS
Surroundings

-61-
transport information. The different Content Scenarios describe the broad cooperation between representatives of taxi firms, public transport companies, the national transport administration etc., initiated by the Energy Committee of Södermalm (ECS), to manage the large transition in transports (Lewakowski, Sølgaard Bang, & Svane, 2010, p. 19). In one scenario, the TMC is funded by the Swedish Department of Transport and the Stockholm City Council, and developed by public companies. A law is passed that requires the inclusion of public transport information in the TMC, and that TMC should be installed in all cars by 2018 (Lewakowski, Sølgaard Bang, & Svane, 2010, p. 47). For a more detailed description of the different Content Scenarios, please conduct the report by Lewakowski, et al., (2010).
The conclusion that can be drawn from the different Content Scenarios is that ITS can be implemented broadly before 2020. This would require that the many different stakeholders are brought together to cooperate, by a public initiator.
5.3.3 ICT Improved Ride Sharing
Technical Description 5.3.3.1The sharing of car journeys so that more people can travel together is called ride sharing, also called carpooling. Ride sharing saves fuel and reduces hence the energy use. Ride sharing is not itself an ICT solution, ICT can however help to improve ride sharing so that it becomes more common.
There are free smart phone applications currently available on the market, where the driver can offer vacant seats to save money on the journey. A person who wants a ride can access available rides through the application on his smartphone. The available rides are updated in real time and matched through the use of GPS. The person who wants a ride is informed of the price prior to accepting the offer, and the driver receives payment automatically at the end of the trip (Avego, 2012).
Another ICT solution that might improve ride sharing could be a pointing system coordinated on a public website. The drivers who pick up someone who searches for a ride along the way would get points depending on the length and time of the ride. Depending on the number of points, the driver would receive different levels of car tax reductions. The journey would be free of charge for the rider.
Car sharing which is similar to ride sharing is not included as an ICT-solution in this study, since it does not change the fuel use and hence the energy use, if one drives a car owned by oneself, or a rental, or shared, car. There might be a reduction in embodied energy if fewer cars are needed, but embodied energy is not a part of this study and car sharing will hence not be included.
Information Flows 5.3.3.2The information flows present due to the ICT-proved ride sharing are illustrated in Figure 13 below. The rider (part of the HAS) communicates through ICT to the surroundings, that he wants a ride. Information on available rides is retrieved by ICT from the surroundings and

-62-
delivered to the rider. The ICT does not retrieve data from the car (part of the EUS), nor does it steer it.
Figure 13: Information flows between subsystems and surroundings for ICT improved ride sharing.
Implemented How, When and by Whom? 5.3.3.3The report by Lewakowski, et al., (2010) describes a content scenario where a new transportation system consisting of driverless minivans that through dynamic routing can, similarly to ride sharing, address the travel requests of several riders. As described in PART I, paragraph 3.5, it is not likely that a new transportation system is implemented to 2030, and this solution will therefore be discarded.
The Content Scenario by Løbner, et al., (2011, p. 121), does not address ride sharing, but describes a future where the Södermalm car sharing company (SCC), is started based on experiences on car sharing in the city district of Södermalm, as a partnership between Fortum, Bilpoolen AB and SL. Car sharing is part of the second transport package implemented in the years 2020-2023 (Løbner & Sølgaard Bang, 2011, p. 113).
The purpose of this study is not to develop Content Scenarios, but since the Content Scenarios found in previous works within the SitCit project do not adequately enough describe the implementation of ICT improved ride sharing, a short speculation will be presented here.
ICT improved ride sharing through e.g. a smart phone app, is a convenient, safe and relatively mature technology. Further development through funding from e.g. the state or the municipality or the government is not considered necessary. It could be implemented broadly in the very near future. Increasing fuel prices through e.g. taxation would make more people interested in this solution. To reserve some lanes of major traffic routes in Stockholm for vehicles with at least two or three persons i.e. introduce high-occupancy vehicle lanes, would probably be a huge incentive to start ride sharing. ICT improved congestion tax, which will be described in the next paragraph, will also facilitate a broad implementation of ride sharing.
5.3.4 ICT Improved Congestion Tax
Technical Description 5.3.4.1Any ICT-solution that has the potential to reduce traffic congestion through an improvement in the congestion taxation falls under this category. Only one solution will however be described here. Sensors that count the number of people in each vehicle could be installed along the road, e.g. where vehicles enter and exit central Stockholm. The drivers would be charged depending on
HAS
ICT Surroundings

-63-
the number of occupants in the vehicle. The people counter could be based on radio beam or thermal imaging technology and located outside along the road, or even be part of the in-vehicle sensing technology which would inform the congestion tax management system about the current vehicle occupancy.
Extensive research suggests that no technology is currently on the market that can measure vehicle occupancy.
Information Flows 5.3.4.2The relevant information flows for ICT improved congestion taxation are illustrated in Figure 14 below. The information flows are for the above mentioned solution. The specific price depending on the vehicle occupancy is set externally, it is however assumed to be fixed, and is hence not communicated regularly to the ICT system. The sensors retrieve information about the number of occupants (part of the HAS) in each vehicle (part of EUS). The toll is then communicated to the driver (part of HAS).
Figure 14: Information flows between subsystems and surroundings for ICT improved congestion tax.
Implemented How, When and by Whom? 5.3.4.3Løbner, et al., (2011, p. 113) describe a Content Scenario where a re-scheduling of the congestion tax is part of the second transport package implemented between 2020 and 2023. With re-scheduling, a new and increased congestion tax zone is meant (Løbner & Sølgaard Bang, 2011, p. 113). In the Content Scenario, it is an incentive for the people of Södermalm to rent cars from SCC since it is exempted from congestion charging (Løbner & Sølgaard Bang, 2011, p. 132). As described previously, the SCC is not part of this study since it involves car sharing, which would not render savings due to ICT. Re-scheduling of the congestion tax is not an ICT solution either and is therefore discarded.
The idea to install sensors at frequent points along the road, that measure the vehicle occupancy and so that traffic tolls can be assessed accordingly comes from a Content Scenario described in the report by Lewakowski, et al., (2010, p. 22). According to the Content Scenario, the Energy Committee of Södermalm (ECS), comprised of politicians, residents, experts etc., is coordinating the implementation of the new toll system. A partnership between the ECS and the Swedish Transport Administration, which installs the sensors for the toll system, is initiated. The ECS empowers the municipal government which finances, implements and maintain the new toll system. Sensors are installed in 2014 and a follow-up survey is conducted in 2022 (Lewakowski, Sølgaard Bang, & Svane, 2010, pp. 47-49).
HAS
ICT
EUS

-64-
ICT improved congestion tax can through an economic incentive facilitate the broad implementation of ride sharing since the more occupants in each vehicle, the less congestion tax is paid. As described in the earlier section, literature research suggests that there is no technology currently on the market that can measure vehicle occupancy from outside the vehicle. This makes it highly unlikely for the sensors to be installed already in 2014.
5.4 Social Media
Social media is not a specific ICT solution that can alter one aspect of getting to work or the activities that are carried out at home. It is rather interwoven with many different ICT solutions. It is a non-technical solution and the structure of this chapter will therefore be different. Social media implies a comprehensive way to convey messages from individuals, government authorities, companies, organizations etc. to each other. Through social media, the energy use can be influenced by means of information and persuasion. ICT-solutions that have close ties to social media are already mentioned in earlier sections. This chapter will again highlight these ties and illustrate what important role social media has in meeting the main objective of this thesis i.e. to reduce the energy use due to ICT in Södermalm to 2030.
Government authorities can use social media as a tool to increase the energy awareness of people and provide information about ways to save energy. The Swedish Energy Agency e.g. has its own Twitter account where news like a test on the energy use of different appliances, global energy issues, and current renewable energy projects etc. are updated frequently (Energimyndigheten, 2012).
Companies that sell smart energy solutions can also use social media to market their products. Users can e.g. “like” their products on Facebook and recommend it to others.
Social media can also be used as a way for people to share their experiences with energy saving and recommend different measures to others.
Social media can be a favourable platform for companies, which develop solutions that help reduce the energy use, to share progress and get people interested.
Social media can also be used to enhance participation among different interest groups to increase the support for the implementation of a particular ICT solution.
The following examples illustrate the close ties social media has to the other ICT solutions described previously.
Social media has a strong synergy with smart metering. Information on the energy used can be discussed on social networks and people, companies, organizations etc. can compare their energy use and communicate it. Companies could e.g. use social media and smart metering to show the effects of their activities to reduce energy use and environmental impact, corporate social responsibility (CSR), which would render positive public relations (PR).
Social media can be used to faster communicate information about e.g. new ICT-solutions like a unified trip planner, new energy and environmental legislation, a new traffic toll system, the

-65-
actual energy of appliances on standby, which would increase the willingness to implement standby management etc.
Teleworking is facilitated by social media because it can make distant communication more interactive and hence attractive.
5.5 Demand Flexibility ICT
As described in earlier chapters, demand flexibility renders the possibility to shift consumption to reduce peak load, to balance renewable energy, increase base load, and for consumers to benefit from times when energy prices are low. Increasing demand flexibility is a sub-objective of this study since it can contribute to the transition towards urban sustainable development. Information and communication technologies that have the ability to increase the demand flexibility are often interwoven in other ICT solutions presented earlier. They are however presented separately since they generally affect the main objective of this study, the reduction in energy use on Södermalm, to a limited extent. Demand flexibility ICT is also designed simply to change when a service is provided, not how much of it or the type of the service.
Refrigerators and freezers can be controlled so that they store energy temporarily during favourable situations e.g. when the electricity price is low, so that the operation of the compressor is avoided during unfavourable periods e.g. during periods of high demand (Timpe, 2009, p. 12).
For appliances like dishwashers, washing machines tumble dryers and drying cabinets, the user could at times be indifferent to when exactly, during a specific time period, the service is delivered. The user may e.g. set a time when the laundry is to be finished e.g. in the morning, eight hours later, and the washing machine can then be steered into running at the time during the night when e.g. a lot of wind power is fed into the grid that needs to be balanced out.
The heating, ventilation and air conditioning units can be interrupted at specific times to reduce the load. To what extent depends on the preferences for thermal comfort and the thermal properties of the conditioned environment e.g. the thermal mass of a building. It is also possible to store ice, i.e. thermal energy, during certain times e.g. the night when price for energy is low, to cool the buildings during the day (CALMAC, 2011). This is not an ICT solution itself, but ICT can be used to control exactly when, and to what extent ice should be produced. Hot water accumulator tanks integrated with ICT is another solution. In cold climate, hot water could be stored during the day when it is warmer outside and the heating need is less, and be used during night time.
The batteries of electric cars can be used to increase the demand flexibility since energy can be stored and withdrawn in a flexible manner (Løbner & Sølgaard Bang, 2011, pp. 90-91). This is not an ICT solution itself, but ICT can be used steer the charging process and reduce the cost of energy.

-66-
5.5.1 Incentives and Implementation The Content Scenario described by Løbner, et al., (2011, pp. 90-91), describes smart appliances that can automatically respond to changes in generation or load, and electric car batteries which can allow for variable energy like wind to be stored. In the content scenario, these solutions are part of the smart grid concept. There are several different ways that one can categorize and name ICT solutions. This report addresses smart metering and demand flexibility ICT, which can also be seen as part of the smart grid, whereas other important aspects of a smart grid e.g. local harvesting of energy are discarded. Since the demand flexibility ICT solutions only are a little part of the smart grid concept, one cannot conclude when, how and by whom they are implemented from the Content Scenario.
The Content Scenarios in the reports by Lewakowski, et al., (2010), do not describe ICT solutions that increase demand flexibility specifically. They do not even address the issue of demand flexibility.
There is however a report by Timpe (2009), which summarizes the results of the European project “Smart Domestic Appliances in Sustainable Energy Systems”, that answers many questions e.g. what appliances can easily be integrated with ICT to increase the demand flexibility, the magnitude of the possible load shift, different ways to implement the solutions and the incentives etc. This part will be mainly based on the findings presented in the report by Timpe (2009, pp. 44-45).
Every appliance that is connected and set to be controlled by an external load manager through e.g. wireless communication, would give the consumer, the retailer or the manufacturer, a lump sum payment for each purchase. The load manager would shift the operation of the appliance e.g. washing machines and freezers, for shorter periods of time.
Another option for implementation is that the consumer is rewarded for each time he or she allows the load manager to shift the energy use of a specific appliance within some time interval, (see the laundry example presented previously).
If real-time pricing of electricity is used for the households, different appliances could display the current price, and the consumer could e.g. set the appliance in a “ready to start” mode, which implies that the appliance will start as soon as the price drops below a certain level pre-set level. This option requires smart metering of the actual energy use, and it will also affect not only the appliances with integrated ICT for demand flexibility, but the whole electricity consumption of the household (Timpe, 2009, p. 45). Furthermore, the appliances would not be controlled by the load manager as opposed to the previously mentioned options.
The incentives to implement demand flexibility ICT are economic in nature. The consumer gets rewarded for allowing a load manager to shift the energy use, or saves money from running the appliances at times when prices are low, and the load manager can reduce the costs by avoiding the need for expensive peaking power plant.
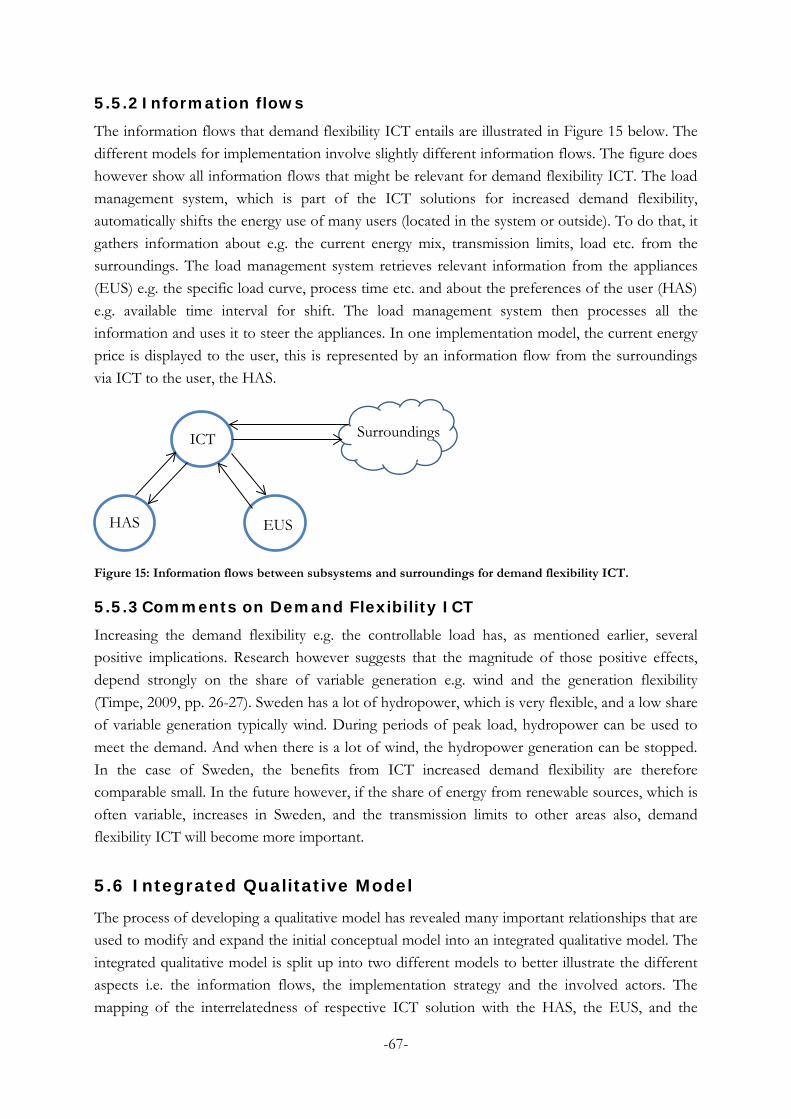
-67-
5.5.2 Information flows The information flows that demand flexibility ICT entails are illustrated in Figure 15 below. The different models for implementation involve slightly different information flows. The figure does however show all information flows that might be relevant for demand flexibility ICT. The load management system, which is part of the ICT solutions for increased demand flexibility, automatically shifts the energy use of many users (located in the system or outside). To do that, it gathers information about e.g. the current energy mix, transmission limits, load etc. from the surroundings. The load management system retrieves relevant information from the appliances (EUS) e.g. the specific load curve, process time etc. and about the preferences of the user (HAS) e.g. available time interval for shift. The load management system then processes all the information and uses it to steer the appliances. In one implementation model, the current energy price is displayed to the user, this is represented by an information flow from the surroundings via ICT to the user, the HAS.
Figure 15: Information flows between subsystems and surroundings for demand flexibility ICT.
5.5.3 Comments on Demand Flexibility ICT Increasing the demand flexibility e.g. the controllable load has, as mentioned earlier, several positive implications. Research however suggests that the magnitude of those positive effects, depend strongly on the share of variable generation e.g. wind and the generation flexibility (Timpe, 2009, pp. 26-27). Sweden has a lot of hydropower, which is very flexible, and a low share of variable generation typically wind. During periods of peak load, hydropower can be used to meet the demand. And when there is a lot of wind, the hydropower generation can be stopped. In the case of Sweden, the benefits from ICT increased demand flexibility are therefore comparable small. In the future however, if the share of energy from renewable sources, which is often variable, increases in Sweden, and the transmission limits to other areas also, demand flexibility ICT will become more important.
5.6 Integrated Qualitative Model
The process of developing a qualitative model has revealed many important relationships that are used to modify and expand the initial conceptual model into an integrated qualitative model. The integrated qualitative model is split up into two different models to better illustrate the different aspects i.e. the information flows, the implementation strategy and the involved actors. The mapping of the interrelatedness of respective ICT solution with the HAS, the EUS, and the
Surroundings
HAS
ICT
EUS

-68-
surroundings is expressed in terms of information flows in Figure 16. Whereas, what implementation strategy that can be used for the different ICT solutions and what actors are involved, are illustrated in Figure 17.
Human and Human Activities 5.6.1.1A feature of HAS, which became apparent when the different relations were examined more in detail, is that many of the information flows to and from the HAS, as illustrated for the different ICT solutions above, are to and from the human, rather than the human activities. Therefore, the HAS was split into human activities and what is denoted “human”. So what is meant by “human”? A lot of the information flow is to and from the person, the individual, the family etc. The activities cannot communicate to e.g. the surroundings through ICT, but people can. The “human” can decide what activities and how much of them should be carried out. Also, the “human” can reflect on decisions and may alter the behaviour. As we will see in subsequent chapters, the “human” plays the central role when modelling the energy usage system of the Södermalm district with a bottom-up approach. The “human” is also the main actor when it comes to the implementation of ICT, and must be involved in the implementation process of all ICT solutions. Furthermore, depending on who is carrying out the activities i.e. the “human”, the demanded services may vary completely.
Additional Comment 5.6.1.2The two integrated qualitative models illustrated below do, as opposed to the conceptual model, not show the different energy flows or what activities demand what services. The reason is that these aspects can be modelled relatively straight forward and that it is not essential for the understanding.
Integrated Qualitative Model of Information Flows 5.6.1.3Figure 16 on page 70 illustrates, with arrows, the information flows that are important for the different ICT solutions. The blue colour represents human activities, ICT solutions and energy usage systems that are apparent in the residential part of multi dwellings. Similarly, the green colour is used for the get to work. Arrows that touch only the border of respective category are valid for all that is within the category. Human, social media, and demand flexibility ICT are given specific colours due to their special role. The main purpose of the figure is to show the interaction of ICT with the different EUS and HAS, and the surroundings. The specific activities within the HAS, and the EUS, are less important. The arrows that point outwards symbolize information flows to the surroundings.
Integrated Qualitative Model of the Implementation Strategy and 5.6.1.4the Actors
The second integrated qualitative model is of which actors are involved and what strategies that can be used in the implementation of ICT in the residential part of multi dwellings, and for getting to work, on Södermalm, see Figure 17 on page 71. Similarly to the figure of the information flows, Figure 17 uses blue and green to separate between actors, implementation

-69-
strategies, and ICT solutions, for the multi dwellings and get to work. Also, if an arrow is only touching the border of a category, it means that the arrow affect the whole category. Social media has no arrows connected to it, since it is not implemented by the actors, relevant here, specifically. The group “other stakeholders” represents all stakeholders that affect the implementation, but are not considered to be very important for any implementation strategy. The “human” is an important actor for all implementation strategies and is not shown in the figure together with the actors in specific implementation strategies.
Time Schedule for Implementation 5.6.1.5Table 1 on page 72 shows an example of during what time period different ICT solutions can be implemented. The coloured bricks in Table 1 represent the main time periods of implementation when different strategies are used. Main time period is when the growth in increased ICT is the highest. Table 1 is based partially on the content scenarios of earlier work within the SitCit project, but for some ICT solutions, the time period is elaborated through looking at how mature the specific ICT solutions is to date and how fast a specific strategy can lead to broad implementation. One has however to keep in mind that elaborating future scenarios implies lot of qualified guessing.

70-
ICT Impr. Cong. Tax
Trans. Inf. Sys. ICT
Impr. Ride Shar.
Tele - working
Standby Mgmt.
Smart Laundry
Smart Kitchen
Smart Metering
Smart Lighting
Intelligent HVAC
Social Media
Demand Flex.
Human
HVAC
Lights
Laundry
Kitchen Appliances
Others
Cars
Others
Get to Work
Relaxing
Cleaning
Ingestion
Entertainment
Others
HAS ICT EUS
Figure 16: Integrated qualitative model of information flows.
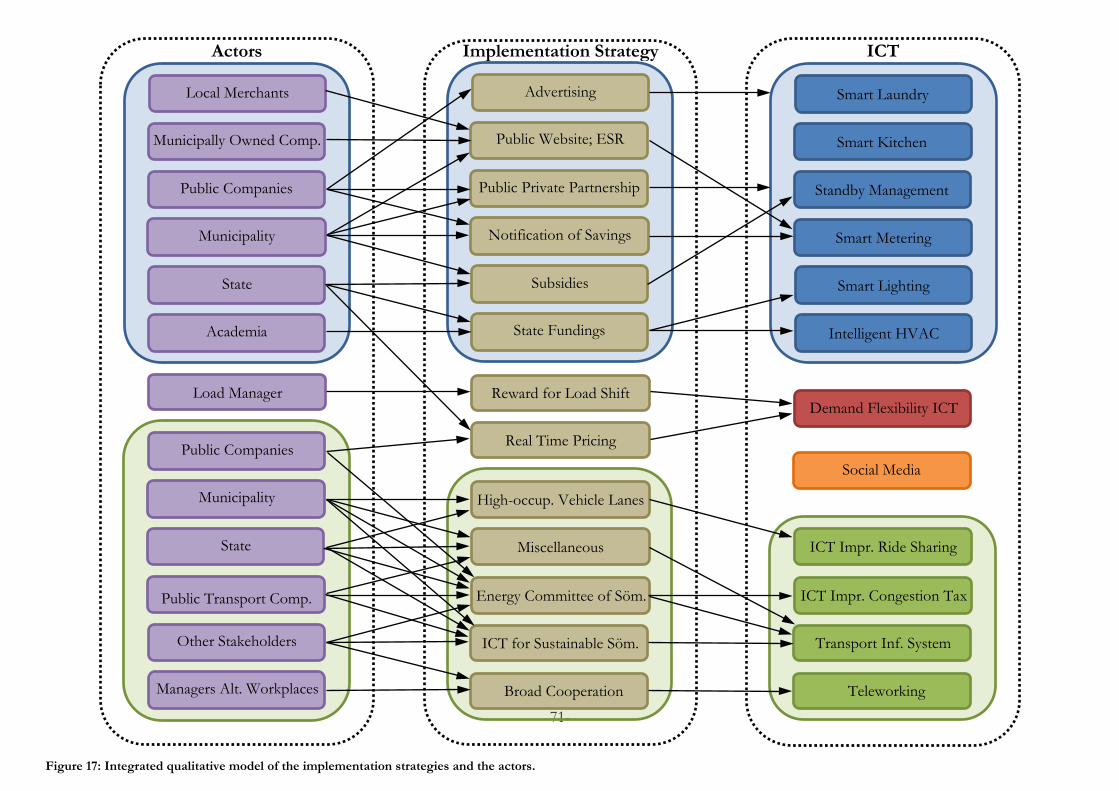
71-
Smart Laundry
Smart Kitchen
Standby Management
Smart Metering
Smart Lighting
Intelligent HVAC
ICT Impr. Congestion Tax
ICT Impr. Ride Sharing
Transport Inf. System
Teleworking
Social Media
Demand Flexibility ICT
Advertising
Public Website; ESR
Public Private Partnership
Notification of Savings
Subsidies
State Fundings
Energy Committee of Söm.
Miscellaneous
ICT for Sustainable Söm.
Broad Cooperation
High-occup. Vehicle Lanes
Real Time Pricing
Reward for Load Shift
Local Merchants
Municipally Owned Comp.
Public Companies
Municipality
State
Academia
Public Companies
Municipality
State
Public Transport Comp.
Other Stakeholders
Managers Alt. Workplaces
Load Manager
Actors Implementation Strategy ICT
Figure 17: Integrated qualitative model of the implementation strategies and the actors.

72-
Table 1: Time schedule of implementation.
ICT Impl. Strat. \ Year 2012 2013 2014 2015 2016 2017 2018 2019 2020 2021 2022 2023 2024 2025 2026 2027 2028 2029 2030 ICT for Multi Dwellings Advertising Public Private Partnership Intelligent HVAC State Fundings Smart Lighting State Fundings Smart Metering Public Website; ESR Notification of Savings Standby Management Subsidies Teleworking Broad Cooperation Transport Inf. System Miscellaneous Energy Committee of Söm. ICT for Sustainable Söm. ICT Impr. Ride Sharing High-occup.Vehicle Lanes ICT Impr. Congestion Tax Energy Committee of Söm. Demand Flexibility ICT Reward for Load Shift Real Time Pricing

73-
Discussion 6
6.1 Practical Modelling Considerations
The following sections will discuss some practical considerations when it comes to modelling the potential impact of ICT.
6.1.1 Spatial and Time Resolution Models of domestic energy demand, often have either a high time resolution, and a low spatial resolution, or a high spatial resolution but a low time resolution (Kall & Widén, 2007).
In the case of this study, both a high spatial and time resolution is crucial in order to be able to model the potential change in energy use due to ICT, of the residential part of multi dwellings and getting to work. The following paragraphs will describe why, and what resolution is chosen.
Time Resolution 6.1.1.1Modelling the effect of different ICT solutions require different time resolutions. Most ICT solutions however require relatively small time steps. An example is smart lighting which turns off the lights when a person leaves the room even for only a couple of minutes e.g. to go to the restroom. Also, each building has a thermal mass that results in transient heating and cooling processes. In order to quantify the effect of demand flexibility ICT, load curves with a high time resolution is needed. The time resolution of the energy use is of especial importance, but may be restricted due to the approach of this study, where the basis is the human activities that demand services which in turn are delivered by different appliances that use energy. A common way to study what activities are carried out and when is to let a group of people keep time diaries and logbooks. There is an upper limit on the time resolution when it comes to the surveyed human activities since people cannot be asked to log their exact activity every minute of the day. Then the activity to keep a time diary and logbook would make up for a considerable share of the total daily activities. This would destroy the purpose of the study and does clearly not make any sense. A recent survey on the living conditions of the people of Sweden uses a 10 minute time resolution, which is regarded feasible for the activity log and at the same time enough to be able to model the effect of most ICT solutions quite accurately (Statistiska Centralbyrån, 2012). Clearly, one could have a different time resolution for the activities and for the energy use, but as we will see in the next section, there is not a clear relationship between the logged activities and the energy use. Therefore, it is highly questionable whether a higher time resolution would give results with higher validity.
Spatial Resolution 6.1.1.2Since the approach in this study is to start with the human activities and thereafter couple them to the actual energy use that they cause, there is a need for a high spatial resolution. The reason is that factors like the level of detail of the activity description, how, when, by whom and in what settings the activities are carried out, and who is responsible for the energy use, are important. The following paragraphs will clarify why.

74-
Asking how the activity is carried out is the same as asking how the appliance is actually used. How the appliance is used, e.g. if lids are used on the pots, if the computer is shut down after use, how long time the refrigerator is open, at what temperature the clothes are washed etc., has a great impact on the energy use. As Karlsson, et al., (2008, p. 16), point out, information on how the appliance is actually used is crucial for a holistic analysis of the electricity use. It is not as simple as saying that an activity demands a specific service which in turn requires a certain amount of energy to be delivered. There are many different ways in which an appliance can be used and hence many ways of how an activity can be carried out. Karlsson, et al., (2008, p. 6), has e.g. identified the following seven electricity consumption patterns:
Individual use:
• One appliances is used by one person once • One appliance is used at different times by one person • Two or more appliances are used at the same time by one person
Collective use:
• One appliance is used once by two or more person once • One appliance is used by two or more persons at different times • Two or more appliances are used at the same time by two or more persons
Both:
• Appliances that have to be on constantly for a function to be working e.g. a fridge and a freezer
This has some practical implications for the modelling. The objective of this PART II is to answer with how much ICT can reduce the energy use, and increase the demand flexibility, in the residential part of multi dwellings and the travel to work in Stockholm’s Södermalm district to 2030. And a quantitative model should be used to answer the objective. One could theoretically model only a person with a representative behaviour, and then extrapolate the impacts to the all of Södermalm. Other approaches could be to model an apartment, an apartment building or all apartment buildings on Södermalm. But due to the fact that appliances can be used also collectively, one can discard the first approach where only a person would be modelled. If appliances are used collectively, who would then be responsible for the energy use due to the appliance, or the implementation of ICT? Modelling the activities that take place in only one apartment has some other implications. An inner city district like Södermalm is so complex and multifaceted, that modelling only one apartment would not be a good representation of the real Södermalm energy system. What would e.g. be a typical apartment, typical residents, and typical activities? If one would base the modelling on a schedule of the activities of residents in a specific apartment, it would have little to do with the potential of the Södermalm district as a whole. The model has therefore to contain a group of several apartments with different types of residents that use different means of transportation to get to work.

75-
A hypothetical family living in an apartment and carrying out a specific set of activities would also not be a good alternative since the figures could be doctored.
The discussion above shows that deducing the use of different appliances from the activities is not straightforward. There are also several reasons to why it is not straightforward.
Some processes are hard to relate to the specific activity. An example is refrigerators and freezers, which always are on, or activities like e.g. reading, that do not say anything specific about how much of a service, in this example light, is used.
If a survey on the living conditions with a logbook and a time diary is used as an input to the quantitative model, how would then the activities be described? There are generally different categories of activities, and the categories can be very detailed e.g. showering, or not detailed at all e.g. self-care. An example of the activity categories for a time study conducted by Statistics Sweden in 1996 can be found on p. 100-110 (Kall & Widén, 2007, pp. 100-110). The level of detail when describing the activity is of great importance in order to be able to determine the corresponding use of services and hence the energy use. The activity cleaning can e.g. be too little detailed since it matters if cleaning involves vacuum cleaning, window cleaning, sweeping, etc. Another example would be the activity food preparation. It can involve several different appliances, or also other activities that are carried out parallel. Activity data may not reveal what specific steps are carried out (Widén, 2008, p. 10).
Furthermore, some appliances like e.g. the television might be hard to link to a specific activity since they are often kept on even when the activity has changed (Palm & Ellegård, 2011, p. 176). It can be difficult to what activities that are carried out parallel and what appliances are used parallel.
Another problem is that there might be a mismatch between when the activity is carried out and when the energy is used. Some activities demand energy when they are carried out e.g. listening to radio, whilst others demand electricity for a period of time after the activity is carried out e.g. washing (Ellegård & Palm, 2011, p. 1923).
The quantitative model could either use already existing data on the time use as input, or a survey could be conducted where one let the participants choose from a specific set of activity descriptions that make sense for the modelling of the impact of different ICT solutions.
In order to get a good picture on what can be done with ICT on Södermalm to 2030, data on several individuals’ specific activities and appliances should be used rather than averages. Their coupling of the human activities to the energy use would otherwise be too weak.
6.1.2 Modelling Different Forms of Energy As described in section 3.4.6 on page 40, the potential energy reduction on the primary energy side, that eventuate from the broad implementation of ICT solutions will be assessed through multiplying the change in final energy use with a primary energy factor, which depends on the energy form. As described in previous sections, the link between the human activities and the energy use is not straightforward. There is a need for a coupling of the activities of e.g. a group of

76-
people to their actual energy use. The approach that is considered the most feasible is either to use time diaries and logbooks together with assessments on the actual use of different energy forms, or to conduct measurements and surveys oneself. The main energy forms used in the residential part of multi dwellings and to get to work, in Stockholm’s Södermalm district, are the following:
For households:
• Electricity (household appliances and heating) • Hot Water (heating and tap) • Gas (cooking and heating)
For transportation:
• Gasoline (road vehicles) • Diesel (road vehicles) • Biofuels (road vehicles) • Electricity (rail and road vehicles)
6.1.3 Importance of Housing Tenure and Contract Design The housing tenure and contract design are of great importance when it comes to who are the actors and what are their incentives.
The main form of housing tenure on Stockholm’s Södermalm district is housing cooperatives and rental housing (Stockholms stad, 2012b, p. 40). In a housing cooperative, the residents typically own the right to inhabit their apartment and the right can be bought and sold. In housing cooperatives and rental housing in general, each resident get charged for the use of electricity, but the hot and cold tap water, and the heating, are in most cases included in the fee in housing cooperatives and in the rent in rental housing. That a lot of energy is not measured for each individual apartment and the cost calculated for each resident, has some practical implications when it comes to the implementation of ICT. A resident will have no economic incentives for e.g. implementing intelligent HVAC or smart laundry, which reduce the use of heating and hot water, if he or she does not get a lower fee/rent.
6.1.4 Similarity between EUS and ICT An aspect that became apparent when the information flows were investigated was that ICT and the EUS are not easily distinguishable. Many ICT solutions are integrated in the EUS itself. Examples are smart kitchen and smart laundry, where sensors retrieve information that can be used by a build in processor to steer the appliance into working in a more energy efficient manner. So what is then ICT, and what is the EUS? In this study, only the part that consumes energy to deliver a service, was seen as an EUS, whilst e.g. the sensors that sense different parameters of the EUS, are seen as part of the ICT solution, as well as steering system itself. Defining an EUS by saying that it is something that uses energy to deliver a service is not precise enough. Consider the same example as before i.e. the smart kitchen. The ICT solution itself

77-
requires electricity to process data and steer the EUS, at the same time, it improves the service through e.g. a constant cooking temperature. The ICT does in other words use energy to improve/deliver a service, just as an EUS. When one is modelling the ICT solution and the EUS, it can be difficult to determine whether or not the potential saving is due to ICT or due to an improvement in the EUS. In this study, the two were separated through asking if the service that is delivered is the main service of the appliance or not. For modern stove with integrated ICT, only the main service heating of food using electricity is seen as the EUS, while all sensing techniques and systems that steer and control the temperature through electric signals, are part of ICT. This means that all modern stoves contain some degree of ICT.
6.2 Human Energy Behaviour
6.2.1 Perceived and Real Energy Use and What Drives Energy Use When modelling the decision making of the inhabitants of Södermalm, one has to bear in mind that their choice will depend on their level of energy awareness. Research suggests that people largely underestimate the energy use of their appliances, and the energy effect of high-energy activities that can drastically reduce the energy use e.g. changing the washer’s setting, see Figure 18 (Attari, DeKay, Davidson, & Bruine de Bruin, 2010).
Figure 18: Mean perceptions of energy used or saved for 15 devices and activities. Source: (Attari, DeKay, Davidson, & Bruine de Bruin, 2010, p. 16056)
If people perceive that the energy use is considerable lower than what it actually is, or the effect of an ICT solution in terms of reduced energy use, the rational choice might be to refrain from implementation. Increasing the energy awareness through ICT, will lead to a higher perceived energy use i.e. the perceived energy use will become more aligned with the actual energy use, which likely will reduce the energy use. At the same time, the increased awareness will increase the incentives to implement ICT solutions to a higher degree. In other word, the positive effect of increasing energy awareness will come from to different sources. Figure 18 suggests a considerable mismatch between perceived and actual energy used or saved. The survey behind

78-
the study was however performed in 2009 in metropolitan areas in the US. The inhabitants of Södermalm might on average have stronger proenvironmental attitudes which would imply more accurate perceptions according to the study by Attari, et al., (2010).
6.2.2 Modelling Human Behavioural Changes, Complexity of Feedback and Indirect Effects
The main challenge of a quantitative model will be the modelling of the human behaviour, and how it might change due to ICT. The following the paragraphs will discuss the challenges when it comes to modelling the “human” in the integrated qualitative model i.e. what central roles the people of Södermalm have for the energy use and regarding the implementation of ICT.
The decisions of individuals are based on a lot of important aspects that somehow should be incorporated in the model if the potential reduction of energy use should be simulated. Amongst the most central ones is how the people of Södermalm value the perceived value of comfort versus the value of a reduction in energy use i.e. reduced energy cost and environmental impact. Others include how much the energy awareness can be increased with the help of ICT, and what consequences it has in terms of energy use. Another interesting aspect that could be incorporated in the model would be the price sensitivity i.e. how much the energy use changes depending on the price. In that way one could examine how real-time pricing i.e. a faster feedback on the actual cost, would impact the energy use e.g. at times when the price of energy is high.
Another aspect one has to take into consideration is that one might have to model not just the direct effect, but also the indirect effects of the proposed changes. An example could be that the direct effect of ICT improved congestion tax and ICT improved ride sharing is a reduction in fuel use because more people share a ride in order to reduce costs. The indirect effect would be a continuing reduction, because fewer rides means less traffic congestions, further decreasing the energy use. Other people that are not using their cars because of too severe congestions in rush hours might change their mind when traffic reduces and start to take their cars. This is an indirect effect that might offset the direct benefits. There are several other cases where if the people of Södermalm change their behaviour, that people outside of Södermalm would adapt to the new situation and change their behaviour accordingly. An example is if everyone installs intelligent HVAC, that heats up the apartment before people come home from their jobs at say 6 pm. This would potentially increase the peak load significantly just before because a pickup load i.e. additional heat to raise the temperature, would be required (Jonsson & Bohdanowicz, 2010, p. 74).
6.3 Ethical Consideration
In this cross-disciplinary research project within the frame of SitCit, there are some ethical aspects that must be discussed and addressed. These ethical aspects are associated with the research method, and the implementation of ICT.

79-
The following discussion is based mainly on the principles of research ethics within humanities and social sciences, issued by the Swedish Research Council (Vetenskapsrådet, 2002).
There are two main principles, the research requirement and the individual protection requirement that must be weighed against each other (Vetenskapsrådet, 2002, p. 5). The research requirement means that the society has a legitimate claim that high-quality research is undertaken in important areas (Vetenskapsrådet, 2002, p. 5). The individual protection requirement can be divided into four main requirements, each of which will be discussed below.
The information requirement means that the researcher shall inform people who participate in a study of what is the purpose of study i.e. what their role is and what the conditions for participation are (Vetenskapsrådet, 2002, p. 7). For the proposed research method, i.e. to gather information on the activities that are carried out by a group of individuals and their energy use, through time diaries, log books, and measurements, the participants have to be informed about what information is gathered and what the findings are used for. This is true both if the information would be gathered through own empirical study, or if the information is retrieved from other sources e.g. the Swedish Energy Agency. When it comes to the implementation of ICT, it can be noted that the people of Södermalm must be informed if data on their behaviour, energy use, energy costs etc., is retrieved and what the purpose is. This is especially important in the case of some implementation strategies for intelligent HVAC, smart lighting and smart metering where energy use and costs would be displayed on a public website.
The consent requirement means that the researcher must ask the participants of a study for their consent. The participants i.e. the respondents or people, whose information is gathered, have the right to decide whether they want to participate or not (Vetenskapsrådet, 2002, p. 9). This research requirement is not considered problematic when it comes to the research method in this study since the nature of the method would imply that people can decide about participation themselves. When it comes to the implementation on the other hand, one should ask for consent e.g. to scan and register the number of passengers in each car in the case of ICT improved congestion tax, or when an implementation strategy involves retrieving information on the energy use and costs, processes and display it.
The confidentiality requirement means that information about the participants in a study should be handled confidential (Vetenskapsrådet, 2002, p. 12). One has to safeguard the personal integrity and not let any unauthorized person view the information. This is especially important for ethically sensitive information. When it comes to the research approach of using time-use data, one should anonymise the participants. Even if the information-and consent requirements are satisfied, the personal information that is publically displayed in some ICT implementation strategies should still be anonymous to protect the privacy of the participants.
The usage requirement stipulates that information about individuals only is to be used for research purposes (Vetenskapsrådet, 2002, p. 14). For the research method, this implies that one has to make sure that the obligations to the participants of a research project conducted by an external source are met. If the gathering of time-use data is conducted oneself, one has to make sure that

80-
this information is not used for any other purposes (e.g. commercial) than for the research. The usage requirement is not relevant when information is gathered for purely commercial reasons in some implementation strategies, as long as the information-and consent requirements are satisfied.
6.4 Methodological Critique
The research question and method are connected in basically two different ways. In one way, which is the most common, the research question is first asked, and the method is chosen accordingly i.e. seeing the researcher as a problem solver. The other way is method driven i.e. the research is based on a method that is e.g. developed within a research group and the research question is then driven by the method (The Swedish Research Council, 2011, p. 41). The purpose of this study is to contribute to the SitCit project through quantifying the potential outcome of earlier developed scenarios that were based on the Södermalm Seed. Therefore, the SitCit methodology had to be used i.e. the potential future impacts in terms of energy use, due to ICT on Södermalm, had to be modelled using a bottom-up approach. The research question and the methodology were with other words quite restricted on beforehand. One can ask if modelling the potential impacts is a suitable method to come up with figures of how much the energy use can change if ICT was implemented.
A literature survey suggests that case studies are the predominant method for examining the impacts of ICT on energy use. A case study studies a defined group e.g. an individual a group of individuals or an organization (Patel & Davidson, 2003, pp. 54-55). They are characterized by a holistic view and a huge number of variables. Furthermore, case studies do often study a process of change, they span over a considerable time frame. Case studies can give insight into earlier unknown or uncertain relationships of variables (Olsson & Sörensen, 2001, p. 85).
One could argue that data and discovered relationships in earlier case studies could be used in the modelling process. This is however not so simple since the case studies in the literature generally do not examine the specific relationships between the vast number of variables, but rather show results in terms of changed energy use and some major changes in behaviour. They are more qualitative and describe briefly what was noticed, rather than more in depth or quantitatively, i.e. what variables affect each other in what way. Also, one must discuss the generalizability of the results i.e. if they can be applied on Södermalm and the future, at all.
The main reason to why case studies are the predominant research method may be because it is a method that can handle a vast number of unknown and uncertain variables and relationships. The source of most variables is that ICT influences the human behaviour by means of information and communication. How humans behave and why is not easily modelled. There are so many important aspects to take into consideration and many aspects can even be unknown to the modeller and only be visible during an actual experience or case study, or not even then.
Furthermore, the quantitative model with a bottom-up approach requires empirical information on the human activities. As discussed earlier, this information can be gathered through time diaries and logbooks internally or from an external source. The quality of this time use data is

81-
however far from guaranteed. Individuals need to be willing to contribute with information and one has to take into account the varying ability of individuals’s to express themselves. Also, the clarity of the instructions must be determined. Another problem that arises from this data collection method is that people can exaggerate or not be truthful at all (Patel & Davidson, 2003, pp. 66-68).
The conclusion from the above discussion is that the methodology used in this study and proposed by SitCit, is not suitable since modelling the potential future impacts of ICT involves a vast number of variables whose relationships are unknown and uncertain - typically present when the human behaviour is investigated. The methodology is probably more suitable for modelling of mainly technical changes e.g. in the Rinkeby-Kista Seed where modelling a change in the building envelope and the appliances was the main focus.
Also, as discussed in previous sections, it is difficult to determine the contribution of ICT in the changes. The reason was that ICT is very similar to and often integrated in the EUS. It might not be useful to try to study only the potential impacts of ICT on the energy use.
6.5 No Quantitative Model
Opposite to what was the aim of this study, there will be no quantitative model that provides numerical figures on how information and communication technology can change the energy use on Södermalm. The objectives of this study can hence not be met. The reasons will be described in the following paragraphs.
The main reason is the lack of time. This study is a master’s thesis by two people, which should be equivalent to two times 30 ECTS and take around 20 weeks. A lot of effort, and more time than intended has been put into this study already. This suggests that developing and testing a quantitative model would take around an additional 20 weeks of fulltime for two students, something that is unreasonable.
The lack of time on the other hand is attributable to several reasons. One can be improper and insufficient planning. The main reasons are however that the preliminary work was inadequate and that the assignment was far more extensive and demanding than expected.
This study should have been based on earlier qualitative research presented in the reports written by Løbner, et al., (2011) and Lewakowski, et al., (2010). The qualitative studies and explored scenarios should have answered What to change, Who should take action and How planning and implementation are accomplished. The earlier works were however not very detailed and the ideas were not presented in a consistent way. Most of the relevant ICT solutions were not addressed at all and some solutions that were presented did have little to do with ICT. Since the basis was insufficient, a lot of time and effort had to be put into answering the questions above.
That the assignment was far more extensive and demanding than expected has to do with the feature of ICT solutions that they are integrated to a high degree. Furthermore, ICT has to do

82-
with changing the human behaviour by means of information and persuasion. Therefore the potential change in human behavior has to be modeled, and that adds a lot of complexity.
A test model of the impact of the automation part of intelligent HVAC, in one apartment, during one day, was modelled with STELLA. Even though this was only a very small portion of what had to be done, it still took a lot of time and effort.

83-
Conclusions 7The following paragraphs will describe the main findings from this study.
A potent way of defining an energy usage system is by asking the following two questions:
Does it matter in relation to how much ICT can reduce the energy use in Stockholm’s Södermalm district to 2060?
Can the actors of the energy system of Stockholm’s Södermalm district do anything about it?
Where, the actors and the system boundary of the human activities are defined in the following way:
Actors of the system have the ability to influence the human activities or the implementation of ICT in the Södermalm district.
The system boundary for the human activities is the geographical boundary of Stockholm’s Södermalm district.
That ICT solutions tend to integrate over system boundaries and effect different systems in different ways was identified and a method to model only the impact from ICT solutions was developed. The conclusion that can be drawn is that potential ICT savings can be modelled by seeing the EUS as static and incorporating all possible ICT solutions even if they can potentially have negative effects on the energy use. This is also the only way to go if one wants to be able to integrate and synchronize the models that look at different parts of the energy system. Treating the EUS and ICT differently i.e. static and dynamic, does however add complexity since they are hard to separate because of their similarity. They both use energy to provide services and they are highly integrated.
Furthermore, the ICT solutions relevant to the residential part of multi dwellings and to get to work, in the Stockholm’s Södermalm district, were identified, categorized and their relationships elaborated. These ICT solutions are:
ICT solutions for multi dwellings:
• Intelligent HVAC • Smart Lighting • Smart Metering • Smart Kitchen • Smart Laundry • Standby Management
ICT solutions for get to work:
• Teleworking • Transport Information System • ICT Improved Ride Sharing • ICT Improved Congestion Tax

84-
Others:
• Social Media • Demand Flexibility ICT
Also, weaknesses in the bottom-up approach with setting up a human activity system that demands services from an energy usage system were found. With ICT, the behaviour of a person, an individual, that causes the energy use can be altered by means of information and persuasion. The person can change its behaviour i.e. the activities that are carried out. The person can also be an actor that opposes the implementation of ICT, and can use ICT to communicate with others. Therefore, a subsystem that represents the person that carries out the activities in the HAS, has to be included in the model.
The work lead to an integrated qualitative model of information flows, an integrated qualitative model of the implementation strategy and the actors, and a time schedule for implementation.
Actual measurements on the energy use of different appliances are necessary because it is difficult to couple the HAS to the energy use of the EUS, another finding of this study. And the most suitable method to gather data needed as input for a quantitative model is to use time diaries, logbooks, and actual measurements of the energy use of different appliances for a group of people living in several apartments. A high spatial and time resolution is important but it is limited by the feasible resolution of time-use data.
The research question and the methodology were quite restricted on beforehand, and the methodology might unfortunately not be suitable for modelling the impact of ICT because of the vast number of unknown and uncertain variables that comes from that the human behaviour is central.
This study did not lead to numerical figures on the potential change in energy use due to ICT due to lack of time. This was mainly due to inadequate preliminary work, and that the assignment was far more extensive and demanding than expected, but improper and insufficient planning may also be a reason.

85-
Future Studies 8In order to answer the research question of this study, one could use the findings from this report to build a quantitative model. The groundwork is done.
The other possibility is to implement the ICT solutions presented here in a limited area on Södermalm and use the results from the case study to explore the potential benefits from an ICT integrated future energy system. The strategy and time schedule for implementation from this report can thereafter be used to as a guide to implement the ICT solutions that were found to be the most promising.
86-
References UNPD. (2008). World Population Prospects: The 2008 Revision and World Urbanization Prospects: The2009 Revision. Retrieved March 06, 2012, from http://esa.un.org/wup2009/unup/
Zimmermann, J. P. (2009). End-use Metering Campaign in 400 Households in Sweden - Assessment of the Potential Electricity Savings. Energimyndigheten - Swedish Energy Agency.
Vetenskapsrådet. (2002). Forskningsetiska principer. Stockholm, Sweden.
Wiener, N. (1961). Cybernetics or control and communication in the animal and the machine.
Widén, J. (2008). Modellering av lastkurvor för hushållsel utifrån tidsanvändningsdata. Elforsk.
Australian Telework Advisory. (2006). Telework for Australian Employees and Businesses: Maximizing the Economic and Social Benefits of Flexible Working Practices. The Australian Government.
Avego. (2012). Avego Real-time Ridesharing. Retrieved June 15, 2012, from http://www.avego.com/products/real-time-ridesharing/
Arnfalk, P. (2002). Virtual Mobility and Pollution Prevention - The Emerging Role of ICT Based Communication in Organisations and its impact on Travel. Lund University.
Attari, S. Z., DeKay, M. L., Davidson, C. I., & Bruine de Bruin, W. (2010). Public perceptions of energy consumption and savings. 107 (37) , 16054-16059. Proceedings of National Academy of Sciences of the United States of America.
Bye Bye Standby. (2012). Bye Bye Standby Home Energy-Saving Product Range. Retrieved May 20, 2012, from Bye Bye Standby Home Energy-Saving Solutions: http://www.byebyestandby.com/products.php
Blodgett, J., & Parker, L. (2010). Greenhouse Gas Emission Drivers: Population, Economic Development and Growth, and Energy Use. Congressional Research Service.
C3 Energy. (2012). C3. Retrieved May 2012, 7, from http://www.c3energy.com/residential_overview
CALMAC. (2011). Thermal Energy Storage - ICEBANK Off Peak Hybrid Cooling - Product Information. Retrieved September 04, 2012, from http://www.calmac.com/products/icebank.asp
Carlsson-Kanayama, A., Eriksson, B., & Henriksson, G. (2001). Stakeholders and consumption in the five cities. Swedish National Report - Stockholm . Forskningsgruppen för Miljöstrategiska Studier.
Churchman, C. W. (1968). The Systems Approach. Delacorte Press.
ECF. (2010). Roadmap 2050 - a Practical Guide to a Prosperous, Low-carbon Europe. European Climate Foundation.
EEA. (2010). Tracking progress towards Kyoto and 2020 targets in Europe.
Ellegård, K., & Palm, J. (2011). Visualizing energy consumption activities as a tool for making everyday life more sustainable. 88 , 1920-1926. Applied Energy.

87-
Energimyndigheten. (2012). @Energi_mynd. Retrieved September 03, 2012
Energimyndigheten. (2009). Mätning av kall-och varmvattenanvändning i 44 hushåll.
Erdmann, L., & Hilty, L. M. (2010). Scenario Analysis - Exploring the Macroeconomic Impacts of Information and Communication Technologies on Greenhouse Gas Emissions. 14 (5) . Yale University.
Fortum. (2012, April 11). Värmeproduktion i Hammarby. Retrieved May 08, 2012, from http://www.fortum.com/countries/se/om-fortum/energi-och-produktion/varmeproduktion-och-kraftvarme/varmeproduktion/hammarbyverket/pages/default.aspx
Gustafsson, L., Lanshammar, H., & Sandblad, B. (1982). System och modell: en introduktion till systemanalysen. Studentlitt.
Gårding, L. (1984). Modeller och verklighet. (4) , 7-10. Nämnaren.
GeSI. (2008). SMART 2020: Enabling the low carbon economy in the information age. Creative Commons.
Grant, W. E., Pedersen, E. K., & Marín, S. L. (1997). Ecology & Natural Resource Management - Systems Analysis and Simulation. John Wiley & Sons, Inc.
IEA. (2008). World Energy Outlook 2008. International Energy Agency.
IEA. (2011). CO2 Emissions from Fuel Combustion.
IPCC. (2007a). Climate Change 2007 - Mitigation of Climate Change.
IPCC. (2007b). Climate Change 2007 - The Physical Science Basis.
Haraldsson, H. V. (2004). Introduction to System Thinking and Causal Loop Diagrams. 1 . Department of Chemical Engineering, Lund University.
Jonsson, D. K., Gustafsson, S., Wangel, J., Höjer, M., Lundqvist, P., & Svane, Ö. (2011). Energy at your service: highlighting energy usage systems in the context of energy efficiency analysis. Energy Efficiency.
Jonsson, H., & Bohdanowicz, P. (2010). Sustainable Energy Utilisation. Stockholm, Sweden: Royal Institute of Technology.
Kauffman, Jr, D. L. (1980). Systems 1 - An Introduction to Systems Thinking. Future Systems/T L H Associates.
Kall, A.-S., & Widén, J. (2007). Det stora i det lilla och det lilla i det stora - Politik och teknik i omställningen av energisystemet.
Karlsson, K., & Widén, J. (2008). Hushållens Elanvändningsmönster Identifierade i Vardagens Aktiviteter.
Kliatsko, A., Lundqvist, P., & Arias, J. (2012). A Systematic Approach to modelling of energy usage by Human Activity System (HAS) and Energy Usage Systems (EUS).
Kotas, T. J. (1995). The Exergy method for Thermal Plant Analysis. Krieger Pub.

88-
Kramers, A., & Svane, Ö. (2011). ICT applications for energy efficiency in buildings. KTH Centre of Sustainable Communications.
Lundqvist, P. (2012). Energisystem och modeller 1.0. Kungliga Tekniska Högskolan.
Løbner, K., & Sølgaard Bang, M. (2011). Sustianable Socio-technical Transition - A Scenario for ICT as a Situation of Opportunity in Södermalm 2030. Aalborg University - Sustainable Planning.
Lewakowski, B., Sølgaard Bang, M., & Svane, Ö. (2010). ICT as Motor of Transition. Stockholm: Environmental strategies research - fms, Department of Urban studies, Royal Institute och Technology.
Naturvårdsverket. (2012). Underlag till en svensk färdplan för ett Sverige utan klimatutsläpp 2050.
Neves, L. M., Martins, A. G., Antunes, C. H., & Dias, L. C. (2004). Using SSM to rethink the analysis of energy efficiency initiatives. 55 , 968-975. Journal of the Operational Research Society.
Nest Labs. (2012, May 08). Nest - The Learning Thermostat - Home. Retrieved May 08, 2012, from www.nest.com
NFC Forum. (2012). About NFC. Retrieved June 12, 2012, from NFC Forum: http://www.nfc-forum.org/aboutnfc/
Mallon, K., Johnston, G., Burton, D., & Cavanagh, J. (2007). Towards a High-Bandwidth, Low-Carbon Future - Telecommunications-based Opportunities to Reduce Greenhouse Gas Emissions. Climate Risk.
Miele. (2012, August 27). Diskmaskiner. Retrieved August 27, 2012, from Miele Sverige hushållsprodukter I kvalitet - funktion - design: http://www.miele.se/se/hushall/Produkter/4807_44302.htm#p44296
Olsson, H., & Sörensen, S. (2001). Forskningsprocessen - Kvalitativa och kvantitativa perspektiv. Stockholm, Sweden: Liber AB.
Palm, J., & Ellegård, K. (2011). Visualizing energy consumption activities as a tool for developing effective policy. 35 , 171-179. International Journal of Consumer Studies.
Patel, R., & Davidson, B. (2003). Forskningsmetodikens grunder. Studentlitteratur.
Pizer, W. A. (2005). the case for intensity targets. 5 (4) , 455-462. Climate Policy.
Svane, Ö. (2008). Situations of Opportunity in the Growth and Change of three Stockholm City Districts - everyday life, built environment and transport explored as Energy Usage Systems and Actor's Networks. Research Program .
Svane, Ö., Gustafsson, S., Wangel, J., Jonsson, D., Höjer, M., Lundqvist, P., et al. (2009). Situations of Opportunity in City Transformation - enriching evaluative case study methodology with scenarios and backcasting, exploring the sustianable development of three Stockholm City districts. Changing Housing Markets: Integration and Segmentation contact . Prague, Czech Republic 28 June - 1 July: European Network for Housing Research (ENHR).

89-
Svane, Ö., Lundqvist, P., Wangel, J., & Kliatsko, A. (2012). Negotiated Outcomes - Actor-oriented Modelling of Energy Efficiency in a Stockholm City District Renewal. International Environmental Modelling and Software Society (iEMSs).
SWENTEC. (2012, May 08). Hammarbyverket kraftvärmeverk i Stockholm. Retrieved May 08, 2012, from http://swentec.se/Pages/CleantechCompany.aspx?id=8276+
Siemens. (2011). Induktionshällar. Retrieved June 5, 2012, from http://www.youtube.com/watch?v=kuuhitoC8iA&list=UUtw8g1j0nUSKlelns2M2Gjw&index=25&feature=plcp
Siemens. (2012, May 21). Our Products - Laundry - Washing mashines - List. Retrieved May 21, 2012, from http://www.siemens-home.co.uk/our-products/laundry/washing-machines.html
Statistiska Centralbyrån. (2012). Nu för tiden - En undersökning om svenska folkets tidsanvändning år 2010/2011.
Sterman, J. D. (1991). A Skeptic's Guide to Computer Models.
Stockholms stad. (2011). Karta. Retrieved March 1, 2012, from http://www.stockholm.se/-/Karta/#centerposition=6579208%2C1626182&zoom=1
Stockholms stad. (2012a, February 20). om stadsdelsområdet. Retrieved March 1, 2012
Stockholms stad. (2010). Promenadstaden - Överskitsplan för Stockholm. Stadsbyggnadskontoret.
Stockholms stad. (2012b). Statistisk årsbok för Stockholm 2012. Stockholm: Stadsledningskontoret.
REEB. (2010). D2.2 ICT-based Energy efficiency in Construction - Best Practices Guide.
REEB. (2009). D4.1 Vision for ICT supported Energy Efficienct in Construction.
Regerinskansliet. (2009). A sustainable energy and climate policy for the environment, competitiveness and long-term stability.
Rohracher, H. (2002). Smart Homes and Energy Efficiency Constructive Technology Assessment of ICT USe in Sustainable Buildings. Proceedings Paper.
Timpe, C. (2009). Smart Domestic Appliances Supporting the System Integration of Renewable Energy.
The Swedish Research Council. (2011). Good Research Practise. Stockholm, Sweden.
Trafikverket. (2010, December 13). ITS along the Road. Retrieved June 4, 2012, from http://www.trafikverket.se/Om-Trafikverket/Andra-sprak/English-Engelska/ITS---Intelligent-Transport-Systems-and-Services/ITS-along-the-Road/
Trafikverket. (2012, March 29). TMC - Traffic Message Channel. Retrieved June 3, 2012, from http://www.trafikverket.se/Privat/Resan-och-trafiken/Teknik-i-vagtrafiken/TMC---Traffic-Message-Channel/
Trafiken.nu. (2012, June 5). Reseplanerare för Stockholms Län. Retrieved June 5, 2012, from http://reseplanerare.trafiken.nu/bin/query.exe/sn?